Dietary Patterns and Physical Activity Correlate With Total Cholesterol Independently of Lipid-Lowering Drugs and Antiretroviral Therapy in Aging ...
←
→
Page content transcription
If your browser does not render page correctly, please read the page content below
Open Forum Infectious Diseases
    MAJOR ARTICLE

Dietary Patterns and Physical Activity Correlate With
Total Cholesterol Independently of Lipid-Lowering Drugs
and Antiretroviral Therapy in Aging People Living With
Human Immunodeficiency Virus
Alex Marzel,1,2 Roger D. Kouyos,1,2 Sara Reinschmidt,1 Katharina Balzer,1 Fabienne Garon,1 Monica Spitaleri,1 Nicolas Matthes,3 Paolo Suter,4
Rainer Weber,1 Cornelia Staehelin,5 Thanh Doco Lecompte,3 Philip Tarr,6 Helen Kovari1; and the Swiss HIV Cohort Study
1
 Division of Infectious Diseases and Hospital Epidemiology, University Hospital Zurich, Switzerland; 2Institute of Medical Virology, University of Zurich, Switzerland; 3Division of Infectious Diseases,
University Hospital Geneva, University of Geneva, Switzerland; 4Clinic for Internal Medicine, University of Zurich, Switzerland; 5Division of Infectious Diseases, University Hospital Berne, University
of Berne, Switzerland; 6University Department of Medicine and Division of Infectious Diseases and Hospital Epidemiology, Kantonsspital Baselland, University of Basel, Bruderholz, Switzerland

   Background. Hypercholesterolemia is a well established risk factor for coronary heart disease and is highly prevalent among
human immunodeficiency virus (HIV)-positive persons. Antiretroviral therapy (ART) can both directly modify total cholesterol
and have drug-drug interactions with statins. This makes investigating modifiable behavioral predictors of total cholesterol a perti-
nent task.
   Methods. To explore the association between diet and physical activity with cross-sectionally measured total cholesterol, we
administered a validated Food-Frequency-Questionnaire to participants of the Swiss HIV Cohort Study ≥45 years old. Linear
mixed-effects models were applied to explore the associations between dietary patterns and physical activity with total cholesterol,
after adjustment for clinical and demographic covariates.
   Results. In total, 395 patients were included. Forty percent (158 of 395) had elevated total cholesterol (>5.2 mmol/L), and 41%
(164 of 395) were not regularly physically active. In multivariable analysis, 2 factors were positively associated with total cholesterol;
female sex (β = 0.562; 95% confidence interval [CI], 0.229–0.896) and the combined consumption of meat, refined/milled grains,
carbonated beverages, and coffee (β = 0.243; 95% CI, 0.047–0.439). On the other hand, regular physical activity (β = −0.381; 95%
CI, −0.626 to −0.136), lipid-lowering drugs (β = −0.443; 95% CI −0.691 to −0.196), ART containing tenofovir (β = −0.336; 95% CI
−0.554 to −0.118), and black ethnicity (β = −0.967; 95% CI −1.524 to −0.410) exhibited a negative association.
   Conclusions. We found independent associations between certain dietary patterns and physical activity with total cholesterol.
Increasing physical activity might achieve cardiovascular and other health benefits in HIV-positive individuals. The clinical rele-
vance of the identified dietary patterns requires further investigation in prospective cohort studies and randomized controlled trials.
   Keywords. aging; diet; HIV; physical activity; total cholesterol.

Although life expectancy in human immunodeficiency virus                                                cholesterol is a strong risk factor for CHD in the general pop-
(HIV)-positive people on antiretroviral therapy (ART) has                                               ulation, with 1-mmol/L increase in total cholesterol associated
improved worldwide in recent years, it remains shorter in com-                                          with 20% higher risk of CHD in women and 24% in men [3].
parison with the general population [1].                                                                   Both HIV infection per se and its treatment may be asso-
  Total cholesterol is a well established and low-cost marker                                           ciated with high total cholesterol [4]. Certain ART agents are
of coronary heart disease (CHD), even across cultures [2].                                              associated with a range of metabolic abnormalities—including
A recent systematic review and meta-analysis showed that total                                          HIV lipodystrophy, dyslipidemia, diabetes mellitus, and insulin
                                                                                                        resistance [5]—and contribute to the elevated risk of cardiovas-
                                                                                                        cular disease (CVD) [6]. In addition, individuals who are HIV
   Received 5 January 2018; editorial decision 12 March 2018; accepted 23 March 2018.                   positive generally tend to have a higher rate of traditional risk
   Correspondence: A. Marzel, PhD, Division of Infectious Diseases and Hospital Epidemiology,           factors for CVD such as smoking and hyperlipidemia [7].
University Hospital Zurich, University of Zurich, Rämistrasse 100, CH-8091 Zürich, Switzerland
(alex.marzel@usz.ch).                                                                                      Although statins can significantly reduce total choles-
Open Forum Infectious Diseases®                                                                         terol, their use might present a challenge for HIV-positive
© The Author(s) 2018. Published by Oxford University Press on behalf of Infectious Diseases             patients due to drug-drug interactions with ART [8] and in
Society of America. This is an Open Access article distributed under the terms of the Creative
Commons Attribution-NonCommercial-NoDerivs licence (http://creativecommons.org/licenses/                light of the main treatment goal to achieve viral suppres-
by-nc-nd/4.0/), which permits non-commercial reproduction and distribution of the work, in any          sion, which often requires change of regimen. Moreover,
medium, provided the original work is not altered or transformed in any way, and that the work
is properly cited. For commercial re-use, please contact journals.permissions@oup.com
                                                                                                        older patients who are HIV positive have an elevated risk of
DOI: 10.1093/ofid/ofy067                                                                                polypharmacy [9].

                                                                                                                                 Diet and Exercise in HIV-Positive People • OFID • 1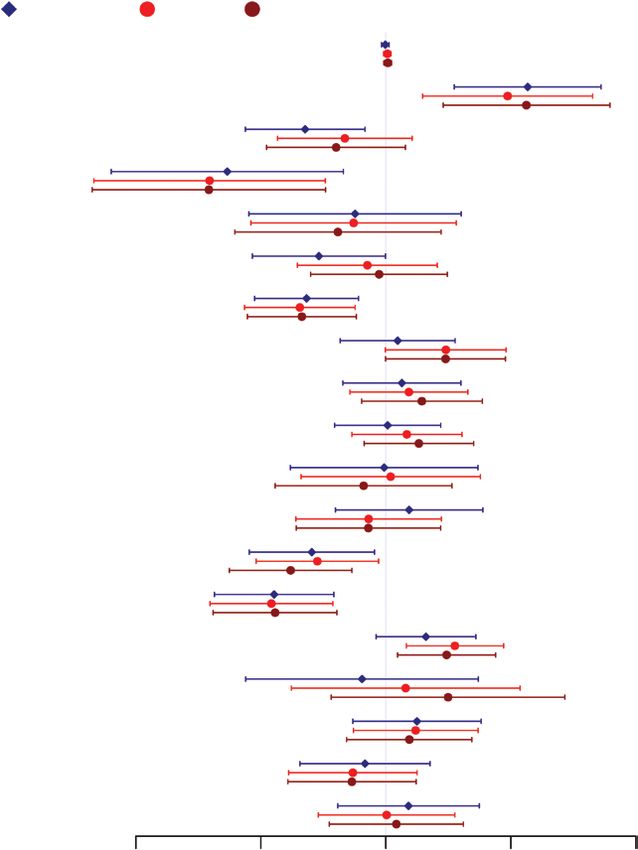
All this makes understanding the contribution of behavioral 2 years. Data about alcohol consumption are regularly gathered
factors like dietary habits and physical activity a pertinent task in the SHCS. The FFQ interviews were conducted by phone by
which carries a possible prevention potential [10, 11], because a trained staff and were collected using the REDCap electronic
both are modifiable risk factors. Although current guidelines data capture tool [17] hosted at University Hospital Zürich.
encourage the implementation of lifestyle changes before statins
Statistical Analysis
initiation for CVD prevention [12], no empirical data about the
To assess the dietary patterns, first, all food items were con-
association of diet and exercise with total cholesterol in aging
verted into daily consumption. Then, Ward error sum of
HIV-positive individuals are available.
squares hierarchical clustering method [18, 19] was used with
Therefore, the main aims of this study were as follows: (1)
1-Kendall’s tau correlation matrix as an input. Based on the
describe the predictors of total cholesterol in an aging HIV-
classification output, the 4 largest and most general food clus-
positive population living in a resource-rich setting; (2) describe
ters were extracted, and for each person the sum of the con-
the major dietary patterns of this population; (3) and examine
sumption frequency of food items that belong to each of the 4
whether behavioral determinants such as dietary patterns and
clusters was calculated separately. In other words, each person
physical activity independently correlate with total cholesterol
received 4 score variables (pattern I to pattern IV) that reflected
after adjustment for highly active ART, lipid-lowering drugs,
the cumulative consumption frequency of the food items for
and other confounders.
each pattern.
METHODS Linear mixed-effects model with per center random intercept
was used to assess the correlation between dietary patterns and
Swiss Human Immunodeficiency Virus Cohort Study total cholesterol. The closest available total cholesterol measure-
The Swiss HIV Cohort Study (SHCS) is a large, ongoing, mul- ment to the dietary assessment was used regardless of fasting
ticenter cohort study of HIV-positive individuals with a pro- state. Fasting state during the measurement was adjusted for
spective recruitment since 1988 [13]. During the biannual in the multivariable models. Two multivariable models were
outpatient visits, comprehensive clinical and behavioral data explored: (1) the minimally adjusted model, only for age, sex,
(including leisure physical activity) are collected. The patients risk group, physical activity, ART, lipid-lowering drugs, and
described in this study are all enrolled in the SHCS nested fasting state; and (2) the model that was adjusted for the covar-
project “Metabolism and Aging”, which includes participants iates in model I plus additional demographical and clinical
≥45 years of age undergoing dual energy x-ray absorptiometry covariates (ethnicity, university education, living alone, smok-
scan, neurocognitive testing, and in the 2 centers of Zurich and ing, depression, diabetes, hypertension, number of years on
Geneva additionally coronary computed tomography scan. ART, recent dietary change, multivitamin supplement, Omega
For this project, Metabolic and Aging study participants of 3 supplement, protein powder supplement) (Figure 4). Because
the Zurich, Berne, and Geneva centers were enrolled. Ethical the cumulative consumption scores were skewed to the right,
approval of the SHCS and written informed consent from all they were ln(x+1) transformed. Benjamini-Hochberg adjust-
participants were obtained upon cohort enrollment. ment for multiple testing was performed for the correlation
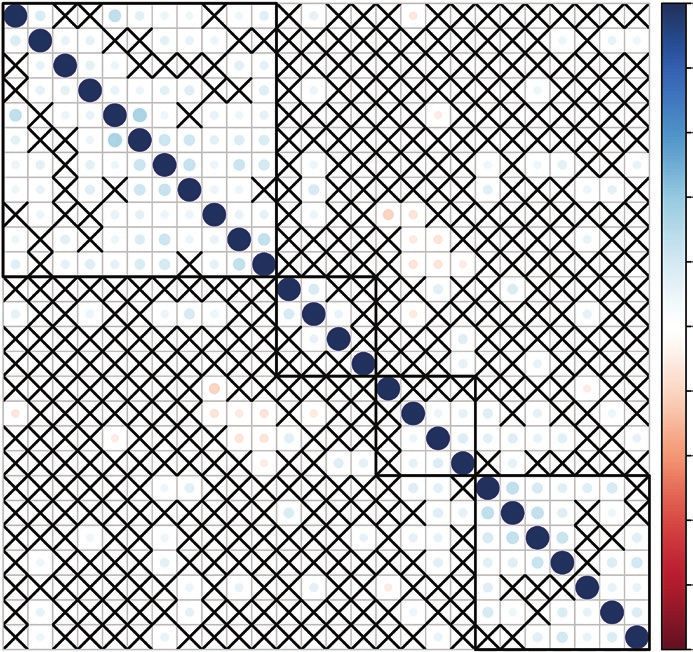
Dietary Assessment matrix (Figure 2) but not for the multivariable analysis, due to
Information on diet was obtained by a short and validated limited power. Statistical analysis was performed with R (ver-
Food-Frequency Questionnaire (FFQ). This qualitative FFQ sion 3.3.2).
was originally used in the large INTERHEART study conducted
RESULTS
in 52 countries [14] and was administered thereafter in several
other large international studies [15, 16]. In this questionnaire, Patients
participants are asked, “In the last 12 months, how often did In total, from June 2016 until October 2017, of 539 eligible
you consume foods from each of the following categories?” participants 395 (73.3%) were interviewed for the study, the
A list of 23 broad food categories is then presented, and the remaining either refused to participate (n = 31, 5.8%), could not
subject states the number of consumed items per month, week, be reached on at least 5 different occasions (n = 111, 20.6%), or
or day. Because this FFQ was designed for use in international provided incomplete response (n = 2). The median age of the par-
studies, it contains all of the main food groups, ie, dairy, meat, ticipants was 55.7 years (interquartile range [IQR], 52.2–60.8),
fish, fruits, and vegetables, and has been found to be applic- the majority were male (85.6%, 338 of 395), of white ethnicity
able to different countries despite regional dietary differences (94.4%, 373 of 395), and belonged to the men-who-have-sex-
[14]. Although we intentionally kept the original questionnaire with-men (MSM) risk group (59%, 233 of 395) (Table 1). A total
intact to maintain its validity, we added a short supplementary of 11.6% (46 of 395) were obese and 32.4% (128 of 395) were
part that gathered additional information about the following: overweight. The median time on ART was 14.2 years (IQR, 8.8–
(1) dietary supplements (vitamins, minerals, etc); (2) coffee 20.4), and the median most recent CD4 value was 648 cells/µL
and tea consumption; and (3) major dietary change in the last (IQR, 494.5–816.0). The vast majority of patients (95.9%, 379
2 • OFID • Marzel et alTable 1. Patient Characteristics (Pattern I) “Meat,” “Refined/ milled grains,” “Carbonated
beverages,” “Coffee” - This pattern positively correlated with
Characteristics Overall
smoking, with 21.4% (22 of 103) of smokers in the lowest
n 395 quartile and 45.8% (44 of 96) of smokers in the highest quartile
Age (median [IQR]) 55.7 [52.2–60.8]
(Fisher’s exact test, P < .001) (Supplementary Table 1); (Pattern
Sex, female (%) 57 (14.4)
Ethnicity (%)
II) “Organ meats,” “Poultry,” “Fish/seafood,” “Alcohol” -
White 373 (94.4) Pattern II negatively correlated with female sex, with 26.7%
Black 15 (3.8) (27 of 101) females in the lowest quartile and 8.2% (8 of 97) in
Hispanic 7 (1.8) the highest consumption quartile (Fisher’s exact test, P = .001)
Risk Group (%)
(Supplementary Table 2); (Pattern III) “Whole grains,” “Dairy
Heterosexual 108 (27.3)
products,” “Eggs,” “Leafy green vegetables,” “Other vegetables
Men who have sex with men 233 (59.0)
Injecting drug users 24 (6.1)
(raw),” “Other vegetables (cooked),” “Legumes/nuts/seeds,”
Other 30 (7.6) “Potatoes, boiled/mashed,” “Pickled food,” “Fruits,” “Tea
University education, yes (%) 55 (13.9) (Black/Green)” - Pattern III was positively associated with
Living alone, yes (%) 162 (41.0) university education with 9.1% (9 of 99) having university
Current smoking, yes (%) 126 (31.9)
education in the lowest quartile versus 22.2% (22 of 99) in the
BMI (%)
highest (Fisher’s exact test, P = .018) and was negatively asso-
Normal (≥18.5–25) 212 (53.7)
Overweight (≥25–30) 128 (32.4) ciated with smoking with 45.5% (45 of 99) smokers in the low-
Obese (≥30) 46 (11.6) est quartile and 20.2% (20 of 99) in the highest consumption
Underweight (Pattern I
ns
Deep fr
grai
illed
De
ges
ied foo
sse
Sal
era
/m
Pizza
rt s
ty s
bev
Meat
/s
ned
w
ted
nac
ds
Pattern IV
eet
Refi
na
Fru
ks
sna
rbo
it j
cks
uic
Ca
e/d
rin ffee
Ice c ks Co
ream
/pud
ding
Confectionary
sugars/syrups hol
Alco
ts
Organ mea
Fish/seafood
Poul
try
Pattern II
es (cooked)
Other vegetabl
ashed
d/m
es, boile
otato ts
P
ro duc Fru
its
ir yp
Da
gs
W
Eg
ho
le
Tea
les
gra
w)
Pickled
tab
Legumes/nuts/seeds
ins
(Bl
les (ra
vege
ack
reen
food
/G
vegetatb
Pattern III reen
fy g
)
Lea
Other
Figure 1. Four main dietary patterns as determined by hierarchical clustering.
Total Cholesterol (β = −0.443; 95% CI, −0.691 to −0.196), NtRTI (β = −0.336; 95%
The median total cholesterol value was 5 mmol/L (sd = 1.1). CI, −0.554 to −0.118), and regular physical activity (β = −0.381;
Forty percent (158 of 395) of participants were above the cut- 95% CI, −0.626 to −0.136) remained negatively correlated with
off of 5.2 mmol/L, and 13.1% (51 of 395) were above the cutoff total cholesterol, in addition to black ethnicity (β = −0.967; 95%
of 6.2 mmol/L (Supplementary Figure 1). Lipid-lowering drugs CI, −1.524 to −0.410), IDU risk group (β = −0.708; 95% CI,
were prescribed in 24.8% of the participants (98 of 395). −1.175 to −0.241), living alone (β = −0.236; 95% CI, −0.436 to
−0.035), and taking a multivitamin (β = −0.378; 95% CI, −0.730
Factors Associated With Total Cholesterol
to −0.027). On the other hand, female sex (β = 0.562; 95% CI,
Next, we examined the factors that correlate with total chol-
0.229–0.896) and dietary pattern I (β = 0.243; 95% CI, 0.047–
esterol. In the first multivariable model (Model I; Figure 4),
0.439; P = .02) remained positively and significantly correlated
physical activity at least 3 times a week compared with none
with total cholesterol even after adjustment for the additional
(β = −0.274; 95% confidence interval [CI], −0.519 to −0.029),
covariates in Model II.
lipid-lowering drugs (β = −0.458; 95% CI, −0.703 to −0.212),
ART including a nucleotide reverse-transcriptase inhibitor Sensitivity Analysis
(NtRTI) (β = −0.344; 95% CI, −0.565 to −0.123), and intrave- As a sensitivity analysis, we repeated the multivariable analysis
nous drug users (IDU) risk group (β = −0.705; 95% CI, −1.168 (Model I excluding lipid-lowering drugs) separately for patients
to −0.242) were negatively correlated with total cholesterol. on and off lipid-lowering drugs (Supplementary Table 5). For
On the other hand, female sex (β = 0.487; 95% CI, 0.147 to patients on lipid-lowering drugs, frequent physical activity
0.827) and dietary pattern I (“Meat,” “Refined/ milled grains,” (β = −0.732; 95% CI, −1.166 to −0.232), NtRTI (β = −0.546; 95%
“Carbonated beverages,” “Coffee”)—but not the other 3 pat- CI, −0.980 to −0.076), and IDU risk group (β = −1.148; 95% CI,
terns—positively correlated with total cholesterol (β = 0.276; −2.023 to −0.278) negatively correlated with total cholesterol.
95% CI, 0.082–0.471; P = .007). None of the covariates, including dietary pattern I (β = 0.352;
After additionally adjusting for a wide range of demographic 95% CI, −0.039 to 0.747; P = .115), significantly positively cor-
and clinical covariates (Model II; Figure 4), lipid-lowering drugs related with total cholesterol among patients on lipid-lowering
4 • OFID • Marzel et alPattern III Pattern II Pattern I Pattern IV
Confectionary sugars/syrups
Other vegetables (cooked)
Potatoes, boiled/mashed
Leafy green vegetables
Other vegetables (raw)
Corbonated beverages
Refined/milled grains
Desserts/sweet snacks
Legumes/nuts/seeds
Ice cream/pudding
Tea (Black/Green)
Fruit juice/drinks
Deep fried foods
Dairy products
Whole grains
Organ meats
Fish/seafood
Pickled food
Salty snacks
Alcohol
Poultry
Coffee
Fruits
Pizza
Meat
Eggs
Other vegetables (cooked) 1
Potatoes, boiled/mashed
Dairy products 0.8
Eggs
Leafy green vegetables
Other vegetables (raw) 0.6
Legumes/nuts/seeds
Pickled food 0.4
Tea (Black/Green)
Whole grains
Fruits 0.2
Poultry
Fish/seafood
Organ meats 0
Alcohol
Coffee –0.2
Corbonated beverages
Refined/milled grains
Meat –0.4
Pizza
Deep fried foods –0.6
Salty snacks
Desserts/sweet snacks
Fruit juice/drinks –0.8
Ice cream/pudding
Confectionary sugars/syrups
–1
Figure 2. Correlation matrix of the examined food items. Squares with “X” are not statistically significant after adjustment for multiple testing.
30
25
Total frequency per day
20
15
10
5
0
Pattern I Pattern II Pattern III Pattern IV
Figure 3. Boxplot of total daily consumption stratified by dietary patterns. Pattern I: meat, refined/milled grains, carbonated beverages, coffee. Pattern II: organ meats, poultry,
fish/seafood, alcohol. Pattern III: whole grains, dairy products, eggs, leafy green vegetables, other vegetables (raw and cooked), legumes/nuts/seeds, potatoes, boiled/mashed,
pickled food, fruits, tea (black/green). Pattern IV: pizza, deep fried foods, salty snacks, ice cream/pudding, desserts/sweet snacks, confectionary sugars/syrups, fruit juice/drinks.
Diet and Exercise in HIV-Positive People • OFID • 5Univariable Model I Model II
Age
Female sex, vs. Male
Risk group: MSM vs. HET
Risk group: IDU vs. HET
Risk group: Other vs. HET
On NRTI, yes vs. no
On NTRTI, yes vs. no
On NNRTI, yes vs. no
On PI, yes vs. no
On INTI, yes vs. no
Physical activity 1–4 times a month vs. none
Physical activity 1–2 times a week vs. none
Physical activity ≥3 times a week vs. none
Lipid lowering drugs, yes vs. no
Dietary pattern I
Dietary pattern II
Dietary pattern III
Dietary pattern IV
Fasting cholesterol, yes vs. no
–1 –0.5 0 0.5 1
Coefficient
Figure 4. Factors that correlate with total cholesterol, univariable and 2 linear mixed-effect models. Model I was adjusted for all the covariates in the figure. Model II was
adjusted for all covariates in the figure and additionally for ethnicity, university education, living alone, smoking, depression, diabetes, hypertension, number of years on
antiretroviral therapy, recent dietary change, multivitamin supplement, Omega 3 supplement, protein powder supplement. Dietary patterns consumption frequencies were
ln(x+1) transformed. Pattern I: meat, refined/milled grains, carbonated beverages, coffee. Pattern II: organ meats, poultry, fish/seafood, alcohol. Pattern III: whole grains, dairy
products, eggs, leafy green vegetables, other vegetables (raw and cooked), legumes/nuts/seeds, potatoes, boiled/mashed, pickled food, fruits, tea (black/green). Pattern IV:
pizza, deep fried foods, salty snacks, ice cream/pudding, desserts/sweet snacks, confectionary sugars/syrups, fruit juice/drinks. Abbreviations: ART, antiretroviral therapy;
HET, heterosexual; IDU, injecting drug users; INTI, integrase inhibitor; MSM, men who have sex with men; NNRTI, nonnucleoside reverse-transcriptase inhibitor; NRTI,
nucleoside reverse-transcriptase inhibitor; NTRTI, nucleotide reverse-transcriptase inhibitor; PI, protease inhibitor.
drugs; however, the limited statistical power of this subgroup as outcomes. For HDL, age (β = 0.012; 95% CI, 0.006–0.019)
analysis should be taken into account. and female sex (β = 0.474; 95% CI, 0.331–0.615) showed a posi-
Among patients not on lipid-lowering drugs, none of the tive association, whereas having hypertension (β = −0.132; 95%
covariates were significantly negatively associated with total CI, −0.227 to −0.036) and ART regimen with protease inhibi-
cholesterol. On the other hand, dietary pattern I and female tors (β = −0.121; 95% CI, −0.224 to −0.018) exhibited a negative
sex remained significantly positively correlated with total chol- correlation. None of the remaining variables, including physical
esterol in people not on lipid-lowering drugs (β = 0.234, 95% activity and the examined 4 dietary patterns, showed any signif-
CI = 0.011–0.457, P = .047 and β = 0.574, 95% CI = 0.198–0.949, icant correlation. For triglycerides, diabetes (β = 0.730; 95% CI,
P = .004, respectively). 0.144–1.367), hypertension (β = 0.371; 95% CI, 0.045–0.690),
nonnucleoside reverse-transcriptase inhibitors (β = 0.480; 95%
High-Density Lipoproteins and Triglycerides CI, 0.131–0.822), protease inhibitors (β = 0.695; 95% CI, 0.342–
Finally, to obtain a more complete picture on factors associated 1.038), and integrase inhibitors (β = 0.589; 95% CI, 0.259–
with dyslipidemia in general, we also explored the fully adjusted 0.891) showed positive association, whereas age (β = −0.024;
model with high-density lipoproteins (HDL) and triglycerides 95% CI, −0.045 to −0.001), female sex (β = −0.554; 95% CI,
6 • OFID • Marzel et al−1.009 to −0.047), MSM risk group (β = −0.455; 95% CI, low-density lipoprotein cholesterol was identified [25]. The
−0.836 to −0.036), IDU risk group (β = −1.213; 95% CI, −1.886 effect was weak for filtered coffee; however, most of the coffee
to −0.540), living alone (β = −0.332; 95% CI, −0.630 to −0.051), that is consumed in Switzerland is unfiltered.
and physical activity of at least 3 times per week (β = −0.389; The observation that pattern III that contained vegetables,
95% CI, −0.764 to −0.058) were negatively associated with tri- legumes, and fruits positively correlated with higher education
glycerides. In contrast to physical activity, none of the dietary and negatively correlated with smoking is consistent with the
patterns exhibited a significant association with triglycerides in well established association between education and health liter-
our fully adjusted model. acy [26]. This might also suggest that patients with low educa-
tion could benefit most from dietary counseling.
DISCUSSION
The beneficial effect of regular exercise on cholesterol is well
In this analysis of HIV-positive individuals ≥45 years old pre- established. For example, in a randomized controlled trial from
dominantly on suppressive ART, we found several factors that the UK, in which participants were asked to maintain their nor-
were independently correlated with total cholesterol: female sex mal dietary habits, high-intensity exercise program for 24 weeks
and the frequency of combined consumption of meat, refined/ resulted in significant decreases in total cholesterol (mean
milled grains, carbonated beverages, and coffee (dietary pattern change, −0.55 ± 0.81 mmol/L) [27]. Forty percent of our sam-
I) showed positive correlation. On the other hand, regular phys- ple reported physical activity of 1 to 4 times a month or never,
ical activity, lipid-lowering drugs, an ART regimen containing hence not meeting the World Health Organization (WHO)
tenofovir, and black ethnicity exhibited a negative correlation. guidelines of 150 minutes of moderate-intensity aerobic phys-
In the analysis restricted to patients not on lipid-lowering ical activity throughout the week [28]. This suggests that there
drugs, total cholesterol remained associated with dietary pat- is considerable room for improvement in this area, especially
tern I (meat, refined/milled grains, carbonated beverages, because the benefits of physical activity extend beyond cardio-
coffee), supporting current guidelines that encourage imple- vascular risk factors and also include prevention of dementia
mentation of lifestyle and dietary changes before statin initi- [29], depression, and anxiety [30]. Data about the benefits of
ation [12]. In participants on lipid-lowering drugs, there was physical activity for HIV dyslipidemia is scarce [31], especially
an additional benefit of physical activity, beyond the effect of in aging HIV-positive population.
lipid-lowering drugs. The strengths of our study include the use of a popula-
It has been previously shown that people living with HIV tion-based cohort, the SHCS, with a large array of prospectively
consume more saturated fat and cholesterol compared with collected clinical and laboratory data, enabling us to adjust for
HIV-negative individuals [20]. It was also demonstrated that many important clinical and demographic potential confound-
tackling HIV dyslipidemia with diet is feasible [10]. In a system- ers. Patients from 3 different study centers across Switzerland
atic review and meta-analysis of the effects of dietary interven- were included, hence increasing generalizability. Moreover,
tion on HIV dyslipidemia, dietary intervention reduced total nutrition data were assessed by a well validated questionnaire
cholesterol by −0.36 mmol/L compared with placebo/control used in large studies in the general population.
[21]. However, no study was performed on a predominantly Our study also has limitations. Inherent to cross-sectional
aging HIV-positive population. studies, there is a lack of temporality [32]. Due to the observa-
Several previous studies in the general population demon- tional study design, and in light of the fact that there are many
strated associations between individual food items that potential confounders associated with dietary patterns, physical
comprise pattern I in our study and total cholesterol or cardio- activity and total cholesterol levels, we cannot rule-out residual
vascular risk. In a prospective cohort study of 31 546 high-risk confounding for which we could not account. Another limita-
individuals from 40 countries, meat, poultry, and egg consump- tion is that the FFQ measured frequency but not quantity of
tion were independently correlated with composite outcome of consumption [15]. Finally, due to collinearity between food
cardiovascular death, nonfatal myocardial infarction, nonfa- items within the same consumption pattern, it was not possi-
tal stroke, or hospitalization for congestive heart failure [15]. ble to examine the effect of single food items. Nevertheless, our
Although in our analysis meat indeed clustered in pattern I, results are in line with large cohort studies, randomized con-
poultry and eggs clustered in different patterns. trolled trials, and meta-analysis [15, 25, 27].
Our results are biologically plausible because most meat Future studies are needed to illuminate the effect of type of fat
products contain saturated fat that increases cholesterol [22]. intake (saturated fat, monounsaturated fat, and polyunsaturated
In addition, almost all meat products contain cholesterol by fat) on dyslipidemia and on the association between dietary
itself [23, 24]. Frequency of coffee consumption also clus- patterns and hard endpoints such as cardiovascular morbidity
tered with pattern I and is also supported by previous works. and mortality. The most beneficial type of physical activity in
In a meta-analysis of 14 clinical trials, a dose-response relation terms of adherence and cardiovascular benefit for this popula-
between coffee consumption and both total cholesterol and tion is also yet to be determined.
Diet and Exercise in HIV-Positive People • OFID • 7CONCLUSIONS 8. Aberg JA, Gallant JE, Ghanem KG, et al. Primary care guidelines for the manage-
ment of persons infected with HIV: 2013 update by the HIV medicine association
In summary, our cross-sectional study suggests that there are of the Infectious Diseases Society of America. Clin Infect Dis 2014; 58:e1–34.
9. Gleason LJ, Luque AE, Shah K. Polypharmacy in the HIV-infected older adult
independent associations between certain dietary patterns and population. Clin Interv Aging 2013; 8:749–63.
physical activity with total cholesterol. Physical activity should 10. Lazzaretti RK, Kuhmmer R, Sprinz E, et al. Dietary intervention prevents dyslipi-
demia associated with highly active antiretroviral therapy in human immunode-
be substantially scaled up in this population to meet WHO
ficiency virus type 1-infected individuals: a randomized trial. J Am Coll Cardiol
guidelines and to achieve cardiovascular and other health ben- 2012; 59:979–88.
efits. The reported dietary patterns pave the way for further 11. Loonam CR, Mullen A. Nutrition and the HIV-associated lipodystrophy syn-
drome. Nutr Res Rev 2012; 25:267–87.
investigations in prospective cohort studies and randomized 12. EACS Guidelines. Available at: http://www.eacsociety.org/guidelines/eacs-
controlled trials. guidelines/eacs-guidelines.html. Accessed 14 December 2017.
13. Schoeni-Affolter F, Ledergerber B, Rickenbach M, et al. Cohort profile: the Swiss
HIV Cohort study. Int J Epidemiol 2010; 39:1179–89.
Supplementary Data
14. Iqbal R, Anand S, Ounpuu S, et al. Dietary patterns and the risk of acute myocar-
Supplementary materials are available at Open Forum Infectious Diseases dial infarction in 52 countries: results of the INTERHEART study. Circulation
online. Consisting of data provided by the authors to benefit the reader, 2008; 118:1929–37.
the posted materials are not copyedited and are the sole responsibility of 15. Dehghan M, Mente A, Teo KK, et al. Relationship between healthy diet and risk
the authors, so questions or comments should be addressed to the corre- of cardiovascular disease among patients on drug therapies for secondary preven-
sponding author. tion: a prospective cohort study of 31 546 high-risk individuals from 40 countries.
Circulation 2012; 126:2705–12.
16. Smyth A, Dehghan M, O’Donnell M, et al. Healthy eating and reduced risk of
Members of the Swiss HIV Cohort Study
cognitive decline: a cohort from 40 countries. Neurology 2015; 84:2258–65.
V. Aubert, M. Battegay, E. Bernasconi, J. Böni, D. L. Braun, H. C. Bucher, 17. Harris PA, Taylor R, Thielke R, et al. Research electronic data capture
A. Calmy, M. Cavassini, A. Ciuffi, G. Dollenmaier, M. Egger, L. Elzi, J. Fehr, (REDCap)—a metadata-driven methodology and workflow process for pro-
J. Fellay, H. Furrer (Chairman of the Clinical and Laboratory Committee), viding translational research informatics support. J Biomed Inform 2009;
C. A. Fux, H. F. Günthard (President of the SHCS), D. Haerry (Deputy 42:377–81.
of “Positive Council”), B. Hasse, H. H. Hirsch, M. Hoffmann, I. Hösli, 18. Ward JH. Hierarchical grouping to optimize an objective function. J Am Stat
C. Kahlert, L. Kaiser, O. Keiser, T. Klimkait, R. D. Kouyos, H. Kovari, Assoc 1963; 58:236–44.
19. Murtagh F, Legendre P. Ward’s hierarchical agglomerative clustering method:
B. Ledergerber, G. Martinetti, B. Martinez de Tejada, C. Marzolini, K. J.
which algorithms implement Ward’s criterion? J Classif 2014; 31:274–95.
Metzner, N. Müller, D. Nicca, G. Pantaleo, P. Paioni, A. Rauch (Chairman
20. Joy T, Keogh HM, Hadigan C, et al. Dietary fat intake and relationship to serum
of the Scientific Board), C. Rudin (Chairman of the Mother & Child lipid levels in HIV-infected patients with metabolic abnormalities in the HAART
Substudy), A. U. Scherrer (Head of Data Centre), P. Schmid, R. Speck, era. AIDS 2007; 21:1591–600.
M. Stöckle, P. Tarr, A. Trkola, P. Vernazza, G. Wandeler, R. Weber, S. Yerly. 21. Stradling C, Chen YF, Russell T, et al. The effects of dietary intervention on HIV
dyslipidaemia: a systematic review and meta-analysis. PLoS One 2012; 7:e38121.
Acknowledgments 22. Clarke R, Frost C, Collins R, et al. Dietary lipids and blood cholesterol: quantita-
tive meta-analysis of metabolic ward studies. BMJ 1997; 314:112–7.
We thank Professors Mahshid Dehghan and Salim Yusuf and McMaster
23. Chizzolini R, Zanardi E, Dorigoni V, Ghidini S. Calorific value and cholesterol
University for the Food-Frequency Questionnaire.
content of normal and low-fat meat and meat products. Trends Food Sci Technol
Financial support. This study was funded within the framework of the 1999; 10:119–28.
Swiss HIV Cohort Study ([SHCS] project no. 801), supported by the Swiss 24. Piironen V, Toivo J, Lampi AM. New data for cholesterol contents in meat, fish,
National Science Foundation (grant no. 148522), and by the SHCS research milk, eggs and their products consumed in Finland. J Food Comp Anal 2002;
foundation. The data are gathered by the Five Swiss University Hospitals, 2 15:705–13.
Cantonal Hospitals, 15 affiliated hospitals, and 36 private physicians (listed 25. Jee SH, He J, Appel LJ, et al. Coffee consumption and serum lipids: a meta-analysis
in http://www.shcs.ch/180-health-care-providers). of randomized controlled clinical trials. Am J Epidemiol 2001; 153:353–62.
26. Zimmerman EB, Woolf SH, Haley A. Understanding the Relationship Between
Education and Health: a Review of the Evidence and an Examination of
References Community Perspectives | Agency for Healthcare Research & Quality. 2015.
1. Wandeler G, Johnson LF, Egger M. Trends in life expectancy of HIV-positive Available at: https://www.ahrq.gov/professionals/education/curriculum-tools/
adults on antiretroviral therapy across the globe: comparisons with general popu- population-health/zimmerman.html. Accessed 14 December 2017.
lation. Curr Opin HIV AIDS 2016; 11:492–500. 27. O’Donovan G, Owen A, Bird SR, et al. Changes in cardiorespiratory fitness and
2. Verschuren WM, Jacobs DR, Bloemberg BP, et al. Serum total cholesterol and coronary heart disease risk factors following 24 wk of moderate- or high-intensity
long-term coronary heart disease mortality in different cultures. Twenty-five-year exercise of equal energy cost. J Appl Physiol (1985) 2005; 98:1619–25.
follow-up of the seven countries study. JAMA 1995; 274:131–6. 28. World Health Organization. Physical Activity and Adults. Available at: http://
3. Peters SA, Singhateh Y, Mackay D, et al. Total cholesterol as a risk factor for cor- www.who.int/dietphysicalactivity/factsheet_adults/en/. Accessed 10 October
onary heart disease and stroke in women compared with men: a systematic review 2017.
and meta-analysis. Atherosclerosis 2016; 248:123–31. 29. Hamer M, Chida Y. Physical activity and risk of neurodegenerative disease: a sys-
4. Lo J. Dyslipidemia and lipid management in HIV-infected patients. Curr Opin tematic review of prospective evidence. Psychol Med 2009; 39:3–11.
Endocrinol Diabetes Obes 2011; 18:144–7. 30. Rebar AL, Stanton R, Geard D, et al. A meta-meta-analysis of the effect of phys-
5. Sculier D, Toutous-Trellu L, Verolet C, et al. Lipohypertrophy and metabolic dis- ical activity on depression and anxiety in non-clinical adult populations. Health
orders in HIV patients on antiretroviral therapy: a systematic multidisciplinary Psychol Rev 2015; 9:366–78.
clinical approach. J Int AIDS Soc 2014; 17(4 Suppl 3):19559. 31. Mendes EL, Ribeiro Andaki AC, Brito CJ, et al. Beneficial effects of physical activ-
6. Stein JH, Hsue PY. Inflammation, immune activation, and CVD risk in individu- ity in an HIV-infected woman with lipodystrophy: a case report. J Med Case Rep
als with HIV infection. JAMA 2012; 308:405–6. 2011; 5:430.
7. Vachiat A, McCutcheon K, Tsabedze N, et al. HIV and ischemic heart disease. 32. Hill AB. The environment and disease: association or causation? Proc R Soc Med
J Am Coll Cardiol 2017; 69:73–82. 1965; 58:295–300.
8 • OFID • Marzel et alYou can also read