Physicochemical, Structural, and Biological Properties of Polysaccharides from Dandelion - MDPI
←
→
Page content transcription
If your browser does not render page correctly, please read the page content below
Article
Physicochemical, Structural, and Biological
Properties of Polysaccharides from Dandelion
Huijing Guo, Weida Zhang, Ying Jiang, Hai Wang, Guogang Chen * and Minrui Guo *
 College of Food Science, Shihezi University, Shihezi 832000, China; ghjshzu@163.com (H.G.);
 zwd9411@163.com (W.Z.); 715jy@sohu.com (Y.J.); wanghai948@126.com (H.W.)
 * Correspondence: Cgg611@shzu.edu.cn (G.C.); gmrshzu@163.com (M.G.); Tel.: +86‐0993‐2057399 (G.C.)

 Received: 24 March 2019; Accepted: 12 April 2019; Published: 15 April 2019

 Abstract: The edible and medicinal perennial herb dandelion is known to have antitumor,
 antioxidant, and anticomplement properties. However, the structural characterization and
 biological effects of its polysaccharides are not well understood. Here, we aimed to extract and
 investigate a novel polysaccharide from dandelion. A water‐soluble polysaccharide, PD1‐1, was
 successfully obtained from dandelion through ultrasonic‐assisted extraction and purification using
 diethylaminoethyl (DEAE)–Sepharose fast flow and Sephadex G‐75 columns. The results showed
 that PD1‐1 is an inulin‐type polysaccharide with a molecular weight of 2.6 kDa and is composed of
 glucose (52.39%), and mannose (45.41%). Glycosidic linkage analysis demonstrated that PD1‐1
 contains terminal α‐D‐Man/Glcp‐(1→ and →1)‐β‐D‐Man/Glcf‐(2→ glycosidic linkage
 conformations. A physicochemical analysis indicated that PD1‐1 has a triple helix structure and
 exhibits important properties, including good swelling, water‐holding, and oil‐holding capacities.
 Furthermore, PD1‐1 showed good antioxidant activities in DPPH and hydroxyl free radical
 scavenging abilities, with IC50 values of 0.23 mg/mL and 0.25 mg/mL, respectively, and good
 hypoglycemic activities in α‐amylase and α‐glucosidase inhibition, with IC50 values of 0.53 mg/mL
 and 0.40 mg/mL, respectively, in a concentration‐dependent manner. Results suggest that PD1‐1
 possesses efficacious antioxidant and hypoglycemic properties and has potential applications as a
 functional food ingredient.

 Keywords: dandelion; polysaccharide; structural characterization; bioactivities

1. Introduction
      Polysaccharides are essential functional substances composed of various monosaccharide sugars
and are usually found in animals, plants, and microorganisms [1]. Polysaccharides play an important
role in the growth and development of organisms [2,3]. Plant polysaccharides are also known to
possess multiple biological activities, including antioxidant [4], antitumor [5], anti‐hyperglycemic [6],
and immune regulation [7] activities, which are closely related to their physicochemical properties.
Natural polysaccharides are suitable potential candidates for preventing and treating diseases due to
their nontoxicity and negligible side effects compared with synthetic medicines [8,9]. Therefore,
much research has been devoted to the discovery and investigation of natural polysaccharides.
      Dandelion (Taraxacum mongolicum), a perennial herbaceous plant belonging to the Asteraceae
family, is widely distributed in the northern regions of China, including Gansu, Shanxi, and Xinjiang
[10]. Dandelion is known for its applications in the production of drinks, liquor, and toiletries, for its
identified pharmacological functions, including detoxification and diuresis, and its antibacterial and
antitumor properties, which have resulted in its frequent use in traditional Chinese medicine [11,12].
Dandelion roots, leaves, and flowers contain many pharmaceutical ingredients, such as phenolics,
sterols, flavonoids, and polysaccharides [13]. Polysaccharides from dandelion (PD) have also been
reported to regulate metabolism and pathological processes owing to anticomplement, antitumor,
Molecules 2019, 24, 1485; doi:10.3390/molecules24081485                       www.mdpi.com/journal/molecules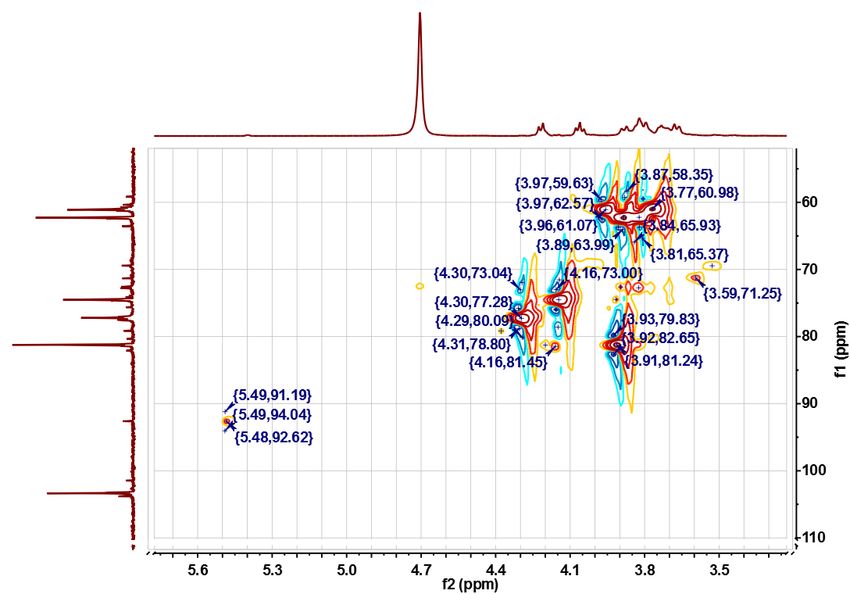
Molecules 2019, 24, 1485                                                                                                                            2 of 15

antioxidant, and antibacterial effects [14–16]. Many PD extraction methods have been investigated,
including hot water extraction, enzyme extraction, microwave‐assisted extraction, and ultrasound‐
assisted extraction [17]. However, the separation, purification, and exhaustive structural
characterization of PD have been lacking. Therefore, efficient and accurate analytical methods for
elucidating PD structures are required.
      The present study aimed to separate and purify polysaccharides, and explore the structures and
functions of the purified polysaccharide fraction. An ultrasound‐assisted method was used to extract
polysaccharides from dandelion from Xinjiang province. Purified fractions of dandelion
polysaccharides were obtained by chromatography through diethylaminoethyl (DEAE)–Sepharose
fast flow columns and then Sephadex G‐75 columns. The physicochemical properties and structures
of the purified fractions were determined using Fourier transform infrared (FT–IR) spectroscopy, gas
chromatography–mass spectrometry (GC–MS), nuclear magnetic resonance (NMR) spectroscopy,
colorimetric determination with Congo red, and high performance gel permeation chromatography
(HPGPC). Moreover, the in vitro antioxidant and hypoglycemic activities of the purified
polysaccharide were evaluated by the assay of free radical scavenging activities and enzyme
inhibitory activities. This strategy could be promising for application to novel functional foods or
drugs with polysaccharides as ingredients.

2. Results and Discussion

2.1. Polysaccharide Isolation and Purification
     Crude polysaccharide was separated on a DEAE–Sepharose fast flow anion‐exchange column,
eluting with distilled water and the stepwise addition of different NaCl solutions (0.2, 0.5, 1.0, and
2.0 mol/L). According to the elution curve (Figure 1A), two polysaccharides were separated and
designated as PD1 and PD2. The first fraction, PD1, was eluted by distilled water, while the second,
PD2, was eluted by 0.2 mol/L NaCl. The pooled polysaccharide fraction (PD1) was then collected,
concentrated, dialyzed, lyophilized, and further purified through a Sephadex G‐75 gel filtration
column. As shown in Figure 1B, one fraction (PD1‐1) was eluted by distilled water. PD1‐1 was
collected and used in the following experiments.
             A 1.2                                                     1.0                          B 1.0

                           1.0
                                          PD1                          0.8                                        0.8
     Absorbance (490 nm)

                                                                                            Absorbance (490 nm)

                                                                                                                                       PD1-1
                           0.8
                                                                             NaCl (mol/L)

                                                                       0.6                                        0.6
                           0.6
                                                       PD2             0.4                                        0.4
                           0.4

                                                                       0.2                                        0.2
                           0.2

                           0.0                                         0.0                                        0.0
                                 0   10   20      30    40   50   60                                                    0   20    40     60    80   100
                                               Tube number                                                                       Tube number

           Figure 1. Chromatograms from (A) Diethylaminoethyl (DEAE) cellulose fast flow anion‐exchange
           column chromatography of crude polysaccharides, and (B) Sephadex G‐75 column chromatography
           of PD1.

2.2. Chemical Analysis of PD1‐1
      The chemical composition of PD1‐1 was analyzed. Polysaccharide PD1‐1 mainly contained 95.35
± 3.45% total sugars, 6.61 ± 0.22% uronic acid, and no protein, as determined by the Coomassie
Brilliant Blue G‐250 method producing no response. The molecular weight of PD1‐1 was determined
to be 2.6 kDa by high performance gel permeation chromatography (HPGPC), based on the
calibration curve that had been established using dextran standards (Figure S1). Monosaccharide
composition analysis showed glucose (52.39%) was the major sugar in PD1‐1, along with a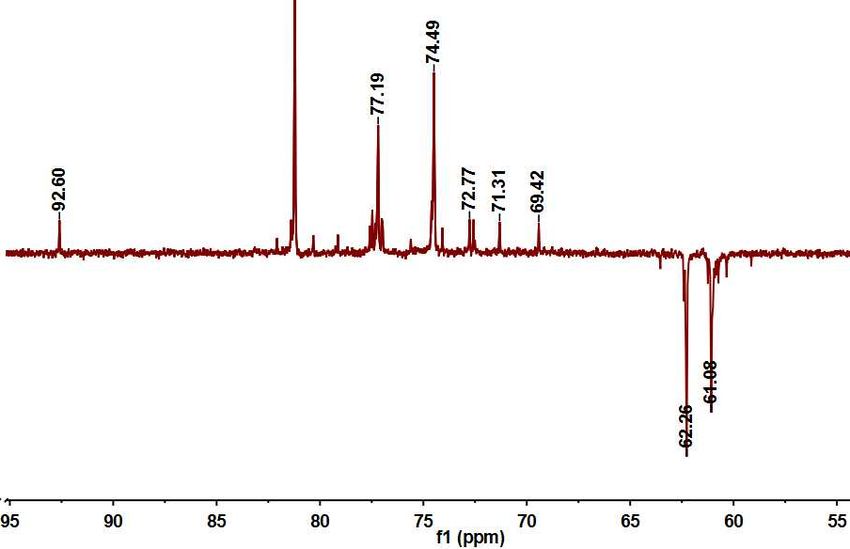
Molecules 2019, 24, 1485 3 of 15
considerable amount of mannose (45.41%). The major monosaccharides, glucose and mannose, had
a molar ratio of approximately 1:1 (Figure S2), thus it was speculated that PD1‐1 is a fructan, because
fructose is a ketose, which is reduced to mannose and glucose when analyzed by GC‐MS.
2.3. Structural analysis of PD1‐1
2.3.1. UV and FT‐IR Spectrum Analysis
The ultraviolet–visible (UV–vis) spectrum of PD1‐1 is shown in Figure 2A. PD1‐1 showed no
absorption at 260 and 280 nm, indicating the absence of protein. This was consistent with results of
Bradford’s method. The FT‐IR spectrum of PD1‐1 was scanned in the range of 400–4000 cm−1,
exhibiting a typical polysaccharide absorption peak. As shown in Figure 2B, the strong peak at 3431
cm−1 was attributed to O–H group stretching vibrations, the peak at around 2927 cm−1 was attributed
to C–H group stretching vibrations, bands at 1637 and 1437 cm−1 were attributed to flexural vibrations
of C=O groups, and the signal at 1031 cm−1 was attributed to C–O group stretching vibrations. The
characteristic peaks at 935, 875, and 818 cm−1 were attributed to fructose with α‐type and β‐type
glycosidic linkages simultaneously [18,19]. These results confirmed that PD1‐1 showed typical
polysaccharide absorption peaks.
100
A4 B 875.52 818.17
95
1437.81 935.11
Absorbance (490 nm)
3 Transmittance (%) 90 2927.90 597.88
1637.12
85
1031.51
2
80
75
1
70
3431.88
0 65
200 250 300 350 400 4000 3500 3000 2500 2000 1500 1000 500
Wavelength (nm) Wavenumber (cm-1)
Figure 2. (A) UV and (B) FT‐IR spectra of PD1‐1.
2.3.2. Methylation Analysis
After methylation of PD1‐1, the methylated derivatives were analyzed using GC–MS. As shown
in Table 1, the results showed that PD1‐1 had two glycosidic linkages, namely 2,3,4,6‐Me4‐Glc/Manp
and 3,4,6‐Me3‐Glc/Manf linkages, with contents of 2 and 14 mol%, respectively. These results show
that PD1‐1 mainly contains α‐D‐Glc/Manp‐1‐ and ‐1‐β‐D‐Glc/Manf‐2‐ glycosidic bonds [20].
Table 1. PD1‐1 methylation results.
Methylated Sugars Linkage Type Molar Ratio (%) Major Mass Fragments (m/z)
2,3,4,6‐Me4‐Glc/Manp Terminal Man/Glc 2 45, 71, 87, 101, 117, 129, 145, 161, 205
3,4,6‐Me3‐Glc/Manf 1,2‐linked Man/Glc 14 43, 87, 129, 161, 187
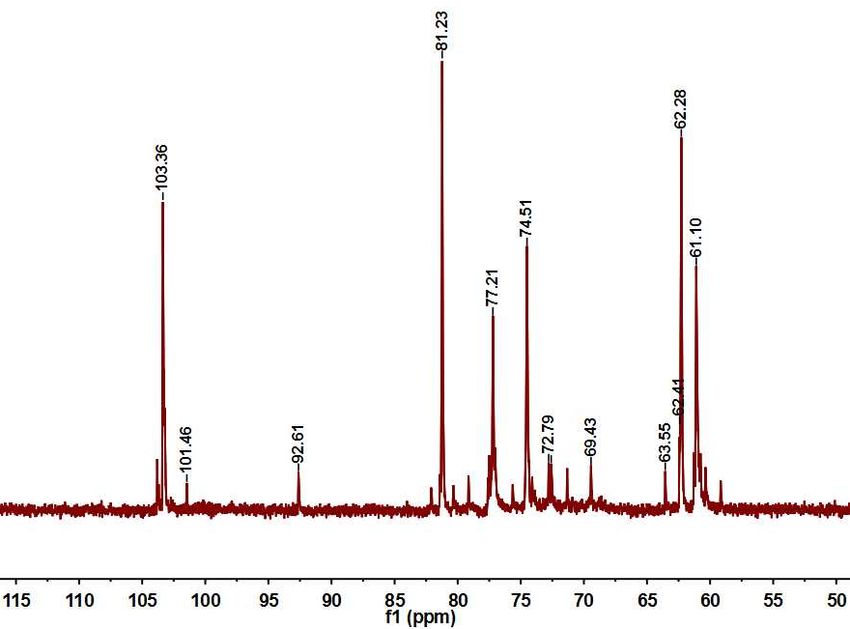
2.3.3. NMR Analysis
The structure of PD1‐1 was further analyzed using 1D and 2D nuclear magnetic resonance
(NMR) spectroscopy. The major 1H and 13C‐NMR chemical shifts for PD1‐1 are shown in Table 2. The
1H‐NMR spectrum (Figure 3A) showed one anomeric H‐1 signal at δ 5.4 ppm, which indicated that
the glucose was an α‐D‐Glcp residue corresponding to the C‐1 signal at 92.61 ppm in the 13C‐NMR
spectrum and other proton resonances appearing in the region δ 3.50–4.20 ppm. The 13C‐NMR
spectrum (Figure 3B) of PD1‐1 showed typical fructan peaks according to previously reported values
for fructans [21]. The anomeric carbons signals at 103.36, 104.90, and 92.61 ppm were attributed to C‐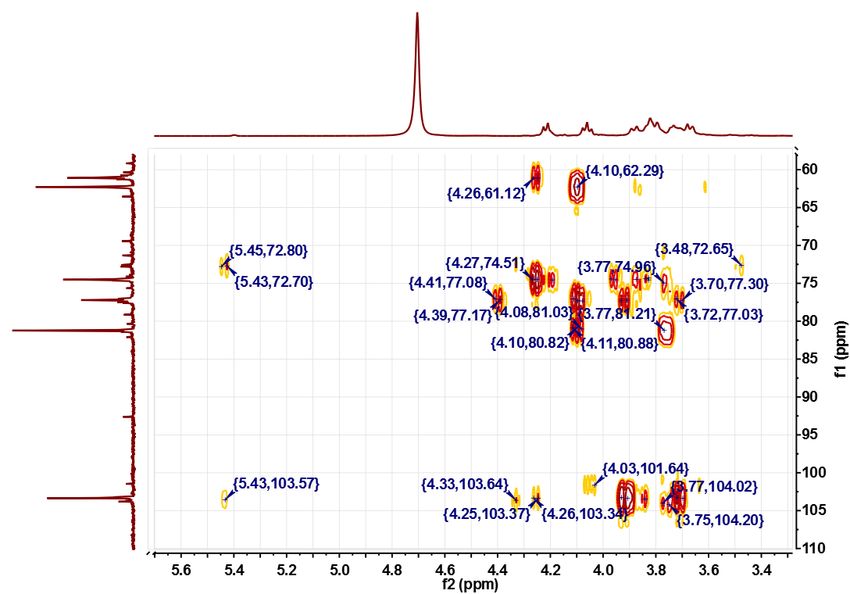
Molecules 2019, 24, 1485                                                                                 4 of 15

2 of →1)‐β‐D‐Fruf‐(2→, →1)‐β‐D‐Fruf‐4AC‐(2→, and C‐1 of α‐D‐Glcp‐(1→, respectively. C‐1, C‐3, C‐
4, C‐5 and C‐6 in →1)‐β‐D‐Fruf‐(2→ were assigned to signals at 61.10, 77.21, 74.51, 81.23, and 62.28
ppm, respectively. Signals appearing in a similar region were assigned to → 1)‐β‐D‐Fruf‐(2 →
residues.
     In the HMBC spectrum, H‐3 in →1)‐β‐D‐Fruf‐(2→ correlated with C‐1 and C‐4 in →1)‐β‐D‐Fruf‐
4AC‐(2→, while H‐4 in →1)‐β‐D‐Fruf‐(2→ correlated with C‐3, C‐5, and C‐6 in →1)‐β‐D‐Fruf‐4AC‐
(2→, confirming the presence of a →2‐β‐D‐Fruf‐1→ glycosidic linkage [22]. Furthermore, H‐1 in α‐
D‐Glcp‐(1→ correlated with C‐2 in →1)‐β‐D‐Fruf‐(2→, which confirmed that the glycosidic linkage
of PD1‐1 contained α‐D‐Glcp‐1→2‐β‐D‐Fruf‐1→. C‐2 correlated with H‐1a and H‐1b in →1)‐β‐D‐Fruf‐
(2→, indicating that the →2)‐β‐D‐Fruf‐1→2‐β‐D‐Fruf‐(1→ glycosidic linkage was present. C‐2 in →
1)‐β‐D‐Fruf‐(2→ correlated with H‐1b in →1)‐β‐D‐Fruf‐4AC‐(2→, indicating that the →1)‐β‐D‐Fruf‐
(2→1)‐β‐D‐Fruf‐4AC‐(2→ linkage was present. In conclusion, PD1‐1 is a fructan with a →2‐β‐D‐Fruf‐
1→2‐β‐D‐Fruf‐1→ linkage and an acetyl group attached to the hydroxyl group at C‐4 [23].

             Table 2. 1H and 13C nuclear magnetic resonance (NMR) chemical shifts (ppm) for PD1‐1.

                                 H1a/H1b         H2         H3           H4           H5         H6a/H6b
    Glycosyl Residues
                                 C1              C2         C3           C4           C5         C6
                                 3.68/3.87       ‐          4.21         4.06         3.82       3.80/3.73
    →1)‐β‐D‐Fruf‐(2→
                                 61.10           103.36     77.21        74.51        81.23      62.28
                                 5.40            3.51       3.71         4.01         4.22       3.82
    α‐D‐Glcp‐1→
                                 92.61           71.31      72.79        69.43        73.70      75.68
                                 3.77/3.62       ‐          4.21         4.17         4.08       3.77/3.62
    →1)‐β‐D‐Fruf‐4AC‐(2→
                                 61.42           104.9      78.56        81.45        83.10      64.60

             A

              B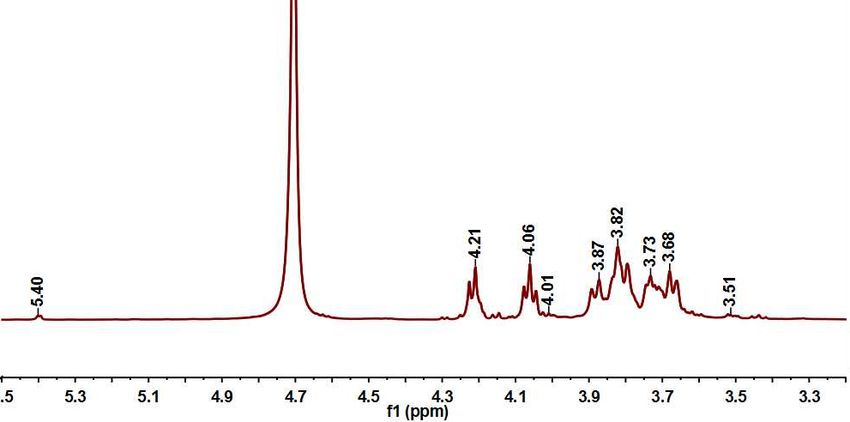
Molecules 2019, 24, 1485   5 of 15

             C

                   D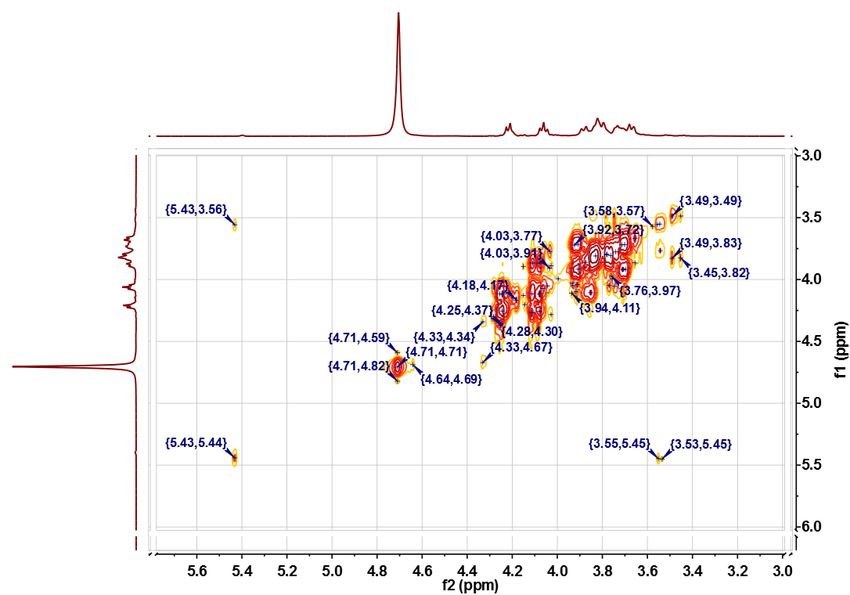
Molecules 2019, 24, 1485 6 of 15
E
F
Figure 3. NMR spectra of PD1‐1: (A) 1H; (B) 13C; (C) DEPT135; (D) 1H–1H COSY; (E) HSQC;
and (F) HMBC.
2.3.4. Congo Red Test
The triple‐helix conformation of PD1‐1 was analyzed using Congo red. According to previous
reports, polysaccharides with triple helixes undergo a helix‐coil transition with increasing alkali
concentration, causing the maximum absorption wavelength (max) to be redshifted or blueshifted
relative to pure Congo red [24]. As shown in Figure 4, with increasing NaOH concentration, the max
of Congo red combined with PD1‐1 was redshifted. The highest value of max was obtained when the
NaOH concentration was 0.1 mol/L. Furthermore, the absorption decreased gradually with
increasing NaOH concentration. This result indicates that PD1‐1 exists as a triple helix structure.Molecules 2019, 24, 1485 7 of 15
Maximum absorption wavelength (nm)
510
blank
PD1-1
505
500
495
490
485
0.0 0.1 0.2 0.3 0.4 0.5
NaOH concentration (mol/L)
Figure 4. Maximum absorption plots of PD1‐1 Congo red complex at various NaOH concentrations.
2.4. Physicochemical Properties of PD1‐1
The physicochemical properties of PD1‐1 are shown in Table 3. PD1‐1 is an odorless pale yellow
powder soluble in water and insoluble in ethanol, methanol, and acetone. PD1‐1 had the highest
swelling capacity (SC) in distilled water, followed by phosphate buffer, with the lowest SC in 0.1
mol/L HCl, indicating that PD1‐1 is sensitive to pH. The high SC of PD1‐1 implies that the polymer
could be used as a binder agent. The relatively higher water holding capacity (WHC) (9.57 ± 0.29 g/g)
of PD1‐1 compared to polysaccharides from potatoes peels [25] suggests that it could be used in many
gourmet foods that require moisture. The pH value of PD1‐1 was 6.47 ± 0.11, indicating that PD1‐1 is
a neutral sugar. The oil holding capacity (OHC) value of PD1‐1 was calculated to be 4.36 ± 0.28 g/g.
A similar OHC has been reported for potatoes peels (4.398 ± 0.04 g/g), suggesting that PD1‐1 might
be applied in the food industry. These results demonstrate that PD1‐1 might be a suitable for use in
the food and pharmaceutical industries.
Table 3. Physicochemical properties of PD1‐1.
Parameters Results
Soluble in water, insoluble in ethanol,
Solubility
methanol, and acetone
Swelling capacity (%, v/v):
distilled water 201 ± 5.56
HCl (0.1 mol/L) 159 ± 4.17
Phosphate buffer (pH 6.86) 185 ± 4.82
pH 6.47 ± 0.11
water holding capacity (WHC) (g/g) 9.57 ± 0.29
oil holding capacity (OHC) (g/g) 4.36 ± 0.28
2.5. Evaluation of Antioxidant Activities
DPPH is an extremely stable free radical, while hydroxyl free radicals are extremely reactive.
These radicals are commonly used to evaluate the free radical scavenging abilities of natural products
[26,27]. The scavenging activity of PD1‐1 and Vc toward DPPH radicals is shown in Figure 5A. Both
PD1‐1 and Vc showed dose‐dependent scavenging abilities for DPPH radicals over the
concentrations of 0.05–0.5 mg/mL. The scavenging rate increased significantly from 0.05–0.3 mg/mL,
with the highest PD1‐1 scavenging rate (65.48%) observed at 0.5 mg/mL. The half maximal inhibitory
concentration (IC50) of PD1‐1 was calculated to be 0.23 mg/mL, which was significantly higher thanMolecules 2019, 24, 1485 8 of 15
that of Vc. These results are consistent with previous research by Huang Dan [28], which showed that
a polysaccharide from dandelion had a remarkable scavenging ability for DPPH, with an IC50 of 0.51
mg/mL. Therefore, PD1‐1 showed a better scavenging ability than the above‐mentioned
polysaccharide. PD1‐1 and Vc also showed hydroxyl radical scavenging abilities (Figure 5B) that
were dose‐dependent over the 0.05–0.5 mg/mL concentration range. The highest hydroxyl
scavenging rate of PD1‐1 (71.77%) was observed at 0.5 mg/mL and the IC50 of PD1‐1 was calculated
to be 0.25 mg/mL.
These results indicate that PD1‐1 has strong antioxidant activity, although its free radical
scavenging ratio was lower than that of Vc. In addition, the DPPH and hydroxyl radical scavenging
abilities of the other two bathes of PD1‐1 that were obtained by the same purifying method were also
determined and achieved similar results, with IC50 values of 0.23 ± 0.03 mg/mL and 0.24 ± 0.02
mg/mL, respectively (Figures not shown). Previous studies [29,30] showed that the antioxidant ability
of polysaccharides is closely related to their structure, physicochemical properties, and other
components, such as proteins and uronic acid. Xing et al. [31] found that scavenging activity of a low
molecular weight polysaccharide against a superoxide radical was higher than that of one with a high
molecular weight. The specific association between structure, physicochemical properties, and
activity requires further research.
100 100
A B
80 80
Scavenging activity (%)
Scavenging activity (%)
60 60
40 40
PD1-1
20 20 PD1-1
Vc
Vc
0 0
0.0 0.1 0.2 0.3 0.4 0.5 0.0 0.1 0.2 0.3 0.4 0.5
Concentration (mg/mL) Concentration (mg/mL)
80
C D 100
IC50=0.53 mg/mL IC50=0.40 mg/mL
80
60
Inhibition activity (%)
Inhibition activity (%)
100 60 100
40 IC50=0.13 mg/mL
IC50=0.15 mg/mL
80 80
Inhibition activity (%)
Inhibition activity (%)
40
60 60
20
40
20 40
20 20
0.0 0.1 0.2 0.3 0.4 0.5 0.0 0.1 0.2 0.3 0.4 0.5
0 Acarbose (mg/mL)
0 Acarbose (mg/mL)
0.0 0.2 0.4 0.6 0.8 1.0 0.0 0.2 0.4 0.6 0.8 1.0
Concentration (mg/mL) Concentration (mg/mL)
Figure 5. Antioxidant and hypoglycemic activities of PD1‐1 in vitro. (A) DPPH radical scavenging
activity; (B) hydroxyl radical scavenging activity; (C) α‐glucosidase inhibitory activity; and (D) α‐
amylase inhibitory activity. Data presented as mean ± SD.
2.6. α‐Glucosidase and α‐Amylase Inhibitory Activities
α‐Amylase and α‐glucosidase are the key enzymes that hydrolyze starch and other
polysaccharides to monosaccharides and disaccharides in the small intestine. Furthermore, α‐
glucosidase inhibitors can retard the formation of glucose and treat type‐2 pre‐diabetic states.
Therefore, α‐glucosidase inhibition provides a prospective approach for preventing and treating
type‐2 diabetes [32,33]. The α‐glucosidase inhibition activities of PD1‐1 and acarbose are shown in
Figure 5C. PD1‐1 showed a dose‐dependent inhibitory effect on α‐glucosidase activity from 0.1 to 1.0
mg/mL. The IC50 of PD1‐1 against α‐glucosidase was calculated to be 0.53 mg/mL, which was higher
than that of acarbose (0.13 mg/mL). The α‐amylase inhibition activities of PD1‐1 and acarbose areMolecules 2019, 24, 1485 9 of 15
shown in Figure 5D. PD1‐1 also showed a dose‐dependent inhibitory effect on α‐amylase activity
from 0.1 to 1.0 mg/mL. The IC50 of PD1‐1 against α‐amylase was calculated to be 0.40 mg/mL, which
was higher than that of acarbose (0.15 mg/mL). Although the IC50 of PD1‐1 showed that it had a lower
inhibitory activity than acarbose, PD1‐1 still had a strong inhibitory effect on α‐glucosidase and α‐
amylase. Furthermore, the α-glucosidase and α-amylase inhibitory activities of the other two batches of
PD1‐1 that were obtained by the same purifying method were also determined and achieved similar
results, with IC50 values of 0.51 ± 0.02 mg/mL and 0.42 ± 0.01 mg/mL, respectively (Figures not shown).
These results indicate that PD1‐1 has potential as an antidiabetic drug.
3. Materials and Methods
3.1. Materials and Chemicals
The whole plant of dandelion was picked from Hami City in the Xinjiang Uygur Autonomous
Region of China, and authenticated by Prof. Guogang Chen at Shihezi University. DEAE–Sepharose
fast flow and Sephadex G‐75 columns were purchased from Beijing Biotopped Science and
Technology Co., Ltd. (Beijing, China). Standard dextrans, α‐amylase, and α‐glucosidase were all
purchased from Sigma Chemical Co. (St. Louis, MO, USA). P‐nitrophenyl‐β‐D‐galactopyranoside
(PNPG) was obtained from Shanghai Baomanbio Biotechnology Co., Ltd. (Shanghai, China). DPPH
was purchased from the Tokyo Chemical Industry (Tokyo, Japan). All of the other chemical reagents
used in this study were of analytical grade and from Xinjiang Tooken Biotechnology Co., Ltd.
(Shihezi, Xinjiang, China).
3.2. Extraction and Purification of Polysaccharides
Air‐dried dandelion (1 kg) was pulverized and passed through a 60‐mesh sieve. Fat and colored
materials were removed using petroleum ether and 95% ethanol by refluxing, respectively. The
residues were air‐dried using a thermostatic blast drying oven at 50 C. The pretreated dandelion
powder was extracted with deionized water (1:25, w/v) and sonicated at 100 W and 75 C for 65 min.
All water extracts were combined, the suspension was filtrated under vacuum, and the supernatant
was concentrated. Proteins were removed from the concentrated supernatant using the Sevag reagent
[34]. The solution was precipitated with 4 volumes of 95% (v/v) ethanol for 12 h at 4 C. The precipitate
was collected by centrifugation and crude PD was obtained by vacuum freeze‐drying.
Crude PD was fractionated using a DEAE–Sepharose fast flow column (10 × 60 cm). Crude PD
(10 g) was dissolved in distilled water (50 mL), centrifuged, and transferred onto the column.
Gradient elution was performed using distilled water followed by different concentrations of
gradient NaCl solution (0.2, 0.5, 1.0, 2.0 mol/L) at 4 mL/min. The eluate was collected and elution
peaks of the polysaccharides were monitored using a phenol sulfuric acid method (PSAM) at 490 nm
[35]. The main fraction was pooled, desalted, concentrated, and further purified using a Sephadex G‐
75 column (2.6 × 60 cm) which was eluted with distilled water at a flow rate of 1 mL/min. The elution
peaks were monitored by PSAM and the fraction was collected, denoted as PD1‐1.
3.3. Chemical Analysis of PD1‐1
3.3.1. Chemical Component Analysis
The total sugar content was determined by PSAM using glucose as a standard. The protein
content was determined using Bradford’s method [36], and the carbazole–sulfuric acid method [37]
was used to measure the uronic acid content of PD1‐1.
3.3.2. Determination of Molecular Weight
The molecular weight of PD1‐1 was determined by HPGPC using a Shimadzu LC‐10A system
equipped with a Waters 2410 refractive index detector (Tosoh Corp, Japan) [38]. The mobile phase
was double‐distilled water (ddH2O) at a flow rate of 0.8 mL/min and a temperature of 40 C. A 10 LMolecules 2019, 24, 1485 10 of 15
sample of PD1‐1 solution (2.0 mg/mL) was injected into the chromatography system for each run.
The molecular weight of PD1‐1 was calculated by comparison with the calibration curve obtained
from dextran standards (5.0–670 kDa).
3.3.3. Monosaccharide Composition Analysis
The monosaccharide composition was determined by GC–MS following a previously reported
procedure. The polysaccharide samples (2 mg) were dissolved in 2 mol/L trifluoracetic acid (TFA; 1
mL) in a closed tube. After hydrolysis at 110 C for 90 min, the hydrolysate was dried in a vacuum
evaporator and then dissolved in H2O (2 mL) containing NaBH4 (60 mg) at room temperature for 8
h. The evaporation step was then repeated under reduced pressure to remove the H2O after
neutralization with glacial acetic acid. The samples were cooled and acetic anhydride (1 mL) was
added. The mixture was incubated at 100 C for 1 h and the evaporation step was then repeated under
reduced pressure to remove the acetic anhydride with toluene (3 mL). The acetylated hydrolysate
was extracted with chloroform and dried by anhydrous sodium sulfate. The monosaccharide
composition was analyzed by GC–MS and identified according to characteristic retention times.
Mannose, rhamnose, fucose, xylose, glucose, galactose, and arabinose were used as monosaccharide
standards.
3.4. Structural Analysis of PD1‐1
3.4.1. UV and FT‐IR Spectrometric Analysis
PD1‐1 polysaccharide was dissolved in distilled water to a final concentration of 5% and
analyzed using UV–vis spectrophotometry. The UV absorption spectrum of the sample was recorded
in the 200–400 nm wavelength range. FT‐IR spectra of PD1‐1 were recorded using an FT‐IR
spectrometer by mixing the sample (2 mg) thoroughly with KBr powder (100 mg) and pressing into
a disk. The FT‐IR spectrum of PD1‐1 was recorded in the 400–4000 cm−1 frequency range.
3.4.2. Methylation Analysis
Methylation analysis of PD1‐1 was conducted according to a previously reported method [39].
Briefly, PD1‐1 was dissolved in anhydrous dimethyl sulfoxide (DMSO; 1 mL), and solid NaOH was
added to the solution under a nitrogen atmosphere. The sample was then methylated with CH3I, and
the permethylated sample was hydrolyzed with 2 mol/L TFA at 121 C for 1.5 h. After reduction and
acetylation of the hydrolysates, the sample was analyzed by GC–MS using an RXI‐5 SIL MS column.
3.4.3. NMR Analysis
PD1‐1 (30 mg) was dissolved in 99.9% D2O (0.6 mL). 1D and 2D NMR spectra were recorded
using an AV‐500 spectrometer equipped with a 5‐mm CPQCI 1H‐31P/13C/15N/D Z‐GRD cryoprobe
with samples in 5‐mm NMR tubes [40]. Spectra were obtained at 25 C using 120 scans. Data
processing was performed using standard Bruker Topspin‐NMR software (AVANCE III, Bruker
Corp, Switzerland).
3.4.4. Congo Red Test
The Congo red test was performed according to a previously reported method with slight
modifications [41]. First, the sample solution (1 mL, 2 mg/mL) was mixed with a NaOH solution (1
mL; 0, 0.1, 0.2, 0.4, 0.6, 0.8, or 1 mol/L). This process afforded NaOH solutions with final
concentrations of 0, 0.1, 0.2, 0.3, 0.4, and 0.5 mol/L. Next, Congo red (2 mL, 80 mol) was added and
mixed thoroughly. A sample solution without NaOH was used as reference. Furthermore, the
maximum absorption wavelength was scanned using a UV‐2600 spectrophotometer (Shimadzu
Corp, Japan) in the 200–600 nm wavelength range after incubating for 10 min at room temperature.
3.5. Physicochemical Properties of PD1‐1Molecules 2019, 24, 1485 11 of 15
3.5.1. Determination of Solubility and pH
The solubility of PD1‐1 was measured in water, ethanol, methanol, and acetone according to the
British Pharmacopoeia (BP) specification [42]. The pH of PD1‐1 in distilled water at a concentration
of 1% (w/v) was determined using a PHS‐3C pH meter.
3.5.2. Determination of Hydration Properties
The WHC was determined using a previously reported method [43]. Briefly, the initial volume
(V1) occupied by PD1‐1 (500 mg) in a test tube was recorded. Next, distilled water (10 mL) was added,
the mixture was allowed to stand for 12 h at room temperature, and the new volume (V2) of the wetted
powder was recorded. This test was repeated using a phosphate buffer (pH 6.86) and 0.1 mol/L HCl
instead of distilled water. The SC was calculated using the following formula: SC (%) = (V2 – V1)/V1
100.
The WHC was determined simultaneously. PD1‐1 (500 mg, M0) was dispersed in distilled water
(10 mL), stirred, kept at room temperature for 1 h, and centrifuged at 3000 rpm for 10 min. The
supernatant was removed, the residue was weighed (M1), and the WHC was calculated using the
following formula: WHC (g/g) = (M1 M0)/M0
3.5.3. Oil Holding Capacity
The OHC was determined using the method described above for WHC determination, but using
soybean oil instead of distilled water. The OHC was calculated as g of soybean oil retained per g of
sample on a dry basis.
3.6. Antioxidant Activities of Polysaccharides
3.6.1. DPPH Radical Scavenging Activity
The DPPH radical scavenging activity of PD was determined using a previously reported
method with some modifications [44]. Briefly, a DPPH solution (2.0 mL, 0.1 mmol/L in ethanol) was
mixed with a PD solution (2.0 mL) at various concentrations. After mixing rapidly, the mixture was
incubated at room temperature for 30 min in the dark, and the absorbance was measured at 517 nm.
Distilled water was used as the blank control, and vitamin C (Vc) was used as the positive control.
The DPPH radical scavenging activity (RSA) was calculated according to the following equation:
DPPH RSA (%) = [1 – (A2 – A1)/A0] 100% (1)
where A2 is the absorbance of a mixture of the sample and the DPPH solution, A1 is the absorbance
of the sample without the DPPH solution, and A0 is the absorbance of the DPPH solution without the
sample.
3.6.2. Hydroxyl Radical Scavenging Activity
The hydroxyl radical scavenging activity of PD was estimated using a previously reported
Fenton‐type reaction with some modifications [45]. Sample solutions (1 mL) of various concentrations
were mixed with FeSO4 (1 mL, 9 mmol/L), salicylic acid (1 mL, 9 mmol/L), and H2O2 (1 mL, 9 mmol/L)
solutions. The mixtures were incubated at 37 C for 30 min and the absorbance was measured at 510
nm. Distilled water was used as the blank control and Vc was used as the positive control. The
hydroxyl radical scavenging activity was calculated according to the following equation:
Hydroxyl RSA (%) = [1 – (A2 – A1)/A0] 100% (2)
where A2 is the absorbance of a mixture of the sample and the H2O2 solution, A1 is the absorbance of
the sample without the H2O2 solution, and A0 is the absorbance of the H2O2 solution without the
sample.
3.7. Hypoglycemic Activity AssayMolecules 2019, 24, 1485 12 of 15
3.7.1. α‐Glucosidase Inhibition Assay
The α‐glucosidase inhibitory activity was determined using the method reported by Zhang with
some modifications [46]. Briefly, the reaction mixture containing a phosphate buffer (2 mL, 0.1 mol/L,
pH 6.8), α‐glucosidase (0.1 mL, 0.2 U/mL), and the sample solution (1 mL) was incubated at 37 C for
15 min. P‐nitrophenyl‐β‐D‐galactopyranoside (PNPG; 250 L) was then added, followed by further
incubation at 37 C for 30 min. The catalytic reaction was terminated by adding Na2CO3 solution (2
mL, 0.1 mol/L). Acarbose was used as the positive control and the absorbance was measured at 400
nm. The α‐glucosidase inhibition rate was calculated using the following equation:
α‐Glucosidase inhibition rate (%) = [1 – (A2 – A1)/A0] 100% (3)
where A2 is the absorbance of the sample solution, A1 is the absorbance of the PNPG and sample
solution without adding the enzyme, and A0 is the absorbance of PNPG solution with the enzyme
and without the sample.
3.7.2. α‐Amylase Inhibition Assay
α‐amylase inhibitory activity was determined using the method reported by Wang with slight
modifications [8]. Briefly, sample solutions (1 mL) were mixed with α‐amylase (1 mL, 1.0 U/mL) and
incubated for 15 min at 37 °C. A starch solution (1 mL, 1%) was then added, followed by incubation
for a further 10 min at 37 C. The enzyme reaction was stopped by adding 3,5‐dinitrosalicylic acid
(DNS; 2 mL) while heating over a boiling water bath for 5 min. The reaction mixture was diluted by
adding distilled water and the absorbance was measured at 540 nm. Acarbose was used as the
positive control. The α‐amylase inhibition rate was calculated using the following equation:
α‐Amylase inhibition rate (%) = [1 – (A2 – A1)/A0] 100% (4)
where A2 is the absorbance of the sample solution, A1 is the absorbance of the starch and sample
solution without adding the enzyme, and A0 is the absorbance of the starch solution with the enzyme
and without adding the sample.
3.8. Statistical Analysis
All experiments were conducted at least in triplicate and values are expressed as means ±
standard deviation (SD). Statistical analyses were performed using SPSS 19.0 statistical software
(SPSS Inc., Chicago, IL, USA).
4. Conclusions
In the present study, a crude polysaccharide from dandelion was prepared using an ultrasound‐
assisted extraction method, with one purified fraction (PD1‐1) obtained by chromatography using
DEAE–Sepharose fast flow and Sephadex G‐75 columns. The monosaccharide composition showed
that PD1‐1 is an inulin‐type polysaccharide with glucose (52.39%) and mannose (45.41%) as the main
components. Molecular weight analysis showed that PD1‐1 has a molecular weight of 2.6 kDa.
Glycosidic linkage analysis showed that PD1‐1 contains α‐D‐Man/Glcp‐(1→ and →1)‐β‐D‐Man/Glcf‐
(2→ glycosidic linkage conformations. Furthermore, PD1‐1 has a triple‐helix structure and exhibits
important physicochemical properties, including good SC, WHC, and OHC values. Furthermore, the
in vitro antioxidant and hypoglycemic activities of PD1‐1 were determined, showing strong
biological activities that are concentration‐dependent. Therefore, we predict that PD1‐1 could be
widely applied in the pharmaceutical and food industries. However, the in vivo functional properties
of PD1‐1 are still unclear, and research into its in vivo structure–activity relationship is ongoing on.
Supplementary Materials: The following are available online, Figure S1, The calibration curve of dextran
standards and HPGPC of TMP‐1‐1 polysaccharide. Figure S2, GC‐MS diagram of monosaccharide standard and
TMP‐1‐1.
Author Contributions: H.G., G.C., and M.G. conceived and designed the experiments; H.G., and W.Z.Molecules 2019, 24, 1485 13 of 15
performed the experiments; H.G., W.Z., M.G., Y.J., and H.W. analyzed the data; G.C., M.G., Y.J., and H.W.
contributed reagents/materials/analysis tools; H.G., G.C., and M.G. wrote the initial draft; Y.J., and H.W. revised
the manuscript.
Funding: This work was financially supported by the Youth Science and Technology Innovation Leadership
Program (2018CB024).
Acknowledgments: The authors thank the Department of Food of Shihezi University for providing instrumental
facilities.
Conflicts of Interest: The authors declare no conflict of interest.
References
1. Chen, Q.; Shao, X.; Ling, P.; Liu, F.; Han, G.; Wang, F. Recent advances in polysaccharides for osteoarthritis
therapy. Eur. J. Med. Chem. 2017, 139, 926–935.
2. He, J.Y.; Zhang, Y.H.; Ma, N.; Zhang, X.L.; Liu, M.H.; Fu, W.M. Comparative analysis of multiple
ingredients in Rosa roxburghii and R. sterilis fruits and their antioxidant activities. J. Funct. Foods 2016, 27,
29–41.
3. Mzoughi, Z.; Abdelhamid, A.; Rihouey, C.; Cerf, D.L.; Bouraoui, A.; Majdoub, H. Optimized extraction of
pectin‐like polysaccharide from Suaeda fruticosa leaves: Characterization, antioxidant, anti‐inflammatory
and analgesic activities. Carbohydr. Polym. 2018, 185, 127–137.
4. Olennikov, D.N.; Kashchenko, N.I.; Chirikova, N.K.; Koryakina, L.P.; Vladimirov, L.N. Bitter Gentian Teas:
Nutritional and Phytochemical Profiles, Polysaccharide Characterisation and Bioactivity. Molecules 2015,
20, 20014–20030.
5. Li, J.; Shang, W.; Si, X.; Bu, D.; Strappe, P.; Zhou, Z.; Blanchard, C.; Li, J.; Shang, W.; Si, X.
Carboxymethylation of corn bran polysaccharide and its bioactive property. Int. J. Food Sci. Technol. 2017,
52, 1176–1184.
6. Zhang, Z.; Kong, F.; Ni, H.; Mo, Z.; Wan, J.‐B.; Hua, D.; Yan, C. Structural characterization, α‐glucosidase
inhibitory and DPPH scavenging activities of polysaccharides from guava. Carbohydr. Polym. 2016, 144, 106–
114.
7. Monmai, C.; Park, S.H.; You, S.G.; Park, W.J. Immuno‐enhancement effect of polysaccharide extracted from
Stichopus japonicus on cyclophosphamide‐induced immunosuppression mice. Food Sci. Biotech. 2018, 27,
565–573.
8. Wang, L.; Zhang, B.; Xiao, J.; Huang, Q.; Li, C.; Fu, X. Physicochemical, functional, and biological properties
of water‐soluble polysaccharides from Rosa roxburghii Tratt fruit. Food Chem. 2018, 249, 127–135.
9. Wang, Y.; Shu, X.; Chen, Y.; Yan, J.; Zhang, S.; Wu, B.; Jia, J. Enrichment, purification and in vitro antioxidant
activities of polysaccharides from Umbilicaria esculenta macrolichen. Biochem. Eng. J. 2018, 130, 10–20.
10. You, Y.; Yoo, S.; Yoon, H.G.; Park, J.; Lee, Y.H.; Kim, S.; Oh, K.T.; Lee, J.; Cho, H.Y.; Jun, W. In vitro and in
vivo hepatoprotective effects of the aqueous extract from Taraxacum officinale (dandelion) root against
alcohol‐induced oxidative stress. Food Chem. Toxicol. 2010, 48, 1632–1637.
11. Cai, L.; Wan, D.; Yi, F.; Luan, L. Purification, Preliminary Characterization and Hepatoprotective Effects of
Polysaccharides from Dandelion Root. Molecules 2017, 22, 1409–2209.
12. Ivanov, I.; Petkova, N.; Tumbarski, J.; Dincheva, I.; Badjakov, I.; Denev, P.; Pavlov, A. GC‐MS
characterization of n‐hexane soluble fraction from dandelion (Taraxacum officinale Weber ex F.H. Wigg.)
aerial parts and its antioxidant and antimicrobial properties. Z. Naturforsch. C 2017, 73, 41–47.
13. Schütz, K.; Carle, R.; Schieber, A. Taraxacum‐A review on its phytochemical and pharmacological profile.
J. Ethnopharmacol. 2006, 107, 313–323.
14. Astafieva, A.A.; Rogozhin, E.A.; Odintsova, T.I.; Khadeeva, N.V.; Grishin, E.V.; Egorov, T.A. Discovery of
novel antimicrobial peptides with unusual cysteine motifs in dandelion Taraxacum officinale Wigg. flowers.
Peptides 2012, 36, 266–271.
15. Hu, C.; Kitts, D.D. Dandelion (Taraxacum officinale) flower extract suppresses both reactive oxygen species
and nitric oxide and prevents lipid oxidation in vitro. Phytomedicine 2005, 12, 588–597.
16. García‐Carrasco, B.; Fernandez‐Dacosta, R.; Dávalos, A.; Ordovás, J.M.; Rodriguez‐Casado, A. In
vitroHypolipidemic and Antioxidant Effects of Leaf and Root Extracts ofTaraxacum Officinale. Med. Sci.
2015, 3, 38–54.
17. Liu, Y.; Sun, Y.; Huang, G. Preparation and antioxidant activities of important traditional plantMolecules 2019, 24, 1485 14 of 15
polysaccharides. Int. J. Biol. Macromol. 2018, 111, 780–786.
18. Lan, Z.; Yu, H.; Duan, X.; Tang, T.; Shen, Y.; Hu, B.; Liu, A.; Hong, C.; Cheng, L.; Liu, Y. Characterization
and antioxidant activities of polysaccharides from thirteen boletus mushrooms. Int. J. Biol. Macromol. 2018,
113, 1–7.
19. Chawananorasest, K.; Saengtongdee, P.; Kaemchantuek, P. Extraction and Characterization of Tamarind
(Tamarind indica L.) Seed Polysaccharides (TSP) from Three Difference Sources. Molecules 2015, 21,
21060775.
20. Li, N.; Shi, C.; Shi, S.; Wang, H.; Yan, J.; Wang, S. An inulin‐type fructan isolated from Artemisia japonica
and its anti‐arthritic effects. J. Funct. Foods 2017, 29, 29–36.
21. Chandrashekar, P.M.; Harish Prashanth, K.V.; Venkatesh, Y.P. Isolation, structural elucidation and
immunomodulatory activity of fructans from aged garlic extract. Phytochemistry 2011, 72, 255–264.
22. Chen, J.; Cheong, K.; Song, Z.; Shi, Y.; Huang, X. Structure and protective effect on UVB‐induced
keratinocyte damage of fructan from white garlic. Carbohydr. Polym. 2013, 92, 200–205.
23. Jensen, S.L.; Diemer, M.B.; Lundmark, M.; Larsen, F.H.; Blennow, A.; Mogensen, H.K.; Nielsen, T.H.
Levanase from Bacillus subtilis hydrolyses β‐2,6 fructosyl bonds in bacterial levans and in grass fructans.
Int. J. Biol. Macromol. 2016, 85, 514–521.
24. Yang, Y.; Fei, H.; Ming‐Wei, Z.; Rui‐Fen, Z.; Yuan‐Yuan, D.; Zhen‐Cheng, W.; Jing‐Ren, H. Solution
properties and in vitro anti‐tumor activities of polysaccharides from longan pulp. Molecules 2013, 18, 11601–
11613.
25. Jeddou, K.B.; Chaari, F.; Maktouf, S.; Nouri‐Ellouz, O.; Helbert, C.B.; Ghorbel, R.E. Structural, functional,
and antioxidant properties of water‐soluble polysaccharides from potatoes peels. Food Chem. 2016, 205, 97–
105.
26. Chen, Y.; Xie, M.Y.; Nie, S.P.; Li, C.; Wang, Y.X. Purification, composition analysis and antioxidant activity
of a polysaccharide from the fruiting bodies of Ganoderma atrum. Food Chem. 2008, 107, 231–241.
27. Jiang, Y.H.; Jiang, X.L.; Wang, P.; Xiao‐Ke, H.U. In vitro antioxidant activities of water‐soluble
polysaccharides extracted from Isaria farinosa B05. J. Food Biochem. 2010, 29, 323–335.
28. Dan, H.; Ying, G. Comparison of DPPH scavenging ability of flavonoid and polysaccharide from Dandelion
(Taraxacum mongolicum). Animal Husband Feed Sci. 2016, 6, 336–338.
29. Wang, J.; Hu, S.; Nie, S.; Yu, Q.; Xie, M. Reviews on Mechanisms of In Vitro Antioxidant Activity of
Polysaccharides. Oxid. Med. Cell. Longev. 2015, 64, 5692852.
30. Asker, M.M.S.; Shawky, B.T. Structural characterization and antioxidant activity of an extracellular
polysaccharide isolated from Brevibacterium otitidis BTS 44. Food Chem. 2010, 123, 315–320.
31. Ronge, X.; Song, L.; Zhanyong, G.; Huahua, Y.; Pibo, W.; Cuiping, L.; Zhien, L.; Pengcheng, L. Relevance of
molecular weight of chitosan and its derivatives and their antioxidant activities in vitro. Bioorgan. Med.
Chem. 2005, 13, 1573–1577.
32. Jia, X.; Hu, J.; He, M.; Zhang, Q.; Li, P.; Wan, J.; He, C. α‐Glucosidase inhibitory activity and structural
characterization of polysaccharide fraction from Rhynchosia minima root. J. Funct. Foods 2017, 28, 76–82.
33. Meng, Y.; Su, A.; Yuan, S.; Zhao, H.; Tan, S.; Hu, C.; Deng, H.; Guo, Y. Evaluation of total Flavonoids,
Myricetin, and Quercetin from Hovenia dulcis Thunb. As inhibitors of α‐amylase and α‐Glucosidase. Plant
Foods Hum. Nutr. 2016, 71, 1–6.
34. Sevag, M.G.; Lackman, D.B.; Smolens, J. The isolation of the components of streptococcal nucleoproteins in
serologically active form. J. Biol. Chem. 1938, 425–436.
35. Dubois, M.; Gilles, K.A.; Hamilton, J.K.; Rebers, P.A.; Smith, F. Colorimetric method for determination of
sugars and related substances. Anal. Chem. 1956, 28, 350–356.
36. Bradford, M.M. A rapid and sensitive method for the quantitation of microgram quantities of protein
utilizing the principle of protein‐dye binding. Anal. Biochem. 1976, 72, 248–254.
37. Taylor, K.A.; Buchanan‐Smith, J.G. A colorimetric method for the quantitation of uronic acids and a specific
assay for galacturonic acid. Anal. Biochem. 1992, 201, 190–196.
38. Wang, X.; Zhang, Y.; Liu, Z.; Zhao, M.; Liu, P. Purification, Characterization, and Antioxidant Activity of
Polysaccharides Isolated from Cortex Periplocae. Molecules 2017, 22, 1866–1875.
39. Needs, P.W.; Selvendran, R.R. Avoiding oxidative degradation during sodium hydroxide/methyl iodide‐
mediated carbohydrate methylation in dimethyl sulfoxide. Carbohydr. Res. 1993, 245, 1–10.
40. Meng, F.; Li, Q.; Qi, Y.; He, C.; Wang, C.; Zhang, Q. Characterization and immunoregulatory activity of two
polysaccharides from the root of Ilex asprella. Carbohydr. Polym. 2018, 197, 9–16.Molecules 2019, 24, 1485 15 of 15
41. Rout, D.; Mondal, S.; Chakraborty, I.; Islam, S.S. The structure and conformation of a water‐insoluble
(1→3)‐,(1→6)‐β‐d‐glucan from the fruiting bodies of Pleurotus florida. Carbohydr. Res. 2008, 343, 982–987.
42. Ravi Sankar, V.; Dhachinamoorthi, D.; Chandra Shekar, K.B. Formulation and evaluation of novel aspirin
nanoparticles loaded suppositories. J. Chin. Pharmaceut. Sci. 2013, 22, 259–267.
43. Huang, M.J.; Liu, N.; Sun, Y.J.; Chen, X.F. Extrusion modification and hydration properties of three tea
residues. Sci. Technol. Food Indust. 2018, 39, 24–28.
44. Yamaguchi, T.; Takamura, H.; Matoba, T.; Terao, J. HPLC method for evaluation of the free radical‐
scavenging activity of foods by using 1,1‐diphenyl‐2‐picrylhydrazyl. Biosci. Biotechnol. Biochem. 1998, 62,
1201–1204.
45. Cheng, H.; Huang, G. Extraction, characterisation and antioxidant activity of Allium sativum
polysaccharide. Int. J. Biol. Macromol. 2018, 114, 415–419.
46. Wang, H.; Li, Y.; Ren, Z.; Cong, Z.; Chen, M.; Shi, L.; Han, X.; Pei, J. Optimization of the microwave‐assisted
enzymatic extraction of Rosa roxburghii Tratt. polysaccharides using response surface methodology and
its antioxidant and alpha‐d‐glucosidase inhibitory activity. Int. J. Biol. Macromol. 2018, 112, 473–482.
Sample Availability: Samples of the raw material of dandelion are available from the authors.
© 2019 by the authors. Licensee MDPI, Basel, Switzerland. This article is an open access
article distributed under the terms and conditions of the Creative Commons Attribution
(CC BY) license (http://creativecommons.org/licenses/by/4.0/).You can also read