Impact of COVID-19 Lockdown on Physical Activity in a Sample of Greek Adults - MDPI
←
→
Page content transcription
If your browser does not render page correctly, please read the page content below
sports
Article
Impact of COVID-19 Lockdown on Physical Activity
in a Sample of Greek Adults
Dimitrios I. Bourdas 1, *         and Emmanouil D. Zacharakis 2
 1    Department of Sports Medicine & Biology of Exercise, National and Kapodistrian University of Athens,
      Ethnikis Antistasis 41, 17237 Dafni, Greece
 2    School Physical Education and Sport Science, National and Kapodistrian University of Athens,
      Ethnikis Antistasis 41, 17237 Dafni, Greece; emzach@phed.uoa.gr
 *    Correspondence: dbourdas@phed.uoa.gr; Tel.: +30-697-735-8900

 Received: 27 September 2020; Accepted: 19 October 2020; Published: 21 October 2020

 Abstract: It is well known that physical inactivity increases the risk of global death;
 however, the impact of the coronavirus disease 2019 (COVID-19) lockdown strategy on physical
 activity (PA) remains unclear. This study compared PA—i.e., daily occupation, transportation to and
 from daily occupation, leisure time activities, and regular sporting activities—prior (PRE) and during
 (POST) the on-going COVID-19 outbreak in the Greece lockdown environment. A Greek version
 of the web-based Active-Q questionnaire was used to access PA. The questionnaire was filled out
 twice (once each for the PRE and POST conditions) by 8495 participants (age = 37.2 ± 0.2 years
 (95% confidence interval (CI), 36.9–37.5); males = 38.3% (95%CI, 36.7–40.0); females = 61.7%
 (95%CI, 60.4–63.0). The relative frequency of overall sporting activities, which, prior to lockdown,
 occurred at least once per month, and overall participation in competitive sports was significantly
 reduced (8.6% (95%CI, 7.9–9.3) and 84.7% (95%CI, 82.9–86.6) respectively). With the exception of overall
 leisure time activities, which were significantly increased in the POST condition, daily occupational,
 transportation, and sporting activities significant reduced (p < 0.05). Overall PA was reduced in all
 genders, age, body mass index (BMI) and PA level subgroups in the POST condition, and an interaction
 between the males and High PA subgroups was observed. The change in overall PA (from PRE to
 POST conditions) was −16.3% (95%CI, −17.3 to −15.4), while in daily occupational, transportation,
 and sporting activities, it was –52.9% (95%CI, −54.8–51.0), −41.1% (95%CI, −42.8–39.5) and −23.9%
 (95%CI, −25.1–22.8), respectively. Thus, the lockdown period is highly associated with a negative
 change in overall PA. During lockdown, inactivity increased dramatically, with males and the high PA
 population affected significantly more. The decline in PA is a great concern due to possible long-term
 consequences on public health and healthcare system.

 Keywords: cross-sectional; contagious disease; exercise; MET; public health; quarantine;
 questionnaire; SARS-CoV-2; sedentary life

1. Introduction
      Coronavirus disease 2019 (COVID-19) is an ongoing pandemic [1] and, as a natural consequence
of easy airborne contamination, the outbreak has even threatened Greece, with a potential cost in
terms of human lives. In the absence of any vaccine intervention or any pharmaceutical treatment
(for the time being), the only strategy against the spread of COVID-19 seems to be population separation,
reduction of contact, and restriction of movement of people (i.e., quarantine). However, home-based
self-quarantine is not a novel measure against contagious diseases. In ancient Greece, the first historical
report of restrictive guideline measures to stay at home due to unknown communicable diseases took
place in the Attica region, and is dated back to 430 BC, during the Peloponnesian War [2].

Sports 2020, 8, 139; doi:10.3390/sports8100139                                    www.mdpi.com/journal/sports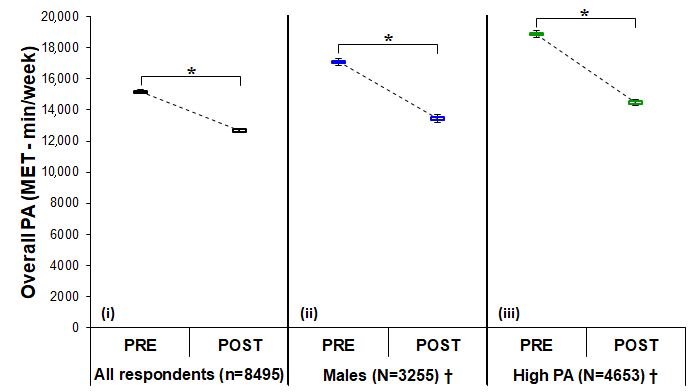
Sports 2020, 8, 139                                                                                   2 of 13

      COVID-19 first appeared in Greece on 26 February 2020, and the number of confirmed cases as
of March 14 was 228 [3]. Following the confirmation of the very first three cases of contamination,
health and state authorities initially issued simple precautionary guidelines and recommendations.
Many citizens failed to comply, and so gradually, from 13 March and strictly from 23 March to 4 May
(41 days overall), lockdown was applied nationwide. Movement outside of the house was permitted
only for specific reasons, that including moving to or from the workplace, shopping for food or
medicine, visiting a doctor or assisting a person in need for help, and exercising outside individually
or in pairs.
      The paradox is that while self-isolation and drastic restriction of citizens’ free movement and
contact can reduce the risk of virus transmission in the community, at the same time, there is the
possibility that the a potential reduction in physical activity (PA) and daily energy expenditure (EE) could
create conditions for the development of other non-communicable diseases (NCDs) and an uptick in
preventable death rates [4–8], as well as exacerbate behaviors that lead to further physical inactivity and a
more sedentary lifestyle, potentially contributing to anxiety, depression, and a deleterious psychological
impact [9]. Psychological stress symptoms are increasing as the pandemic continues [9] and are creating
imbalances between cortisol and other hormones that have an adverse effect on the immune system
and inflammation [10]. On the contrary, PA improves immune function, either after vaccination or in
chronic systemic inflammation and various diseases [11–13]. Being physically active has significant
mental health benefits, reduces symptoms of depression and anxiety (such as in relation to the
stress caused by the pandemic), and restores cortisol balance [14]. Moreover, in ≥65-year-old age
groups, PA and regular exercise have positive effects on aging characteristics and related diseases,
can improve self-esteem and cognitive function, can decrease the risk of falls, and can act to prevent
frailty, sarcopenia, and dynapenia [15].
      The World Health Organization (WHO) considers PA surveillance an indispensable national
public health function [16]. However, currently, there is a lack of empirical data showing that mandated,
stay-at-home restrictions affect PA in Greece. Even though we have speculated regarding an increased
level of physical inactivity, we do not know the empirical impact of the lockdown on citizens’ PA levels.
Additionally, we do not know if gender, age, body mass index (BMI), or PA level (pre-coronavirus
outbreak) have an interaction effect. In this sense, a valid assessment of PA is essential for assessing
strategies that promote PA, and for surveying and comparing PA levels between different conditions,
such us prior to and during the COVID-19 crisis.
      Paper questionnaires are commonly used as a tool to assess PA in large epidemiologic studies.
Nevertheless, given the threat of coronavirus and the social distancing or self-isolation requirements,
as an attempt to keep the disease from spreading by minimizing close contact between individuals,
paper questionnaires seem inappropriate for the time being. Alternatively, the use of web-based
questionnaires has profound advantages [17]. With this in mind, this study aimed to explore any
changes in PA that may have been brought on by the new reality after the “imposition of a temporary
restriction on citizens’ traffic in Greece” (lockdown) by using a validated web-based questionnaire.
Such data will be of paramount importance in assisting health service plans, determining public health
priorities, and preventing inactivity.

2. Methods
      This study was approved by the National and Kapodistrian University of Athens review board
(approval protocol number: 1181/02-04-2020). All participants were given written information about
the study and informed consent was provided prior to their voluntary participation. The self-eligibility
participation criteria were as follows: (1) aged 18 or above, (2) resident of Greece, and (3) with access
to the Internet. Meanwhile, the self-exclusion criteria were as follows: (1) any form of illness,
(2) strict weight loss control program participation, and (3) pregnancy or childbirth within one year
prior to the start of the study.
Sports 2020, 8, 139 3 of 13
2.1. Survey Instrument
The revised version of Active-Q, a self-reported, web-based, interactive PA questionnaire assessing
habitual activity in adults older than 18 years, was used [18]. Active-Q has been previously validated
against doubly labeled water and an accelerometer and has been adequately described elsewhere [18,19].
Prior to the initiation of the study, the original Active-Q (English version) was translated to Greek by two
professional translators unaware of the purpose of the study, and then independently back-translated
by two technical experts. Any disagreement was resolved by discussion between the translators and
technical experts and a consensus was reached. Furthermore, four additional items (i.e., questions)
on gender, age, weight, and height were also included [20]. Afterward, Active-Q was freely shared
nationwide, and participants were openly invited via social media-hosted links (including public
advertisements) or email (snowball distribution strategy).
Overall, the questionnaire comprised 9–46 items, dependent on previous answers and follow-up
patterns, designed to assess the frequency and duration of PA across a week. Participants stated
their usual PA in four main domains (see Table S1): Daily occupation, transportation to and from
daily occupation, leisure time activities, and regular sporting activities. Concisely, all items had a
fixed set of answers regarding frequency and duration [18,19] except the questions regarding age,
weight, and height. The questionnaire began with a screening question assessing employment status
(No/Yes) [18,19], so that for those respondents who stated that they were not working, the upcoming
items concerning PA at work were omitted. The opening item in the domains of transportation means,
leisure time activities, and sporting activities consisted of screening questions listing all of the activities
included in each domain [18,19]. Answers regarding frequency and duration were accepted only for
those activities that had been selected by the participants in the screening questions.
2.2. Data Collection Procedure
Adults living in Greece were recruited to participate in this study within the period of March
to April 2020, which coincided with the very initial stages of the outbreak of COVID-19 and
the period of lockdown applied by the authorities. Participants filled out the questionnaire in
a double administration fashion at the same time; from here on, in this paper, references to
Active-Q will be presume as much (i.e., double administration fashion), unless otherwise stated.
The first admission refers to March 2020 (first two weeks; i.e., PA under normal life conditions from
1 to 14 March) prior to the COVID-19 lockdown (PRE condition). The second admission refers to
April 2020 (from 4 to 9 April; i.e., PA under lockdown conditions) after the appearance of COVID-19
(POST condition). Data collection took place from 4 to 19 April 2020 (15 days overall). The total time
of any PA reported in the Active-Q and in each domain was calculated. All activities were linked
to a corresponding metabolic equivalent task (MET) value according to the updated version of the
2011 Compendium of Physical Activities (see Table S1) [21]. Continuously, for each PA duration
(min/week), the EE scored in the METs was calculated (e.g., PA of 4 METs × 30 min/day × 2 times per
week = 240 MET-min/week). Participants (Table 1) were classified into five ages, four BMI classes PRE
condition (Table 2), and four PA categories based on their sport and exercise activities.Sports 2020, 8, 139 4 of 13
Table 1. Anthropometric characteristics of the participants (n = 8495).
Mean ± SE (95% CI)
Age (years) 37.2 ± 0.2 (36.9–37.5)
Males 42.1 ± 0.2 (41.6–42.5)
Females 34.2 ± 0.2 (33.8–34.5)
Height (m) 171.5 ± 0.1 (171.3–171.7)
Males 179.9 ± 0.1 (179.6–180.1)
Females 166.3 ± 0.1 (166.1–166.5)
Weight (kg) 73.0 ± 0.2 (72.7–73.4)
Males 85.6 ± 0.3 (85.1–86.1)
Females 65.2 ± 0.2 (64.9–65.6)
BMI (kg/m2 ) 24.7 ± 0.1 (24.6–24.8)
Males 26.4 ± 0.1 (26.3–26.6)
Females 23.6 ± 0.1 (23.5–23.7)
Abbreviations: BMI, body mass index; CI, confidence interval.
Table 2. Frequency, relative frequency (%), and 95%CI of participants subgrouped by gender,
age, and BMI, (n = 8495).
Frequency (%) (95% CI)
Gender
Males 3255 (38.3) (36.7–40.0)
Females 5240 (61.7) (60.4–63.0)
Age classes
Young (18–29 years) 3210 (37.8) (36.1–39.5)
Adults (30–49 years) 3277 (38.6) (36.9–40.3)
Middle-Age Adults (50–59 years) 1639 (19.3) (17.4–21.2)
Old Adults (60–69 years) 336 (4.0) (1.9–6.1)
70+ (≥70 years) 33 (0.4) (0.0–2.5)
Young (18–29-year-old males) 731 (22.5) (19.4–25.5)
Adults (30–49-year-old males) 1398 (43.0) (40.4–45.5)
Middle-age adults (50–59-year-old males) 874 (26.9) (23.9–29.8)
Old adults (60–69-year-old males) 225 (6.9) (3.6–10.2)
70+ (≥70-year-old males) 27 (0.8) (0.0–4.3)
Young (18–29-year-old females) 2479 (47.3) (45.3–49.3)
Adults (30–49-year-old females) 1879 (35.9) (33.7–38.0)
Middle-age adults (50–59-year-old females) 765 (14.6) (12.1–17.0)
Old adults (60–69-year-old females) 111 (2.1) (0.0–4.8)
70+ (≥70-year-old females) 6 (0.1) (0.0–2.8)
BMI classes (kg/m2 )
Underweight (BMISports 2020, 8, 139 5 of 13
2.3. Data Analysis
The qualitative variables are reported as frequency or/and relative frequency (%),
and quantitative variables as mean ± SE and 95% confidence interval (CI), unless otherwise stated.
Chi-squared tests were used to determine whether there was a statistically significant difference
in frequency between the PRE and POST conditions, followed by post hoc analysis [22] in cases
where a significant difference was found. Independent t-tests were used for comparing data
between different groups, while dependent t-tests were used for comparing PA in the same group
under different conditions. One-way ANCOVA was also used to determine whether there were
any significant differences in the PA-adjusted means of the POST condition (i.e., adjusted for
the PRE condition covariate) between the independent subgroups (by gender, age, BMI classes,
or PA levels), followed by post hoc analysis (Bonferroni pairwise comparisons) in cases where a
significant difference was found. The level of significance was set at p ≤ 0.05 (two-sided) a priori
(analyses were done with SPSS for windows v23, IBM Corp., Armonk, NY, USA). Furthermore,
because no previous study has been conducted using a similar design, an a priori sample size
estimate of >1073 was determined based on a 95%CI, 95% power, and an expected effect size
of >0.1 (small) for the mandated, stay-at-home restrictions on PA (estimation was done with
G*Power software, version 3.1.9.2, Heinrich-Heine-University Dusseldorf, Dusseldorf, Germany).
Moreover, in a preliminary study, the reliability of the Greek version of Active-Q per se recalling data
from the recent past (i.e., single administration fashion, two times in separate periods) was tested
in 115 subjects. The mean differences between the two admissions were at an acceptable level of
219.4 ± 1450.9 (SD) with a 95%CI according to the Bland Altman plot [23]; the limits of agreement
(−2624.4 to 3063.2 = ±1.96 SD) were small enough to consider the Active-Q reliable (see Figure S1).
3. Results
In total, 8495 individuals participated in this study. The frequency, the relative frequency (%),
and the 95%CI of the participants subgrouped by gender, age, and BMI are presented in Table 2.
Table 3 presents the frequency, the relative frequency (%), and the 95%CI of the weekly activity data
by PA levels in participants in the PRE and POST conditions. The frequencies in the occupation and
transportation activities of the majority of participants were significantly negatively affected by the
restriction measures (Table 3). The relative frequencies of overall sporting or exercise activities of
participants who PRE had experienced said activity at least once per month were significantly reduced
by 8.6% (95%CI, 7.9–9.3) during the quarantine period. Moreover, the relative frequency of overall
participation in competitive sports of 16.9% (95%CI, 15.0–18.9) in the PRE condition nearly reached a
nadir in the middle of April (2.6% (95%CI, 0.5–4.7)).
Table 3. Frequency, relative frequency (%), and 95%CI of the weekly activity data by PA levels in
participants in the PRE and POST conditions (n = 8495).
PA Levels PRE Frequency (%) (95% CI) POST Frequency (%) (95% CI)
Inactive (0 MET-min/week) * 1689 (19.9) (18.0–21.8) 2374 (28.0) (26.1–29.8)
Low PA (0–499 MET-min/week) 1190 (14.0) (12.0–16.0) 1232 (14.5) (12.5–16.5)
Moderate PA (500–1000 MET-min/week) * 963 (11.3) (9.3–13.3) 842 (9.9) (7.9–11.9)
High PA (>1000 MET-min/week) * 4653 (54.8) (53.3–56.2) 4047 (47.6) (46.1–49.2)
Inactive (0 MET-min/week males) * 579 (17.8) (14.7–20.9) 912 (28.0) (25.1–30.9)
Low PA (0–499 MET-min/week males) * 336 (10.3) (7.1–13.6) 420 (12.9) (9.7–16.1)
Moderate PA (500–1000 MET-min/week males) 309 (9.5) (6.2–12.8) 300 (9.2) (6.0–12.5)
High PA (>1000 MET-min/week males) * 2031 (62.4) (60.3–64.5) 1623 (49.9) (47.4–52.3)
Inactive PA (0 MET-min/week females) * 1110 (21.2) (18.8–23.6) 1462 (27.9) (25.6–30.2)
Low PA (0–499 MET-min/week females) 854 (16.3) (13.8–18.8) 812 (15.5) (13.0–18.0)
Moderate PA (500–1000 MET-min/week females) * 654 (12.5) (10.0–15.0) 542 (10.3) (7.8–12.9)
High PA (>1000MET-min/week females) * 2622 (50.0) (48.1–52.0) 2424 (46.3) (44.3–48.2)
* p < 0.05, significant difference between PRE and POST conditions. Abbreviations: CI, confidence interval; MET,
metabolic equivalent task; PA, physical activity.Sports 2020, 8, 139 6 of 13
The physical activity results in terms of the Active-Q domains and overall PA data from
all subgroups in the PRE and POST conditions are presented in Table 4. With the exception of
overall leisure time activities, in which EE significantly increased in the POST condition (Table 4),
the EE was significantly reduced in the POST condition (i.e., daily occupational, transportation,
and sporting activities) (Table 4). The frequency of inactivity significantly increased by 40.6% (95%CI,
38.3–42.9) in the POST condition, while the frequency of moderate and high PA was significantly
reduced, by 12.6% (95%CI, 10.5–14.7) and 13.0% (95%CI, 12.0–14.0), respectively (Table 3). In the study
population, overall PA was reduced significantly in the POST condition, as well as across the gender,
age, BMI and High PA level subgroups (Table 4). Furthermore, the one-way ANCOVA tests revealed
that overall PA in the POST condition was significantly affected by gender and PA level. The post hoc
analysis revealed a significant interaction between males and the High PA subgroups (Table 5 and
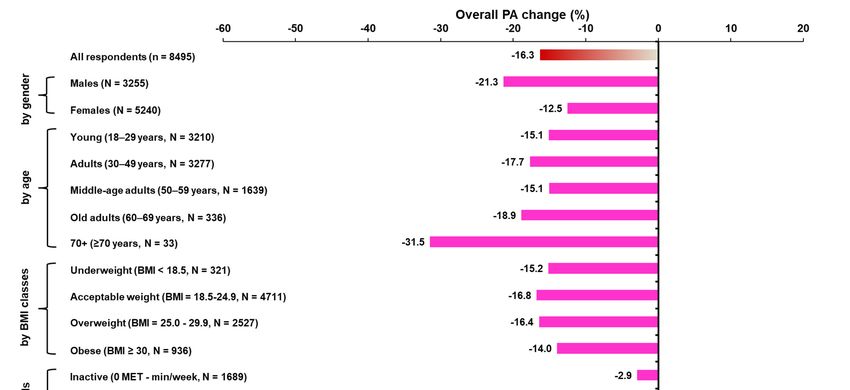
Figure 1). The change in overall PA (%, from the PRE to POST conditions) on a weekly basis by all
respondents, by all subgroups, and by Active-Q domain activities is depicted in Figure 2. Specifically,
the 95%CI of the change in overall PA (from the PRE to POST conditions) was −17.3 to −15.4 in
all participants, −23.1 to −19.6 in males, −13.5 to −11.5 in females, and −24.9 to −21.8 in High PA
respondents (Figure 2). Moreover, the 95%CI of the change in overall PA (from the PRE to POST
conditions) in daily occupational, transportation, and sporting activities was −54.8 to −51.0, −42.8 to
−39.5 and −25.1 to −22.8, respectively (Figure 2). The only positive change in overall PA (from the PRE
to POST conditions) was observed in leisure time activities (95%CI, 17.9–19.7; Figure 2).
Table 4. Physical activity data a by Active-Q domains and overall PA data a by gender, age, BMI, and
PA levels in the PRE and POST conditions, (n = 8495).
PRE (MET-Min/Week) POST (MET-Min/Week)
Domains
Daily occupation * 4502.7 ± 41.5 (4421.2–4584.1) 2119.4 ± 32.1 (2056.6–2182.3)
Transportation * 1277.7 ± 12.7 (1252.1–1302.0) 751.6 ± 10.7 (730.5–772.7)
Leisure time activities * 6266.6 ± 69.3 (6130.8–6402.3) 7445.7 ± 70.2 (7308.0–7583.3)
Sporting activities * 3114.3 ± 75.5 (2966.2–3262.3) 2369.0 ± 68.8 (2234.2–2503.8)
Daily occupation (males) * 5232.3 ± 72.8 (5089.3–5374.8) 2552.2 ± 58.5 (2437.5–2666.9)
Transportation (males) * 1442.3 ± 22.3 (1398.6–1486.0) 888.3 ± 19.4 (850.3–926.2)
Leisure time activities (males) * 6186.7 ± 117.3 (5956.8–6416.7) 7125.8 ± 118.0 (6894.3–7357.2)
Sporting activities (males) * 4227.1 ± 166.4 (3900.8–4553.4) 2874.4 ± 149.2 (2581.9–3166.8)
Daily occupation (females) * 4049.6 ± 48.9 (3953.8–4145.4) 1850.6 ± 36.7 (1778.7–1922.5)
Transportation (females) * 1174.4 ± 15.1 (1144.7–1204.1) 666.7 ± 12.5 (642.3–691.1)
Leisure time activities (females) * 6316.2 ± 85.5 (6148.6–6483.7) 7644.3 ± 87.0 (7473.9–7814.8)
Sporting activities (females) * 2423.0 ± 63.8 (2298.0–2548.0) 2055.1 ± 61.7 (1934.2–2176.0)
All respondents * 15,160.6 ± 128.6 (14,908.5–15,412.6) 12,685.7 ± 120.0 (12,450.4–12,921.0)
Males * 17,088.2 ± 244.6 (16,608.5–17,567.8) 13,440.6 ± 237.4 (12,975.1–13,906.2)
Females * 13,963.2 ± 140.2 (13,688.3–14,238.0) 12,216.7 ± 126.6 (11,968.6–12,464.8)
Age classes
Young (18–29 years) * 14,406.0 ± 212.3 (13,989.7–14,822.4) 12,230.7 ± 226.3 (11,787.1–12,674.3)
Adults (30–49 years) * 15,668.9 ± 209.7 (15,257.8–16,080.0) 12,894.9 ± 168.0 (12,565.4–13,224.4)
Middle-age adults (50–59 years) * 15,833.7 ± 284.0 (15,276.7–16,390.8) 13,449.1 ± 248.4 (12,961.8–13,936.3)
Old adults (60–69 years) * 14,402.3 ± 547.4 (13,325.5–15,479.8) 11,682.2 ± 596.0 (10,509.8–12,854.6)
70+ (≥70 years) * 12,364.3 ± 1535.2 (9237.1–15,491.5) 8472.6 ± 949.4 (6538.7–10,406.5)
BMI classes
14,106.3 ± 1053.3
Underweight (BMI < 18.5) * 16,626.9 ± 946.2 (14,765.3–18,488.5)
(12,034.0–16,178.7)
Acceptable weight (BMI = 18.5–24.9) * 15,288.2 ± 174.0 (14,947.0–15,629.4) 12,720.7 ± 165.5 (12,396.2–13,045.1)
Overweight (BMI = 25.0–29.9) * 15,022.1 ± 208.9 (14,612.5–15,431.7) 12,552.6 ± 196.4 (12,167.5–12,937.7)
Obese (BMI ≥ 30) * 14,389.2 ± 412.7 (13,579.2–15,199.2) 12,381.8 ± 284.9 (11,822.6–12,941.0)
PA levels
Inactive (0 MET-min/week) 10,792.0 ± 170.7 (10,457.2–11,126.8) 10,477.3 ± 175.6 (10,132.8–10,821.7)
Low PA (0–499 MET-min/week) 10,204.5 ± 179.0 (9853.2–10,555.7) 10,446.0 ± 224.8 (10,005.0–10,887.0)
Moderate PA (500–1000 MET-min/week) 10,993.4 ± 184.2 (10,631.9–11,355.0) 10,691.1 ± 203.8 (10,291.1–11,090.9)
High PA (>1000 MET-min/week) * 18,876.3 ± 202.9 (18478.6–19,274.0) 14,472.9 ± 193.3 (14093.9–14,851.9)
aData are presented as mean ± SE (95% Confidence Interval). * p < 0.05, significant difference between the PRE and
POST conditions. Abbreviations: BMI, body mass index; MET, metabolic equivalent task (=3.5 mLO2 /kg/min); PA,
physical activity.Sports 2020, 8, x FOR PEER REVIEW 7 of 13
SportsTable
2020, 8,5.139
Overall PA estimatesin the POST condition by gender, age, BMI and PA levels, adjusted7 of 13
a
for the PRE condition covariate values (n = 8495).
Table 5. Overall PA estimates a in the POST condition by gender,(MET-Min/Week)
age, BMI and PA levels, adjusted for
the PRE condition covariate values (n = 8495).
Gender
Males * 12,370.6 ± 157.1 (12,062.7–12,678.6)
(MET-Min/Week)
Females 12,881.4 ± 123.6 (12,639.1–13,123.6)
Gender
Age classes
Males * 12,370.6 ± 157.1 (12,062.7–12,678.6)
Young (18–29 years)
Females 12,647.0±±123.6
12,881.4 157.5(12,639.1–13,123.6)
(12,338.2–12,955.8)
Adults (30–49 years) 12,614.5 ± 155.8 (12,309.0–12,919.9)
Age classes
Middle-age adults (50–59
Young years)
(18–29 years) 13,077.7±±157.5
12,647.0 220.3(12,338.2–12,955.8)
(12,645.7–13,509.6)
Old adults (60–69
Adults years)
(30–49 years) 12,100.5±±155.8
12,614.5 486.5(12,309.0–12,919.9)
(11,146.8–13,054.3)
Middle-age
70+ (≥70 years)adults (50–59 years) 13,077.7 ± 220.3 (12,645.7–13,509.6)
10,015.4 ± 1552.5 (6,972.1–13,058.8)
BMI classes (60–69 years)
Old adults 12,100.5 ± 486.5 (11,146.8–13,054.3)
70+ (≥70 years) 10,015.4 ± 1552.5 (6972.1–13,058.8)
Underweight (BMI < 18.5) 13,296.6 ± 498.0 (12,320.3–14,272.8)
Acceptable weight (BMI BMI=classes
18.5–24.9) 12,650.2 ± 130.0 (12,395.4–12,905.0)
Underweight (BMI < 18.5) 13,296.6 ± 498.0 (12,320.3–14,272.8)
Overweight (BMI = 25.0–29.9)
Acceptable weight (BMI = 18.5–24.9)
12,629.1 ± 177.5 (12,281.2–12,976.9)
12,650.2 ± 130.0 (12,395.4–12,905.0)
Obese (BMI ≥ 30)
Overweight (BMI = 25.0–29.9) 12,807.7±±177.5
12,629.1 291.6(12,281.2–12,976.9)
(12,236.0–13,379.4)
PA levels
Obese (BMI ≥ 30) 12,807.7 ± 291.6 (12,236.0–13,379.4)
Inactive (0 MET-min/week)
PA levels 12,933.2 ± 220.2 (12,501.5–13,364.9)
Low PA (0–499 MET-min/week)
Inactive (0 MET-min/week) 13,232.1±±220.2
12,933.2 262.0(12,501.5–13,364.9)
(12,718.5–13,745.8)
Low PA (0–499
Moderate PA (500–1000 MET-min/week)
MET-min/week) 13,033.7±±262.0
13,232.1 289.6(12,718.5–13,745.8)
(12,466.1–13,601.3)
Moderate PA (500–1000 MET-min/week) 13,033.7 ± 289.6 (12,466.1–13,601.3)
High PA (>1000 MET-min/week) * 12,384.1 ± 134.6 (12,120.1–12,648.0)
High PA (>1000 MET-min/week) * 12,384.1 ± 134.6 (12,120.1–12,648.0)
aEstimates are presented as mean ± SE (95% Confidence Interval). * p < 0.05, significant interaction
a Estimates are presented as mean ± SE (95% Confidence Interval). * p < 0.05, significant interaction effect of lockdown
effect of lockdown
on PA subgroups. on PA subgroups.
Abbreviations: Abbreviations:
BMI, body mass BMI, body
index; MET, metabolic masstask
equivalent index;
(=3.5 MET, metabolic
mLO2 /kg/min); PA,
equivalent task (=3.5 mLO2/kg/min); PA, physical activity.
physical activity.
Figure 1.
Figure OverallPA
1. Overall PA in
in the
the PRE
PRE and
and POST
POSTconditions
conditionsfor forall
allrespondents
respondents(i),
(i),males
males(ii),
(ii),and
andHigh
HighPA
PA
respondents (iii). Data are presented as mean ± SE. * p < 0.05, significant difference in all
respondents (iii). Data are presented as mean ± SE. * p < 0.05, significant difference in all groupsgroups between
conditions.
between † p< 0.05,†significant
conditions. interaction interaction
p< 0.05, significant effect of lockdown
effect ofonlockdown
the PA subgroups.
on the PA Abbreviations:
subgroups.
MET, metabolicMET,
Abbreviations: equivalent
metabolictaskequivalent 2 /kg/min);
(=3.5 mLOtask PA, physical
(=3.5 mLO 2/kg/min);activity.
PA, physical activity.Sports 2020, 8, 139 8 of 13
Sports 2020, 8, x FOR PEER REVIEW 8 of 13
Figure2.2.Change
Figure Changeininoverall
overallPA
PAchange
change(%,
(%,from
fromthe
thePRE
PREtotoPOST
POSTconditions)
conditions)onona aweekly
weeklybasis
basisininall
all
respondents, grouped by gender, age, BMI, PA level, and Active-Q domain activities. Abbreviations:
respondents, grouped by gender, age, BMI, PA level, and Active-Q domain activities. Abbreviations:
BMI,
BMI,body
bodymass
massindex;
index;MET,
MET,metabolic
metabolicequivalent
equivalenttask
task(=3.5
(=3.5mLO
mLO2 /kg/min);
2/kg/min);PA,
PA,physical
physicalactivity.
activity.
4. Discussion
4. Discussion
Though it is well documented that high PA significantly contributes to preventing NCDs and
Though it is well documented that high PA significantly contributes to preventing NCDs and
reducing mortality risk factors worldwide, while PA deficiency increases the risk factors of NCDs,
reducing mortality risk factors worldwide, while PA deficiency increases the risk factors of NCDs, it
it was unknown to what extent lockdown, as a measure against the spread of COVID-19, impaired PA.
was unknown to what extent lockdown, as a measure against the spread of COVID-19, impaired PA.
In our study, it was hypothesized that PA would be negatively affected by the mandated, stay-at-home
In our study, it was hypothesized that PA would be negatively affected by the mandated,
restrictions. It was found that, indeed, PA changes of −52.9%, −41.1%, and −23.9% occurred in daily
stay-at-home restrictions. It was found that, indeed, PA changes of −52.9%, −41.1%, and −23.9%
occupational, transportation, and sporting activities, respectively, while an excess of leisure time
occurred in daily occupational, transportation, and sporting activities, respectively, while an excess
activities, with an 18.8% uptick, was observed. The change in overall PA was −16.3%, which in exercise
of leisure time activities, with an 18.8% uptick, was observed. The change in overall PA was −16.3%,
terms (in this case) corresponds to ~60 min running at an intensity of 8 kmph five times per week [21].
which in exercise terms (in this case) corresponds to ~60 min running at an intensity of 8 kmph five
Another finding was the significant interaction effect of lockdown on males and the High PA subgroup
times per week [21]. Another finding was the significant interaction effect of lockdown on males and
on overall PA and a significantly increased frequency by 40.6% of inactivity in the POST condition.
the High PA subgroup on overall PA and a significantly increased frequency by 40.6% of inactivity
According to the national housing census revision, Greece’s resident population is 10,816,286
in the POST condition.
(adults: 80.3%), of which 49.0% are male and 51.0% are female, with a median age range of
According to the national housing census revision, Greece’s resident population is 10,816,286
30–44 years [24]. The prevalence of overweight and obese people among Greek adults was estimated
(adults: 80.3%), of which 49.0% are male and 51.0% are female, with a median age range of 30–44
to be 59.7% and 20.4% for males and 47.9% and 19.9% for females, respectively [25]. Our study group
years [24]. The prevalence of overweight and obese people among Greek adults was estimated to be
shares similar demographic and anthropometric characteristics, with the exception of the female
59.7% and 20.4% for males and 47.9% and 19.9% for females, respectively [25]. Our study group
subgroup, where the prevalence of overweight and obesity appears to be lower in comparison to the
shares similar demographic and anthropometric characteristics, with the exception of the female
WHO 2008 estimates [25].
subgroup, where the prevalence of overweight and obesity appears to be lower in comparison to the
In the European Union and Greece, 54.0% and 32.0% of people, respectively, tend to practice
WHO 2008 estimates [25].
sports or exercise regularly or even seldomly [26]. In the present study, 73.8% of the participants
In the European Union and Greece, 54.0% and 32.0% of people, respectively, tend to practice
declared that, prior to the COVID-19 pandemic, they practiced sports or exercise at least once a month,
sports or exercise regularly or even seldomly [26]. In the present study, 73.8% of the participants
and only 67.5% reported doing so during lockdown. Alongside these findings, a dramatic decrease of
declared that, prior to the COVID-19 pandemic, they practiced sports or exercise at least once a
84.7% (95%CI, 82.9–86.6) in the frequency of competition sports activities was observed. Concerning
month, and only 67.5% reported doing so during lockdown. Alongside these findings, a dramatic
adults’ PA in Greece, the inactivity estimation rose to 41.0% (males 37.0% and females 44.0%) with
decrease of 84.7% (95%CI, 82.9–86.6) in the frequency of competition sports activities was observed.
Concerning adults’ PA in Greece, the inactivity estimation rose to 41.0% (males 37.0% and females
44.0%) with only 21.0% of the population considered sufficiently active; however, currently, there isSports 2020, 8, 139 9 of 13
only 21.0% of the population considered sufficiently active; however, currently, there is a great lack of
empirical data demonstrating PA [27,28]. In this regard, the present study is the first to assess the rate
of inactivity among Greek residents. In total, the relative frequency of inactivity and low PA prior to
COVID-19 were 19.9% and 14.0%, respectively. While these observations seem to situate Greece in the
less-sufficient PA countries in the European Union [27], surprisingly, 54.8% of the study population
was observed to engage in high PA in terms of sporting activities. This outcome is believed to have
resulted from over-reporting PA levels, which was also highlighted as a limitation in a recent relevant
Italian study, where the reliable IPAQ questionnaire was used [29]. For that reason, we mainly focused
on investigating the change in PA (from the PRE to POST conditions) reported at the same time point.
Similar to our results, a negative change in PA during lockdown was also observed
in Australian students and Belgian (Sports 2020, 8, 139 10 of 13
overcoming the consequences of the COVID-19 pandemic in many ways, especially for vulnerable
groups (e.g., those with underlying conditions, such as diabetes, cardiovascular disease, chronic lung
disease, hypertension, cancer, and excess body fat, and for those aged ≥65 years) [37].
Limitations
The findings of this study must be interpreted in the light of some limitations. The first limitation
concerns the selection bias derived from the web-based method of data collection. Due to the severity
of the current situation, time constraints, and the urgent need to complete the study, we addressed
our questionnaire only to the Internet-accessible population. However, fewer than eight out of
ten Greek households (78.5%) have Internet access at home [38]. The second limitation is the
use of a questionnaire to asses PA as an alternative to a direct measurement (gold standard).
We could not have predicted the impending global outbreak of COVID-19, so it was impossible
to assess PA beforehand and then to re-assess it after the outbreak. Furthermore, under the COVID-19
pandemic conditions, it was not feasible to measure PA directly in daily life, so we used the Active-Q
instead to explore changes in PA from the PRE to POST conditions. Another limitation of this
study is that our data revealed consequences of only the two middle weeks out of a total six-week
lockdown period and cannot be projected to the full social isolation period. Although we made
every effort to use any available social media in order to ensure questionnaire respondents were
more representative, a major limitation of this study may be that our sample group is not nationally
representative of the adult population. There seems to be an over-representation of female and young
female respondents, while the 70+ subgroup of the study was not representative. The PRE PA levels of
both sex subgroups also suggest that the sample was skewed toward more physically active younger
people, who either had over-reported PA or quite possibly had a relatively higher participation in social
media networks and/or a higher socioeconomic status, potentially diminishing the generalizability
of the results. However, we believe that this study is the first to clearly demonstrate the impact of
lockdown on PA in a sample of Greek adults, as well as the first work in the literature that shows the
impact of lockdown on different PAs separately (i.e., daily occupation, transportation to and from
daily occupation, leisure time activities, and regular sporting activities). In addition, this study was
exploratory and environmental, socioeconomic status, educational level, psychological, or other factors
may have, separately or in combination, affected the population’s PA levels, thus generating further
hypotheses for future research.
5. Conclusions
The Greek measures were among the most proactive and strictest in Europe in an effort to slow
down the spread of COVID-19. Nevertheless, the present study empirically demonstrated that the
imposition of a temporary lockdown in Greece is highly associated with negative changes in PA in
terms of daily occupational, transportation, and sporting activities, with an overall change in PA of
−16.3% (95%CI, −17.3 to −15.4). Another important highlight of this study is that during lockdown,
inactivity increased overall, yet unequally, with the cohort of male and high PA respondents affected
significantly more. Thus, it is obvious that the preexisting PA guidelines from the WHO that were
uploaded on some Greek official public health authority sites failed to sufficiently promote overall PA.
Furthermore, the decline PA suggests possible long-term consequences on the evolution rate of NCDs,
general public health, and healthcare systems, which is a societal concern and requires further research.
Supplementary Materials: The following are Available online at http://www.mdpi.com/2075-4663/8/10/139/s1,
Table S1: Items included in Active-Q questionnaire by domain activities and corresponding MET values, Figure S1:
Difference between PA value of the first and second admission of Active-Q against their mean, (n = 115).
The mean difference (∆) is 219.37 ± 1450.91SD with a 95% CI; the limits of agreement (−2624.42–3063.15 = ±1.96SD)
are small enough to consider the test reliable. CI = confidence interval; PA = physical activity.Sports 2020, 8, 139 11 of 13
Author Contributions: Conceptualization, D.I.B.; methodology, D.I.B. and E.D.Z.; investigation, D.I.B. and E.D.Z.;
validation, D.I.B. and E.D.Z.; formal analysis, D.I.B.; resources, D.I.B.; writing—original draft preparation, D.I.B.
and E.D.Z.; writing—review & editing preparation, D.I.B. and E.D.Z.; supervision, D.I.B.; project administration
D.I.B. All authors agreed with the order of presentation of the authors. All authors have read and agreed to the
published version of the manuscript.
Funding: The authors received no specific funding for this work.
Acknowledgments: The authors would like to thank all of the volunteers for their participation in this research
project and for kindly sharing their personal information.
Conflicts of Interest: The authors declare no potential conflicts of interest with respect to the research, authorship,
and/or publication of this article.
References
1. WHO. WHO Director-General’s Opening Remarks at the Media Briefing on COVID. 2020.
Available online: https://www.who.int/dg/speeches/detail/who-director-general-s-opening-remarks-at-the-
media-briefing-on-covid-19---11-march-2020 (accessed on 23 April 2020).
2. Thucydides: History of the Peloponnesian War; Volume I, Books 1–2, Loeb Classical Library 108;
Harvard University Press: Cambridge, MA, USA, 1919; pp. 47–54.
3. Wikipedia Contributors, “COVID-19 Pandemic in Greece,” Wikipedia, the Free Encyclopedia.
Available online: https://en.wikipedia.org/w/index.php?title=COVID-19_pandemic_in_Greece&oldid=
982670833 (accessed on 10 October 2020).
4. Booth, F.W.; Roberts, C.K.; Laye, M.J. Lack of exercise is a major cause of chronic diseases. Compr. Physiol.
2012, 2, 1143–1211. [CrossRef]
5. Durstine, J.L.; Gordon, B.; Wang, Z.; Luo, X. Chronic disease and the link to physical activity. J. Sport
Health Sci. 2013, 2, 3–11. [CrossRef]
6. Lopez, A.D.; Mathers, C.D.; Ezzati, M.; Jamison, D.T.; Murray, C.J. Global and regional burden of disease and
risk factors, 2001: Systematic analysis of population health data. Lancet 2006, 367, 1747–1757. [CrossRef]
7. WHO. Physical Inactivity a Leading Cause of Disease and Disability, Warns WHO. 2002. Available online:
https://www.who.int/mediacentre/news/releases/release23/en/ (accessed on 28 March 2020).
8. WHO. Physical Activity. 2018. Available online: https://www.who.int/news-room/fact-sheets/detail/physical-
activity (accessed on 18 May 2020).
9. Brooks, S.K.; Webster, R.K.; Smith, L.E.; Woodland, L.; Wessely, S.; Greenberg, N.; Rubin, G.J. The psychological
impact of quarantine and how to reduce it: Rapid review of the evidence. Lancet 2020, 395, 912–920. [CrossRef]
10. Segerstrom, S.C.; Miller, G.E. Psychological stress and the human immune system: A meta-analytic study of
30 years of inquiry. Psychol. Bull. 2004, 130, 601–630. [CrossRef] [PubMed]
11. Nieman, D.C.; Wentz, L.M. The compelling link between physical activity and the body’s defense system.
J. Sport Health Sci. 2019, 8, 201–217. [CrossRef] [PubMed]
12. Simpson, R.J.; Campbell, J.P.; Gleeson, M.; Krüger, K.; Nieman, D.C.; Pyne, D.B.; Turner, J.E.; Walsh, N.P.
Can exercise affect immune function to increase susceptibility to infection? Exerc. Immunol. Rev. 2020, 26,
8–22. [PubMed]
13. Woods, J.A.; Keylock, K.T.; Lowder, T.; Vieira, V.J.; Zelkovich, W.; Dumich, S.; Colantuano, K.; McAuley, E.
Cardiovascular exercise training extends influenza vaccine seroprotection in sedentary older adults:
The immune function intervention trial. J. Am. Geriatr. Soc. 2009, 57, 2183–2191. [CrossRef]
14. Fox, K.R.; Stathi, A.; McKenna, J.; Davis, M.G. Physical activity and mental well-being in older people
participating in the Better Ageing Project. Eur. J. Appl. Physiol. 2007, 100, 591–602. [CrossRef]
15. Jiménez-Pavón, D.; Carbonell-Baeza, A.; Lavie, C.J. Physical exercise as therapy to fight against the mental
and physical consequences of COVID-19 quarantine: Special focus in older people. Prog. Cardiovasc. Dis.
2020, 63, 386–388. [CrossRef]
16. WHO. Surveillance of Risk Factors for Non-Communicable Diseases: The WHO STEPwise Approach
(Summary). 2001. Available online: https://www.google.com/url?sa=t&rct=j&q=&esrc=s&source=web&
cd=&ved=2ahUKEwjmo6e4jM7pAhUL_aQKHaEDA0QQFjABegQIAxAB&url=http%3A%2F%2Fapps.
who.int%2Firis%2Fbitstream%2F10665%2F67178%2F1%2FWHO_NMH_CCS_01.01_Rev.1.pdf&usg=
AOvVaw2DjWs2EwakLbCMxA0QBcnU (accessed on 28 March 2020).Sports 2020, 8, 139 12 of 13
17. Ekman, A.; Litton, J.E. New times, new needs; E-epidemiology. Eur. J. Epidemiol. 2007, 22, 285–292. [CrossRef]
[PubMed]
18. Bonn, S.E.; Bergman, P.; Trolle Lagerros, Y.; Sjölander, A.; Bälter, K. A Validation Study of the Web-Based
Physical Activity Questionnaire Active-Q against the GENEA Accelerometer. JMIR Res. Protoc. 2015, 4, e86.
[CrossRef] [PubMed]
19. Bonn, S.E.; Trolle Lagerros, Y.; Christensen, S.E.; Möller, E.; Wright, A.; Sjölander, A.; Bälter, K.
Active-Q: Validation of the web-based physical activity questionnaire using doubly labeled water. J. Med.
Internet Res. 2012, 14, e29. [CrossRef]
20. Bourdas, D.I.; Zacharakis, E.D. Evolution of changes in physical activity over lockdown time: Physical activity
datasets of four independent adult sample groups corresponding to each of the last four of the six COVID-19
lockdown weeks in Greece. Data Brief 2020, 32, 106301. [CrossRef] [PubMed]
21. Ainsworth, B.E.; Haskell, W.L.; Herrmann, S.D.; Meckes, N.; Bassett, D.R.; Tudor-Locke, C.; Greer, J.L.;
Vezina, J.; Whitt-Glover, M.C.; Leon, A.S. 2011 compendium of physical activities: A second update of codes
and MET values. Med. Sci. Sports Exerc. 2011, 43, 1575–1581. [CrossRef]
22. Beasley, T.M.; Schumacher, R.E. Multiple regression approach to analyzing contingency tables: Post hoc and
planned comparison procedures. J. Exp. Educ. 1995, 64, 79–93. [CrossRef]
23. Bland, J.M.; Altman, D.G. Statistical methods for assessing agreement between two methods of clinical
measurement. Lancet 1986, 1, 307–310. [CrossRef]
24. Hellenic Statistical Authority. Demographic and Social Characteristics of the Resident Population of Greece
According to the 2011 Population-Housing Census. 2014. Available online: https://www.statistics.gr/en/
statistics/-/publication/SAM03/- (accessed on 28 March 2020).
25. WHO. Nutrition, Physical Activity and Obesity. 2013. Available online: http://www.euro.who.int/en/
healthtopics/diseaseprevention/nutrition/country-work/greece (accessed on 18 May 2020).
26. European Commission. Special Eurobarometer 472 Report—Sport and Physical Activity. Educ. Med. (Ed. Impr.);
European Commission: Brussels, Belgium, 2018; Volume 8. [CrossRef]
27. WHO. Physical Activity Factsheets for the 28 European Union Member States of the WHO European Region.
(Overview). 2018. Available online: http://www.euro.who.int/en/health-topics/disease-prevention/physical-
activity/publications/2018/factsheets-on-health-enhancing-physical-activity-in-the-28-eu-member-states-
of-the-who-european-region (accessed on 18 May 2020).
28. WHO/GHO. WHO/GHO Data. 2018. Available online: https://www.who.int/gho/countries/grc/country_
profiles/en/ (accessed on 18 May 2020).
29. Maugeri, G.; Castrogiovanni, P.; Battaglia, G.; Pippi, R.; D’Agata, V.; Palma, A.; Di Rosa, M.; Musumeci, G.
The impact of physical activity on psychological health during Covid-19 pandemic in Italy. Heliyon 2020, 6,
e04315. [CrossRef]
30. Constandt, B.; Thibaut, E.; De Bosscher, V.; Scheerder, J.; Ricour, M.; Willem, A. Exercising in times of
lockdown: An analysis of the impact of COVID-19 on levels and patterns of exercise among adults in
Belgium. Int. J. Environ. Res. Public Health 2020, 17, 4144. [CrossRef]
31. Di Renzo, L.; Gualtieri, P.; Pivari, F.; Soldati, L.; Attinà, A.; Cinelli, G.; Leggeri, C.; Caparello, G.; Barrea, L.;
Scerbo, F.; et al. Eating habits and lifestyle changes during COVID-19 lockdown: An Italian survey.
J. Transl. Med. 2020, 18, 229. [CrossRef]
32. Gallo, L.A.; Gallo, T.F.; Young, S.L.; Moritz, K.M.; Akison, L.K. The impact of isolation measures due to
COVID-19 on energy intake and physical activity levels in Australian university students. Nutrients 2020,
12, 1865. [CrossRef] [PubMed]
33. Qin, F.; Song, Y.; Nassis, G.P.; Zhao, L.; Dong, Y.; Zhao, C.; Feng, Y.; Zhao, J. Physical activity, screen time,
and emotional well-being during the 2019 novel coronavirus outbreak in China. Int. J. Environ. Res.
Public Health 2020, 17, 5170. [CrossRef] [PubMed]
34. Antunes, R.; Frontini, R.; Amaro, N.; Salvador, R.; Matos, R.; Morouço, P.; Rebelo-Gonçalves, R.
Exploring lifestyle habits, physical activity, anxiety and basic psychological needs in a sample of portuguese
adults during covid-19. Int. J. Environ. Res. Public Health 2020, 17, 4360. [CrossRef] [PubMed]
35. WHO. Draft Action Plan for the Prevention and Control of NCDs 2013–2020. (66th World Health
Assembly/A66/9/Provisional Agenda Item 13.2). 2013. Available online: https://apps.who.int/gb/e/e_
wha66.html (accessed on 28 March 2020).Sports 2020, 8, 139 13 of 13
36. Buchholz, K. What Share of the World Population is Already on COVID-19 Lockdown? 2020.
Available online: https://www.statista.com/chart/21240/enforced-covid-19-lockdowns-by-people-affected-
per-country/ (accessed on 5 April 2020).
37. Maffetone, P.B.; Laursen, P.B. The Perfect Storm: Coronavirus (COVID-19) Pandemic Meets Overfat Pandemic.
Front. Public Health 2020, 8, 135. [CrossRef] [PubMed]
38. Hellenic Statistical Authority. Survey on the Use of Information and Communication Technologies by
Households and Individuals. 2019. Available online: https://www.statistics.gr/en/statistics/-/publication/
SFA20/- (accessed on 28 March 2020).
Publisher’s Note: MDPI stays neutral with regard to jurisdictional claims in published maps and institutional
affiliations.
© 2020 by the authors. Licensee MDPI, Basel, Switzerland. This article is an open access
article distributed under the terms and conditions of the Creative Commons Attribution
(CC BY) license (http://creativecommons.org/licenses/by/4.0/).You can also read