Development of edible Thai rice film fortified with ginger extract using microwave assisted extraction for oral antimicrobial properties
←
→
Page content transcription
If your browser does not render page correctly, please read the page content below
www.nature.com/scientificreports
OPEN Development of edible Thai
rice film fortified with ginger
extract using microwave‑assisted
extraction for oral antimicrobial
properties
Niramon Utama‑ang1,2,3, Sirinapa Sida1, Phenphichar Wanachantararak4 &
Arthitaya Kawee‑ai1*
This study aimed to investigate microwave-assisted extraction (MAE) of dried ginger and to develop a
rice-based edible film incorporating ginger extract. The optimal MAE conditions of 400 W microwave
power and an extraction time of 1 min were determined using a 32 full factorial design. The optimized
extract showed total phenolic compounds (TPC, 198.2 ± 0.7 mg gallic acid equivalent/g), antioxidant
activity measured by DPPH (91.4 ± 0.6% inhibition), ABTS (106.4 ± 3.1 mg Trolox/g), and FRAP
(304.6 ± 5.5 mg Trolox/g), and bioactive compounds including 6-gingerol (71.5 ± 3.6 mg/g), 6-shogaol
(12.5 ± 1.0 mg/g), paradol (23.1 ± 1.1 mg/g), and zingerone (5.0 ± 0.3 mg/g). Crude extract of dried
ginger showed antimicrobial activity against Streptococcus mutans DMST 18777, with a minimum
inhibitory concentration and minimum bactericidal concentration of 0.5 and 31.2 mg/mL, respectively.
The rice-based edible film incorporating 3.2% (w/v) ginger extract tested against S. mutans DMST
18777 had a mean zone of inhibition of 12.7 ± 0.1 mm. Four main phenolic compounds, 6-gingerol,
6-shogaol, paradol, and zingerone, and six volatile compounds, α-curcumene, α-zingiberene,
γ-muurolene, α-farnesene, β-bisabolene, and β-sesquiphellandrene, were found in rice film fortified
with crude ginger extract.
Recently, the incorporation of natural additives from plant extracts in edible films or coatings has gained increas-
ing attention among researchers. Natural additives have been applied to improve texture, rheology, and functional
properties such as antioxidant, antimicrobial, and anti-browning properties of edible fi lms1. Rice (Oryza sativa
L.) is one of the main foods for almost half of the global population. Rice flour is widely used as a food hydrocol-
loid due to its low cost, convenience, biodegradability, and easy processability2. Furthermore, rice flour can be
formulated with other components to improve the physical, chemical, sensory, and nutritional properties of the
product3. Films or coatings produced with rice flour are generally transparent, odorless, colorless, and t asteless2.
Zingiber officinale Roscoe (ginger), a member of the Zingiberaceae family, is commonly used as a spice in
food and as a traditional medicine in Asian countries. Many bioactive compounds of ginger such as phenolic
compounds (gingerols, shogerols, and paradols), terpenes (zingiberene, β-bisabolene, and α-curcumene), poly-
saccharides, lipids, and organic compounds are known to have biological activity, for example, antioxidant,
anticancer, anti-diabetic, anti-inflammatory, antimicrobial, and cardiovascular protective activity4. However,
conventional methods for extracting the bioactive compounds require a long extraction time and affect the
quality of the final product by causing the loss of some of the volatile compounds, which leads to low extraction
efficiency5. The microwave-assisted technique has been widely employed to extract phenolic compounds from
plants due to its small equipment size, simplicity, and rapidness. The efficiency of microwave-assisted extraction
(MAE) has been found to be two times higher than that of the conventional method6,7.
1
Division of Product Development Technology, Faculty of Agro‑Industry, Chiang Mai University, Chiang
Mai 50100, Thailand. 2Cluster of High Value Product from Thai Rice and Plants for Health, Chiang Mai University,
Chiang Mai 50100, Thailand. 3Research Center for Development of Local Lanna Rice and Rice Product, Chiang
Mai University, Chiang Mai 50200, Thailand. 4Faculty of Dentistry, Chiang Mai University, Chiang Mai 50200,
Thailand. *email: kaweeai@gmail.com
Scientific Reports | (2021) 11:14870 | https://doi.org/10.1038/s41598-021-94430-y 1
Vol.:(0123456789)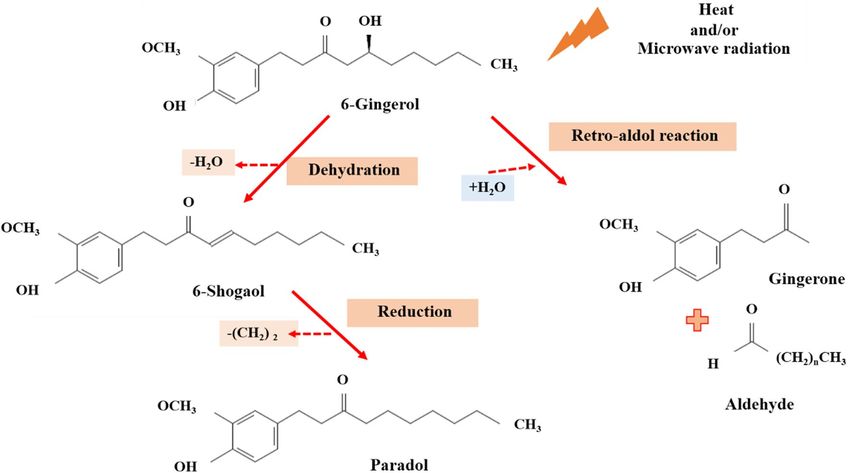
www.nature.com/scientificreports/
Microwave Antioxidant activity Bioactive compounds
Yield (%, TPC (mg DPPH ABTS FRAP 6-Gingerol 6-Shogaol Paradol Zingerone
Power (W) Time (min) DW)*,** GAE/g) (%inhibition) (mgTrolox/g) (mgTrolox/g) (mg/g) (mg/g) (mg/g) (mg/g)
400 1 7.5 ± 0.5b 200.8 ± 4.5a 91.8 ± 0.4a 104.2 ± 3.0b 297.3 ± 13.1b 73.4 ± 1.3a 12.8 ± 0.8bc 25.5 ± 7.8a 4.9 ± 0.2bc
a d b c b bc bc a
600 1 9.3 ± 1.2 119.9 ± 5.6 89.2 ± 0.9 93.3 ± 4.5 296.6 ± 2.7 60.4 ± 2.4 12.5 ± 1.8 23.5 ± 0.8 5.1 ± 0.1b
a e e de d bcd bc ab
800 1 10.2 ± 0.4 111.3 ± 5.4 81.5 ± 2.4 81.0 ± 5.9 267.9 ± 1.4 56.1 ± 1.2 10.9 ± 0.6 17.9 ± 0.6 4.6 ± 0.2 cd
a c d d c bcd bc ab
400 3 9.9 ± 0.5 132.2 ± 5.4 84.3 ± 0.2 83.4 ± 7.3 278.4 ± 2.3 56.4 ± 1.3 11.9 ± 0.2 19.9 ± 2.9 4.5 ± 0.0cde
600 3 10.4 ± 0.1a 104.9 ± 0.9e 89.2 ± 0.9b 72.6 ± 3.7f. 245.9 ± 2.5e 47.2 ± 1.3d 9.9 ± 1.9c 23.7 ± 1.42a 4.3 ± 0.1de
800 3 9.7 ± 0.1a 109.8 ± 1.0e 85.8 ± 0.5 cd 86.6 ± 2.2 cd 282.2 ± 1.8c 54.3 ± 1.8bcd 11.8 ± 2.0bc 16.6 ± 1.1b 4.3 ± 0.1de
400 5 10.4 ± 0.7a 111.1 ± 1.3e 85.8 ± 0.2 cd 87.3 ± 5.0 cd 284.0 ± 2.6c 57.4 ± 2.1bcd 13.1 ± 0.7b 20.4 ± 1.21ab 4.9 ± 0.3bc
600 5 10.7 ± 1.3a 119.8 ± 5.4d 86.8 ± 1.2 cd 74.6 ± 1.8ef 266.9 ± 2.2d 51.1 ± 1.6 cd 10.3 ± 0.8bc 16.6 ± 2.0b 4.1 ± 0.5e
800 5 7.3 ± 1.0b 145.3 ± 1.8b 89.5 ± 0.7b 120.9 ± 2.3a 377.8 ± 4.3a 64.7 ± 2.5ab 16.0 ± 1.8a 19.3 ± 1.3ab 5.8 ± 0.0a
Table 1. Operation parameters and responses for microwave-assisted ginger extraction by 3 2 full factorial
design. *DW means dry weight. **a-f represented the significant difference in the columns at p < 0.05.
Response Final equation in terms of actual factors R2 P-value
ns ns −3
Extraction yield (%) + 2.6 + 0.01 * Power + 2.3 * Time − 3.6 × 10 * Power * Time 0.7044 0.0498
TPC (mg GAE/g) + 512.1 − 0.9 * Power − 76.1 * Time + 5.0 × 10⁻⁴ * Power2 + 4.3 * Time2 + 0.07 * Power * Time 0.9758 0.0025
+ 205.3 − 0.2 * Powerns − 35.4 * Timens + 1.4 × 10⁻⁴ * Power2;ns + 2.7 * Time2 + 0.03 * Power *
ABTS (mgTrolox/g) 0.9267 0.0218
Time
ns ns –4 2 2,ns
+ 710.6 − 1.2 * Power − 82.8 * Time + 8.5 × 10 * Power + 6.7 * Time + 0.08 * Power *
FRAP (mgTrolox/g) 0.9005 0.0391
Time
6-Gingerol (mg/g) + 148.8 − 0.2 * Powerns − 20.1 * Timens + 1.4 × 10⁻⁴ * Power2 + 1.7 * Time2 + 0.01 * Power * Time 0.9267 0.0218
Table 2. Regression coefficients of the models for extraction yield, TPC, ABTS, FRAP, and 6-gingerol. *ns
means not significant at p < 0.05.
In a previous study, 9 month-matured ginger dried at 60 °C for 308 min presented the highest content of total
phenolic compounds (TPC, 12.2 µmol tannic acid/g) and 6-gingerol (12.5 mg/g)8. The nonvolatile compounds
including gingerols, shogaols, paradols, and zingerone in ginger exhibit antioxidant activity; dried and roasted
ginger has a high content of shogaols, paradols, and z ingerone9. Ginger is known to harden the teeth because of
indirect mineralization properties, thus it has been validated for oral c are10. We aimed to develop an edible film
from rice with an antimicrobial effect. There is no information about the effect of the inclusion of crude ginger
extract on rice film properties. Thus, the first objective was to investigate the effect of MAE conditions (micro-
wave power and extraction time) on the yield, antioxidant activity, and bioactive compounds of dried ginger. The
second objective was to integrate crude ginger extract into rice film and to determine its antimicrobial activity,
antioxidant activity, and bioactive compounds.
Results
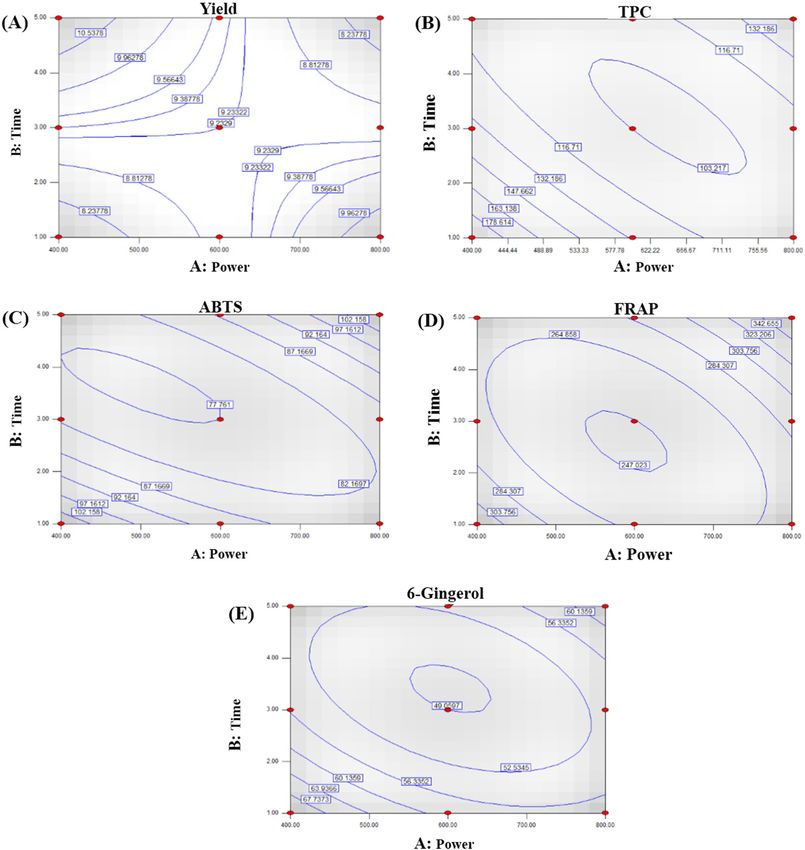
Effect of microwave power and extraction time on ginger extraction yield. To define the effect
of MAE, the microwave power (400, 600, and 800 W) and time (1, 3, and 5 min) were set to determine the extrac-
tion yield, TPC, antioxidant activity (determined by DPPH, ABTS, and FRAP assays), and content of 6-gingerol,
6-shogaol, paradol, and zingerone of dried ginger (Table 1). There was a significant improvement in extraction
yield with an increase of microwave power from 400 to 800 W; however, the yield decreased with a further
increase in extraction time (p ≤ 0.05). The yield of crude extract was approximately 7.3 ± 1.0 to 10.7 ± 1.3% dry
weight (DW). The regression equation of the yield was fitted with a coefficient of determination (R2) of 0.7044
(Table 2). Extraction yield showed a positive correlation with microwave power and time; however, the combina-
tion of microwave power and extraction time showed a negative effect, which was correlated with the contour
plot (Fig. 1A). The yield of crude extract initially increased with an increase in microwave power and extraction
time. However, increasing the microwave power to more than 600 W resulted in a decrease in the extraction
yield.
Effect of microwave power and extraction time on TPC and antioxidant activity. Conversely,
TPC and antioxidant activity measured by DPPH, ABTS, and FRAP methods decreased significantly with
an increase of both power and time (p ≤ 0.05, Table 1). The highest values for TPC and DPPH activity were
200.8 ± 4.5 mg gallic acid equivalent (GAE)/g and 91.8 ± 0.4%, respectively, at MAE conditions of 400 W and
1 min, while ABTS and FRAP values of 120.9 ± 2.3 and 377.8 ± 4.3 mg/g, respectively, were obtained when 800 W
of microwave power was applied for 5 min. The summary of the analysis of variance (ANOVA) representing
the results indicated that TPC, ABTS, and FRAP values were reliable and significant (p < 0.05) with R2 values
of 0.9758, 0.9267, and 0.9005, respectively (Table 2). Microwave power and extraction time were found to be
Scientific Reports | (2021) 11:14870 | https://doi.org/10.1038/s41598-021-94430-y 2
Vol:.(1234567890)
www.nature.com/scientificreports/

                                  Figure 1.  Contour plots of the effect of the interaction between power and time on (A) yield, (B) TPC, (C)
                                  ABTS, (D) FRAP, and (E) 6-gingerol.

                                  non-significant (p > 0.05) for these responses, which means that an increase of microwave power and extraction
                                  time decreased the TPC, ABTS, and FRAP values. However, the interaction of microwave power and extraction
                                  time had a positive effect on the values observed. Consistent with the ANOVA results, MAE presented a negative
                                  effect for TPC (Fig. 1B), ABTS (Fig. 1C), and FRAP (Fig. 1D), with a significant decrease in their values when
                                  high microwave power (> 500 W) and a long extraction time (> 2 min) were applied.

                                  Effect of microwave power and extraction time on bioactive compounds. The highest yield of
                                  6-gingerol was obtained either with low microwave power and a short extraction time (400 W, 1 min) or high
                                  microwave power and a long extraction time (800 W, 5 min). The highest paradol content was produced when
                                  microwave power was in the range 400–600 W, while the highest yield of 6-shogaol and zingerone was achieved
                                  when microwave power was 800 W and extraction time was 5 min. The highest values for 6-gingerol and para-
                                  dol (73.4 ± 1.3 and 25.5 ± 7.8 mg/g, respectively) were obtained at low power (400 W, 1 min), while the highest

Scientific Reports |   (2021) 11:14870 |              https://doi.org/10.1038/s41598-021-94430-y                                                3

                                                                                                                                           Vol.:(0123456789)
www.nature.com/scientificreports/
Figure 2. Overlay plot for the optimal conditions for microwave-assisted ginger extraction.
Response Actaual value Predicted value % Error
Yield (%) 7.6 ± 0.6 7.6 0.6
TPC (mg GAE/g) 198.2 ± 0.7 193.9 2.1
DPPH (%) 91.4 ± 0.6 89.0 2.6
ABTS (mgTrolox/g) 106.4 ± 3.1 106.0 0.4
FRAP (mgTrolox/g) 304.6 ± 5.5 317.9 − 4.3
6-Gingerol (mg/g) 71.5 ± 3.6 71.5 0.1
6-Shogaol (mg/g) 12.5 ± 1.0 12.7 − 2.1
Paradol (mg/g) 23.1 ± 1.1 24.7 − 7.1
Zingerone (mg/g) 5.0 ± 0.3 5.2 − 3.3
Table 3. Predicted and actual values for optimal conditions.
values for 6-shogaol and zingerone were obtained at high power and a longer extraction time (800 W, 5 min)
with values of 16.0 ± 1.8 and 5.8 ± 0.0 mg/g, respectively (Table 1). However, a model for using MAE to extract
compounds for ginger could only be generated for 6-gingerol (p < 0.05, Table 2). A high R2 value (0.9267) was
achieved and microwave power and extraction time were found to be non-significant (p > 0.05). Consistent with
the ANOVA and contour plots for TPC, ABTS, and FRAP, MAE had a negative effect for 6-gingerol, their values
decreasing significantly when high microwave power (> 500 W) and a long extraction time (> 2 min) were used
(Fig. 1E).
Optimization and validation of MAE conditions. The contour response surfaces were plotted to study
the interactions between the factors for the significant responses to determine the optimum levels of each fac-
tor required to obtain maximum yields of TPC, ABTS, FRAP, and 6-gingerol (Fig. 2). Based on the analysis and
calculation, the validation experiment was conducted with microwave power of 400 W and an extraction time of
1 min. The yield of crude ginger (7.6 ± 0.6%) was close to the predicted value of 7.6%. TPC and antioxidant activ-
ity indicated by ABTS and FRAP values were 198.2 ± 0.7 mg GAE/g, 106.4 ± 3.1 mg Trolox/g, and 304.6 ± 5.5 mg
Trolox/g, respectively (Table 3). The yield of 6-gingerol was 71.5 ± 3.6 mg/g. The approximate error between pre-
dicted and experimental values was in the range − 7.1 to 2.6%, within ± 10% and so indicating that the validation
results were acceptable and consistent with the predicted values.
Application of crude ginger extract in rice‑based edible film
Antimicrobial activity of rice‑based edible film. The disc diffusion analysis results revealed that the
crude extract of ginger (63–500 mg/mL) showed no significant difference on the inhibition zone (p < 0.05) in
antimicrobial activity against Streptococcus mutans DMST 18777, with an average inhibition zone of 9.5 ± 0.7 to
11.0 ± 1.4 mm (Table 4). The minimum inhibitory concentration (MIC) and minimum bactericidal concentra-
tion (MBC) of the crude extract of ginger against S. mutans DMST 18777 were 0.5 and 31.2 mg/mL, respectively.
Thus, the highest concentration of crude ginger extract that was incorporated into the rice-based edible film was
32 mg/mL (3.2%, w/v). Inhibition zone diameters for rice-based edible film disks with various concentrations
of crude ginger extract (0, 4, 8, 16, and 32 mg/mL or 0.4%, 0.8%, 1.6%, and 3.2%, w/v) against S. mutans DMST
18777 are presented in Table 3. No inhibition was observed for rice film not containing crude ginger extract,
indicating that rice film alone did not affect antimicrobial activity. The incorporation of less than 1.6% (w/v)
crude ginger extract in the rice film was not enough to inhibit the growth of S. mutans DMST 18777. The most
efficient concentration of ginger extract was 3.2% (w/v); film containing this amount had an inhibition zone of
12.7 ± 0 0.1 mm while tetracycline presented an inhibition zone of 41.2 ± 0.4 mm.
Scientific Reports | (2021) 11:14870 | https://doi.org/10.1038/s41598-021-94430-y 4
Vol:.(1234567890)www.nature.com/scientificreports/
Sample Concentration (mg/mL) Inhibition zone (mm)
DMSO (Negative control) –
Crude ginger extractns* 63 11.0 ± 1.4
125 11.0 ± 0.0
250 10.5 ± 0.7
500 9.5 ± 0.7
MIC** (mg/mL) 0.5
MBC** (mg/mL) 31.2
DMSO (Negative control) –
Tetracycline 30 µg (Positive control) 41.2 ± 0.4a
Rice film + ginger extract 0 –
4.0 –
8.0 –
16.0 –
32.0 12.7 ± 0.1b
Table 4. Antimicrobial activity of crude ginger extracts and rice-based edible film at different concentrations
against S. mutans by disc diffusion method. *ns means not significantly different at p ≤ 0.05. **MIC is
Minimum inhibitory concentration; MBC is Minimum bactericidal concentration.
Ginger extract concentration in rice film (%, w/v)
Investigate parameters Unit 0 0.4 0.8 1.6 3.2
TPC mg GAE/100 g – 415.8 ± 10.9d,** 559.4 ± 5.5c 992.7 ± 7.3b 1,613.3 ± 7.3a
Antioxidant activity –
DPPH mgTrolox/ 100 g 392.0 ± 47.8d 939.1 ± 65.9c 1,732.9 ± 51.0b 2,637.8 ± 88.3a
ABTS mgTrolox/ 100 g – 347.0 ± 41.4d 671.7 ± 56.1c 865.04 ± 21.9b 1,634.7 ± 72.8a
FRAP mgTrolox/ 100 g – 1,060.2 ± 50.4d 2,137.8 ± 66.7c 3,346.6 ± 75.6b 6,244.6 ± 90.9a
Bioactive compounds
6-Gingerol mg/g – 10.4 ± 0.0c 1.9 ± 0.1c 7.1 ± 0.1b 12.9 ± 0.3a
c c b
6-Shogaol mg/g – 0.5 ± 0.0 0.6 ± 0.0 2.1 ± 0.1 5.5 ± 0.9a
c b
Paradol mg/g – ND 0.8 ± 0.0 1.4 ± 0.0 1.8 ± 0.1a
c b
Zingerone mg/g – ND 0.2 ± 0.0 0.4 ± 0.0 0.7 ± 0.0a
Volatile compounds
α-Curcumenens* % – 16.8 ± 2.9 13.2 ± 2.1 14.5 ± 2.9 13.8 ± 1.5
α-Zingiberenens % – 27.0 ± 4.3 30.8 ± 4.8 33.2 ± 5.8 34.6 ± 6.7
γ-Muurolenens % – 7.6 ± 1.2 6.3 ± 0.3 6.8 ± 1.0 6.5 ± 1.0
α-Farnesenens % – 10.3 ± 1.6 10.5 ± 1.0 12.6 ± 2.6 12.7 ± 2.0
β-Bisabolenens % – 8.7 ± 1.0 6.7 ± 1.0 6.6 ± 1.6 6.2 ± 2.2
β-Sesquiphellandrenens % – 15.3 ± 2.4 14.1 ± 2.2 13.3 ± 3.9 13.1 ± 4.5
Table 5. Phenolic compounds, antioxidant activity, and volatile compounds in rice film strip incorporating
various concentrations of crude ginger extract. *ns means not significant at p < 0.05. **a–d represented the
significant difference in the rows at p < 0.05.
Changes of TPC, antioxidant activity, bioactive compounds, and volatile compounds of rice
film. The TPC, antioxidant activity, and bioactive compounds (6-gingerol, 6-shogaol, paradol, and zingerone)
of the edible rice films increased gradually with an increase of crude ginger extract content (Table 5). Paradol and
zingerone were absent from rice film containing 4.0 mg/mL of ginger extract. The main bioactive compounds
present in the rice film were 6-gingerol followed by 6-shogaol, paradol, and zingerone, respectively. Meanwhile,
the rice films showed no significant differences (p < 0.05) in the principal volatile compounds of crude ginger,
including α-curcumene, α-zingiberene, γ-muurolene, α-farnesene, β-bisabolene, and β-sesquiphellandrene. The
main compounds found in the rice film fortified with crude ginger extract were present in the order α-zingibere
ne > α-curcumene ≥ β-sesquiphellandrene > α-farnesene > γ-muurolene ≥ β-bisabolene. Rice film without ginger
extract showed no TPC, antioxidant activity, bioactive compounds, or volatile compounds.
Scientific Reports | (2021) 11:14870 | https://doi.org/10.1038/s41598-021-94430-y 5
Vol.:(0123456789)www.nature.com/scientificreports/
Figure 3. Conversion of 6-gingerol into 6-shogaol, paradol and zingerone through the heating and radiation
power of the microwave process.
Discussion
Generally, an increase of microwave power increased the extraction yield with a shorter extraction t ime11. The
changes of antioxidant activity might be due to the generation of free radicals such as H+, OH−, and electrons
through microwave r adiation4. The highest yield of 6-gingerol was obtained either with low microwave power
and a short extraction time (400 W, 1 min) or high microwave power and a long extraction time (800 W, 5 min)
.This agrees with the results of Teng et al.5 who found that increasing the heating time increased the quantity
of compounds extracted, while others found that a variation of microwave power from 500 to 1000 W had no
significant effect on the flavonoid yields from ginger12. The negative effect of the interaction between microwave
power and extraction time on extraction yield, bioactive compounds, and their antioxidant activity meant that
these responses decreased significantly at the higher level of microwave power and prolonged extraction t ime13.
The microwave irradiation time is influenced by the dielectric constant of the solvent, especially ethanol and
methanol, and a prolonged irradiation time can result in overheating and the risk of losing thermolabile con-
stituents, i.e. g ingerols14. In this study, the optimal conditions for dried ginger were 400 W of microwave power
and 1 min of extraction time, which protected the antioxidant compounds in ginger from thermal destruction.
At high temperatures and/or high microwave power, 6-gingerol dehydrates water ( H2O) from its structure and
converts it to 6-shogaol4. If the reduction of ( CH2)2 occurs, 6-shogaol will be transformed into paradol. In another
case, microwave power promoted the retro-aldol reaction of 6-gingerol and is proposed to generate zingerone
constituents with an aldehyde to deliver the products (Fig. 3). The competition of these reactions can be further
demonstrated by the synthesis of 6-shogaol, paradol, and zingerone constituents. The content of 6-shogaol and
zingerone was gradually increased under high microwave power (> 600 W) and a long extraction time (> 3 min).
This indicates that 6-shogaol and zingerone are produced at high temperatures and high microwave power, and
also by the thermal degradation of gingerol9. 6-Shogaol and zingerone increased on increasing the microwave
power and extraction time, which resulted in increased ABTS and FRAP values. This phenomenon could be
explained by 6-gingerol being dehydrated and generating H+ and OH− radicals at high temperatures or high
microwave power, resulting in the production of 6-shogaol, paradol, zingerone, and their d erivatives5,6.
S. mutans is found in the oral cavity and forms a dental plaque to prevent the admission of antimicrobial
agents10. The oral film strip is considered one of the most convenient routes for administration of these agents
due to cost efficiency and ease of administration. In this study, we observed the inhibitory activity of crude ginger
extract and found that the MIC and MBC of the crude ginger extract against S. mutans DMST 18777 were 0.5
and 31.2 mg/mL, respectively, with an inhibition zone of approximately 11.0 mm. According to the Clinical Lab
Standards Institute, for an agent to be accepted as having antimicrobial capacity it must display an inhibition
zone of more than 11 mm, which depends on the agent and its concentration15. These results agree with those
reported by Mathai et al.16, who observed a 11.7 ± 0.6 mm inhibition zone for fresh ginger extract against S.
mutans MTCC 497. Many studies have also shown an inhibition zone for fresh ginger extract against S. mutans
of approximately 6–18 mm17–19. The incorporation of less than 16 mg/mL of crude ginger extract in the rice
film was not enough to inhibit the growth of S. mutans DMST 18777. This might be due to the immobilization
of rice molecules within the film and a high number of bacteria (2.7 × 10⁶ or 6.4 log CFU/mL) exceeding the
inhibition activity20. The antimicrobial activity of crude ginger against S. mutans was 5 log CFU/mL20. The most
efficient concentration was 3.2% (w/v) at which the inhibition zone was 12.7 ± 0.1 mm. It can be concluded
that the rice-based edible film produced with 3.2% (w/v) ginger extract has the potential to be considered as an
Scientific Reports | (2021) 11:14870 | https://doi.org/10.1038/s41598-021-94430-y 6
Vol:.(1234567890)www.nature.com/scientificreports/
anti-caries rice film. In contrast, an edible starch film containing ginger essential oils (1–3% v/w) inhibited the
growth of Escherichia coli with a 1–9 mm inhibition zone21. It seems that gram-negative bacteria (E. coli) are
more resistant to lipophilic compounds as compared with gram-negative bacteria (S. mutans), which occupy a
single peptidoglycan layer s tructure22.
The presence of 6-gingerol and 6-shogaol in the rice film strip could impart a pungent and aromatic taste
to the film. 6-Gingerol, 6-shogaol, paradol, and zingerone can inhibit reactive oxygen species and maintain
their antioxidant p roperties9. Thus, the antioxidant activity of the rice film might be related to the presence
of TPC and bioactive compounds. The essential oil of crude ginger has been found to contain 44 volatile
compounds8. In this study, the main volatile compounds in the rice film strip were α-curcumene, α-zingiberene,
γ-muurolene, α-farnesene, β-bisabolene, and β-sesquiphellandrene, as identified by gas chromatography–mass
spectrometry (GC–MS). These compounds are sesquiterpenes. The monoterpenes and sesquiterpenes are the
main classes of volatile compounds in ginger; its antioxidant activity is attributed to α-zingiberene, camphene,
α-farnesene, and β-sesquiphellandrene23. In this study, α-zingiberene (27.0 ± 4.3–34.6 ± 6.7%) was the main vola-
tile compound in the rice film strip, followed by α-curcumene (13.2 ± 2.1–16.8 ± 2.9%), β-sesquiphellandrene
(13.1 ± 4.5–15.3 ± 2.4%), α-farnesene (10.3 ± 1.6–12.6 ± 2.6%), β-bisabolene (6.2 ± 2.2–8.7 ± 1.0%), and
γ-muurolene (6.3 ± 0.3–7.6 ± 1.2%). Wang et al.24 showed that α-zingiberene was the main compound of the
essential oil found in ginger, its content in the range 17.4–25.4%, followed by ar-curcumene (14.1–16.4%),
β-bisabolene (9.9–12.5%), and β-sesquiphellandrene (9.7–13.4%), which was consistent with this study.
Conclusions
MAE was successfully used to extract TPC, 6-gingerol, 6-shogaol, paradol, and zingerone from dried ginger,
and antioxidant efficiency was increased for a shortened extraction time by a 32 full factorial design. The optimal
conditions were microwave power of 400 W and an extraction time of 1 min, which showed responses close to the
predicted responses. For antimicrobial activity, MIC and MBC values of 0.5 and 31.2 mg/mL, respectively, were
obtained for the crude extract of dried ginger against S. mutans DMST 18777. Furthermore, it has been recently
shown that the antimicrobial activity of rice-based edible film incorporating 3.2% (w/v) ginger extract makes the
film suitable for application as an anti-caries rice film containing bioactive compounds and essential oil that can
inhibit the growth of bacteria. Rice film incorporating 3.2% (w/v) ginger extract showed a significant antibacterial
effect against S. mutans DMST 18777, proving that ginger is released from the film into the surrounding culture
medium and that its antimicrobial activity has been preserved after fortification of the polymer. The presence
of phenolic compounds including 6-gingerol, 6-shogaol, paradol, and zingerone, and essential oils including
α-curcumene, α-zingiberene, γ-muurolene, α-farnesene, β-bisabolene, and β-sesquiphellandrene in the rice-
based edible film might be helpful for several therapeutic effects. Thus, the development of a rice-based edible
film incorporating dried ginger extract may constitute an alternative way of dealing with S. mutans resistance.
Materials and methods
Raw material. Fresh and 9 month-matured ginger rhizomes, grown and controlled under Good Agricul-
tural Practice, were obtained from the Hsu Chuan Foods Co., Ltd in Chiang Rai, Thailand (www.hcgrouptha
iland.com). Identification was done according to a Zingiberaceae expert and the l iterature25. A voucher specimen
(QBG No. 27329) was provided by the Queen Sirikit Botanic Garden (QBG), Chiang Mai, Thailand. The peeled
ginger was washed in distilled water and cut into 0.2 × 4 × 0.4 cm pieces. The cut ginger was then dried using the
method reported previously by Sida et al.8. Briefly, the ginger pieces were placed in trays and put into a hot-air
dryer (Armfield, Hampshire, England) at 60 °C for 308 min. The dried ginger was ground with a hammer mill
(Crompton, model 2000 Series, England) and sieved at 1.2 mm. The ginger powder was kept in an aluminum
foil vacuum package and stored in a desiccator at ambient temperature for at least 24 h before further analysis.
MAE experimental design. The MAE was carried out in a laboratory microwave (Toshiba, Model ER-
300C(S) Power Max 900, frequency 2.45 × 10⁹ Hz, Japan). A 32 full factorial design was constructed to inves-
tigate the influence of two variables, microwave power (400, 600, and 800 W) and the reaction time (1, 3, and
5 min) (Table 1). The ginger powder (10 g) was added to 100 mL of 95% ethanol and extracted following the
conditions represented in Table 1. The microwave-extracted samples were then filtered into a 100 mL conical
flask using no. 1 Whatman filter paper. The filtrate was collected and concentrated using a rotary evaporator
under vacuum at 50 ± 4 °C; finally, dry extract yield was calculated and expressed as a percentage. The dried
extract samples (crude oil) were kept at 4 °C until further use.
The experimental data were analyzed using a response surface regression procedure to fit the following
second-order polynomial model (Eq. 1).
Y = β0 + βi Xi + βii Xi2 + βij Xi Xj + e0
(1)
i=1 i=1 i=1 j=i+1
where Y is the predicted response variable, β0 is the constant coefficient, βi is the linear effect, βii is the squared
effect, βij is interaction effects, and Xi and Xj represent the independent variables, respectively.
Edible film preparation. The rice-based film was prepared by a casting technique according to Miksusanti
et al.21 with some modifications. For film formation, 7 g of glutinous Thai rice powder (Newgrade, Thaiwah Co.,
Ltd, Thailand) was dissolved in an aqueous solution (145 mL) of water and heated at 1–2 °C/min to 80 °C on a
magnetic stirrer hot plate for 1 h to promote gelatinization. At the same time, sodium carboxymethyl cellulose
(0.7 g) and refined glycerine (1.75 mL) were added slowly. After entering the gelatinization stage, the ginger
Scientific Reports | (2021) 11:14870 | https://doi.org/10.1038/s41598-021-94430-y 7
Vol.:(0123456789)www.nature.com/scientificreports/
extract was added to the Thai rice solution to reach a final concentration of 4, 8, 16, or 32 mg/mL (0.4%, 0.8%,
1.6%, or 3.2% (w/v)), and then degassed by sonication for 30 min. The rice-based film with ginger extract was
then cast in a petri dish (9 cm diameter) and dried at 50 °C for 6 h. The films were peeled off from the casing
plates and conditioned for 7 days at 25 °C in a desiccator before all analysis.
Determination of TPC. Prior to determining the TPC, antioxidant activity, and bioactive compounds, the
film (10 g) was extracted by hot extraction with 10 mL of 95% ethanol at 60 °C for 24 h26. After that, the solution
was then filtered using no. 1 Whatman paper and centrifuged at 5,500 rpm for 10 min. The TPC were examined
using the method described by Singleton and Rossi27. The ginger solution (200 µL) and 10% Folin–Ciocalteu
reagent (1 mL) were mixed and 2% (w/v) Na2CO3 was then added with a diluting solvent (water : methanol 4 : 6)
to make a total volume of 10 mL. Absorbance was recorded at 740 nm after 30 min using a spectrophotometer
(UV–Vis model 1601, Shimadzu, Japan).
Antioxidant activity
DPPH radical‑scavenging activity. Extract solution (4 mL) and DPPH solution (1 mL) were mixed
(0.1 mM in methanol) in a vortex mixer and then stood at room temperature in the dark for 30 min28. The
absorbance was recorded at 517 nm. The percentage scavenging effect was calculated using Eq. 2:
A0 − A1
DPPH radical scavenging activity(%) = × 100 (2)
A0
where A0 is the absorbance of the control solution (DPPH without sample), and A1 is the absorbance of the
ginger extract in DPPH solution.
ABTS method. A mixture of 7 mM ABTS and 2.45 mM potassium persulphate, the ABTS solution, was
stood in the dark for 14 ± 2 h before use. Afterward, the ABTS solution was diluted with ethanol to measure the
absorbance of 0.7 ± 0.02 at 734 nm29. Ginger extract (150 µL) was allowed to react with 4,850 µL of the ABTS
solution for 6 min and then read by a spectrophotometer at 734 nm.
FRAP assay. The FRAP assay was carried out by modification of the method of Benzie and Strain30. The
FRAP solution (3 mL) was added to 150 µL of ginger extract for 10 min at 37 °C and the absorbance was
recorded at 593 nm.
Antimicrobial activity
Cell culture conditions. S. mutans DMST 18777 (ATCC 251755) was obtained from the Thailand Institute
of Scientific and Technological Research. The strain was grown in Brain Heart Infusion Broth (BHI; Difco Labo-
ratories, Sparks, MD, USA) at 37 °C for 16–24 h under anaerobic conditions.
Evaluation of zone of inhibition. The disc diffusion method was used to determine the zone of inhibi-
tion. Paper discs impregnated with 10 µL of ginger extract and/or rice-based film (6 mm in diameter) were
placed on Mitis salivarius agar plates which were inoculated with S. mutans DMST 18777 according to the stand-
ard protocol described by the National Committee of Clinical Laboratory Standards (NCCLS)31. The plates were
incubated at 37 °C and the diameters of the inhibition zones were measured after 24 h. Filter paper discs contain-
ing DMSO without any test compounds served as a control and no inhibition was observed. Additionally, for
comparative purposes, tetracycline (30 µg, 10 µL) was used as a reference standard. Each assay was performed
in triplicate and repeated three times.
Determination of MIC and MBC. The MIC and MBC of the ginger extract against S. mutans DMST 18777
were determined by the reference protocol of the NCCLS method31. The concentration of the ginger extracts
used in these experiments ranged from 63 to 500 mg/mL. The density of the cell suspensions of the respec-
tive microorganisms was adjusted to 2.7 × 10⁶ CFU/mL. The suspensions were transferred onto plates and then
incubated at 37 °C for 24 h. The lowest concentration which inhibited the growth of S. mutans DMST 18777 was
taken as the MIC, while the MBC was defined as the lowest concentration that yielded no colony growth by sub-
culturing on agar plates. All tests were carried out in triplicate.
Analysis of active compounds in ginger using high‑performance liquid chromatography
(HPLC). After filtering through a 0.2 µm syringe filter, the final sample (20 µL) was used for injection. Stand-
ards of 6-gingerol, 6-shogaol, paradol, and zingerone were prepared. The analysis was performed on an HPLC
system (Agilent Technologies, Santa Clara, CA, USA) with a photodiode array detector. The HPLC system con-
tained a C 18 reverse-phase column (Water C 18, 250 × 4.6 mm, 5 µm particle size). The gradient elution program
used acetonitrile and water at a flow rate of 1.0 mL/min and detection wavelength of 282 nm. The mobile phase
contained water (A) and acetonitrile (B). The gradient elution program was set as follows: from 0 to 25 min,
B was isocratic at 33%; from 25 to 35 min, B was changed from 33 to 55%; from 35 to 60 min, B was changed
linearly from 55 to 90%; from 60 to 65 min, B was changed linearly from 90 to 33%; and from 65 to 70 min, B
was isocratic at 33%26.
Scientific Reports | (2021) 11:14870 | https://doi.org/10.1038/s41598-021-94430-y 8
Vol:.(1234567890)www.nature.com/scientificreports/
Headspace solid‑phase microextraction (HS‑SPME). To evaluate the volatile compounds of the edi-
ble rice film incorporating crude ginger extract, the compounds were extracted using Carboxen/polydimethyl-
siloxane (CAR/PDMS) fiber. The sample headspace (5 g) was transferred into a 25 mL screw cap glass vial and
extracted at 50 °C for 30 min. The bound volatiles were injected into GC–MS e quipment32.
Measurement of the target analytes was performed using GC–MS (GC-17A, Shimadzu, Japan) coupled with
mass spectrometry (QP 5050A, Shimadzu, Japan). A BPX-5 capillary column (30 m × 0.25 mm × 1.00 µm; SGE,
Melbourne, Australia) was used for separation and run at 1.0 mL/min with helium as the carrier gas. The inlet
temperature was 250 °C in split mode (1:50). The initial oven temperature was 80 °C for 1 min, heated to 220 °C at
5 °C/min and maintained for 10 min, and finally increased to 250 °C. The detector temperature was set at 300 °C.
Statistical analysis. All experiments were carried out according to the relevant guidelines and regulations.
Data are shown as the mean and standard deviation for triplicate analyses. Design-Expert version 6.0.10 (Stat-
Ease Inc., Minneapolis, MN, USA) was applied to perform the experimental design and the data analysis. The
mean comparisons of the physical and chemical properties (yield, TPC, DPPH, ABTS, FRAP, and bioactive com-
pounds) were analyzed using ANOVA in SPSS version 17.0 (SPSS Inc., Chicago, USA). Statistical significance
was analyzed at p ≤ 0.05 using Duncan’s multiple range tests. The graphical figures were created and modified in
Microsoft PowerPoint (Microsoft Office 2013, Washington, USA).
Data availability
The data generated during the current study are available from the corresponding author on reasonable request.
Received: 31 March 2021; Accepted: 9 July 2021
References
1. Silva-Weiss, A. et al. Natural additives in bioactive edible films and coatings: functionality and applications in foods. Food Eng.
Rev. 5, 200–216 (2013).
2. Pavli, F., Tassou, C., Nychas, G.-J.E. & Chorianopoulos, N. Probiotic incorporation in edible films and coatings: Bioactive solution
for functional foods. Int. J. Mol. Sci. 19, 150 (2018).
3. Gupta, M., Bawa, A. S. & Semwal, A. D. Effect of barley flour on development of rice-based extruded snacks. Cereal Chem. 85,
115–122 (2008).
4. Gupta, R., Singh, P. K., Singh, R. & Singh, R. L. Pharmacological activities of Zingiber officinale (ginger) and its active ingredients:
A review. Int. J. Innov. Sci. Res. 4, 1–18 (2016).
5. Teng, H., Seuseu, K. T., Lee, W.-Y. & Chen, L. Comparing the effects of microwave radiation on 6-gingerol and 6-shogaol from
ginger rhizomes (Zingiber officinale Rosc). PLoS ONE 14, e0214893 (2019).
6. Alfaro, M. J., Bélanger, J. M. R., Padilla, F. C. & Paré, J. R. J. Influence of solvent, matrix dielectric properties, and applied power
on the liquid-phase microwave-assisted processes (MAPTM) extraction of ginger (Zingiber officinale). Food Res. Int. 36, 499–504
(2003).
7. Rahath Kubra, I., Kumar, D. & Rao, L. J. M. Effect of microwave-assisted extraction on the release of polyphenols from ginger
(Zingiber officinale). Int. J. Food Sci. Technol. 48, 1828–1833 (2013).
8. Sida, S., Samakradhamrongthai, R. S. & Utama-Ang, N. Influence of maturity and drying temperature on antioxidant activity and
chemical compositions in ginger. Curr. Appl. Sci. Technol. 19, 28–42 (2019).
9. Ahmad, B. et al. A review on pharmacological properties of zingerone (4-(4-Hydroxy-3-methoxyphenyl)-2-butanone). Sci. World
J. 2015, 816364. https://doi.org/10.1155/2015/816364 (2015).
10. Ganeshpurkar, A., Thakur, A. & Jaiswal, A. Ginger in oral care. In Natural Oral Care in Dental Therapy (eds. Chauhan, D. N. et al.)
329–343 https://doi.org/10.1002/9781119618973.ch21 (2020).
11. Rahath Kubra, I., Kumar, D. & Rao, L. J. M. Effect of microwave-assisted extraction on the release of polyphenols from ginger (Z
ingiber officinale). Int. J. food Sci. Technol. 48, 1828–1833 (2013).
12. Raner, K. D., Strauss, C. R., Vyskoc, F. & Mokbel, L. A comparison of reaction kinetics observed under microwave irradiation and
conventional heating. J. Org. Chem. 58, 950–953 (1993).
13. Zhang, H.-F., Yang, X.-H. & Wang, Y. Microwave assisted extraction of secondary metabolites from plants: Current status and
future directions. Trends Food Sci. Technol. 22, 672–688 (2011).
14. Mandal, V., Mohan, Y. & Hemalatha, S. Microwave assisted extraction—an innovative and promising extraction tool for medicinal
plant research. Pharmacogn. Rev. 1, 7–18 (2007).
15. Clsi, C. Performance standards for antimicrobial susceptibility testing. Clin. Lab Stand. Inst. 35, 16–38 (2016).
16. Mathai, K. et al. Antimicrobial effect of ginger, garlic, honey, and lemon extracts on Streptococcus mutans. J. Contemp. Dent. Pr.
18, 1004–1008 (2017).
17. Azizi, A. et al. In vitro effect of Zingiber officinale extract on growth of Streptococcus mutans and Streptococcus sanguinis. Int. J.
Dent. 2015, 489842 (2015).
18. Jain, I. et al. Use of traditional Indian plants in the inhibition of caries-causing bacteria-Streptococcus mutans. Braz. Dent. J. 26,
110–115 (2015).
19. Giriraju, A. & Yunus, G. Y. Assessment of antimicrobial potential of 10% ginger extract against Streptococcus mutans, Candida
albicans, and Enterococcus faecalis: An in vitro study. Indian J. Dent. Res. 24, 397–400 (2013).
20. Zivanovic, S., Chi, S. & Draughon, A. F. Antimicrobial activity of chitosan films enriched with essential oils. J. Food Sci. 70, M45–
M51 (2005).
21. Miksusanti, M., Herlina, H. & Masril, K. I. M. K. I. Antibacterial and antioxidant of uwi (Dioscorea alata L) starch edible film
incorporated with ginger essential oil. Int. J. Biosci. Biochem. Bioinforma. 3, 354–356 (2013).
22. Zhang, Y., Liu, X., Wang, Y., Jiang, P. & Quek, S. Antibacterial activity and mechanism of cinnamon essential oil against Escherichia
coli and Staphylococcus aureus. Food Control 59, 282–289 (2016).
23. Sharifi-Rad, M. et al. Plants of the genus zingiber as a source of bioactive phytochemicals: From tradition to pharmacy. Molecules
22, 2145. https://doi.org/10.3390/molecules22122145 (2017).
24. Wang, Z. et al. Rapid analysis of the essential oils from dried Illicium verum Hook f and Zingiber officinale Rosc by improved
solvent-free microwave extraction with three types of microwave-absorption medium. Anal. Bioanal. Chem. 386, 1863–1868
(2006).
25. Theilade, I. A synopsis of the genus Zingiber (Zingiberaceae) in Thailand. Nord. J. Bot. 19, 389–410 (1999).
Scientific Reports | (2021) 11:14870 | https://doi.org/10.1038/s41598-021-94430-y 9
Vol.:(0123456789)www.nature.com/scientificreports/
26. Kajsongkram, T., Rotamporn, S., Limbunruang, S. & Thubthimthed, S. Development and validation of a HPLC method for 6-gin-
gerol and 6-shogaol in joint pain relief gel containing ginger (Zingiber officinale). Int. J. Med. Heal. Biomed. Bioeng. Pharm. Eng.
9, 813–817 (2015).
27. Singleton, V. L. & Rossi, J. A. Colorimetry of total phenolics with phosphomolybdic-phosphotungstic acid reagents. Am. J. Enol.
Vitic. 16, 144–158 (1965).
28. Sharma, O. P. & Bhat, T. K. DPPH antioxidant assay revisited. Food Chem. 113, 1202–1205 (2009).
29. Re, R. et al. Antioxidant activity applying an improved ABTS radical cation decolorization assay. Free Radic. Biol. Med. 26,
1231–1237 (1999).
30. Benzie, I. F. F. & Strain, J. J. The ferric reducing ability of plasma (FRAP) as a measure of ‘antioxidant power’: The FRAP assay.
Anal. Biochem. 239, 70–76 (1996).
31. Kiehlbauch, J. A. et al. Use of the National Committee for Clinical Laboratory Standards guidelines for disk diffusion susceptibility
testing in New York state laboratories. J. Clin. Microbiol. 38, 3341–3348 (2000).
32. Ravi Kiran, C. et al. Influence of cultivar and maturity at harvest on the essential oil composition, oleoresin and [6]-gingerol
contents in fresh ginger from Northeast India. J. Agric. Food Chem. 61, 4145–4154 (2013).
Acknowledgements
This research work was partially supported by Chiang Mai University, by Research and Researchers for Indus-
tries Scholarship (RRI, MSD59I0047) under Thailand Research Fund (TRF) and by Hsu Chuan Foods Co., Ltd.,
Chiang Mai, Thailand.
Author contributions
A. K. interpreted the results and write the manuscript, S. S. conducted and collected test data and interpreted
the results, P. W. analyses antimicrobial activity, N. U. designed and managed the experiments, reviewed and
revised the manuscript.
Competing interests
The authors declare no competing interests.
Additional information
Correspondence and requests for materials should be addressed to A.K.
Reprints and permissions information is available at www.nature.com/reprints.
Publisher’s note Springer Nature remains neutral with regard to jurisdictional claims in published maps and
institutional affiliations.
Open Access This article is licensed under a Creative Commons Attribution 4.0 International
License, which permits use, sharing, adaptation, distribution and reproduction in any medium or
format, as long as you give appropriate credit to the original author(s) and the source, provide a link to the
Creative Commons licence, and indicate if changes were made. The images or other third party material in this
article are included in the article’s Creative Commons licence, unless indicated otherwise in a credit line to the
material. If material is not included in the article’s Creative Commons licence and your intended use is not
permitted by statutory regulation or exceeds the permitted use, you will need to obtain permission directly from
the copyright holder. To view a copy of this licence, visit http://creativecommons.org/licenses/by/4.0/.
© The Author(s) 2021
Scientific Reports | (2021) 11:14870 | https://doi.org/10.1038/s41598-021-94430-y 10
Vol:.(1234567890)You can also read