Use of 13C-qNMR Spectroscopy for the Analysis of Non-Psychoactive Cannabinoids in Fibre-Type Cannabis sativa L. (Hemp) - MDPI
←
→
Page content transcription
If your browser does not render page correctly, please read the page content below
molecules
Article
Use of 13C-qNMR Spectroscopy for the Analysis of
Non-Psychoactive Cannabinoids in Fibre-Type
Cannabis sativa L. (Hemp)
Lucia Marchetti 1,2 , Virginia Brighenti 1 , Maria Cecilia Rossi 3 , Johanna Sperlea 1,4 ,
Federica Pellati 1, * and Davide Bertelli 1
 1   Department of Life Sciences, University of Modena and Reggio Emilia, Via G. Campi 103,
     41125 Modena, Italy; lucia.marchetti@unimore.it (L.M.); virginia.brighenti@unimore.it (V.B.);
     johanna.sperlea@ernaehrung.uni-giessen.de (J.S.); davide.bertelli@unimore.it (D.B.)
 2   Doctorate School in Clinical and Experimental Medicine (CEM), University of Modena and Reggio Emilia,
     41125 Modena, Italy
 3   Centro Interdipartimentale Grandi Strumenti, University of Modena and Reggio Emilia, Via G. Campi
     213/A, 41125 Modena, Italy; mariacecilia.rossi@unimore.it
 4   Faculty of Agricultural Sciences, Nutritional Sciences, and Environmental Management, Justus-Liebig
     University of Giessen, Goethestrasse 58, 35390 Giessen, Germany
 *   Correspondence: federica.pellati@unimore.it; Tel.: +39-059-2058-565

 Academic Editor: Ioannis P. Gerothanassis

 Received: 26 February 2019; Accepted: 20 March 2019; Published: 22 March 2019

 Abstract: Cannabis sativa L. is a dioecious plant belonging to the Cannabaceae family. The discovery
 of the presence of many biologically-active metabolites (cannabinoids) in fibre-type Cannabis (hemp)
 has recently given rise to the valorisation of this variety. In this context, the present study was aimed
 at the multi-component analysis and determination of the main non-psychoactive cannabinoids
 (cannabidiol, cannabidiolic acid, cannabigerol and cannabigerolic acid) in female inflorescences of
 different hemp varieties by means of 13 C quantitative nuclear magnetic resonance spectroscopy
 (qNMR). The method proposed here for the first time for the determination of cannabinoids provided
 reliable results in a competitive time with respect to the more consolidated HPLC technique.
 In fact, it gave sufficiently precise and sensitive results, with LOQ values lower than 750 µg/mL,
 which is easily achievable with concentrated extracts, without affecting the quality of 13 C-qNMR
 spectra. In conclusion, this method can be considered as a promising and appropriate tool for the
 comprehensive chemical analysis of bioactive cannabinoids in hemp and other derived products in
 order to ensure their quality, efficacy and safety.

 Keywords:      13 C-qNMR;    HPLC; Cannabis sativa L.; hemp; cannabinoids; cannabidiol; cannabigerol

1. Introduction
     Cannabis sativa L. was one of the first cultivated plants, and it was further adapted by humans
to a variety of needs: technical (textiles, construction and paper industries), nutritional (food),
medicinal and therapeutic, since it contains over 150 bioactive phytocannabinoids [1]. It is an annual
dioecious plant belonging to the Cannabaceae family and it growths almost in every developed
country of the world [2]. Taxonomic studies have raised a critical issue, owing to the huge variability
of specimens within the same genus but, in the scientific community, a monotypic classification is
currently preferred [3]. According to this agreement, one single species (C. sativa) has been supposed,
and several chemotypes based on the specific cannabinoid profile have been identified [4]. The two
principal phenotypes of interest are the drug-type and the fibre-type Cannabis, also known as “hemp”.
The first is rich in psychoactive ∆9 -tetrahydrocannabinol (∆9 -THC), and it is used for medicinal or

Molecules 2019, 24, 1138; doi:10.3390/molecules24061138                    www.mdpi.com/journal/molecules
Molecules 2019, 24, 1138 2 of 12
recreational purposes, while the second has a content of ∆9 -THC below 0.2–0.3% in dry weight plant
material of the upper one-third of the crop; this legal limit was established by the European Industrial
Hemp Association (EIHA), in accordance with international regulations [5,6]. Discovering the presence
of many biologically active metabolites also in fibre-type Cannabis has allowed the valorisation of this
latter variety [7,8]. Moreover, the current favourable regulatory framework encourages pharmaceutical
and nutraceutical companies to develop and produce dietary supplements containing plant extracts
aimed at the maintenance or the recovery of human and animal wellbeing.
Hemp non-psychoactive cannabinoids include cannabidiol (CBD), cannabigerol (CBG) and their
related acids, that accumulate principally within glandular trichomes of female inflorescences [9,10].
Cannabidiolic acid (CBDA) and cannabigerolic acid (CBGA) are biosynthesized in plants as prenylated
aromatic carboxylic acids and their neutral counterparts (CBD and CBG) are generated as a
consequence of the spontaneous decarboxylation that can occur either by heat or light for instance
during long storage processes [7,9,11]. This assumption is supported by the fact that almost no neutral
cannabinoid can be detected in the fresh plant material [12].
While ∆9 -THC has led to the discovery of the endocannabinoid system, the molecular basis of
CBD activity is still challenging pharmacologists, especially when conventional treatment is of no
avail, e.g. for genetic epilepsy [1]. Many studies in the literature have proved that CBD has anxiolytic
and neuroprotective properties [13–15] and, moreover, that it has anticholinesterase and antiemetic
effects [16]. CBD and CBG have both revealed to exert antibacterial properties against a variety
of methicillin-resistant Staphylococcus aureus strains [17]. CBG has also shown anti-inflammatory
activity [18], and it has been associated with muscle relaxation and analgesia by activating α-2
receptors [19]. On the other hand, CBDA has been shown to possess an anti-proliferative effect
on breast cancer cell migration [20].
Concerning C. sativa chemical composition, in addition to the cannabinoid fraction, over 20
flavonoids have been identified and they belong to the chemical classes of flavones or flavonols.
In particular, cannflavin A, cannflavin B and cannflavin C are the major hemp prenylated flavanones [7],
that are peculiar for this plant. Hemp seed-oil has demonstrated antioxidant activity, which is probably
due to the high content of flavonoids [21,22]. When utilized as a food source, hemp seeds have exhibited
excellent nutraceutical properties [23]. The seed oil is rich in phytosterols, vitamins, minerals and
amino acids; in particular, it has a high content of essential polyunsaturated fatty acids, such as
linoleic acid (18:2, ω-6) and α-linolenic acid (18:3, ω-3) [23]. Cannabis essential oil extracted from
the inflorescences is composed of monoterpenes (β-myrcene, α- and β-pinene and limonene) and
sesquiterpenes (β-caryophyllene, α-humulene and caryophyllene oxide) [8], which exert synergistic
actions against cancer and they showed analgesic properties [24]. Hemp essential oil has today different
applications in nutraceuticals, cosmetics and insect control purposes in agriculture [25].
In addition to separation techniques involving chromatography, Nuclear Magnetic Resonance
(NMR) spectroscopy can be applied to the analysis of the composition of plant extracts, in the structure
elucidation of compounds in metabolomics as well as in their quantification [26]. The measuring
principle is based on the effect of an external magnetic field on spin possessing atomic nuclei 1 H
and 13 C. Due to changes in the intramolecular magnetic field around an atom, absorption and
emission of electromagnetic radiation take place. Then, the resonance is detected with a radio receiver.
The Fourier transform converts the complex time domain signal emitted by the nuclei into the frequency
domain spectrum.
Quantitative NMR (qNMR) refers to the application of NMR in order to determine the
concentration of one or more target compounds in solution. The underlying principle is the
direct proportional correlation of the area of a signal to the number of nuclides contributing to
it. This proportionality depends on pulse excitation, delay time and broad-band decoupling; therefore,
constant conditions are necessary [26,27]. Nowadays, there is an increasing interest in the application
of qNMR, due to its numerous advantages over chromatographic methods. Indeed, qNMR enables
the simultaneous identification and quantification of many analytes, also chemically very different,Molecules 2019, 24, 1138 3 of 12
Molecules 2019, 24, x FOR PEER REVIEW 3 of 12
in complex mixtures with a reduced time of analysis and a lower solvent usage, compared with the
in complex mixtures with a reduced time of analysis and a lower solvent usage, compared with the
HPLC technique [28,29].
HPLC technique [28,29].
In the light of all the above, the aim of this study was the development of a reliable 13 13
C-qNMR
In the light of all the above, the aim of this study was the development of a reliable C-qNMR
method for the comprehensive characterisation and determination of the main non-psychoactive
method for the comprehensive characterisation and determination of the main non-psychoactive
cannabinoids (CBD, CBDA, CBG, CBGA) in eight different hemp varieties. The obtained results
cannabinoids (CBD, CBDA, CBG, CBGA) in eight different hemp varieties. The obtained results were
were compared with those provided by a previously developed method based on high-performance
compared with those provided by a previously developed method based on high-performance liquid
liquid chromatography (HPLC) [7,8,30]. 13The 13 C-qNMR method developed in this study for the first
chromatography (HPLC) [7,8,30]. The C-qNMR method developed in this study for the first time
time produced satisfactory results in a competitive time with respect to the most widespread and
produced satisfactory results in a competitive time with respect to the most widespread and
consolidated technique for cannabinoid analysis (HPLC), thus demonstrating to be suitable for a
consolidated technique for cannabinoid analysis (HPLC), thus demonstrating to be suitable for a
multi-component analysis of hemp extracts. This technique could also be useful to gain a holistic
multi-component analysis of hemp extracts. This technique could also be useful to gain a holistic view
view of the composition and chemical profile of different hemp varieties, and it can be applied for the
of the composition and chemical profile of different hemp varieties, and it can be applied for the
quality control of both the plant material and derivatives.
quality control of both the plant material and derivatives.
2. Results and Discussion
2. Results and Discussion
2.1. NMR Spectroscopic Data of Extracts from Hemp Inflorescences
2.1. NMR Spectroscopic Data of Extracts from Hemp Inflorescences
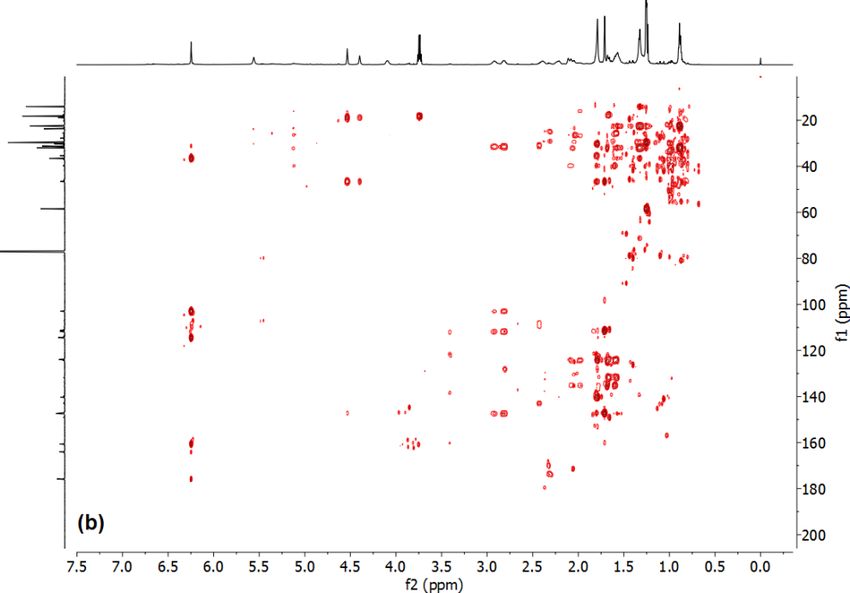
Typical 1 H, 13 C, HSQC and HMBC spectra of a Santhica extract are shown in Figures 1–3.
Typical 1H, 13C, HSQC and HMBC spectra of a Santhica extract are shown in Figures 1–3.
Figure 1. Typical 1 H spectrum of a hemp ethanolic extract.
Figure 1. Typical 1H spectrum of a hemp ethanolic extract.Molecules 2019, 24, 1138 4 of 12
Molecules 2019, 24, x FOR PEER REVIEW 4 of 12
Molecules 2019, 24, x FOR PEER REVIEW 4 of 12
Figure 2. Typical 1313C spectrum of a hemp ethanolic extract; the enlarged region shows the high
Figure2.2.Typical
Figure Typical 13CCspectrum
spectrumofofaahemp
hempethanolic
ethanolicextract;
extract;the
theenlarged
enlargedregion
regionshows
showsthe
thehigh
high
spectral resolution.
spectral resolution.
spectral resolution.
Figure 3. Cont.Molecules 2019, 24, 1138 5 of 12
Molecules
Molecules 2019,
2019, 24,
24, xx FOR
FOR PEER
PEER REVIEW
REVIEW 55 of
of 12
12
Figure
Figure 3.
3. Typical
Typical HSQC
Typical HSQC (a)
(a) and
and HMBC
HMBC (b)
(b) spectra
spectra of
of aa hemp
hemp ethanolic
ethanolic extract.
extract.
The spectra
The spectra of
of samples
samples and
and standard
standard compounds
compounds werewere compared,
compared, and
and the
the results
results led
led to
to the
the
assignments for CBD, CBG, CBDA and CBGA shown in Figure 4. The chemical shifts in
assignments for CBD, CBG, CBDA and CBGA shown in Figure 4. The chemical shifts in deuterated deuterated
1 and 1313
chloroform for
for 11H
H and 13C
C are
areshown
shownininTables
Table1 1–2,
and 2, expressed
expressed asasppm
ppmrelated
relatedto
to tetramethylsilane
tetramethylsilane
(TMS).
(TMS).
Figure 4. Chemical structures of hemp non-psychoactive cannabinoids.
Figure
Figure 4.
4. Chemical
Chemical structures
structures of
of hemp
hemp non-psychoactive
non-psychoactive cannabinoids.
cannabinoids.
Table
Table 1.
1. 11H
H assignments
assignments for
for hemp
hemp cannabinoids
cannabinoids in
in CDCl
CDCl3.3.
CBD
CBD CBDA
CBDA CBG
CBG CBGA
CBGA
11H
Haa 11H
Haa 11H
Haa 11H
Haa
11 3.86
3.86 (1H,
(1H, m,m, 11.8
11.8 Hz)
Hz) 3.88
3.88 (1H,
(1H, m,m, 11.0
11.0 Hz)
Hz) 1.33
1.33 (2H,
(2H, d,
d, 7.0
7.0 Hz)
Hz) 1.79
1.79 (2H,
(2H, d,
d, 7.4
7.4 Hz)
Hz)
22 5.55
5.55 (1H,
(1H, s) s) 5.55
5.55 (1H,
(1H, s)s) 5.27
5.27 (1H,
(1H, t,t, 7.0
7.0 Hz)
Hz) 5.27
5.27 (1H,
(1H, t,t, 7.0
7.0 Hz)
Hz)
33 -- -- -- --
44 2.10
2.10 (1H,
(1H, m);
m); 2.20
2.20 (1H,
(1H, m)
m) 2.10
2.10 (1H,
(1H, m)
m) 2.20
2.20 (1H,
(1H, m)
m) 2.04
2.04 (2H,
(2H, t,t, 6.6
6.6 Hz)
Hz) 2.04
2.04 (2H,
(2H, t,t, 6.6
6.6 Hz)
Hz)
55 1.84
1.84 (2H,
(2H, q,q, 3.0
3.0 Hz)
Hz) 1.86
1.86 (2H,
(2H, q,q, 3.0
3.0 Hz)
Hz) 2.07
2.07 (2H,
(2H, q,
q, 6.5
6.5 Hz)
Hz) 2.07
2.07 (2H,
(2H, q,
q, 6.5
6.5 Hz)
Hz)
66 2.40
2.40 (1H,
(1H, m) m) 2.40
2.40 (1H,
(1H, m)m) 5.56
5.56 (1H,
(1H, m) m) 5.05
5.05 (1H,
(1H, t,t, 6.6
6.6 Hz)
Hz)Molecules 2019, 24, 1138 6 of 12
Table 1. 1 H assignments for hemp cannabinoids in CDCl3.
CBD CBDA CBG CBGA
1H a 1H a 1H a 1H a
1 3.86 (1H, m, 11.8 Hz) 3.88 (1H, m, 11.0 Hz) 1.33 (2H, d, 7.0 Hz) 1.79 (2H, d, 7.4 Hz)
2 5.55 (1H, s) 5.55 (1H, s) 5.27 (1H, t, 7.0 Hz) 5.27 (1H, t, 7.0 Hz)
3 - - - -
4 2.10 (1H, m); 2.20 (1H, m) 2.10 (1H, m) 2.20 (1H, m) 2.04 (2H, t, 6.6 Hz) 2.04 (2H, t, 6.6 Hz)
5 1.84 (2H, q, 3.0 Hz) 1.86 (2H, q, 3.0 Hz) 2.07 (2H, q, 6.5 Hz) 2.07 (2H, q, 6.5 Hz)
6 2.40 (1H, m) 2.40 (1H, m) 5.56 (1H, m) 5.05 (1H, t, 6.6 Hz)
7 1.79 (3H, s) 1.79 (3H, s) 1.79 (3H, s) 1.80 (3H, s)
8 - - - -
9 1.66 (3H, s) 1.72 (3H, s) 1.68 (1H, s) 1.67 (3H, s)
10 4.40 (2H, m) 4.54 (2H, m) 1.58 (1H, s) 1.58 (3H, s)
1’ - - - -
2’ - - - -
3’ 6.26 (1H, brs) - 6.0 (1H, s) -
4’ - - - -
5’ 6.16 (1H, brs) 6.26 (1H, s) 6.24 (1H, s) 6.23 (1H, s)
6’ - - - -
1” 2.42 (2H, t, 7.5 Hz) 2.42 (2H, t, 7.5 Hz) 2.44 (2H, t, 7.5 Hz) 2.88 (2H, t, 7.6 Hz)
2” 1.57 (2H, m) 1.58 (2H, m) 1.54 (2H, m) 2.10 (2H, m)
3” 1.30 (2H, m) 1.33 (2H, m) 1.56 (2H, m) 1.32 (2H, m)
4” 1.31 (2H, m) 1.34 (2H, m) 1.57 (2H, m) 1.32 (2H, m)
5” 0.89 (3H, t, 6.8 Hz) 0.90 (3H, t, 6.8 Hz) 0.88 (3H, t, 6.9 Hz) 0.89 (3H, t, 6.9 Hz)
a The number of protons, multiplicity and coupling costants are shown in brackets.
Table 2. 13 C assignments for hemp cannabinoids in CDCl3.
CBD CBDA CBG CBGA
13 C T1 s 13 C T1 s 13 C T1 s 13 C T1 s
1 37.0 * 1.32 36.7 * 1.51 22.5 * 1.35 25.7 * 1.54
2 124.3 * 1.20 124.0 * 1.35 121.8 * 1.89 121.5 * 1.92
3 139.9 5.52 140.3 - 140.2 6.02 138.8 -
4 31.5 2.10 31.3 - 39.7 3.00 39.7 -
5 28.4 0.97 27.8 - 26.3 1.02 26.4 -
6 46.2 * 1.90 46.6 * 1.91 123.8 2.05 123.8 -
7 23.4 * 1.41 23.7 * 1.61 16.0 * 1.23 16.2 * 1.40
8 149.9 5.52 147.2 - 132.0 5.50 131.7 -
9 20.3 2.67 18.9 - 23.4 2.68 23.4 -
10 110.8 * 0.96 111.3 * 1.10 17.6 1.03 17.8 -
1’ 113.8 8.08 114.4 - 110.7 6.66 111.1 -
2’ 156.0 - 164.1 ** 2.5 154.9 - 163.5 ** 2.65
3’ 108.3 - 103.1 - 108.3 - 103.6 -
4’ 142.9 - 147.2 - 142.7 - 147.5 -
5’ 108.3 - 111.7 - 108.3 - 111.8 -
6’ 153.9 - 160.1 ** 2.7 154.9 - 160.8 ** 2.81
1” 35.5 * 1.95 35.4 * 1.95 35.6 * 1.23 36.3 * 1.25
2” 30.4 * 1.12 29.7 * 1.12 30.8 * 1.06 30.2 * 1.10
3” 30.7 * 1.47 30.2 * 1.47 31.5 * 1.50 31.4 * 1.52
4” 22.5 3.82 22.5 3.88 22.5 3.90 22.5 3.92
5” 14.1 3.19 14.1 3.23 14.1 3.20 14.1 3.36
-COOH - - 175.3 ** 3.1 - - 176.0 ** 3.11
* Signals with T1 < 2 s used for quantification. ** Signal with T1 > 2 s used for quantification. T1 was measured,
when possible, by using standard compounds.
As shown in Figure 1, the protonic spectrum presents a huge number of overlapped peaks,
thus requiring an extensive use of deconvolution for signal integration, which can introduce some
accuracy issues. To overcome this problem, in this work, 13 C-qNMR was evaluated for the firstMolecules 2019, 24, 1138 7 of 12
time for the determination of cannabinoids in hemp extracts [26]. As shown in Figure 2 and Table 2,
carbon signals are better resolved and easier to deal with for quantitative purpose. In this context,
in these experimental conditions evident signal doubling, due to conformational equilibria, and line
broadening did not occur. In particular, all the signals used for CBD and CBG quantification showed a
measured average half width of 1.25 Hz (maximum 1.5 Hz). CBDA and CBGA signals were slightly
broader; in this case, the average half width was 3.3 Hz (maximum 4 Hz). This line broadening effect
did not invalidate or affect the quantification of these compounds, considering that the differences
between qNMR and HPLC data are limited and not significant (Table 3).
Table 3. qNMR data (mg/g) of cannabinoids in hemp inflorescences compared with HPLC.
CBD CBDA CBG CBGA
qNMR HPLC * qNMR HPLC * qNMR HPLC qNMR HPLC
a 0.6 a
Antal 2.2 ± 0.2 2.4 ± 0.1 15.7 ± 0.5 15.5 ± 0.7Molecules 2019, 24, 1138 8 of 12
linearity (r2 = 0.9998). The method proposed here provided also a good intra- and inter-day precision,
with percentage relative standard deviation (%RSD) values of 0.8 and 1.5%, respectively. With regards
to the limit of detection (LOD), in these experimental conditions the lowest concentrations which
presented clearly distinguishable signals from the spectral background were 0.6, 0.5, 0.6 and 0.5 mM
for CBD, CBDA, CBG and CBGA, respectively, corresponding to LOD values of 188, 180, 190 and
180 µg/mL in the NMR tube. The lowest quantification limits (LOQ), by applying the below mentioned
S/N restriction, corresponded to 2.11, 2.15, 2.10 and 2.18 mM for CBD, CBDA, CBG and CBGA,
respectively, with relative LOQ values of 660, 746, 664 and 746 µg/mL in the NMR tube.
2.3. Quantitative Analysis of Hemp Inflorescences
Quantitative results of hemp inflorescences obtained by 13 C-qNMR are shown in Table 3,
compared to those obtained by HPLC [7,8,30]. Data are expressed as mean (mg/g) ± standard
deviation (SD), dry weight. These values correspond to the overall means of three replicates for all the
considered signals for each compound. The results provided by 13 C-qNMR and HPLC are comparable,
without meaningful differences. It should also be considered that the signals tentatively used for
CBDA and CBGA with T1 > 2 s (** in Table 2) provided very similar quantitative results as well
as those with the lower relaxing times, thus demonstrating the method’s ruggedness. In particular,
13 C-qNMR seems to slightly underestimate the CBD and CBG content with respect to HPLC, since this
situation occurs for every cultivar. The mean recovered amounts of CBD and CBDA were significantly
higher respect those of CBG and CBGA; this finding is supported by other studies, in which the
measured concentrations for these cannabinoids were undetectable or very low [8,30]. In the majority
of samples (Antal, Carmagnola, China, Fibrante, Futura and Santhica), the acidic compounds were
more concentrated with respect to their neutral counterparts, demonstrating that the extraction method
is able to limit the decarboxylation process. Codimono was the cultivar which provided the highest
content of CBD, while Futura was the one with the highest amount of CBDA. With regards to CBG,
only one hemp variety (Santhica) showed a concentration over the LOQ value. CBGA contents were
determined instead for Antal, Carmagnola, Futura and Santhica, with the latter two varieties being the
richest ones.
The 13 C-qNMR method here proposed for the quantification of non-psychoactive cannabinoids
in hemp provided reliable results in comparison to the most commonly and consolidated HPLC
technique. The validation confirmed the ruggedness of this qNMR approach, which was found to be
precise and sufficiently sensitive. In conclusion, this 13 C-qNMR method is suitable and advantageous
for a multi-component analysis of cannabinoids in hemp extracts. This technique could be useful to
gain a holistic view of the composition and chemical profile of different hemp varieties, and it could be
applied in the quality control of both the plant material and its derivatives.
3. Materials and Methods
3.1. Chemicals and Solvents
CBD, CBDA, CBG and CBGA standard solutions (1 mg/mL in methanol or acetonitrile) were
purchased from Cerilliant (Round Rock, TX, USA). Deuterated chloroform (CDCl3 ), tetramethylsilane
(TMS) and ethanol (EtOH) of analytical grade were from Sigma-Aldrich (Milan, Italy).
3.2. Hemp Plant Material
Eight samples of fibre-type female inflorescences were analysed in this study, including Antal,
Carma, Carmagnola, China, Codimono, Fibrante, Futura and Santhica. These samples (about 100–500 g
of dry material each), belonging to different breeding lines, were cultivated under the same agronomic
conditions and they were kindly provided by Dr. Gianpaolo Grassi of the research centre CREA-CIN
(Rovigo, Italy). Each sample was certified for a content of ∆9 -THC below 0.2% (w/w). All the samples
considered in this study were approved for commercial use by the European Union [31].Molecules 2019, 24, 1138 9 of 12
3.3. Sample Preparation
Hemp inflorescences were manually separated from twigs and seeds. After this procedure, the
samples were stored at +4.0 ◦ C until analysis. Cannabinoids were extracted from hemp inflorescences
by means of dynamic maceration, as previously described in detail [7,8]. A weighed amount of
each sample (1 g) was extracted with 20 mL of absolute EtOH at room temperature for 15 min,
under magnetic stirring. The solution was then paper filtered and the residue was extracted with
the same procedure twice more with 20 and 10 mL of same solvent, respectively. The filtrates were
then combined and adjusted to 50 mL with EtOH in a volumetric flask. The extraction procedure was
repeated twice for each sample.
To prepare NMR tubes, the extracts were evaporated under vacuum at 30 ◦ C and the residue
was dissolved in 1 mL of CDCl3 (0.03% TMS); finally, 600 µL of this solution were transferred to a
WILMAD® NMR tube, 5 mm, Ultra-Imperial grade, 7 in. L, 528-PP (Sigma-Aldrich, Milan, Italy).
3.4. NMR Spectroscopy and Spectra Acquisition Procedures
To characterize samples 1 H-NMR, 13 C-NMR, two-dimensional 1 H-13 C Heteronuclear
Multiple-Bond Correlation (HMBC) and 1 H-13 C Heteronuclear Single Quantum Coherence (HSQC)
spectra were acquired with a Bruker FT-NMR Avance III HD 600 MHz spectrometer (Bruker Biospin
GmbH Rheinstetten, Karlsruhe, Germany). All the experiments were performed at 300 K and
non-spinning. The assignments for the major compounds were carried out by using standard
compounds and by comparison of 1 H-NMR and 13 C-NMR spectra with literature data.
1 H-NMR (i.e., 1D NOESY) experiments were acquired by using the Bruker sequence
“noesygppr1d” for residual CDCl3 pre-saturation; the acquisition parameters were as follows:
time domain (number of data points), 64 K; dummy scans, 0; number of scans, 128; acquisition
time, 3.41 s; delay time, 8 s; spectral width, 16 ppm (9615 Hz), fid resolution 0.2935 Hz; digitization
mode, baseopt. Total acquisition time was 24 min and 26 s.
13 C-qNMR quantification experiments were performed by using a 1D inverse gated decoupling
sequence to avoid NOE during relaxation (Bruker sequence: “zgpg_pisp_f2.fas”). The acquisition
parameters were as follows: time domain (number of data points), 64 K; dummy scans, 10; number of
scans, 256; acquisition time, 1 s; delay time, 10 s; spectral width, 220 ppm (33333 Hz); fid resolution,
1.017 Hz; digitization mode, baseopt; the proton decoupling power, 0 db. Total acquisition time was
47 min.
The acquisition parameters for the HMBC experiments (Bruker sequence “hmbcetgpl3nd” with
three-fold low-pass J-filter to suppress one-bond-correlations) were as follows: time domain, 4 K in
the acquisition or direct HMBC dimension F2 (1 H) and 256 in indirect HMBC dimension F1 (13 C);
dummy scans, 16; number of scans, 8; acquisition time, 0.310 s; delay time, 1.5 s; delay time for
evolution of long range couplings, 62.5 µs; spectral width, 11 ppm (6602 Hz) in F2 (1 H) and 210
ppm (31692 Hz in F1) (13 C); fid resolution, 3.22 Hz (F2) 247.60 Hz (F1); digitization mode, baseopt.
J-coupling for one-bond correlations suppression: 1J (XH) Min 120 Hz, 1J (XH) Max 170 Hz; J (XH)
long range, 8 Hz. Total acquisition time was 1 h and 5 min.
The acquisition parameters for the HSQC experiments (Bruker sequence “hsqcedetgpsp.3”) were
as follows: time domain, 2 K in the acquisition or direct HSQC dimension F2 (1 H) and 256 in indirect
HSQC dimension F1 (13 C); dummy scans, 16; number of scans, 8; acquisition time, 0.156 s, delay time,
2 s; spectral width, 11 ppm (6602 Hz) in F2 (1 H) and 210 ppm (31693 Hz in F1) (13 C); fid resolution,
6.45 Hz (F2) 247.60 Hz (F1); digitization mode, baseopt. J-coupling for one-bond correlation selection
1J (XH) 145 Hz. Total acquisition time was 1 h and 15 min.
After introducing the sample into the probe, at least 5 min were required to achieve a thermal
equilibrium. Afterwards, the magnetic field was locked, the probe head was tuned and matched and,
finally, the sample was shimmed. To assure the highest reproducibility, all these procedures were
automatically executed. The correct 90◦ pulse was calibrated for protonic and bi-dimensional spectra
with the Bruker AU program “pulsecal” and the receiver gain was set.Molecules 2019, 24, 1138 10 of 12
3.5. 13 C-qNMR Procedure
Quantitative NMR was performed by using the Concentration Conversion Factor (CCF) method,
implemented in Mnova®12.0 (Mestrelab Research, S.L., Santiago de Compostela, Spain) software.
A CBD standard solution (1 mg/mL) was used as the external reference compound. The CCF provided
by this analysis was verified and corrected by using a commercial standard of 40% dioxane in
benzene-d6 (Bruker Biospin GmbH Rheinstetten, Karlsruhe, Germany). This solution is normally
used for 13 C sensitivity test; in our case, the signal at 66.69 ppm (corresponding to the four equivalent
carbons) was used for the quantification. In order to determine the correct delay time (D1 ), T1 was
measured for both dioxane and the standard compounds, when possible. In the case of acidic
compounds, the T1 of the signals related to the presence of carboxylic groups was directly estimated
in the sample richest in CBDA and CBGA. For T1 determination, the Bruker Sequence “T1 IR” was
employed. The following parameters were applied: a list of 8 increasing delay times (from 0.2 to 20 s);
delay time, 20 s; number of scans, 32; total acquisition time, 2 h. A D1 time equal to 10 s (5*T1 ) was
set to ensure the nuclei complete relaxation during acquisition. Moreover, only signals presenting
a signal to noise ratio (S/N) ≥ 50 were used for quantification. An exponential window function,
with a line broadening (lb) equal to 0.3, was selected for spectra transformation. Each spectrum was
calibrated according to TMS signal and then an automatic zero order phase and base line correction
were applied, before peak integration. The quantification tool of Mnova requires a multiplet analysis
for the integration; therefore, after the initial spectra processing, a manual multiplet analysis was
performed and the peak area of signals belonging to the target compounds were compared to the
area of those generated by the CBD standard solution, whose spectrum was acquired under the same
conditions. The results were then corrected with the correction factor obtained from the dioxane
standard solution. The resonances suitable for quantification are marked with * in Table 1. In general,
more than one signal should be integrated for each compound. In the cases of CBD and CBDA,
eight carbons having the required characteristics were chosen and they were used to calculate the
average concentration of related compounds. For CBG and CBGA, six resonances were selected.
In addition, both CBDA and CBGA showed three well resolved peaks, in the region ranging from
160 to 180 ppm, related to the presence of the carboxylic group on the aromatic ring, which were also
used for quantification and they are marked with ** in Table 1. All the acquisitions were performed
in triplicate.
3.6. HPLC Analysis
The HPLC analysis was intended to verify 13 C-qNMR results and it was carried out by using the
previously validated method [7,8,30].
3.7. Method Validation
Since that the validation procedure for the extraction and HPLC analysis of hemp extracts has
already been discussed [7,8,30], the attention was focused on the 13 C-qNMR method in the present
work. Linearity was investigated by analyzing both standard solutions at different concentrations
(from 2 to 100 mM) and a sample prepared with different dilution factors. Linearity was evaluated by
calculating the CCF of the selected signals for quantitative analysis in the aforementioned samples and
verifying its constancy inside the concentration range. Precision was assessed by analyzing the same
extract five times for three different days. The LOD for the target compounds (CBD, CBDA, CBG and
CBGA) was determined by gradually diluting a sample containing measurable amounts of the four
molecules, until a S/N ratio equal to 3 was reached. Since only signals with a S/N ratio > 50 were
considered to be suitable for quantification, the LOQ value was calculated by considering the area of a
signal with a S/N equal to 49.Molecules 2019, 24, 1138 11 of 12
Author Contributions: Conceptualization, D.B.; Methodology, L.M., D.B., M.C.R.; Software, L.M. and D.B.;
Validation, L.M. and V.B.; Formal Analysis, L.M. and D.B.; Investigation, L.M., V.B., J.S.; Resources, D.B and F.P.;
Data Curation, L.M., D.B., F.P.; Writing—Original Draft Preparation, L.M. and D.B.; Writing—Review and Editing,
F.P. and D.B.; Visualization, L.M. and D.B; Supervision, F.P. and D.B.; Funding Acquisition, D.B and F.P.
Funding: This research received no external funding.
Acknowledgments: The authors want to express their thanks to the C.I.G.S. staff (Centro Interdipartimentale
Grandi Strumenti, Modena, Italy) for the precious assistance during the experimental work and to Fondazione
Cassa di Risparmio di Modena for the purchase of Bruker FT-NMR Avance III HD 600 MHz spectrometer.
Moreover, the authors want to express special thanks to Gianpaolo Grassi (CREA-CIN, Rovigo, Italy) for kindly
providing samples of hemp inflorescences.
Conflicts of Interest: The authors declare no conflict of interest. The funders had no role in the design of the
study; in the collection, analyses, or interpretation of data; in the writing of the manuscript, or in the decision to
publish the results.
References
1. Appendino, G.; Taglialatela-Scafati, O. Cannabinoids: Chemistry and Medicine. In Natural Products;
Springer Berlin Heidelberg: Berlin/Heidelberg, Germany, 2013; pp. 3415–3435.
2. Karlov, G.I.; Razumova, O.V.; Alexandrov, O.S.; Divashuk, M.G.; Kroupin, P.Y. Classical and Molecular
Cytogenetics of Cannabis sativa L. In Cannabis sativa L.-Botany and Biotechnology; Springer International
Publishing: Cham, Switzerland, 2017; pp. 385–394.
3. ElSohly, M.A.; Lata, H.; Chandra, S. Cannabis sativa L.-botany and biotechnology; Springer: Berlin, Germany,
2017; ISBN 9783319545646.
4. Aizpurua-Olaizola, O.; Soydaner, U.; Öztürk, E.; Schibano, D.; Simsir, Y.; Navarro, P.; Etxebarria, N.;
Usobiaga, A. Evolution of the cannabinoid and terpene content during the growth of Cannabis sativa plants
from different chemotypes. J. Nat. Prod. 2016, 79, 324–331. [CrossRef] [PubMed]
5. Yan, X.; Tang, J.; dos Santos Passos, C.; Nurisso, A.; Simões-Pires, C.A.; Ji, M.; Lou, H.; Fan, P. Characterization
of lignanamides from hemp (Cannabis sativa L.) seed and their antioxidant and acetylcholinesterase inhibitory
activities. J. Agric. Food Chem. 2015, 63, 10611–10619. [CrossRef] [PubMed]
6. Sarmento, L. Scientifically sound guidelines for THC in food in Europe. Available online: http://eiha.org/
media/2015/08/15-07-24-Report-Scientifically-Safe-Guidelines-THC-Food-nova-EIHA.pdf (accessed on
5 February 2019).
7. Brighenti, V.; Pellati, F.; Steinbach, M.; Maran, D.; Benvenuti, S. Development of a new extraction technique
and HPLC method for the analysis of non-psychoactive cannabinoids in fibre-type Cannabis sativa L. (hemp).
J. Pharm. Biomed. Anal. 2017, 143, 228–236. [CrossRef] [PubMed]
8. Pellati, F.; Brighenti, V.; Sperlea, J.; Marchetti, L.; Bertelli, D.; Benvenuti, S.; Pellati, F.; Brighenti, V.; Sperlea, J.;
Marchetti, L.; et al. New methods for the comprehensive nalysis of bioactive compounds in Cannabis sativa L.
(hemp). Molecules 2018, 23, 2639. [CrossRef] [PubMed]
9. Happyana, N.; Kayser, O. Monitoring metabolite profiles of Cannabis sativa L. trichomes during flowering
period using 1 H NMR-based metabolomics and real-time PCR. Planta Med. 2016, 82, 1217–1223. [CrossRef]
[PubMed]
10. Ross, S.A.; ElSohly, M.A.; Sultana, G.N.N.; Mehmedic, Z.; Hossain, C.F.; Chandra, S. Flavonoid glycosides
and cannabinoids from the pollen of Cannabis sativa L. Phytochem. Anal. 2005, 16, 45–48. [CrossRef]
11. Flores-Sanchez, I.J.; Verpoorte, R. PKS Activities and biosynthesis of cannabinoids and flavonoids in Cannabis
sativa L. plants. Plant Cell Physiol. 2008, 49, 1767–1782. [CrossRef]
12. Aizpurua-Olaizola, O.; Omar, J.; Navarro, P.; Olivares, M.; Etxebarria, N.; Usobiaga, A. Identification and
quantification of cannabinoids in Cannabis sativa L. plants by high performance liquid chromatography-mass
spectrometry. Anal. Bioanal. Chem. 2014, 406, 7549–7560. [CrossRef]
13. Zuardi, A.W.; Crippa, J.A.S.; Hallak, J.E.C.; Moreira, F.A.; Guimarães, F.S. Cannabidiol, a Cannabis sativa
constituent, as an antipsychotic drug. Brazilian J. Med. Biol. Res. 2006, 39, 421–429. [CrossRef]
14. Pellati, F.; Borgonetti, V.; Brighenti, V.; Biagi, M.; Benvenuti, S.; Corsi, L. Cannabis sativa L. and
nonpsychoactive cannabinoids: their chemistry and role against oxidative stress, inflammation, and cancer.
Biomed Res. Int. 2018, 2018, 1–15. [CrossRef]Molecules 2019, 24, 1138 12 of 12
15. Corsi, L.; Pellati, F.; Brighenti, V.; Plessi, N.; Benvenuti, S. Chemical composition and in vitro neuroprotective
activity of fibre-type Cannabis sativa L. (hemp). Curr. Bioact. Compd. 2019, 15. in press. [CrossRef]
16. Eubanks, L.M.; Rogers, C.J.; Beuscher, A.E.; Koob, G.F.; Olson, A.J.; Dickerson, T.J.; Janda, K.D. A Molecular
link between the active component of marijuana and Alzheimer’s disease pathology. Mol. Pharm. 2006, 3,
773–777. [CrossRef]
17. Appendino, G.; Gibbons, S.; Giana, A.; Pagani, A.; Grassi, G.; Stavri, M.; Smith, E.; Rahman, M.M.
Antibacterial cannabinoids from Cannabis sativa: A structure−activity study. J. Nat. Prod. 2008, 71, 1427–1430.
[CrossRef]
18. Borrelli, F.; Fasolino, I.; Romano, B.; Capasso, R.; Maiello, F.; Coppola, D.; Orlando, P.; Battista, G.; Pagano, E.;
Di Marzo, V.; et al. Beneficial effect of the non-psychotropic plant cannabinoid cannabigerol on experimental
inflammatory bowel disease. Biochem. Pharmacol. 2013, 85, 1306–1316. [CrossRef]
19. Cascio, M.; Gauson, L.; Stevenson, L.; Ross, R.; Pertwee, R. Evidence that the plant cannabinoid
cannabigerol is a highly potent α2-adrenoceptor agonist and moderately potent 5HT1A receptor antagonist.
Br. J. Pharmacol. 2010, 159, 129–141. [CrossRef]
20. Takeda, S.; Okajima, S.; Miyoshi, H.; Yoshida, K.; Okamoto, Y.; Okada, T.; Amamoto, T.; Watanabe, K.;
Omiecinski, C.J.; Aramaki, H. Cannabidiolic acid, a major cannabinoid in fiber-type Cannabis, is an inhibitor
of MDA-MB-231 breast cancer cell migration. Toxicol. Lett. 2012, 214, 314–319. [CrossRef]
21. Smeriglio, A.; Galati, E.M.; Monforte, M.T.; Lanuzza, F.; D’Angelo, V.; Circosta, C. Polyphenolic compounds
and antioxidant activity of cold-pressed seed oil from finola cultivar of Cannabis sativa L. Phyther. Res. 2016,
30, 1298–1307. [CrossRef]
22. Radwan, M.; Ross, S.; Slade, D.; Ahmed, S.; Zulfiqar, F.; ElSohly, M. Isolation and characterization of new
Cannabis constituents from a high potency variety. Planta Med. 2008, 74, 267–272. [CrossRef]
23. Kriese, U.; Schumann, E.; Weber, W.E.; Beyer, M.; Brühl, L.; Matthäus, B. Oil content, tocopherol composition
and fatty acid patterns of the seeds of 51 Cannabis sativa L. genotypes. Euphytica 2004, 137, 339–351. [CrossRef]
24. Fidyt, K.; Fiedorowicz, A.; Strzadała,˛ L.; Szumny, A. β-caryophyllene and β-caryophyllene oxide-natural
compounds of anticancer and analgesic properties. Cancer Med. 2016, 5, 3007–3017. [CrossRef]
25. Bertoli, A.; Tozzi, S.; Pistelli, L.; Angelini, L.G. Fibre hemp inflorescences: from crop-residues to essential oil
production. Ind. Crops Prod. 2010, 32, 329–337. [CrossRef]
26. Chauthe, S.K.; Sharma, R.J.; Aqil, F.; Gupta, R.C.; Singh, I.P. Quantitative NMR: an applicable method for
quantitative analysis of medicinal plant extracts and herbal products. Phytochem. Anal. 2012, 23, 689–696.
[CrossRef]
27. Molyneux, R.J.; Wong, Y.-I. Nuclear magnetic resonance spectroscopic determination of α- and β-acid
homolog composition in hops. J. Agric. Food Chem. 1975, 23, 1201–1204. [CrossRef]
28. Pauli, G.F.; Chen, S.-N.; Simmler, C.; Lankin, D.C.; Gödecke, T.; Jaki, B.U.; Friesen, J.B.; McAlpine, J.B.;
Napolitano, J.G. Importance of purity evaluation and the potential of quantitative 1 H NMR as a purity assay.
J. Med. Chem. 2014, 57, 9220–9231. [CrossRef]
29. Bertelli, D.; Brighenti, V.; Marchetti, L.; Reik, A.; Pellati, F. Nuclear magnetic resonance and high-performance
liquid chromatography techniques for the characterization of bioactive compounds from Humulus lupulus L.
(hop). Anal. Bioanal. Chem. 2018, 410, 3521–3531. [CrossRef]
30. Protti, M.; Brighenti, V.; Battaglia, M.R.; Anceschi, L.; Pellati, F.; Mercolini, L. Cannabinoids from Cannabis
sativa L.: A new tool based on HPLC− DAD−MS/MS for a rational use in medicinal chemistry. ACS Med.
Chem. Lett. 2019, in press. [CrossRef]
31. Plant Variety Catalogues, Databases & Information Systems. Available online: https://ec.europa.eu/food/
plant/plant_propagation_material/plant_variety_catalogues_databases_en (accessed on 12 February 2019).
Sample Availability: Hemp samples are available from the authors.
© 2019 by the authors. Licensee MDPI, Basel, Switzerland. This article is an open access
article distributed under the terms and conditions of the Creative Commons Attribution
(CC BY) license (http://creativecommons.org/licenses/by/4.0/).You can also read