Comparative Transport of Legionella and E. coli through Saturated Porous Media in a Two-Dimensional Tank - MDPI
←
→
Page content transcription
If your browser does not render page correctly, please read the page content below
water
Article
Comparative Transport of Legionella and E. coli
through Saturated Porous Media in
a Two-Dimensional Tank
Indrayudh Mondal 1 , Jazlyn Acosta 1 , Absar Alum 1 , Brooke K. Mayer 2 , Paul Dahlen 1 and
Morteza Abbaszadegan 1, *
 1   School of Sustainable Engineering and the Built Environment, Ira A. Fulton Schools of Engineering,
     Arizona State University, Tempe, AZ 85287, USA; imondal1@asu.edu (I.M.); justjazlyn@gmail.com (J.A.);
     alum@asu.edu (A.A.); Paul.Dahlen@asu.edu (P.D.)
 2   Civil, Construction & Environmental Engineering, Opus College of Engineering, Marquette University,
     Milwaukee, WI 53233, USA; brooke.mayer@marquette.edu
 *   Correspondence: abbaszadegan@asu.edu; Tel.: +1-480-965-3868

 Received: 28 September 2020; Accepted: 9 November 2020; Published: 13 November 2020

 Abstract: This study investigated bacterial transport in a two-dimensional (2-D) tank to evaluate the
 bacterial behavior of Legionella pneumophila as compared to Escherichia coli under saturated flow to
 simulate aquifer conditions. The experiments were performed in a 2-D tank packed with 3700 in3
 (60,632 cm3 ) of commercially available bagged play sand under saturated conditions. The tank was
 disinfected by backwashing with 10% chlorine solution and subsequently neutralized by backwashing
 with tap water containing sodium thiosulphate (Na2 S2 O3 ) to ensure no chlorine residual. Bacterial
 transport was measured using samples collected from ports located at vertical transport distances of
 5, 15 and 25 inches (12.7, 38.1 and 63.5 cm, respectively) below the sand surface along two vertical
 sections in the tank. An influent concentration of 105 CFU/mL was used for bacterial cells and the
 vertical fluid transport rate was 10.3 in/day (26.2 cm/day), controlled using a peristaltic pump at the
 bottom outlet. Legionella breakthroughs were recorded at 8, 22 and 35 h for the ports on the right
 side and 9, 24 and 36 h for the ports on the left side, at 5, 15 and 25 inch depths, respectively. At the
 same depths, E. coli breakthroughs were recorded at 5, 17 and 30 h for the ports on the right side and
 7, 19 and 31 h for the ports on the left sides. The delay in Legionella transport compared to E. coli is
 homologous to Legionella’s pleomorphic nature. This study provides evidence of the mobility of both
 E. coli and Legionella in saturated aquifer conditions at a scale more representative of actual aquifer
 conditions. This study also provides a substantive basis for the premise that cell characteristics affect
 transport characteristics under those conditions.

 Keywords: transport; Legionella; E. coli; saturated porous media; two-dimensional tank

1. Introduction
     Worldwide, many cities are heavily dependent on groundwater for their water supplies, with more
than one billion people living in such locales. In particular, most large cities in arid and semiarid regions
are highly dependent on extracting groundwater to meet their rising water demand. This practice is
not restricted to arid regions; some large cities in humid regions (e.g., Tokyo, Osaka, Taipei, Manila,
and Jakarta) also depend on large extractions of groundwater as part of their water supply [1]. In the
United States (U.S.), over 150 million people are estimated to directly depend on groundwater for their
water supply [2].
     Consumption of untreated groundwater has been associated with increased risk of infection by
Escherichia coli O157:H7 [3]. Microbiological and water quality data for 30 public water-supply wells in

Water 2020, 12, 3170; doi:10.3390/w12113170                                       www.mdpi.com/journal/water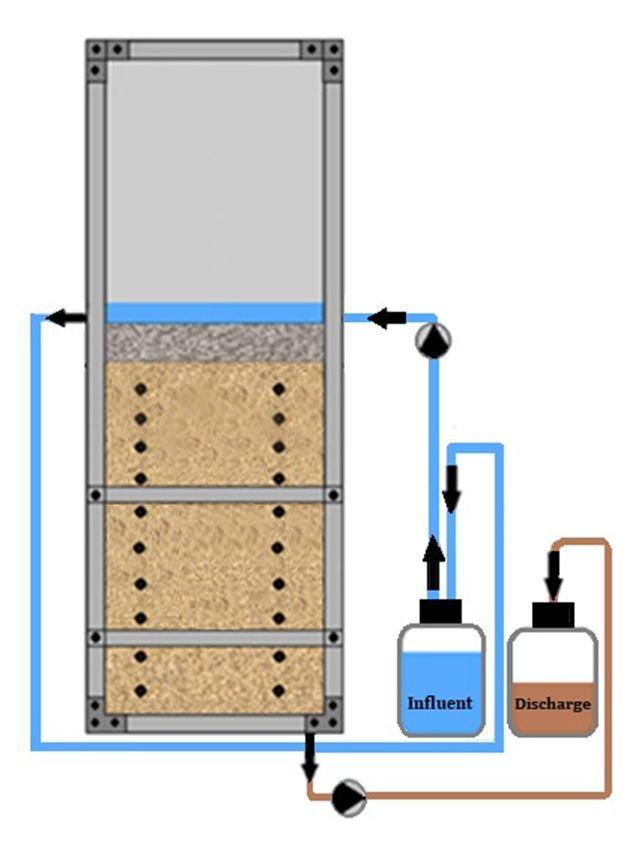
Water 2020, 12, 3170                                                                                  2 of 11

Worcester and Wicomico Counties, Maryland, showed bacterial presence in all wells at some point
during a year-long sampling campaign [4]. In a nationwide study in the U.S., 15% of groundwater
wells tested positive for a broad range of bacteria, including coliforms, enterococci, and Clostridium [5].
A study investigating microbial contamination in groundwater wells found that 29.6% (347/1174)
of wells tested positive for fecal indicator bacteria (total coliform, E. coli, or fecal coliform) [6].
Meta-analysis of data from 12 international groundwater studies of 718 public drinking-water systems
located in a range of hydrogeological settings found that 36%, 12%, 15%, 52% and 26% of wells positive
for total coliform, E. coli, Enterococci, aerobic spores, and anaerobic spores, respectively [7].
      Depleting groundwater aquifers are naturally and/or artificially replenished by infiltration and
percolation, which may transport microbial and chemical contaminants. Pathogen transport in soil
aquifers has been extensively studied using different groups of microbial surrogates. However,
the relevance of using surrogate organism transport data for predicting the transport of pathogens,
e.g., Legionella, is uncertain [8]. The factors contributing to the transport of pathogens to groundwater
aquifers include hydrogeology and characteristics of microbial cells such as survival, size, shape and
mobility [6]. The significance of these factors is further complicated by transient flow and transport
conditions, including seasonal, annual and long-term variability in recharge as well as transient
interactions between climatic factors [9]. In addition, disparities between longitudinal and lateral
dispersion in aquifers and transport of contaminants have been reported [10,11]. In the context of the
discussion above, the unique features of Legionella warrant investigation of its transport properties
in aquifers.
      Legionella is ubiquitous in water systems, and Legionella pneumophila is responsible for the majority
of the waterborne disease outbreaks (drinking water and non-recreational) in the U.S. [12]. Legionella
has a high proclivity for growing in reclaimed water [13] and is not only present in reclaimed water,
but also surface water [14]. For example, Legionella was detected in 60% of the samples (3/5) collected
from recharge basin samples in California [15,16]. In Arizona, which is among the leading states
practicing groundwater recharge, the presence of Legionella is increasing the risk of exposure and public
health concerns.
      Legionella is a unique bacterium with high lipopolysaccharide content in the cell membrane [17] and
a pleomorphic nature, which can potentially impact its fate and transport. Under normal conditions,
Legionella is a Gram-negative bacterium measuring 2 to 20 µm, but it can transform both its size and
shape under different environmental conditions. For example, Legionella can transform into a facultative
intracellular stage, wherein it requires a host such as an amoeba, which serves as a protective shell for
Legionella cells. This plasticity of Legionella cells warrants in-depth study of their transport through
different types of aquifers.
      The objective of this study was to investigate and compare the transport characteristics of Legionella
(human opportunistic pathogen) and E. coli (bacterial surrogate) in a two-dimensional packed porous
media tank under saturated conditions. These bacteria were selected based on the public health
significance of Legionella and immense value of E. coli as a surrogate of bacterial pathogens (based
on the availability of an extensive amount of historical data). This approach more closely resembled
aquifer conditions with intrinsic, multidimensional heterogeneities in comparison to more common
one-dimensional column testing.

2. Materials and Methods

2.1. Preparation of Bacterial Stocks
     Legionella pneumophila (ATCC® 33153 TM ) and E. coli (ATCC® 25922 TM ) were obtained from the
American Type Culture Collection (ATCC® , Rockville, MD, USA) and propagated using the methods
recommended by the ATCC. The pure cultures of frozen stocks (stored at −80 ◦ C) were thawed at 37 ◦ C.
A sterile inoculation loop was used to streak Legionella and E. coli onto their selective media: buffered
charcoal yeast extract (BCYE, Thermo Fisher Scientific) for Legionella and brilliant green agar (Sigma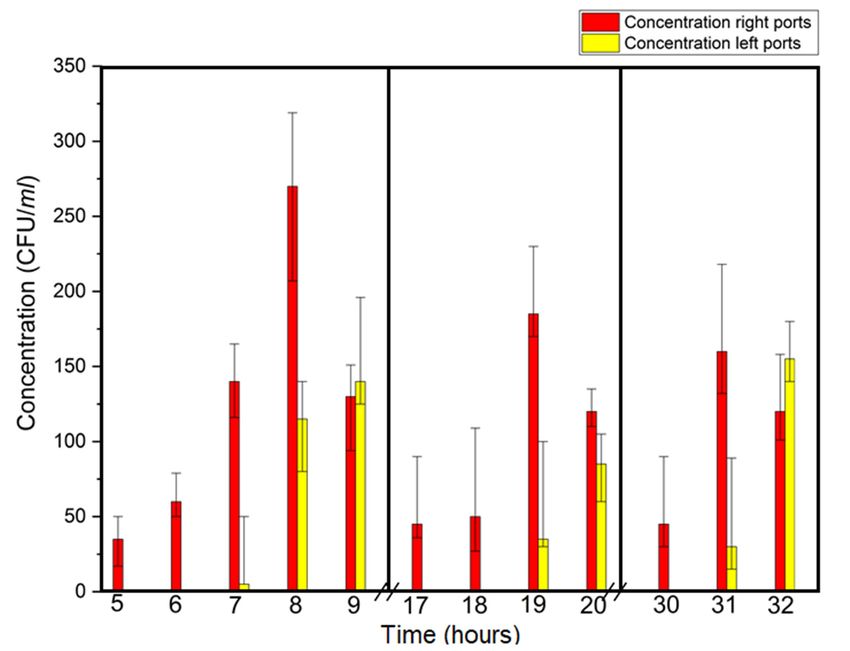
Water 2020, 12, 3170 3 of 11
Aldrich, St Louis, MO, USA) for E. coli. Legionella was incubated at 37 ◦ C for 96 h before harvesting
by flooding the uniform bacterial lawn with 1X PBS buffer containing 10% glycine and scraping the
colonies using a cell scraper. E. coli was incubated at 37 ◦ C overnight before transferring an isolated
colony to 15 mL tryptic soy broth (TSB) (Sigma Aldrich) and incubating at 37 ◦ C for 24 h.
2.2. Configuration, Preparation and Operation of the 2-D Tank
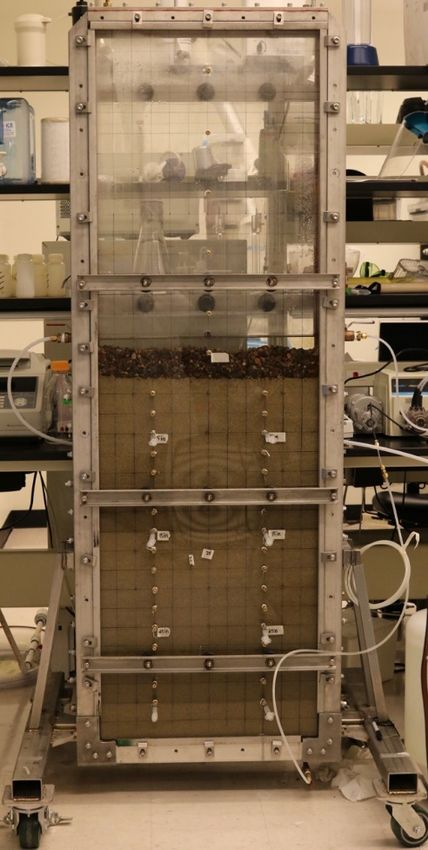
The tank used for this study was a 72 inch (182.88 cm) tall, 24 inch (60.96 cm) wide, 4 inch (10.16 cm)
deep, rigid stainless steel frame that held 72 inch (182.88 cm) tall, 24 inch (60.96 cm) wide, 0.5 inch
(1.27 cm) thick clear acrylic panels, front and back. The stainless-steel side panels and base of the tank
Water
were2020, 12, x FOR
ported PEER REVIEW
to allow flow control as desired. For this study, bilateral ports at 42 inches (106.7 4 ofcm)
11
from the base of the tank were used for influent feed control and a French drain at the base of the
To maintain a uniform head and influent across the horizontal aspect of the tank, a 1.5 inch (3.8
tank provided uniform drainage to a single port for outlet flow control. Lateral bracing across the
cm) pool of water was maintained above the gravel surface. To ensure the delivery of fresh,
acrylic panels was used to prevent the panels from bowing under the pressure of a packed, saturated
dechlorinated, microbially enriched media, a peristaltic pump was used to deliver 15 mL/min from a
tank. The front acrylic face of the tank was fitted with two vertical series of sampling ports, 18 inches
carboy containing the influent water spiked with 105 colony forming units (CFU) per mL of Legionella
(45.72 cm) apart and centered across the tank. Vertical spacing of the ports in each column was on
and E. coli, the suspension of which was maintained by continuous stirring on a magnetic stir plate.
2 inch (5.08 cm) centers (Figure 1) through the packed zone of the tank.
Excess influent was allowed to passively drain from the tank at the same vertical level as the influent.
Figure 1. A schematic (not to scale) and a photo of the 2-D tank packed with Sakrete© play sand media
Figure 1. A schematic (not to scale) and a photo of the 2-D tank packed with Sakrete© play sand media
with sampling ports. Note: A 3 inch gravel pack is not visible at the base of the sand pack but is present
with sampling ports. Note: A 3 inch gravel pack is not visible at the base of the sand pack but is
to provide uniform effluent drainage across the tank.
present to provide uniform effluent drainage across the tank.
The tank was packed with approximately 3750 in3 (61,451 cm3 ) of dry Sakrete© play sand
2.3. Sample Collection, Sample Processing and Assay Methods
(7-64661-15650-5). Sieve analysis for the product is shown in Table 1. The product presented as a fairly
heterogeneous
Along with mix of filter (from
the influent mediathe
consisting of particles
carboy), tank samplingranging from10 toat80ports
was performed mesh5 inches
(>2.0 mm(12.7to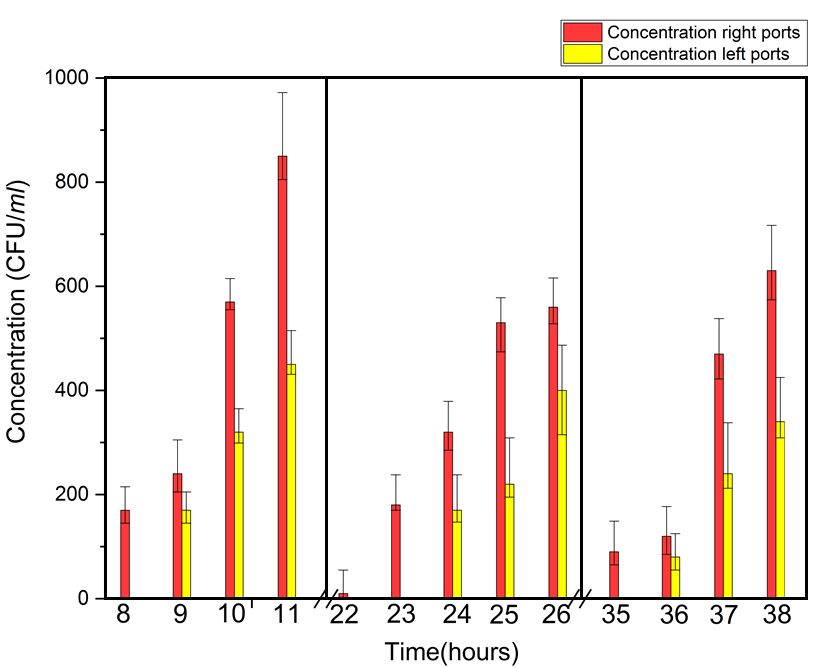
Water 2020, 12, 3170                                                                                      4 of 11

the sand pack and minimize settling during testing. Since play sand is not a uniform sieve grade,
this packing technique resulted in a heterogeneous pack with some visually apparent, isolated areas of
horizontal layering of fines and/or coarse materials. The character of the sand and the heterogeneous
nature of the pack were considered advantageous as being more representative of natural conditions.

                                Table 1. Sieve analysis for Sakrete© play sand.

                                                                                  Cumulative %
  Sieve #         Sieve Size (mm)      Mass Retained (gm)       % Retained                       % Passing
                                                                                    Retained
     10                4.75                      9                  0.3               0.3          99.7
     16                1.18                     167                 5.7               6.0          94.0
     30                0.60                     704                 24.1              30.1         69.9
     60                0.25                    1331                 45.5              75.6         24.4
     70                0.22                     115                 3.9               79.6         20.4
     80                0.18                     152                 5.2               84.8         15.2
     80
Water 2020, 12, 3170 5 of 11
Preliminary data regarding tank flow velocity, collected during basic tank operation, were used to
estimate expected breakthrough times for each sampling depth to guide sample collection. Sampling
for each interval was on an hourly basis until breakthrough was achieved at both ports. Samples were
collected by placing an 18G needle directly into the tank media through the port septa. Prior to sample
collection, 5–10 mL of water was flushed, followed by the collection of a 10 mL sample. For this study,
the first detection of target bacteria at a sampling port was considered the breakthrough point.
2.3.1. Legionella Analysis by Spread Plate Method
Samples for Legionella were analyzed by spread plate method using the BCYE media containing
antibiotics Polymyxin B (100 units/mL), Vancomycin (5 µg/mL), Cycloheximide (80 µg/mL) and
L-cysteine HCl (0.4 g/L). The samples were collected at specified time intervals, and 0.1 mL from
each sample was transferred onto a petri dish and uniformly spread throughout. The petri dish was
incubated at 37 ◦ C for 96 h. Legionella on the BCYE media appeared as gray-white colonies.
2.3.2. E. coli Analysis by Spread Plate Technique
E. coli samples were analyzed using the spread plate method on selective media (Brilliance media,
Oxoid CM1046 or Brilliant media, Sigma Aldrich 27815). Each sample was collected in a 15 mL tube
and 0.1 mL was transferred onto a petri dish containing selective agar. A flame sterilized spreader (first
dipped in Ethanol and flamed) was used to evenly spread the inoculum throughout the petri dish,
which was then incubated at 37 ◦ C for 24 h. The E. coli colonies appeared pink on the Brilliant media.
3. Results and Discussion
3.1. E. coli Transport Experimental Results
E. coli transport was studied by collecting hourly samples at the 5 inch ports between 4 and 9 h,
the 15 inch ports between 16 and 20 h, and the 25 inch ports between 28 and 32 h. In order to accurately
capture breakthrough, sampling began 1 h prior to the expected breakthrough time, and in all cases,
those samples were negative for the target cells. The accuracy of the reported breakthrough times was
within one hour. All experiments were repeated 5 times and variations in breakthrough concentrations
and times at the respective ports were observed. Breakthrough transport times for E. coli are shown in
Table 2. Based on the intervals 0 to 5 inches, 0 to 15 inches, and 0 to 25 inches, the number of pore
volumes for breakthrough at 5, 15, and 25 inches was 0.46, 0.52, and 0.53, respectively.
Table 2. Breakthrough times for E. coli.
Breakthrough (Left) Breakthrough (Right)
Sampling Port
(hours ±1 h) (hours ±1 h)
5 in (12.7 cm) 7 5
15 in (38.1 cm) 19 17
25 in (63.5 cm) 31 30
Breakthrough concentrations for E. coli were also tracked at all of the ports, with sampling for
several hours after initial breakthrough. Concentration vs. time is shown in Figure 2. Note that
concentration vs. time showed increasing concentration with time after breakthrough followed by
a decline. This behavior is consistent with a previous study in saturated porous media, which showed
E. coli concentrations initially increasing after breakthrough followed by a decline [18].Water 2020, 12, 3170 6 of 11
Water 2020, 12, x FOR PEER REVIEW 6 of 11
Figure 2. Breakthrough time (±1 h) and concentration of E. coli as a function of time in three time periods.
Figure 2. Breakthrough time (+/− 1 h) and concentration of E. coli as a function of time in three time
periods. Transport Experimental Results
3.2. Legionella
3.2. Legionella E. coli tests,
FollowingTransport Legionella Results
Experimental transport was studied by collecting hourly samples at the 5, 15,
and 25 inch ports between 5 and 11 h, 17 and 26 h, and 28 and 38 h, respectively. As with E. coli testing,
Following
Legionella E. coli
sampling tests,
began 1 hLegionella
prior to thetransport
expectedwas studied by collecting
breakthrough time, andhourly samples
in all cases, at samples
those the 5, 15,
and negative
were 25 inch ports between
for target cells.5Again,
and 11the h, accuracy
17 and 26 of h,
theand 28 andbreakthrough
reported 38 h, respectively.
times was As within
with E.one
coli
testing, Legionella sampling began 1 h prior to the expected breakthrough time,
hour and all experiments were repeated 5 times and variations in breakthrough concentrations and and in all cases, those
samples
times were
at the negativeports
respective for target cells. Again,
were observed. the accuracy
Breakthrough of the reported
transport times forbreakthrough
Legionella are times
shownwasin
within one hour and all experiments were repeated 5 times and variations
Table 3. Based on the intervals 0 to 5 inches, 0 to 15 inches, and 0 to 25 inches, the number of pore in breakthrough
concentrations
volumes and times at
for breakthrough at 5,the
15,respective
and 25 inchesportswas
were
0.54,observed.
0.54, andBreakthrough transport times for
0.53, respectively.
Legionella are shown in Table 3. Based on the intervals 0 to 5 inches, 0 to 15 inches, and 0 to 25 inches,
the number of pore volumesTable for breakthrough
3. Breakthroughattimes5, 15,
for and 25 inches was 0.54, 0.54, and 0.53,
Legionella.
respectively.
Breakthrough (Left) Breakthrough (Right)
Sampling Port
(hours ±1times
Table 3. Breakthrough h) for Legionella.(hours ±1 h)
5 in (12.7 cm) 9 8
Breakthrough (Left) Breakthrough (Right)
Sampling Port cm)
15 in (38.1 24 22
(hours +/− 1 h) (hours +/− 1 h)
25 in (63.5 cm) 36 35
5 in (12.7 cm) 9 8
15 in (38.1 cm) 24 22
Breakthrough concentrations
25 in (63.5 cm) vs. time for 36 E. coli and Legionella are shown 35 in Figures 2 and 3,
respectively. These graphics indicate that, for each time period tested Legionella concentrations
continuously increased
Breakthrough with time, unlike
concentrations vs. timethefor
decrease
E. coli observed for E.are
and Legionella coli.shown
This might be due
in Figures 2 to
andthe3,
difference in the behavior of E. coli and Legionella transport in the plume. In
respectively. These graphics indicate that, for each time period tested Legionella concentrations plume form, bacteria
move in high concentrations,
continuously increased withwhich allows the
time, unlike greater cell-to-cell
decrease interaction.
observed Bacterial
for E. coli. clumping
This might is ato
be due well
the
known phenomenon which can occur in culture or in plume environments. Some
difference in the behavior of E. coli and Legionella transport in the plume. In plume form, bacteria of the factors that
can
moveinfluence
in high bacterial clumping
concentrations, whichare:allows
a) number
greaterofcell-to-cell
autoagglutinins (agglutinating
interaction. proteins)ison
Bacterial clumping the
a well
cell surface and the presence divalent 2+ known that E.Some coli cell
known phenomenon which can occurcation such or
in culture as in
Caplume
. It isenvironments. of can
the have
factorsupthat
to
eight different autoagglutinins compared to only one type on Legionella cells [19].
can influence bacterial clumping are: a) number of autoagglutinins (agglutinating proteins) on the The difference in the
cell surface and the presence divalent cation such as Ca2+. It is known that E. coli cell can have up toWater 2020, 12, x FOR PEER REVIEW 7 of 11
Water 2020, 12, 3170 7 of 11
eight different autoagglutinins compared to only one type on Legionella cells [19]. The difference in
the number of surface-active agglutinating proteins might account for the difference in retention
number
becauseofofsurface-active
cations in the agglutinating
filter media. proteins might account for the difference in retention because
of cations in the filter media.
Figure 3. Breakthrough time (±1 h) and concentration of Legionella as a function of time in three
Figure 3. Breakthrough time (+/− 1 h) and concentration of Legionella as a function of time in three
time periods.
time periods.
3.3. Discussion of Transport Characteristics
3.3. Discussion of Transport Characteristics
3.3.1. Tank Characteristics
3.3.1. Tank Characteristics
As indicated previously, the tank was packed with play sand and the heterogeneities associated
As indicated
with the pack were previously, the tank was
visually apparent packed with
as isolated areasplay sand and the
of horizontal heterogeneities
layering of fines or associated
coarser
with the
sand. pack
While nowere
dye orvisually apparent
chemical as isolated
tracer tests areas of horizontal
were performed layering
to determine of fines
overall flowor coarser sand.
characteristics,
While notank
previous dyeexperience
or chemicalwouldtracerindicate
tests were
thatperformed
while suchtopacking
determine overall flowintroduce
idiosyncrasies characteristics,
some
previous tank
irregularity experience
to flow profile, would indicatevertical
no significant that while
flowsuch packing idiosyncrasies
heterogeneities introduceacross
would exist laterally some
irregularity
the tank. Viatocalculations
flow profile,based
no significant vertical flow
on the controlled heterogeneities
flowrate and volumewould exist laterally
and porosity of the across
sand
the tank.
pack, Via calculations
the overall based
tank velocity on the controlled
assuming flowrate
uniform flow acrossandthe
volume and10.3
tank was porosity
in/day of (26.2
the sand pack,
cm/day),
thesampling
but overall tank velocity
created assuming
an increase uniform
in tank velocityflow across
to 10.9 the (27.7
ft/day tank cm/day)
was 10.3forin/day (26.2 cm/day),
the period but
of operation.
sampling
Using created anflowrate,
the increased increasefluid
in tank velocity
travel timestofrom
10.9the
ft/day
top (27.7
of thecm/day)
sand packfor to
thethe
period
5, 15,of
andoperation.
25 inch
Using theports
sampling increased
were 11,flowrate,
33, andfluid
55 h,travel times from
respectively, withthe top of the
an overall sand
travel pack toofthe
velocity 0.455,in/h
15, and
(1.1425cm/h;
inch
sampling
see ports
Table 4). were
Travel time11,between
33, and the
55 h, respectively,
5 and 15 inch (orwith an overall
15 and 25 inch)travel
ports velocity
was 22 h.of 0.45 in/h (1.14
cm/h; see Table 4). Travel time between the 5 and 15 inch (or 15 and 25 inch) ports was 22 h.
Of additional note regarding tank characteristics is the apparent lag in the microbial transport
rate for left array versus right array ports. This is most likely related to the tank sand pack or sample
timing issue. The lag of up to 2 h from 0 to 5 inches for E. coli was not much different than the
cumulative lag of 2 h from 0 to 15 inches for Legionella (±1 h for both), and might simply be an artifact
associated with sample timing. This is compelling when one considers the overall differential in
travel time from 0 to 25 inches of only one hour. However, since the lag is consistently noted on the
left array, there could be some issue associated with left side tank flow. Given that the transport lag
predominates in the top 5 inches of travel, the most plausible explanations include the following:Water 2020, 12, 3170 8 of 11
Table 4. Travel times for fluid vs. E. coli vs. Legionella.
Fluid Flow E. coli Legionella
Interval Travel Time (h) Travel Time (h)
Travel Transport Transport Transport
(Inches)
Time (h) Rate (in/h) R L Avg. Rate (in/h) R L Avg. Rate (in/h)
0–5 11.0 0.45 5 7 6 0.83 8 9 8.5 0.59
5–15 22.0 0.45 12 12 12 0.83 14 15 14.5 0.69
15–25 22.0 0.45 13 12 12.5 0.80 13 12 12.5 0.80
0–25 55.0 0.45 30 31 30.5 0.82 35 36 35.5 0.70
Of additional note regarding tank characteristics is the apparent lag in the microbial transport rate
for left array versus right array ports. This is most likely related to the tank sand pack or sample timing
issue. The lag of up to 2 h from 0 to 5 inches for E. coli was not much different than the cumulative lag
of 2 h from 0 to 15 inches for Legionella (±1 h for both), and might simply be an artifact associated with
sample timing. This is compelling when one considers the overall differential in travel time from 0 to
25 inches of only one hour. However, since the lag is consistently noted on the left array, there could be
some issue associated with left side tank flow. Given that the transport lag predominates in the top
5 inches of travel, the most plausible explanations include the following:
• The surface of the sand pack was irregular and was only 4 inches from the 5 inch port on the right
side. That one inch difference would yield a 2.3 h differential in transit time.
• The influent pool was filled from the right side of the tank with outflow on the left, with a residence
time was 253 min. This ponding could have resulted in preferential deposition of microbes on the
right side of the tank, ultimately affecting transit times to the 5 inch port.
In either case, this idiosyncrasy is irrelevant towards the overall purpose of this study, which was
to investigate microbial transport characteristics.
3.3.2. Microbial Transport Characteristics
In vertically downward, saturated flow conditions in sand media, both E. coli and Legionella
showed significant mobility and were readily transported across the 25 in (63.5 cm) zone of observation.
Most notably, both E. coli and Legionella showed transport rates that were greater than the apparent
fluid velocity (see Table 4). While preferential flow and/or mobility of the species could be argued,
the consistency of travel times between the right and left arrays and from one port to the next reduces
the likelihood of this explanation. In any case, both E. coli and Legionella showed significant mobility in
simulated aquifer conditions, which is a major point of significance for this study.
Legionella transport characteristics differed from those of E. coli, with Legionella exhibiting retarded
breakthrough times for the 0 to 5 and 5 to 15 inch zones. While the E. coli rate of transport was relatively
consistent from 0 to 25 inches at 0.80 to 0.83 in/h (2.03 to 2.11 cm/h), Legionella showed increasing
rates of transport at 0.59 in/h (1.50 cm/h) from 0 to 5 inches, 0.69 in/h (1.75 cm/h) from 5 to 15 inches,
and 0.80 in/h (2.03 cm/h) from 15 to 25 inches. Several factors can influence the transport of bacteria
through saturated porous media. Attachment of bacterial cells to media surfaces is influenced by
cell surface electrostatic charge and hydrophobic interaction with the media, size, and the presence
of surface structures such as flagella, fimbriae, and extracellular lipopolysaccharides [20]. Each of
these parameters adds complexity to building a deeper understanding of bacterial transport through
the subsurface, such that microbial subsurface transport is not fully understood [21]. For example,
electrostatic charges are influenced by not only the microorganisms’ surface (e.g., the presence and
configuration of proteins, and lipopolysaccharides), but also the granular media characteristics and the
water matrix itself. Specifically, the pH and the ionic strength of the solution affect the surface charge
of the bacterial cell and soil particle, thereby dictating electrostatic interactions. Direct assessment ofWater 2020, 12, 3170 9 of 11
surface charges was beyond the scope of this study. However, reported that the electrophoretic mobility
of some Legionella pneumophila serogroups varies with solution pH while other serogroups remain
constant between pH 6 and 9 [22]. These pH values encompass common water ranges, including the
water tested in this study).
Different types of lipopolysaccharides (LPSs) are located on the outside of bacterial cells and
they are considered a key factor in cell attachment to mineral surfaces and microbially induced
precipitation/dissolution reactions. The E. coli LPSs are composed of three different components:
(i) hydrophobic lipid A anchored in the outer membrane, (ii) phosphorylated, nonrepetitive
hetero-oligosaccharide known as the core oligosaccharide, and (iii) polysaccharide that extends
from the cell surface and forms the O antigen detected in serotyping [23]. Alternately, LPSs on
Legionella pneumophila cells are composed of a very hydrophobic lipid A acylated by long chain
fatty acids and an O-antigen-specific chain consisting of homopolymeric legionaminic acid [24]. The
variation in transport profiles between E. coli and Legionella might be due to the significant differences
in the LPSs on cell surfaces resulting in reversible or irreversible attachment of the Legionella cells to the
tank media. There has not been any study investigating a direct link between bacterial cell transport in
porous media and the different types of lipopolysaccharides on bacterial cell membranes.
In addition, filamentation in response to different environmental stresses has been observed for
numerous bacterial species [25–27]. Under stress and nutrient deficient conditions, Legionella tends to
become long and filamentous [28]. The size and shape of the bacteria are known to be determining
factors in their transport under saturated conditions [29,30]. Therefore, it is hypothesized that the
pleomorphic nature of Legionella might be a factor in its slower transport characteristics as compared to
E. coli, which does not exhibit pleomorphic characteristics.
Regarding Legionella’s apparent increase in transport for all zones, this could simply be a function
of filtration or size selection, with preferential transport rates favoring those microbes with smaller
profiles or less filamentous development.
4. Conclusions
While it is accepted that E. coli is mobile in saturated aquifer environments, the scale of this
study provided a basis for the premise that Legionella is also mobile in saturated aquifer conditions.
In addition, data from this study suggested that microbial cell types and characteristics in conjunction
with aquifer characteristics might have impacted the transport of those pathogens. Legionella’s
pleomorphic nature and/or the differences in the LPSs on cell surfaces, which may result in reversible
or irreversible attachment of the Legionella cells to the media of the tank, may both have affected its
transport properties. Further, vadose zone conditions are typically heterogeneous, ranging from the
micro to the macro scale, which can lead to preferential transport affecting dispersion in both the lateral
and vertical directions.
Future studies should investigate the extent of Legionella contamination in groundwater impacted
directly or indirectly by aquifer recharge practices and Legionella’s transport characteristic in the
vadose zone. An assessment of the overall data indicated parallel trends in transport of E. coli and
Legionella under the experimental conditions studied. Considering the delay in Legionella transport,
historical data for E. coli may serve as a useful, reasonable prediction of Legionella’s transport under
recharge conditions.
Author Contributions: I.M., J.A.: investigation; A.A., B.K.M., P.D.: formal analysis; M.A.: project administration.
All authors contributed equally at all the stages of this study. All authors have read and agreed to the published
version of the manuscript.
Funding: This research was supported by the National Science Foundation (NSF) Water and Environmental
Technology (WET) Center at Arizona State University (award number 1361815).
Acknowledgments: All opinions expressed in this paper are the authors’ and do not necessarily reflect the policies
and views of NSF.
Conflicts of Interest: The authors declare no conflict of interest.Water 2020, 12, 3170 10 of 11
References
1. Shen, Y.; Oki, T. Groundwater Resources in Urban Water Management. In Groundwater Problems in Urban Areas;
Takizawa, S., Ed.; Springer: Tokyo, Japan, 2008.
2. Hynds, P.D.; Thomas, M.K.; Pintar, K.D.M. Contamination of groundwater systems in the US and Canada by
enteric pathogens, 1990–2013: A review and pooled-analysis. PLoS ONE 2014, 9, e93301. [CrossRef] [PubMed]
3. Slutsker, L.; Ries, A.A.; Maloney, K.; Wells, J.G.; Greene, K.D.; Griffin, P.M. A nationwide case-control study of
Escherichia coli O157:H7 infection in the United States. J. Infect. Dis. 1998, 177, 962–966. [CrossRef] [PubMed]
4. Banks, W.S.; Klohe, C.A.; Battigelli, D.A. Occurrence and Distribution of Enteric Viruses in Shallow Ground Water
and Factors Affecting Well Vulnerability to Microbiological Contamination in Worcester and Wicomico Counties,
Maryland; USGS and Maryland Department of the Environment: Baltimore, MD, USA, 2001.
5. Abbaszadegan, M.; LeChevalier, M.; Gerba, C.P. Occurrence of viruses in US Groundwaters. JAWWA 2003,
95, 107–120. [CrossRef]
6. Embrey, S.S.; Runkle, D.L. Microbial Quality of the Nation’s Ground-Water Resources, 1993–2004: U.S. Geological
Survey Scientific-Investigations Report 2006-5290; USGS: Reston, VA, USA, 2006; 34p.
7. Fout, G.S.; Borchardt, M.A.; Kieke, B.A.; Karim, M.R. Human virus and microbial indicator occurrence
in public-supply groundwater systems: Meta-analysis of 12 international studies. Hydrogeol. J. 2017, 25,
903–919. [CrossRef] [PubMed]
8. McBurnett, L.R.; Holt, N.T.; Alum, A.; Abbaszadegan, M. Legionella- A threat to groundwater: Pathogen
transport in recharge basin. Sci. Total Environ. 2018, 621, 1485–1490. [CrossRef] [PubMed]
9. Arora, B.; Spycher, N.F.; Steefel, C.I.; Molins, S.; Bill, M.; Conrad, M.E.; Dong, W.; Faybishenko, B.;
Tokunaga, T.K.; Wan, J.; et al. Influence of hydrological, biogeochemical and temperature transients on
subsurface carbon fluxes in a flood plain environment. Biogeochemistry 2016, 127, 367–396. [CrossRef]
10. Frind, E.O.; Germain, D. Simulation of contaminant plumes with large dispersive contrast: Evaluation of
alternating direction Galerkin models. Water Resour. Res. 1986, 22, 1857–1873. [CrossRef]
11. Erickson, A.J.; Weiss, P.T.; Gulliver, J.S. Optimizing Stormwater Treatment Practices, A Handbook of Assessment
and Maintenance; Springer: New York, NY, USA, 2013.
12. Brunkard, J.M.; Ailes, E.; Roberts, V.A.; Hill, V.; Hilborn, E.D.; Craun, G.F.; Rajasingham, A.; Kahler, A.;
Garrison, L.; Hicks, L.; et al. Surveillance for waterborne diseases outbreaks associated with drinking
water—United States, 2007–2008. CDC Surveill. Summ. 2011, 60, 38–68.
13. Jjemba, P.K.; Weinrich, L.A.; Cheng, W.; Giraldo, E.; LeChevallier, M.W. Regrowth of potential opportunistic
pathogens and algae in reclaimed-water distribution systems. Appl. Environ. Microbiol. 2010, 76, 4169–4178.
[CrossRef]
14. Palmer, C.J.; Bonilla, G.F.; Roll, B.; Paszko-Kolva, C.; Sangermano, L.R.; Fujioka, R.S. Detection of Legionella
species in reclaimed water and air with the EnviroAmp Legionella PCR kit and direct fluorescent antibody
staining. Appl. Environ. Microbiol. 1995, 61, 407–412. [CrossRef]
15. Palmer, C.J.; Tsai, Y.L.; Bonilla, G.F.; Sangermano, L.R.; Paszko-Kolva, C.; Roll, B.; Fujioka, R.S. Detection
of Legionella species in sewage and ocean water in California and Hawaii. In Proceedings of the Annual
Conference of Water and Environment Federations, Water and Environment Federations, Alexandria,
VA, USA, 2–7 October 1993; pp. 123–131.
16. Palmer, C.J.; Tsai, Y.; Paszko-Kolva, C.; Mayer, C.; Sangermano, L. Detection of Legionella species in sewage
and ocean water by polymerase chain reaction, direct fluorescent-antibody, and plate culture methods.
Appl. Environ. Microbiol. 1993, 59, 3618–3624. [CrossRef] [PubMed]
17. Brenner, D.J.; Steigerwalt, A.G.; McDade, J.E. Classification of the Legionnaires’ disease bacterium: Legionella
pneumophila, genus novum, species nova, of the family Legionellaceae, familia nova. Ann. Intern. Med.
1979, 90, 656–658. [CrossRef] [PubMed]
18. Sasidharan, S.; Bradford, S.A.; Torkzaban, S.; Ye, X.; Vanderzalm, J.; Du, X.; Page, D. Unraveling the
complexities of the velocity dependency of E. coli retention and release parameters in saturated porous
media. Sci. Total Environ. 2017, 603–604, 406–415. [CrossRef] [PubMed]
19. Trunk, T.; Khalil, H.S.; Leo, J.C. Bacterial autoaggregation. AIMS Microbiol. 2018, 4, 140–164. [CrossRef]
20. Gilbert, P.; Evans, D.J.; Evans, E.; Duguid, I.G.; Brown, M.R.W. Surface characteristics and adhesion of
Escherichia coli and Staphylococcus epidermis. J. Appl. Bacteriol. 1991, 71, 72–77.Water 2020, 12, 3170 11 of 11
21. Dowd, S.E.; Pillai, S.D.; Wang, S.Y.; Corapcioglu, M.Y. Delineating the specific influence of virus isoelectric
point and size on virus adsorption and transport through sandy soils. Appl. Environ. Microbiol. 1998, 64,
405–410. [CrossRef]
22. Buse, H.Y.; Hoelle, J.M.; Muhlen, C.; Lytle, D.A. Electrophoretic mobility of Legionella seropgrousp 1 to 4.
FEMS Microbiol. Lett. 2018, 365, 1–7. [CrossRef]
23. Amor, K.; Heinrichs, D.E.; Frirdich, E.; Ziebell, K.; Johnson, R.P.; Whitfield, C. Distribution of core
oligosaccharide types in lipopolysaccharides from Escherichia coli. Infect. Immun. 2000, 6, 1116–1124.
[CrossRef]
24. Lück, C.; Helbig, J.H. Characterization of Legionella Lipopolysaccharide. In Legionella. Methods in Molecular
Biology (Methods and Protocols); Buchrieser, C., Hilbi, H., Eds.; Humana Press: Totowa, NJ, USA, 2013;
Volume 954.
25. Michel, B. After 30 years of study, the bacterial SOS response still surprises us. PLoS Biol. 2005, 3, e255.
[CrossRef]
26. Miller, C.; Thomsen, L.E.; Gaggero, C.; Mosseri, R.; Ingmer, H.; Cohen, S.N. SOS response induction by
beta-lactams and bacterial defense against antibiotic lethality. Science 2004, 305, 1629–1631. [CrossRef]
27. Radman, M. SOS repair hypothesis: Phenomenology of an inducible DNA repair which is accompanied by
mutagenesis. Basic Life Sci. 1975, 5, 355–367.
28. Greub, G.; Raoult, D. Morphology of Legionella pneumophila according to their location within Hartmanella
vermiformis. Res. Microbiol. 2003, 154, 619–621. [CrossRef] [PubMed]
29. Gupta, V.; Johnson, W.P.; Shaifeian, P.; Ryu, H.; Alum, A.; Abbaszadegan, M.; Hubbs, S.A.; Williams, T.R.
Riverbank Filtration: Comparison of Pilot Scale Transport with Theory. Environ. Sci. Technol. 2009, 43,
669–676. [CrossRef] [PubMed]
30. Firouzi, A.F.; Homaee, M.; Klumpp, E.; Kasteel, R.; Tappe, W. Bacteria transport and retention in intact
calcareous soil columns under saturated flow conditions. J. Hydrol. Hydromech. 2015, 63, 102–109. [CrossRef]
Publisher’s Note: MDPI stays neutral with regard to jurisdictional claims in published maps and institutional
affiliations.
© 2020 by the authors. Licensee MDPI, Basel, Switzerland. This article is an open access
article distributed under the terms and conditions of the Creative Commons Attribution
(CC BY) license (http://creativecommons.org/licenses/by/4.0/).You can also read


