REA VAYA BUS RAPID TRANSIT SYSTEM CITY OF JOHANNESBURG: PERFORMANCE, PROGRESS, FUTURE - National Parliament September 2017
←
→
Page content transcription
If your browser does not render page correctly, please read the page content below
REA VAYA BUS RAPID TRANSIT
           SYSTEM
  CITY OF JOHANNESBURG:
PERFORMANCE, PROGRESS,
           FUTURE
   National Parliament September 2017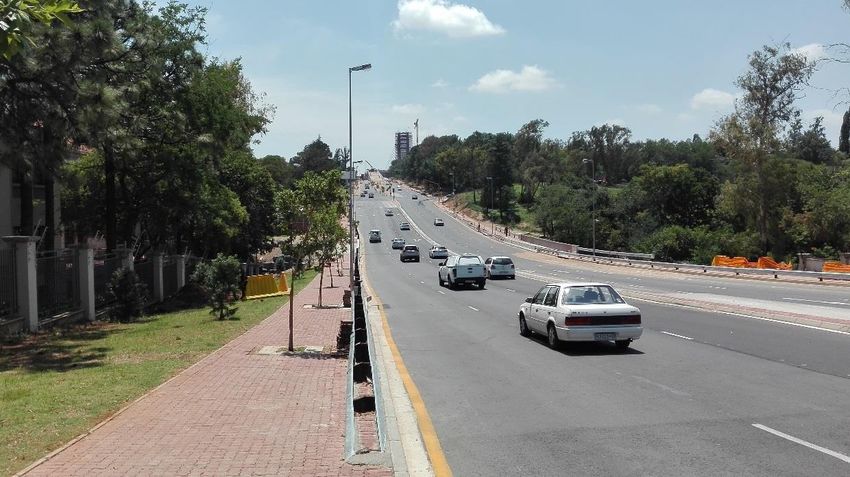
Agenda

■ High level overview        ■ Institutional issues
   – Objectives of Rea       ■ Achievements, impacts
       Vaya                    and risks
   – Scope and scale
                             ■ What the future holds
   – Chronology
■ Progress and performance
   – Infrastructure
   – Operations
   – Finances
   – Bus company
       formation and
       empowerment
HIGH LEVEL OVERVIEW
Transport modes in
Johannesburg
■ The main modes are:         Specific challenges arise out of our
   – Private vehicles        apartheid spatial legacy (poor people
                             on the periphery) and decades of car
   – Mini bus taxis           centred, security focused planning
   – Rail (Gautrain and
      Metrorail)
   – Bus (City bus fleet –
      Metrobus, provincial
      subsidised, Rea Vaya
      BRT, Gautrain bus)
■ New ‘demand responsive’
  modes also active in
  Joburg:
   – Metered taxis, Uber
   – Tuk tuks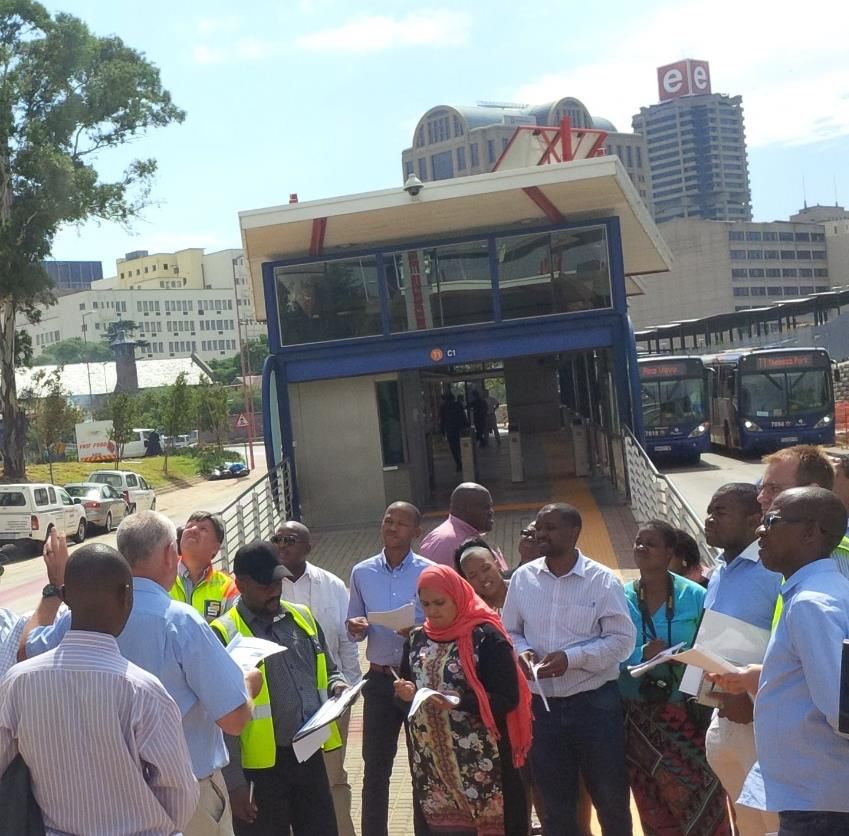
Key political imperatives and policies
shaping City’s transport policy: 1
 National government                                           Provincial government
■   National Development Plan: "By 2030, investments in
    the transport sector will ensure that it serves as a key
                                                               ■ Global City Region
    driver in empowering South African and its people,
    enabling:
                                                                  – Co-operate internally to
                                                                      compete effectively
      –     Improved access to economic opportunities,
            social spaces and services by bridging                    externally
            geographic distances affordably, reliably and
            safely.                                            ■ 25 year Transport Master Plan
      –     Economic development, by supporting the
            movement of goods from points of production
                                                                  – Sees rail as a backbone
            to where they are consumed, facilitating                  complemented by BRT and
            regional and international trade.                         mini bus taxis
      –     Greater mobility of people and goods through
            transport alternatives that support minimised
            environmental harm.”

■   National Land Transport Act (2009) providing a
    framework for regulation and transformation especially
    BRT, mini bus taxi

■   Public Transport Strategy and Action Plan – supporting
    Integrated Rapid Public Transport Networks (BRTs)
    with ‘seed capital’ from Public Transport Infrastructure
    and Systems Grant in run up to Soccer World Cup and
    continuing
Key political imperatives and
policies: 2
Growth and                               Integrated Development
Development Strategy                     Plan (IDP)
(GDS)                                   ■ 9 priorities:
 ■   Transport system is central to
     City economy and people               – Promote economic
                                                development and attract
 ■   Recognises potential of rail and           investment
     BRT to create new foundation for
     public transport                      – Pro- poor development
                                           – Service delivery culture
 ■   Getting people to change their        – Improved public safety
     mode of transport – shifting
     from the convenience of private       – Anti corruption
     to public transport – is about        – Citizen responsiveness
     driving a new transport culture.      – Financial sustainability
 ■   Large-scale transport                 – Innovation and smart city
     improvement programmes offer          – Preserve resources
     an ideal opportunity to create     ■ Rea Vaya well aligned to
     employment opportunities
     especially for young people          priorities especially first three
                                          and last
 ■   Encourages NMT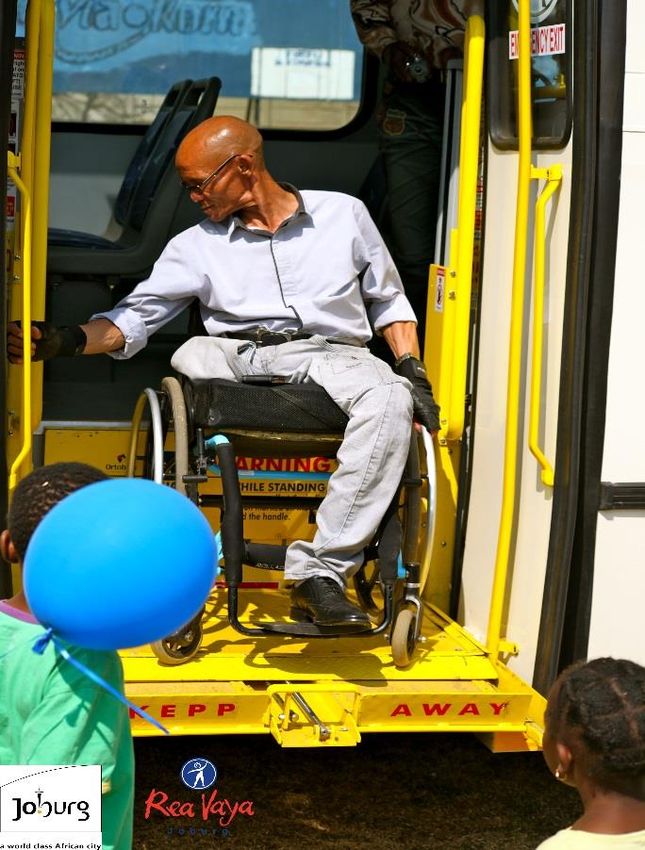
Transport sector priority
areas
■   Integrated public transport planning
■   Implementation, contract
    management and transformation of
    scheduled services:
      – BRT
      – Metrobus
      – Provincial subsidised services
■   Public transport facilities
    (interchanges, ranks)
■   Complete streets (sidewalks, cycle
    lanes, lighting, landscaping)
■   Road and mobility (JRA)
■   Freight management
■   Job creation, capacity building and
    empowerment
■   Regulation and law enforcement in
    partnership with province and JMPD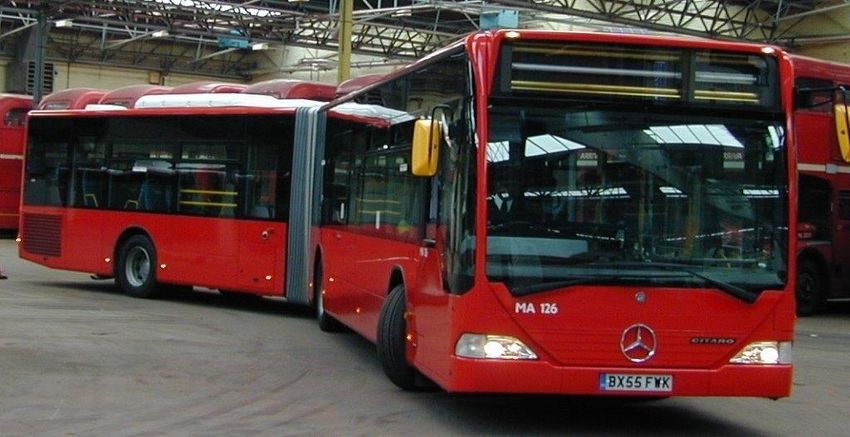
REA VAYA BRT
  OVERVIEW
Why did the City decide on
     bus rapid transit?
At the time….                                  Met the following short
■   Had potential to address number of City    term objectives:
    imperatives and objectives including
    provision of affordable quality public     ■   Efficient, reliable and frequent public
    transport, urban restructuring, BBBEE,         transport services
    catalyse public transport transformation
    and reduce air pollution and green         ■   Affordable fares
    house gas emissions                        ■   Safe and secure
■   Provided opportunity to deliver within     ■   Accessible
    relatively short time frames – and in      ■   Decrease in traffic congestion, energy
    time for 2010 Soccer World Cup
                                                   consumption and vehicle emissions
■   City was impressed by experience in        ■   Enhanced urban environment
    South America particularly in respect of
    transformation of experienced operators    ■   Job creation and income generating
                                                   opportunities
■   Price sounded compelling and
    affordable at the time
                                               Medium and long term benefits envisaged:
■   Could be retrofitted on existing road      • Containment of urban sprawl and TOD
    system and no need for reserved
    servitudes                                 • Promotion of social cohesion
                                               • Economic development around BRT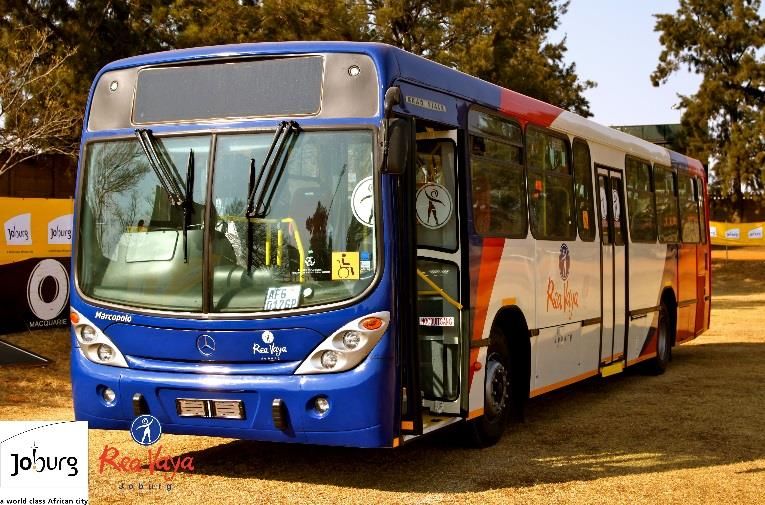
Rea Vaya Bus Rapid Transit
(BRT) objectives
■ Fast, safe, reliable and
  affordable public transport
■ Public transport               Rea Vaya means
  transformation - including      “We are going”
  of mini bus taxi industry to
  prosperous transport
  businesses
■ Spatial restructuring
■ Broad based black
  economic transformation
■ Mitigate against climate
  change and reduce air
  pollution with ‘clean
  buses’
■ Promote livable and
  competitive city
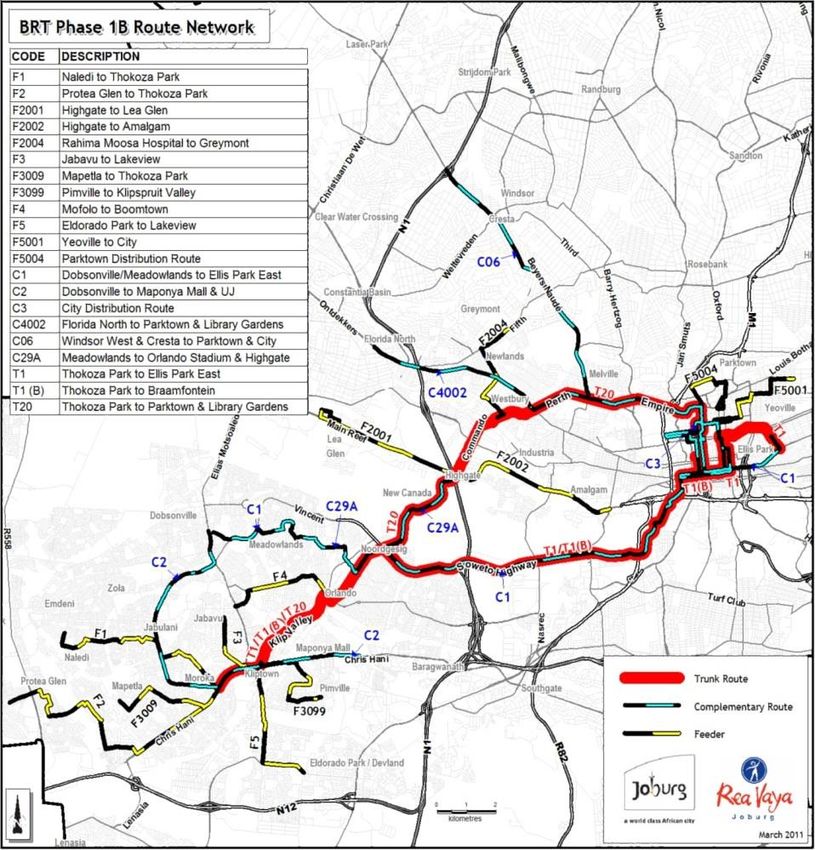
Phase 1A and 1B services in
operation
Key facts:
Phase 1A and 1B
Phase 1A: Started                   Phase 1B: Started Oct
August 2009                         2013
 • 25k of trunk route (dedicated)   • 18km of dedicated trunk route
   for 18 m articulated buses
                                    • 3 complementary and 7 feeder
 • 3 complementary and 5 feeder
   routes using 13 m buses and        routes covering 90.9km
   covering 75.8 km
                                    • 18 more stations
 • 30 Rea Vaya stations service
   passengers                       • 134 Euro V buses
 • 143 Euro 1V buses                • 9286 construction jobs
                                      created during Phase 1B
 • Over 6000 short term
   employment opportunities, 830    • 312 taxis have been taken off
   permanent employment
                                      the road
 • 585 taxis taken off competing
   routes
Key facts: Phase 1C
■ Trunk routes between:
– Sandton, Alex, CBD (IC(a))
– Sandton, Alex, Ivory Park
■ Complementary services:
– Ivory Park, Midrand and
Sandton
– Greenstone, Alex, Sandton,
Randburg
■ Main and feeder taxi services
■ Services will be introduced from
October 2018 (Phase 1 C(a) to Alex,
Sandton, Greenstone) until 2023.
■ Total buses needed are: 236 artics
and 136 rigids, first phase will
require 109 artics and 32 rigids
■ Passenger trips per day expected
will be 46,000 in 2018 to 89 000 in
2021Projected future roll out on Delete
Integrated Public Transport
Network
Services and integration RV Trips
Rea Vaya BRT T1, T2, T3, F1- 12, C1 100,000
-6
Rea Vaya BRT T4, C7
Metrobus restructuring 120,000
Possible restructuring of provincial 125.000
subsidised contracts
Rea Vaya BRT T5, T6, C8 and C9 130.000
150,000PROGRESS AND
PERFORMANCE
• Planning and
integration
• Infrastructure
• Buses
• ITS
• Operations
• TransformationPLANNING AND INTEGRATION
Public transport planning
instruments

Strategic ITP        Transport            Strategic plans         Tactical plans       Business or
Framework            Information          •Strategic Integrated
                                                                  •Public transport    operational
•Overview and        Management            Transport Network
                                                                   operational and     plans
                                           Plan
  reflection of      System                •Public transport       business plans
                                            network hierarchy                          •Transport sector
  status quo         •Household survey                            •Transport master
                                           •Passenger access                            plan
                     •Stated preference                            plans for
•Strategic                                  typologies             catchment areas,    •Business plans for
                      survey
  thrusts                                  •High level network     nodes, precincts     Metrobus, JRA
                     •Traffic counts      •SITPN Implementation                         and Transport
•High level          •EMME model           plan                   •Operating license
                                                                                        Department
  network            •Data from various   •Road network            strategies
                                                                                       •Business plans for
                                           hierarchy
•Indicators           transport           •NMT framework                                Rea Vaya BRT
•Standards            master plans        •Freight management                           phases
                                           plan

                  Underpinned by Transport Governance Framework
Transport planning
priorities
■ Integration with land use: promotion of Transit
Orientated Development as well as growth of
CBD’s
■ Integration of modes: Best mode for level of
demand, efficient transfers
■ Integration with walking and cycling: Every trip
begins with walking – need for completing our
streets to make them safer and accessible
■ Recognition of the role of ‘demand
responsive’/last mile in a situation of urban
sprawl
■ Affordability for passengers and sustainability for
the City
■ Transformation of all aspects of the public
transport sector with a focus on mini bus taxi
sector
■ Contribution to a sustainable future (GHG and air
pollution reduction)Public Transport Network
Hierarchy
MODE
TYPOLOGY DEMAND MODE FUNCTION AND FEATURES
CATEGORIES
o To move people quickly from area of high residential to areas of employment/income
Rail Public Transport SIPTN- Gautrain,
9000-15000 opportunities
Network Type A Metro Rail
o Limited stops. (closed stations)
o Corridors of Freedom, mixed use development , three story residential
Rapid Road Public o To move people quickly from area of high residential to areas of employment/income
SIPTN- Bus Rapid Transport,
Transport Network (High 6000-9000 opportunities
Type B Light Rail, Rapid rail
Capacity) o Limited intersections and right turns so buses can be relatively speedy
o Limited mostly closed high or low floor stations
Road Public Transport o Corridors of Freedom and areas where the City want s o densify along the corridor
SIPTN-
Network (Medium 3000-6000 Bus Rapid Transport o Mixed use development, Three story residential, social housing along corridor.
Type C
Capacity) o Fairly frequent closed and opens low floor stations and some stops
o Frequent stops with shelters
Road Mixed Traffic
o Some public transport priority (e.g. queue jumping)
Public Transport IPTN- Bus (Double Decker,
1000-3000 o On street stopping by public transport vehicles
Network (Medium to Low Type D Standard)
o Low to medium density
Capacity)
Road Mixed Traffic
IPTN- o Frequent stops with lay bye es and shelters
Public Transport 500-1500 Bus ( Standard, Mini bus)
Type E o Low to medium density
Network (Low Capacity)
Road Mixed Traffic o Low to medium density
IPTN- Bus, Taxi, Demand
Public Network (DemandApproved
Strategic
Integrated
Transport Plan Year Areas
Network 2018/ Soweto to CBD (existing)
Expected roll out: 2019 CBD, Alex and Sandton (to
be implemented)
■ 2018: CBD, Alex, Sandton 2019/ Ditto
■ 2019: Restructuring of 2020
Metrobus routes to West 2020/ Soweto to North (Sandton,
and South 2021 Woodmead, Sunninghill)
■ 2020/2023: Soweto to 2021/ CBD, Alex, Sandton, Ivory
Sandton via Randburg 2022 Park
■ 2021/2023: Ivory Park, 2022/ Ditto
Midrand to Sandton/CBD 2023How we are
achieving
integration
BRT is no longer a stand alone
project but:
■ Other initiatives include:
■ Third phase will see
integration between BRT, – Common commuter
Metrobus, Provincial shelters for all modes
buses, mini bus taxis – Pedestrian and cycle
walk ways to Rea
■ Metrobus turn around plan Vaya stations and
is part of integrated City stops
wide transport plan
– Park and rides at key
■ Significant attention is Rea Vaya stations
being paid to integration at – Exploring other kinds
nodes e.g. Gandhi Square of managed/public
(Metrobus/Rea Vaya), Park transport lanes in
Station (rail, bus, mini bus) future phases
and Sandton CBD (rail,
bus, mini bus)INFRASTRUCTURE
(INCLUDING BUSES AND INTELLIGENT
TRANSPORT SYSTEM (ITS)Infrastructure guiding principles ■ Simple, cost effective, “modular” design ■ Capable of rapid implementation ■ Simplicity of operation ■ Ease of maintenance ■ Universally accessible ■ Maximum utilization of natural resources in buildings(light, ventilation) ■ Innovation ■ Specific “look and feel” for Johannesburg ■ Maximum utilization of local resources and products ■ Maximum potential job creation ■ Attractive – public art
Rea Vaya infrastructure
components: 1
Dedicated road ways in median
•Delivers on reliability, safety and speed
•Lane infringement a challenge
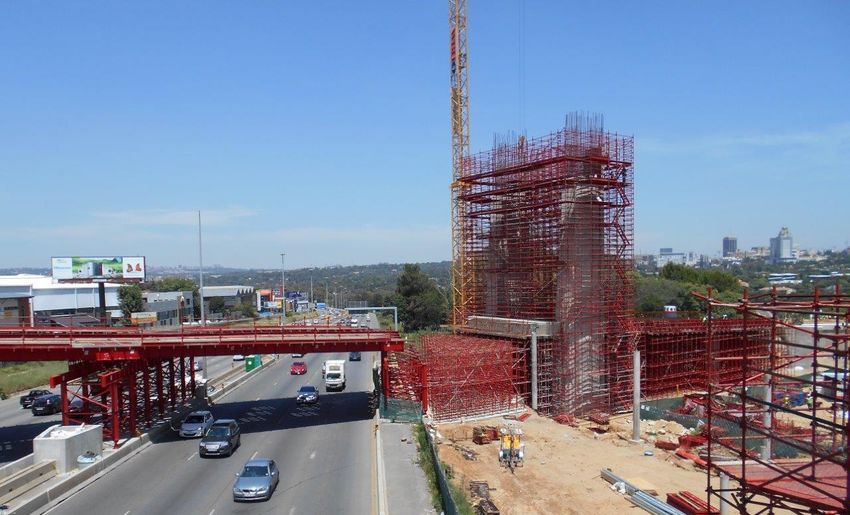
•Dedicated Bus bridge over M1 for third phase
Stations
•Well designed, attractive, safe, iconic, universally accessible
•Are improving design to include public toilets, reduce costs of
construction and operations
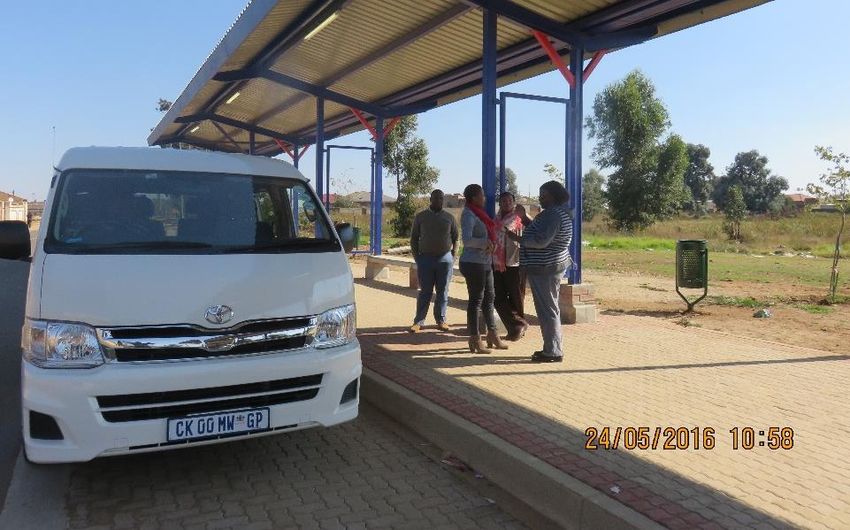
Interchanges
•Successful taxi/bus interchange In Dobsonville with park and ride
•Building more at Park, Gandhi, Sandton for integration between modesRea Vaya infrastructure
components: 2
Non-motorised transport
Pedestrian and cycle walk ways to Rea Vaya stations/stops
Dedicated safe walk and cycle way between Alexandra and Sandton CBD – to
cater for 10 00o people that walk each day
Depots and holding areas
State of art facility in Meadowlands, Soweto for bus maintenance, holding and
holding area in Booysens
Building depots in Selby, Alex, Midrand for future phase
Loan for use to the BOCs
Way finding and signage
In stations and towards stations
Aimed at pedestrians and public transport users
Universally accessibleUniversal
accessibility
■ Progressive implementation of universal
accessibility – for people with disability,
elderly, those with luggage and prams etc.
■ Improvements have included shifts from:
– High floor to low floor stations (with
significant cost and transit implication)
– Wheel chairs lifts to low entry buses with
cassette
– Significant tact tile way finding paving in
and around the stations and alongside
shelters and stops
– Greater attention to fonts and colours on
signage, website and Vaya Moja appBus numbers and
specifications
What Phase 1A Phase 1B Phase 1C
13 m (rigid) 102 93 32
18 m (artics) 41 41 108
Height High entry High entry Low entry
Emission stds Euro IV, diesel Euro V, diesel and To ask bidders for
add Blue Euro V and VI,
diesel & gas
Manufacturer Scania Marco Polo
(chassis)
Manufacturer Mercedes Marco Polo
(body)
Local content Fully imported Over 80% local To spec over 80%
content local contentBus ownership and funding
Phase 1A Phase 1B Phase 1C
City facilitated financing Buses procured with grant Propose that buses are
from Brazil Export Credit funds. procured with City funds
Agency (to BOC with City Will be transferred to BOC and transferred to BOC by
being guarantor) by year 6 pending year 6 as per Phase 1 B
performance and
compliance with MFMA Further buses can be
financed by BOC if
sustainable
Phase 1B rigid
Phase 1C articulated – low entryIntelligent Transport
Systems: Components
What Detail
Communication • Fibre optic cable network
network (ICT) • Wifi (to transfer data from buses to data centres)
• Data centres including servers and cloud capacity
• Back up power (critical for the above to be stable)
Bus management • CCTV cameras on buses, stations, road
and contract • Communication between buses, stations and control room to enable
monitoring (used bus scheduling, passenger information and incident management
to be APTMS)
Automatic fare • Point of sale equipment including automatic vending machines
collection • Fare medium e.g.. smart cards
• Validators on buses and at stations
• Banking partner
Other • Vaya Moja passenger information app
• Biometric system to control access to cashier booth and servers at
stations
• Business Intelligence tool to enhance decision making, reporting and
information gathering on passengers and revenueIntelligent
Transport Systems
Performance
■ We implemented bus monitoring and
automatic fare collection systems – a Lessons and way forward
first for Africa and in respect of bank
based fare collection – the first in the ■ Mixed acceptance by passengers
world at the time
■ Customer focus and affordability should
■ We have faced challenges of: take precedence over integration of
– Reliable source of power – cable ticketing systems
theft and construction disruptions ■ Going forward we are changing
– Imported and rapidly changing requirements to:
technology – Be more robust: static vs variable
– Lack of sufficient skills amongst signs, App to complement next bus
City officials and service providers messages at stations
– Contract management with – More automation of fare collection
multiple complex contracts systems to reduce cash shortages
– Smart systems do not necessarily – More integration with other City
reduce cash shortages systems e.g. broad band
– Prefer local players and create
opportunities for innovation for local
firmsOPERATIONS
Historical and current passenger
numbers and revenue
Passenger Trips Per Month
1600000
1400000
1200000
1000000
800000
600000
400000
200000
0
Jan-15
Jul-13
Nov-13
Jan-14
Jul-14
Nov-14
Jul-15
Nov-15
Jan-16
Jul-16
Nov-16
Jan-17
Mar-14
Mar-15
Mar-16
Mar-17
May-14
May-15
May-16
May-17
Sep-13
Sep-14
Sep-15
Sep-16
Fluctuations due to holiday patterns and labour strikes.
Labour stability and performance improved over last two years.Operational features
Strong one-direction
passenger demand due to
geographic residential and
workplace segregation:
90/10% split on
destination vs. return to
origin demand in peak performance
More than 90% of
passengers use at least
two bus trips to complete
their journeys.
The average journey length Passenger flow
per passenger is 20 • Two-way morning peak flow on Trunk between
kilometer (typical long 06:00 and 08:00 is 3 700 passengers per
trips) hour
• Afternoon peak is more spread out with two-
Peak frequencies: 2 – 5 way flow of 2 400 passengers per hour
mins and off peak 15 – 30 between 16:00 and 18:00.
mins • Off peak two-way flow is around 1 100 per
hourBus operating company
performance: Piotrans
Penalties - Piotrans
180
160
140
120
100
80
60
40
20
0
Jul-16 Aug-16 Sep-16 Oct-16 Nov-16 Dec-16 Jan-17 Feb-17 Mar-17 Apr-17 May-17 Jun-17
Failure to perfom service Accident damages Dirty bus Torn seat Fire extunguisher
Damaged floor strip Using wrong bus Broken Handrails No first Aid KitBus operating company
performance: Litsamaiso
Penalties Litsamaiso
600
500
400
300
200
100
0
Jul-16 Aug-16 Sep-16 Oct-16 Nov-16 Dec-16 Jan-17 Feb-17 Mar-17 Apr-17 May-17 Jun-17
Failure to perfom service Accident damages Dirty bus Graffiti
Fire Extinguisher Mulfunction doors Damage floor strip Road worthy certificate
Damaged Windscreen Using a wrong bus Torn SeatSafety and security
High stations are perceived to 300
be safe 250 267
CCTV camera network both
outside and inside the 200
185
stations 150
100 116
50 77
31 24 13 7
0
Motor vehicle and pedestrian accidentsLane infringement ■ Lane infringement is a serious problem – especially due to lack of effective enforcement (AARTO implementation challenges) ■ Dedicated JMPD officers with 14 vehicles used to manage lane infringement but with limited success ■ Since July 2017, we have increased to 36 vehicles with much higher success rate Bus and pedestrian only bridge over M1
FINANCIAL
PERFORMANCE
Funding and financing:                                              City fare
                                                                       policy
  Source of contributions                                           determines
                                                                    fares which
National government covers:                                         are distance
                                                                     based and
       •All infrastructure costs                                     affordable
       •Infrastructure maintenance
       •System ancillary costs (station management, control centre operations,
       fare collection services, information and marketing,, insurance, ITS
       maintenance, etc.)
       •Transformation and transitional costs
       •Compensation for economic rights of existing operators
Fare revenue is expected to cover

       •Direct vehicle operating costs consist of fuel, labour, operator
       administration and vehicle maintenance
City of Johannesburg is expected to cover

       •Vehicle operating cost of the contracted vehicle operators not covered
       from fare revenue
       •Network authority institution cost (head office and station staff salaries)
PTN Grant expenditure up to
end of June 2017
40Grant allocations vs Expenditure Grant funding amounting to R9.9 billion was allocated as 30 June 207 and R10.2 billion was spent. These amounts include capital and operational expenditure
Rea Vaya fare revenue inception

Drop in revenue was because of the drivers strike
Requested budget for 2018/19
MTEF (requirements vs funding)
                               2017/18 2018/19 2019/20 2020/21         Total
Detail                           Rm      Rm      Rm      Rm             Rm       %

                               Expenditure requirements
 Capital expenditure              616.2    978.8    490.0     526.0    2,611.0   29%
 Vehicles                         166.1    516.7    212.0                894.8   10%
 Compensation                       5.0    819.5                         824.5    9%
 Transition support                12.7      15.0      5.0      10.0      42.7    0%
 Other capital cost               105.0    102.9     96.5      103.6     408.0    5%
 Direct bus operating cost        467.8    659.3    756.4      800.3   2,683.8   30%
 Indirect bus operating cost       37.2      37.2    37.2       37.2     148.7    2%
 System cost                      316.3    322.5    311.2      328.6   1,278.6   14%
Total cost                      1,726.3 3,451.9 1,908.3      1,805.6   8,892.1

                                   Funding sources
 COJ capital contributions        209.1   583.7    212.0               1,004.8   11%
 Capital grant funding            696.0 1,014.7    586.5       629.6   2,926.8   33%
 Operating grant funding          227.9 1,116.6    270.2       286.5   1,901.3   21%
 Fare revenue                     127.9   232.2    285.5       302.3     947.9   11%
 Local funding (rates and taxes) 465.5    504.6    554.1       587.2   2,111.4   24%
Total funding                   1,726.3 3,451.9 1,908.3      1,805.6   8,892.1
BUS OPERATING COMPANY FORMATION AND EMPOWERMENT
The transformation deal
■ A key City objective in introducing BRT was that it should empower the
  previously disadvantaged mini bus taxi industry and contribute to broad
  based black economic empowerment
■ Thus the model implemented by the City and supported by national
  policy and legislation has involved:
   – Negotiating a 12 year contract with affected operators
   – Requiring affected operators to hand in their operating licenses,
        dispose of their vehicles and sign a restraint of trade in exchange
        for becoming a shareholder in a Bus Operating Company
   – Affected operators/shareholders being paid and “empowerment
        premium” which is the difference between what they are
        anticipating to earn as shareholders and what they would have
        continued to earn as taxi operators
   – Offering shareholders further value chain opportunities in station
        cleaning and security
   – Offering ex-taxi drivers and related workers, opportunities to work
        in stations and the bus operating company as drivers etc.
The negotiation
process
2009 to 2011: Phase 1A –
Piotrans set up
2010 to 2014: Phase 1B –
Litsamaiso set up
■ Based on South Africa’s experience of
negotiating new Constitution and transition
to democracy in early 1990s (CODESA)
■ Independent facilitators
■ Independent technical support to the taxi
industry to level the playing field
■ Large inclusive taxi industry negotiation
team
■ Capacity building and training of
negotiators
■ Set up interim companies before
permanent companies – to ensure that
operations started when infrastructure is
complete and learn lessonsNegotiations phases and
agreements
Key negotiated
Negotiation phases agreements
■ Engagement: ■ Negotiation Framework Agreement: sets the
Information sharing rule and processes of negotiation
and capacity building ■ Bus Operating Company Agreement (including
fee/km)
■ Pre-negotiation:
Determining ■ Participation Framework Agreement: how
affectedness and operators will be participate, vehicles and
setting table for operating licenses disposed of
negotiations ■ Employment Framework Agreement: How
displaced employees – mostly drivers – will be
■ Negotiation: accommodated as bus drivers, in stations
Negotiating key ■ Compensation and Value Chain Framework
agreements Agreements: How operators will be
■ Hand over: Managing compensated for loss of current earnings and
the transition how they can benefit from ‘value chain’ e.g..
security contracts at stationsRole of Bus
Operating Company
WHAT DOES BOC DO? WHO RUNS THE BOC
■ Runs the bus services ■ The shareholders own the company
■ Maintains the buses ■ The shareholders from the mini bus
taxi industry nominates Board
■ Is given access to depot of members
City free of charge – but ■ The Board includes members from
must maintain the depot the affected mini bus taxi industry
■ The Board decides on who will
■ Trains and employs drivers manage the company (CEO, CFO
etc)
■ Cleans and secures buses
■ The Board oversees the company
and make sure it does what it
needs to do to be make profits for
the shareholders.Facts and figures on
transformation
What Detail
No of operating licenses Phase 1A: 585
cancelled and vehicles Phase 1B: 312
disposed off TOTAL: 897
No of shareholders Phase 1A: 300
Phase 1B: 171
TOTAL: 471
Number of drivers employed Phase 1A: 200
from the taxi industry Phase 1B: 188
TOTAL: 388
Number of station staff 328
employed from the taxi
industryGains and challenges
Gains
■ Broad based black economic
empowerment for mini bus taxi industry
■ Removal of old and unsafe taxi vehicles
out of business
■ More sustainable livelihoods for operators
and drivers
■ Graduation to formal business
environment and increased capacity
■ Opposition to BRT still exists but has Taxi Scrapping Programme
declined after seeing City delivering on
promises
Challenges
■ Long seated conflicts between association
spills over into BOCs and limits progress
on new routes
■ Lack of sufficient leadership leads to more
focus on the process than the final
outcome
■ Lack of sufficient skills to take advantage
of value chain opportunities
First vehicle scrappedINSTITUTIONAL
ISSUESManaging the Rea Vaya BRT
Planning Infrastructure
Transformation Operations Finance
•Directorate: •Directorate: •Directorate: • Scheduled •Directorate:
Planning and Business Infrastructure Services Finance
Policy Development •Responsible Management •Responsible
•Responsible •Responsible for new Agency for revenue
for new routes for infrastructure •Responsible services, fare
and services transformation development for bus collection,
and BOC and operations, budgeting
Company maintenance station
Formation management,
quality
assurance,
intelligent
transport
systemsInter-governmental Relations
Government Detail
NDOT Manages the conditional grant with NT, provides guidelines and is
required to approve certain aspects.
Improved collaboration and policy and funding certainty would assist
the City
National Treasury Reporting relationship in respect of conditional grants
City Support Programme has championed transport and land use
alignment, capacity building and sharing across cities
Provincial Are supportive, champion integration and are working on an
government integrated back office for fares and passenger information which
can benefit the BRT
Neighbouring Co-ordination with Ekurhuleni more important that Tshwane due to
municipalities proximity of BRT lines (Tembisa/Ivory Park)
Shift to low floor for third phase will enable integrationACHIEVEMENTS AND
IMPACTIs the BRT meeting its
objectives? 1
Objective Meeting?
Fast, safe, reliable, The Rea Vaya services are faster, safer and more reliable due
affordable to the dedicated lanes, off board fare collection, new
vehicles, well trained drivers, etc. The fares are affordable
due to national and City subsidy.
Enable public The Rea Vaya together with Gautrain and other new modes
transport has changed the face of public transport in Johannesburg.
transformation New standard has been set. Increasingly car captive users
are considering public transportIs the BRT meeting its
objectives? 1
Objective Meeting?
Spatial restructuring The Rea Vaya BRT has been complemented by changes in City policy
towards Transit Orientated Development. Spatial restructuring is a
medium to long term goal but there is evidence of increased
densification and property values along some corridors
Broad based black For affected mini bus taxi operators in the first two phases, there
economic has been transformation. However the percentage of taxi operators
transformation who have had access to this opportunity is small. Further initiatives
are required to improve the sustainability of this sector
Climate change, The Rea Vaya buses met the lowest emission standards at the time
reduction in air of purchase and the next buses to be purchased are targeting to be
pollution soot free. However more needs to be done in the whole transport
sector to reduce emissions from vehiclesWhat else has the BRT achieved? ■ Reduction of congestion – important for economic growth ■ Job creation and the provision of economic opportunities ■ Poverty reduction through providing affordable transport especially to low income users ■ Road safety and less accidents ■ Improved health due to reduction of air pollution ■ The development of social cohesion through encouraging more collective means of travelling
Economic Assessment of Phase 1A
    and Phase 1B in 2012
■   COJ in conjunction with United Nations Development Programmes (UNDP) did an economic
    analysis to identify and quantify the relevant economic costs and benefits associated with
    Phase 1A & B and distribution of these benefits.
■   Outcomes include;
     –    Estimated 532,000 people served by Rea Vaya, which is 5% of total Johannesburg
          population
     –    For every R1 m spent on infrastructure, 3.2 jobs created in Gauteng .
     –    Transport related quantifiable benefits include higher travelling speed, safer journeys
          and lower vehicle emissions. Wider societal benefits include densifications and land use
          changes .
     –    Non quantifiable benefits include accessibility and affordability, smart cities,
          transformation of taxi industry.
     –    Benefit Cost Ratio (BCR) for Phase 1A is 0.75, Phase 1B 0.95 and both is 0.82. Increase
          in passenger number can improve BCR, e.g.. fare products (implementation of AFC),
          increase off peak passengers, increase users in opposite direction, attract private car
          users.
     –    BCR for wider societal benefits is more than 1 for both phases due to transport benefits
          and wider economic benefits.
Summary of Rea Vaya customer satisfaction survey: 2014 to 2017
Summary of
   job creation
Jobs created during     Phase 1A: Approx. 6000
construction (1 job +   Phase 1B: 9 300
66 person days)         Phase 1C to date: 7780
                        TOTAL: 23 080

Permanent jobs          Phase 1A BOC: 226
created in BOC          drivers
                        Phase 1B: BOC: 204
                        drivers
                        TOTAL : 430
Permanent jobs          SMMA Head Office: 140
created in City         SSMA: Station staff: 424
                        TOTAL: 564

   Excludes indirect jobs e.g. bus body building
Challenges and risks
Challenge and risk Cause Mitigation
Funding certainty and sufficient Poor economy and fiscal Grant conditions to provide for
funding constraints certainty
Low patronage ONLY in off peak Apartheid settlement patterns Limited mitigation in short term,
and in counter direction Nature of business in City: mostly 8 TOD and TDM in longer term
– 5 pattern
Mini bus taxi industry expectations Tradition of uncompetitive Change management
and stability business practices, Strong political leadership
Expectations of previous phases
no longer affordable
Insufficient capacity of City officials Aspects of project, especially Ongoing capacity building
contract management, are
complex and not necessarily in
government skills set.
Lack of consistent IT connectivity Vandalism, theft, poor contract Improved ITS systems and
management, technology integration with City fibre network
challenges
Fare evasion and cash shortages Challenges with technology Restructuring of station
Poor station management model management model to improve
controls and management.
Greater automation of fare
collection
Disciplinary action against staff
who have allegedly stolen fundsPeak and off peak demand: Rea Vaya
• The peak base ration is
8.9, there are 9 times Rea Vaya Demand
7000
more busses required
6000
during peak than off- 5000 8.9
peak. 4000
3000
• There is very weak off-
2000
peak demand
1000
• Asset (bus) utilization 0
04:00:00
05:00:00
06:00:00
07:00:00
08:00:00
09:00:00
10:00:00
11:00:00
12:00:00
13:00:00
14:00:00
15:00:00
16:00:00
17:00:00
18:00:00
19:00:00
20:00:00
21:00:00
22:00:00
very low, only for few
hours during peakPeak and off peak demand: Bogota
Transmilleneo Demand
• The peak base ratio is 180000
2.8, there are 3 more 160000
2.8
140000
busses required during 120000
peak that off-peak 100000
80000
• There is relatively 60000
strong demand during 40000
20000
the off-peak period 0
04:00:00
05:00:00
06:00:00
07:00:00
08:00:00
09:00:00
10:00:00
11:00:00
12:00:00
13:00:00
14:00:00
15:00:00
16:00:00
17:00:00
18:00:00
19:00:00
20:00:00
21:00:00
22:00:00
• Asset (bus) utilization
is relatively high Transmilleneo Demand
throughout the whole
day.Lessons for future phases ■ Planning: Need to be guided by a long term plan which incorporates other modes, alignment with land use planning and recognise lead times and network effect ■ Financial sustainability: Need to develop a 12 year financial plan – with due regards to increase in operational subsidy, maintenance, operational costs in future years. Difficult to implement flagship projects in a recessionary environment ■ Funding sources: New funding sources unlikely, need to optimise operations, improve efficiency and plan sustainably. ■ Technology: Robust vs smart and local vs foreign choices are more sustainable and feasible ■ Integration: Must be customer centric and not come at a cost premium e.g.. accessible transfers, common passenger information ■ Change management: Critical for both public transport operators, stakeholders and staff
Future directions
■ Next period to focus on:
   – Developing a long term integrated
       fundable plan
   – Operationalisation of Phase 1c
       (a)
   – Optimisation for transformation of
       provincial subsidised services
       and Metrobus
■ Going forward to focus on:
   – Managed lanes with existing bus
      and possibly taxi vehicles
   – Reduced technology
      specifications but more reliance
      on technology for fare collection
   – Improved regulation and law
      enforcement.
You can also read