Reduced-Order Models Correlating Ti Beta 21S Microstructures and Vickers Hardness Measurements
←
→
Page content transcription
If your browser does not render page correctly, please read the page content below

Materials Genome Engineering
http://ojs.wiserpub.com/index.php/MGE/

Research Article

Reduced-Order Models Correlating Ti Beta 21S Microstructures and
Vickers Hardness Measurements

Mostafa Mahdavi1, Mike Standish1, Almambet Iskakov2, Hamid Garmestani1, Surya R. Kalidindi 2, 3*
1
 School of Materials Science and Engineering, Georgia Institute of Technology, Atlanta, GA 30332, USA
2
  George W. Woodruff School of Mechanical Engineering, Georgia Institute of Technology, Atlanta, GA 30332, USA
3
 School of Computational Science and Engineering, Georgia Institute of Technology, Atlanta, GA 30332, USA
  E-mail: surya.kalidindi@me.gatech.edu

Received: 24 August 2020; Revised: 12 December 2020; Accepted: 14 December 2020

Abstract: Ti Beta 21S alloy is a metastable Ti Beta alloy commonly used in the aerospace industry, especially in jet
engines. Components made from this alloy are usually subjected to various thermal histories during service, which leads
to significant changes in their microstructures and associated mechanical properties. The central goal of this study is to
demonstrate the feasibility of correlating the optical images of the microstructure obtained from heat-treated samples
of Ti Beta 21S to their respective Vickers hardness measurements using recently established analyses and statistical
quantification approaches based on the principal components of the rotationally invariant 2-point spatial correlations.
The correlations extracted in this work can be used for non-destructive diagnostics of in-service components.

Keywords: Vickers hardness, Ti Beta 21S alloy, thermal treatments, structure-property linkage

1. Introduction
     A fundamental tenet of the field of materials science and engineering is that the material internal structure (i.e.,
microstructure) controls its effective mechanical properties [1-7]. Indeed, a large number of prior experimental and
modeling studies have explored microstructure-property linkages in various material classes [8-14]. The present study
is focused on metal alloys employed in structural applications. Optical microscopy has served as one of the most
commonly employed low-cost approaches for experimentally documenting the microstructures in metal alloys. While
optical microscopy can successfully reveal the mesoscale grain and phase structure of the alloy, it is incapable of
providing information on the chemical composition. Similarly, hardness measurements have served as one of the most
commonly employed low-cost approaches for assessing the resistance to plastic deformation in a metal alloy. Given
that these techniques are widely used by the metal industry, it raises an obvious question-is it possible to establish
reliable correlations between the optical micrographs and hardness measurements in a selected metal alloy system?
Obviously, any such correlations would have to be confined to a prescribed alloy composition, as variations in the
composition cannot be inferred from the optical micrographs. Therefore, the main variable to be considered in such
correlations would be the different heat treatments that might be applied to the alloy, which induce corresponding
changes in the microstructure. Furthermore, such explorations are also unlikely to capture the effects of cold work on
the microstructure as changes in dislocation densities cannot be inferred reliably from the optical micrographs. In this

Copyright ©2020 Surya R. Kalidindi, et al.
This is an open-access article distributed under a CC BY license
(Creative Commons Attribution 4.0 International License)
https://creativecommons.org/licenses/by/4.0/

Volume 1 Issue 1|2021| 1                                                                           Materials Genome Engineering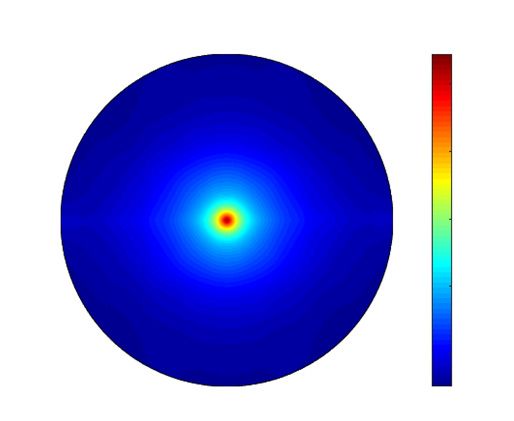
paper, we examine critically the viability of establishing reliable quantitative correlations between optical micrographs
and hardness measurements in a heat-treatable alloy.
      Several previous studies have explored the relationship between the microstructure and composition of materials
and their hardness measurements. Rajakumar et al. [15] modeled the relationship between grain size and hardness of the
weld nugget of friction-stir-welded AA6061-T6 aluminum alloy using a linear relationship that exhibited a coefficient
of determination (R2) of 79.2%. The low fidelity of this model indicates that there are other microstructural parameters
that control the mechanical properties that need to be considered in order to arrive at a higher fidelity model. In another
study, Heidarzadeh et al. [16] used the Hall-Petch equation to correlate hardness to the grain size for friction-stir-
welded Cu-Zn alloys and found that microstructural inhomogeneities contributed significantly to the loss of fidelity
of the models. The central challenge in such studies comes from the need to incorporate higher-order descriptors of
microstructure that go beyond the highly simplified descriptors such as the volume fraction of each phase or the average
particle size.
      Recently, Kalidindi and co-workers have introduced the Materials Knowledge Systems (MKS) framework for
capturing the correlations between microstructures and the properties associated with them using emergent data science
tools [17, 18]. One of the key advantages of MKS lies in its use of a comprehensive set of microstructure descriptors.
In this paper, we used this framework for quantifying the optical micrographs obtained from differently heat-treated
samples of Ti Beta 21S alloy and establishing correlations to their measured hardness values. The heat treatments
employed covered a temperature range of 350-750°C, while the heat treatment times were in the range of 10 minutes to
24 hours. Ti Beta 21S exhibits diverse two-phase microstructures in these ranges of heat treatments along with a wide
range of mechanical properties [19-21]. Consequently, this metal serves as a good candidate for the present study.

2. Materials and sample preparation
      Generally, pure titanium exists as a hexagonal close-packed (hcp) α-phase and can transform into a body center
cubic (bcc) β-phase at an elevated temperature [22]. Ti Beta 21S (Ti-15Mo-3Nb-3Al-0.2Si) is a metastable β-phase (bcc)
material produced for the aircraft industry due to its high oxidation and corrosion resistance [23]. This material can
transform into a two-phase (α + β) microstructure when aged below β-transus temperature (807°C), as secondary α-phase
particles nucleate [24].
      In this study, two sheets of 1.054 mm thick TIMET TIMETAL® 21S (Ti-15Mo-3Nb-3Al-0.2Si, ASTM Grade
21) provided by Boeing Company, Huntsville, AL, USA, were cut into pieces with dimensions of 127 × 203 mm.
Samples were put in the furnace at a pre-set temperature and then removed at different time points. The full matrix
of heat treatments applied covered temperatures between 350°C to 750°C with 50°C steps (9 different temperatures)
and aging times of 10 minutes, 30 minutes, 2 hours, 5 hours, and 24 hours (a total of five different aging times). Not
every specimen in the matrix was included in the study, as some samples did not exhibit detectable α-phase nucleation.
Since our focus is on relating the α- β morphology in the optical micrographs to their hardness values, single-phase
samples do not offer useful data for the present study. The heat treatments for the 20 samples chosen for the study are
identified in Table 1 below. When removed from the oven, samples were quenched immediately in water to preserve the
microstructure corresponding to each thermal treatment. The samples were then mounted using a Struers CitoPress-1
in phenol and methenamine based conductive material called Konductomet® purchased from Buehler Company, Lake
Bluff, IL, USA. The mounting press was set for a four-minute heat cycle at 180°C followed by a six-minute cooling cycle
at a pressure of 4200 psi. All titanium cutting operations were done prior to aging with an ISOMET® 1000 diamond
saw to ensure clean cuts. The mounted samples were polished using a Struers RotoPol-31 automatic polisher equipped
with a RotoForce-4 wheel head and multidose. During polishing, six samples were sequentially ground from 240 grit
paper down to a soft pad with a colloidal silicon suspension in order to achieve a mirror finish. Samples were exposed to
fifteen minutes of ultrasonication in water, followed by rinsing with methanol to remove excess silicon on the surface of
the samples. Samples were etched using an oxalic etch (490 mL oxalic acid, 10 mL Hydrogen Fluoride (HF)) and Kroll’s
reagent (435 mL water, 60 mL nitric acid, 5 mL HF). Residual etchant on the mounting material was neutralized using
a baking soda solution before rinsing with water and methanol. A Zeiss optical microscope was used to take images of
each sample under different magnifications (200X, 500X, and 1000X) in order to document each sample’s microstructure.

Materials Genome Engineering                                                                      2 | Surya R. Kalidindi, et al.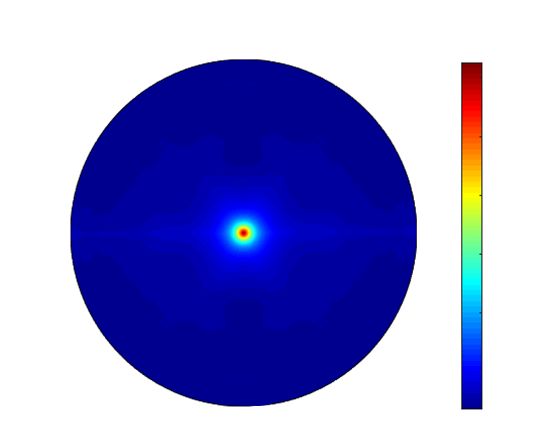
3. Results and discussion
3.1 Optical micrographs and Vickers hardness measurements
      Optical micrographs were taken at the magnification of 200X for each sample (20 images in total). Figure 1(a)-(c)
shows three of the optical micrographs, representing the variety of microstructures observed in the samples studied in
this work. In Figure 1, the darker colored regions represent α-phase and the lighter colored regions represent β-phase.
As seen in Figure 1(a), α-phase is more prevalent in the sample aged well below the β-transus temperature of 807°C.
For a moderately high temperature such as 550°C (see Figure 1(b)), the α-phase is less prevalent. The trend continues
at 700°C (see Figure 1(c)), where we see a clear dominance of the β-phase. Also, some of the darkly colored features in
Figure 1 appear at grain boundaries. These regions were analyzed using back-scattered electrons in the scanning electron
microscope (SEM) to ensure that they represent α-phase regions (see Figure 1(b) and (c)). From the images acquired, it
is clear that the α and β phases exhibit very different phase morphology and spatial distributions after the application of
the different treatments explored in this study. The grain sizes in these samples varied from about 2 microns to around
40 microns.

       (a)                                            (b)                                            (c)

                                           50 μm                                        50 μm                                          50 μm

                Figure 1. Example optical microscopy images of Ti Beta 21S taken from samples subjected to three thermal treatments:
                                           a) 450°C for 2hrs, b) 550°C for 30min, and c) 700°C for 30min

      After optical microscopy, Vickers hardness was measured on all the samples using a Leco hardness machine using
a fixed load of 2 kg. At least five different measurements were made in each sample.
      Table 1 summarizes the measured Vickers hardness values for each microstructure included in this study.
Additionally, Figure 2 illustrates the dependence of the measured Vickers hardness values on the aging time and
temperature as a contour map. The minimum and maximum hardness values corresponded to the sample aged at 650°C
for 10 min with a hardness of 281.34 ± 5.9 (HV) and the sample aged at 500°C for 5 hrs with a hardness of 436.86
± 3.3 (HV), respectively. The large difference in the hardness demonstrates that this alloy can be hardened significantly
by aging.

             Table 1. The average and standard deviations of the Vickers hardness measurements for at least five tests in each aged sample.
                                       A total of twenty different aging treatments were employed in this study

                             350°C       350°C      350°C       400°C      400°C      450°C       450°C       450°C      500°C      500°C
              Sample          2 hrs       5 hrs     24 hrs       5 hrs     24 hrs     10 min       2 hrs       5 hrs      2 hrs      5 hrs
            Vickers           291.0      290.8      396.5       385.4      399.8       286.5      355.1       381.2      375.3       436.6
         hardness (HV)        ± 2.1      ± 2.7      ±2.7        ± 4.7      ± 2.6       ± 4.9      ± 1.9       ± 2.9      ± 3.4       ± 3.3
                             550°C      600°C       600°C      650°C       650°C      700°C       700°C      750°C       750°C      750°C
              Sample         30 min     10 min      30 min     10 min       2 hrs     30 min       2 hrs     10 min       2 hrs      5 hrs
            Vickers           326.1      389.2      394.6       281.3      359.3       297.7      338.6       297.9      292.9       294.1
         hardness (HV)        ± 4.2      ± 3.1      ± 5.1       ± 5.9      ± 3.5       ± 4.1      ± 2.2       ± 3.4      ± 3.1       ± 4.9

Volume 1 Issue 1|2021| 3                                                                                               Materials Genome Engineering
750 420
700 400
Aging Temperature (°C) 650
Vickers hardness (VH)
380
600
360
550
340
500
450 320
400 300
350
200 400 600 800 1000 1200 1400
Time (minutes)
Figure 2. The contour map of the Vickers hardness data presented in Table 1
The micrographs obtained in this study were segmented using a suite of image processing techniques such as
thresholding, edge detection, and smoothing. Image segmentation is an important step in this study, as the structure
quantification (needed for establishing the structure-property linkage) is performed on the segmented micrographs.
Two strategies were explored to ensure that we capture all of the important features in the segmented micrographs.
The first strategy was to compare the segmented versions of the micrographs taken at a magnification of 200X with the
corresponding ones taken at a higher magnification image of 1000X to ensure that the small features (i.e., phase regions)
in the images are correctly captured. The second strategy used was to overlay the segmented and raw images on top
of each other to check the segmentation results around the grain boundaries (paying specific attention to the width and
connectivity of grain boundaries). Figure 3(a)-(c) shows the segmented versions of the images shown in Figure 1(a)-(c).
3.2 Microstructure quantification
In this study, the microstructure statistics are obtained using the framework of 2-point spatial correlations (also
called 2-point statistics) defined as [25]
′ 1 S
f rhh= = ∑ s 1 msh msh+′ r (1)
Sr
where s = 1, 2, ..., S indexes all of the pixels in the micrograph, h indexes the distinct local states (here it indexes the
two thermodynamic phases present in the micrographs), mhs is the volume fraction of local state h in pixel s, and f rhh'
captures the joint probability of finding the local state h at the tail and the local state h' at the head of the vector r placed
randomly in the microstructure. Compared to the highly simplified statistical measures of the microstructure such as the
phase volume fractions and average grain size, 2-point statistics provide a rigorous and comprehensive set of statistical
measures of the microstructure [26]. For example, the zero vector (r is equal to zero) in the autocorrelation of local state
h, denotes the volume fraction of the local state h. Additionally, information of size and shape distributions of the local
state are embedded in the 2-point statistics [26]. Another salient aspect of the 2-point statistics is that it automatically
captures anisotropy in the microstructure statistics. For a microstructure with two local states, only one of the
autocorrelations is independent (e.g., [27]). In the present study, we have computed and used the autocorrelations of the
β-phase (colored white in the segmented images in Figure 3(a)-(c)). Figure 3(d)-(f) presents the 2-point statistics maps
for the autocorrelation of the β-phase for the segmented images shown in Figure 3(a)-(c). As already mentioned, the
center peaks in these autocorrelation maps capture the β-volume fractions, while the contours close to the central peak
embed information on size and shape distributions of the β-phase. The three-segmented images shown in Figure 3(a)-
(c) depict mostly isotropic distributions with decreasing sizes of the β-phase regions, respectively. The autocorrelation
Materials Genome Engineering 4 | Surya R. Kalidindi, et al.maps indicate that the scan size is much larger than the coherence lengths seen in these autocorrelation maps. Coherence
length reflects the microstructural length scale where the autocorrelations asymptote to a value equal to the square of the
volume fraction [1], indicating that the spatial placement of the β-pixels is uncorrelated beyond this length scale. For the
images shown in Figure 3(a)-(c), the coherence lengths are seen to be around 1-2 times the average size of the β-regions,
indicating that their spatial placement in the microstructure is quite random. Since all of the segmented images used
in this study employed the exact same resolution in terms of the pixel size, the autocorrelation maps also exhibit a
consistent spatial resolution. Given the relatively short coherence lengths observed in the images, the autocorrelation
maps were truncated to keep only the vector components below 50 μm, as shown in Figure 3(d)-(f).
(a) (b) (c)
50 μm 50 μm 50 μm
(d) (e) (f)
50 0.3 50 0.45 50 0.86
μm 0.28 μm μm
0.26 0.84
0.4
0.24 0.82
0.22 0.35
0 0.2 0 0 0.8
0.18 0.3
0.16 0.78
0.14 0.76
0.25
50 0.12 50 50
μm 0 50 μm μm 0 50 μm μm 0 50 μm
(g) 90° (h) 90° (i) 90°
0.86
0.45
0.3 0.84
0.4
0.82
0.25
180° 0° 180° 0° 0.35 180° 0°
0.7
0.2
0.3 0.78
0.15 0.76
0.25
270° 270° 270°
Figure 3. Segmented example micrographs from three samples aged at a) 450°C for 2 hrs, b) 550°C for 30 min,
and c) 700°C for 30 min. The darker regions in these images correspond to the α-phase, while the lighter regions correspond to β-phase.
d)-f) Autocorrelations of β-phase corresponding to the segmented images shown in (a)-(c).
g)-i) RI2SS maps corresponding to the segmented images shown in (a)-(c)
One of the challenges in using the autocorrelations shown in Figure 3(d)-(f) is that they are sensitive to the
selection of the observer reference frame. In other words, rotation of the images would result in a corresponding rotation
of the autocorrelation maps. Therefore, if the images do not have a clearly specified natural reference frame, this causes
a problem in comparing the statistics obtained from the different samples. In order to overcome this challenge, Cecen
et al. [28] have recently introduced a rotationally invariant version of the 2-point statistics called RI2SS (rotationally
invariant 2-point statistics). RI2SS filters out the effects of the observer reference frame while retaining the inherent
anisotropic structural information. This is accomplished by first expressing the 2-point statistics in polar coordinates,
applying a Discrete Fourier Transform (DFT) only on the angular dimension, removing the phase angle information,
Volume 1 Issue 1|2021| 5 Materials Genome Engineeringand computing an inverse DFT to recover RI2SS in polar coordinates. Figure 3(g)-(i) shows the RI2SS plots for the
2-point autocorrelations shown in Figure 3(d)-(f ). The removal of the phase angle information shifts the dominant phase
information to θ = 0o. In other words, the horizontal line connecting θ = 0o to θ = 180o in Figure 3(g)-(i) represents pair
correlation function (PCF) or radial distribution function (RDF) [1, 29, 30], which reflect directionally averaged 2-point
spatial correlations in the image. It has been shown that the RI2SS retains information about the relative anisotropy in
the spatial correlations in the image that are independent of the observer reference frame. Figure 3(g)-(i) shows that the
images exhibit mostly isotropic spatial correlations with only faint hints of anisotropy at short length scales (i.e., 20-
40 µm). It is important to understand that a substantially large scan is needed to reliably capture the autocorrelations
presented in Figure 3. Indeed, in the present study, it was seen that the spatial correlations attained consistent and
reliable values when the scan size (430 µm × 300 µm) was increased to over 15 times the typical feature size (i.e., the
size of the beta region).
3.3 Principal component analysis
The RI2SS maps shown in Figure 3(g)-(i) result in a high-dimensional vector of descriptors for every
microstructure. Specifically, each RI2SS map shown in these figures includes 400 radial bins and 180 circumferential
bins (using one-degree bins and using only one half by taking advantage of symmetry in these maps), resulting in
a total of 400 × 180 = 72000 microstructure statistics for each sample. This result is an extremely high dimensional
representation of the microstructure statistics. In prior work, it was demonstrated that principal component analysis (PCA)
can be utilized to obtain an objective (i.e., data-driven) low-dimensional representation of the microstructure statistics
[14] that have been found to be especially well suited for formulating reduced-order Process-Structure-Property (PSP)
linkages [14]. Mathematically, these low-dimensional representations of the RI2SS can be expressed as
f ( k ) ≈ ∑iR=1 α i( k )ϕi + f (2)
where f (k) represents a vectorized set of RI2SS for the microstructure labeled (k), and αi, φi , and f¯ denote the principal
component (PC) scores, the PC basis, and the ensemble average of all the vectorized RI2SS for the complete set of 20
images included in this study. The accuracy of the representation in Eq. (2) is controlled by the truncation level in the
number of retained PCs, R. Since PCA organizes the PCs such that they systematically capture the highest amount of
variance in the dataset, the expansion in Eq. (2) is naturally convergent. For the micrographs analyzed in this work,
~
the ensemble average statistics ( f ) and the first two PC basis maps (φ1 and φ2) are shown in Figure 4. The basis
maps identify a normalized weighted set of spatial statistics that are systematically increased (or decreased) in the
microstructure as the corresponding PC score increases (or decreases). All of the changes captured by each PC score are
~
always in relation to the ensemble average ( f ).
~ φ1 φ2
f
90° 90° ×10-3 90° ×10-3
2.7 6
Autocorrelation
0.45
2.65
β-phase
4
0.4 2.6
180° 0° 180° 2
2.55 180°
0.35 0° 2.5 0° 0
2.45 -2
0.3
270° 270° 270°
Figure 4. Representation of the ensemble average and the first two PC basis maps
Materials Genome Engineering 6 | Surya R. Kalidindi, et al.In order to interpret and understand the PC representations obtained from Eq. (2), it is useful to examine the
ensemble of microstructure statistics aggregated in the subspace corresponding to the first few PCs. Figure 5 shows
the PC1-PC2 representations of the RI2SS for all samples used in this study. In prior studies [14, 25], it was generally
observed that PC1 is highly correlated to the phase volume fraction information. This should not be interpreted that
PC1 carries information only on the volume fractions. In fact, it is quite clear from the PC basis maps shown in Figure
4 that PC1 is not exclusively correlated with the phase volume fraction. This is because the value at the center of these
basis maps corresponds to the value of the phase volume fraction and the observation that the values at the center of the
higher-order PC basis maps (i.e., PC2 and higher) are not zero.
The microstructures studied in this work covered a roughly triangular region in the PC1-PC2 space, as shown in
Figure 5. As expected, it is seen that PC1 scores correlated well with the β-phase volume fractions. Also as expected,
the PC representations presented similar micrographs closer together based completely on the RI2SS computed from the
micrographs, without the specification of any other information (such as the beta volume fractions or average feature
sizes). This is clearly seen by noting that the three “corners” of the triangular region seen in Figure 5 corresponds to
distinctly different microstructure morphologies. The left corner of the microstructure space in Figure 5 is populated
with micrographs with low β-volume fractions, and with beta occupying mainly the grain boundary regions around
equiaxed α. As one moves to the right in the microstructure space, one clearly sees an increase in the β-volume fractions.
However, the microstructures in the top right and bottom right of the microstructure space are distinctly different, even
though they exhibit similar β-volume fractions. In other words, PC1 score is significantly more correlated with β-volume
fraction, compared to the PC2 score. The main differences between the top and bottom microstructures on the right side
are actually in the morphology of α, with equiaxed α at the top and mostly grain boundary α at the bottom. Although
the PCA was performed on the autocorrelations of the β, it implicitly contains information on the morphology of α. It is
seen that PCA effectively organized the microstructure space shown in Figure 5 based on the differences in their RI2SS.
PCA also revealed that the first two PCs account for 99.97% of the variance in the complete ensemble of micrographs
employed in this study. Indeed, it is remarkable that only a handful of PCs are required to represent the complex material
structure seen in the diverse set of micrographs. This special feature has been the central characteristic in multiple other
formulations of highly accurate PSP linkages obtained using the MKS framework [14, 18, 31].
10
8
6
4
PC2 Score
2
0
-2
-4
-6
-8
-100 -50 0 50 100 150
PC1 Score
Figure 5. PC1-PC2 representations of the RI2SS for all samples used in this study along with corresponding micrographs for selected points
3.4 Structure-property linkages
Building on prior work [14, 32], we next extract a model that takes the PC scores of RI2SS as inputs and predicts
their hardness as the output. Since the first two PC scores captured about 99.97% of the total variance in the dataset
gathered for this work, only the first two PC scores were used to build the desired model. There exist a large number of
options for model building that range from regression techniques [33, 34] to neural networks [35, 36] to non-parametric
Volume 1 Issue 1|2021| 7 Materials Genome Engineeringapproaches such as Gaussian process regression (GPR) [37, 38]. Neural networks typically require a large dataset and
therefore were not deemed suitable for the present study. Given the relatively small dataset available for the present
study (a total of 20 data points), it was decided to explore standard (least-squares) regression using a polynomial model
form. In this work, the inputs were considered as the first two PC scores (i.e., PC1 and PC2 values), while the output
was considered as the hardness measured from the sample.
The performances of the models built (for different orders of polynomials) in this work were critically compared
against each other using the cross-validation technique. In the cross-validation technique employed here, for
each attempt at building the model, three microstructures were randomly selected for the test set and the rest (17
microstructures) were used as the training set. The entire process was repeated eight times for each model. The errors on
all of the test data points are then collected, resulting in a total of 24 errors. The following definition of the percentage
error was employed in these computations:
H ( k ) - H ∗( k )
E (k ) = ( )100 (3)
H (k )
where H (k) is the measured Vickers hardness of i th microstructure and H * (k) is the predicted Vickers hardness in each
validation test. From the aggregated set of 24 errors, we have computed an average error and a standard deviation of the
test errors. These were used as measures of the accuracy and robustness of the model. For building a regression model,
a simple polynomial model between the microstructure features (i.e., PC scores) and the target (i.e., hardness value) was
explored. This polynomial model can be expressed as
H * = Xβ + ε (4)
where X denotes various monomials of the PC scores and β is a set of unknown parameters. As an example, for a
second-order polynomial with the first two PC scores, the monomials considered would include 1, α1, α2, α1α2, α 21, and
α 22. The model parameters ( β) are established using ordinary least squares (OLS) estimation as
β = ( X TX )-1 X TH (5)
Models of different polynomial orders with the first two PC scores were explored in this study. Although the
inclusion of more features (i.e., more of the monomials) usually produces a lower error value in the training, it often also
results in higher cross-validation errors for the test data points (indicating an over-fit of the model). This is especially the
case in the present study because of the small number of data points (i.e., only 20 micrographs). To find the best model,
different combinations of inputs (i.e., features) among PC1, PC12, PC13, PC2, PC22, PC23, PC1 × PC2, PC12 × PC2, PC1
× PC22, and (PC1 × PC2)2 were utilized. In total, 45 models were explored, and cross-validation was used to identify the
best surrogate model. Table 2 summarizes the best five models built in this work based on the cross-validation errors.
Table 2. Cross-validation errors for the five best models built in this work using different features selected from the monomials of the PC scores
representing the microstructure
Average error for
Monomials in the regression cross-validation technique
PC1, PC2, PC12, PC1× PC2, PC1 × PC22 3.15%
PC1, PC2, PC12, PC22, PC1× PC2 8.10%
PC1, PC2, PC1 , PC1 ×PC2
2
10.23%
PC1, PC2, PC22, PC1×PC2 13.72%
PC1, PC2, PC1 , PC1 , (PC1× PC2)
2 3 2
17.41%
Materials Genome Engineering 8 | Surya R. Kalidindi, et al.The best model (with the lowest cross-validation error) obtained in our trials is expressed as:
H i = 0.0293(PC1 × PC2) - 3.2038(PC2) + 0.0021(PC1 × PC22) - 0.5938(PC1) + 0.0024(PC1)2 + 315.9711 (6)
It should be noted that the cross-validation error for the best model was significantly lower compared to the
second-best model, suggesting that the inputs used for the best model are indeed significantly more important. The very
low cross-validation error indicates that we do not have an overfit for our model. The cross-validation errors for the
best model from Table 2 are presented in a parity plot in Figure 6. In this study, due to the limited dataset, a polynomial
model was used with a convex optimization method. If a large dataset was available, neural networks [39] might offer
a better alternative. This is because neural networks allow for learning a much larger class of functions. These methods
offer various computational efficiencies in dealing with large data sets [40].
420
400
380
Line Y=X
360
Actual Data
Test
340
320
300
280
260
260 280 300 320 340 360 380 400 420
Predicted Data
Figure 6. The cross-validation predictions of structure-property linkage for the model shown in Eq. (6)
It should be noted that only 20 different structures have been used in this study. Therefore, it is expected that the
structure-property linkage will change when new data points are added. However, as more data points are added, the
structure-property linkage developed by the approach presented in this work is expected to stabilize. This is because
similar structure-property linkages extracted from data simulation generated from micromechanical finite element
models have already been shown to exhibit this trend [41]. The strength of this strategy is that the model can be allowed
to improve as more data becomes available, possibly from multiple research groups.
4. Conclusion
In this study, we measured Vickers hardness on samples of Ti Beta 21S alloy after different thermal treatments.
These measurements were successfully correlated to the corresponding microstructures in the samples obtained using
optical micrographs. This was accomplished using the first two principal components of the rotationally invariants 2-point
autocorrelations as the microstructure features. It was observed a simple polynomial model developed using these
features produced a surrogate model with a cross-validation error of about 3%. This opens up new research avenues for
establishing valuable structure-property linkages in metal samples using high throughput experimental protocols and the
emerging data science toolsets.
Volume 1 Issue 1|2021| 9 Materials Genome EngineeringAcknowledgments
Mostafa Mahdavi and Hamid Garmestani appreciate the support from the Boeing Company. Almambet Iskakov
and Surya Kalidindi acknowledge support from ONR N00014-18-1-2879. Their all support is highly appreciated.
References
[1] Torquato S. Random Heterogeneous Materials: Microstructure and Macroscopic Properties. German: Springer
Science & Business Media; 2013.
[2] Adams BL, Olson T. The mesostructure-properties linkage in polycrystals. Progress in Materials Science. 1998;
43(1): 1-87.
[3] Eshelby JD. The determination of the elastic field of an ellipsoidal inclusion, and related problems. Proceedings of
the Royal Society of London Series A Mathematical and Physical Sciences. 1957; 241(1226): 376-396.
[4] Mahdavi M, Hoar E, Sievers DE, Chong Y, Tsuji N, Liang S, et al. Statistical representation of the microstructure
and strength for a two-phase Ti-6Al-4V. Materials Science and Engineering: A. 2019; 759: 313-319.
[5] Monteverde F, Guicciardi S, Bellosi A. Advances in microstructure and mechanical properties of zirconium
diboride based ceramics. Materials Science and Engineering: A. 2003; 346(1-2): 310-319.
[6] Watanabe T, Tsurekawa S. The control of brittleness and development of desirable mechanical properties in
polycrystalline systems by grain boundary engineering. Acta materialia. 1999; 47(15-16): 4171-4185.
[7] Chlebus E, Gruber K, Kuźnicka B, Kurzac J, Kurzynowski T. Effect of heat treatment on the microstructure and
mechanical properties of Inconel 718 processed by selective laser melting. Materials Science and Engineering: A.
2015; 639: 647-655.
[8] Han SY, Shin SY, Lee S, Kim NJ, Kwak J-H, Chin K-G. Effect of carbon content on cracking phenomenon
occurring during cold rolling of three light-weight steel plates. Metallurgical and Materials Transactions A. 2011;
42(1): 138-146.
[9] Kusakin P, Belyakov A, Haase C, Kaibyshev R, Molodov DA. Microstructure evolution and strengthening
mechanisms of Fe-23Mn-0.3 C-1.5 Al TWIP steel during cold rolling. Materials Science and Engineering: A.
2014; 617: 52-60.
[10] Sabzi HE, Hanzaki AZ, Abedi H, Soltani R, Mateo A, Roa J. The effects of bimodal grain size distributions on
the work hardening behavior of a TRansformation-TWinning induced plasticity steel. Materials Science and
Engineering: A. 2016; 678: 23-32.
[11] Olson GB. Computational design of hierarchically structured materials. Science. 1997; 277(5330): 1237-1242.
[12] Rajan K. Informatics for Materials Science and Engineering: Data-Driven Discovery for Accelerated
Experimentation and Application. British: Butterworth-Heinemann; 2013.
[13] Fromm BS, Chang K, McDowell DL, Chen L-Q, Garmestani H. Linking phase-field and finite-element modeling
for process-structure-property relations of a Ni-base superalloy. Acta Materialia. 2012; 60(17): 5984-5999.
[14] Gupta A, Cecen A, Goyal S, Singh AK, Kalidindi SR. Structure-property linkages using a data science approach:
Application to a non-metallic inclusion/steel composite system. Acta Materialia. 2015; 91: 239-254.
[15] Rajakumar S, Muralidharan C, Balasubramanian V. Statistical analysis to predict grain size and hardness of the
weld nugget of friction-stir-welded AA6061-T 6 aluminium alloy joints. The International Journal of Advanced
Manufacturing Technology. 2011; 57(1-4): 151-165.
[16] Heidarzadeh A, Saeid T. Correlation between process parameters, grain size and hardness of friction-stir-welded
Cu-Zn alloys. Rare Metals. 2018; 37(5): 388-398.
[17] Kalidindi SR, Niezgoda SR, Landi G, Vachhani S, Fast T. A novel framework for building materials knowledge
systems. Computers, Materials, & Continua. 2010; 17(2): 103-125.
[18] Fast T, Niezgoda SR, Kalidindi SR. A new framework for computationally efficient structure-structure evolution
linkages to facilitate high-fidelity scale bridging in multi-scale materials models. Acta Materialia. 2011; 59(2):
699-707.
[19] Bania PJ. Next generation titanium alloys for elevated temperature service. ISIJ International. 1991; 31(8): 840-
847.
[20] Williams J. Kinetics and phase transformations (in Ti alloys). Titanium science and technology. 1973; 1433-1494.
[21] Chaudhuri K, Perepezko J. Microstructural study of the titanium alloy Ti-15Mo-2.7 Nb-3Al-0.2 Si (TIMETAL
21S). Metallurgical and Materials Transactions A. 1994; 25(6): 1109-1118.
Materials Genome Engineering 10 | Surya R. Kalidindi, et al.[22] Zhang J, Tasan CC, Lai M, Dippel A-C, Raabe D. Complexion-mediated martensitic phase transformation in
Titanium. Nature communications. 2017; 8: 14210. Available from: doi: 10.1038/ncomms14210.
[23] Cotton JD, Briggs RD, Boyer RR, Tamirisakandala S, Russo P, Shchetnikov N, Fanning JC. State of the art in beta
titanium alloys for airframe applications. Jom. 2015; 67(6): 1281-1303.
[24] Martin B, Samimi P, Collins P. Engineered, spatially varying isothermal holds: Enabling combinatorial studies of
temperature effects, as applied to metastable titanium alloy β-21S. Metallography, Microstructure, and Analysis.
2017; 6(3): 216-220.
[25] Cecen A, Fast T, Kalidindi SR. Versatile algorithms for the computation of 2-point spatial correlations in
quantifying material structure. Integrating Materials and Manufacturing Innovation. 2016; 5(1): 1.
[26] Adams BL, Kalidindi S, Fullwood DT. Microstructure Sensitive Design for Performance Optimization. British:
Butterworth-Heinemann; 2012.
[27] Niezgoda S, Fullwood D, Kalidindi S. Delineation of the space of 2-point correlations in a composite material
system. Acta Materialia. 2008; 56(18): 5285-5292.
[28] Cecen A, Yabansu YC, Kalidindi SR. A new framework for rotationally invariant two-point spatial correlations in
microstructure datasets. Acta Materialia. 2018; 158: 53-64.
[29] Roberts AP. Statistical reconstruction of three-dimensional porous media from two-dimensional images. Physical
Review E. 1997; 56(3): 3203. Available from: doi: 10.1103/PhysRevE.56.3203.
[30] Bochenek B, Pyrz R. Reconstruction of random microstructures-a stochastic optimization problem. Computational
Materials Science. 2004; 31(1-2): 93-112.
[31] Brough DB, Wheeler D, Warren JA, Kalidindi SR. Microstructure-based knowledge systems for capturing process-
structure evolution linkages. Current Opinion in Solid State and Materials Science. 2017; 21(3): 129-140.
[32] Paulson NH, Priddy MW, McDowell DL, Kalidindi SR. Reduced-order structure-property linkages for
polycrystalline microstructures based on 2-point statistics. Acta Materialia. 2017; 129: 428-438.
[33] Rao CR, Rao CR, Statistiker M, Rao CR, Rao CR. Linear statistical inference and its applications. New York: John
Wiley & Sons, Inc.; 1973.
[34] Mosteller F, Tukey JW. Data Analysis and Regression: A Second Course in Statistics. Mass.: Addison-Wesley;
1977.
[35] Hansen LK, Salamon P. Neural network ensembles. IEEE Transactions on Pattern Analysis & Machine
Intelligence. 1990; 12(10): 993-1001.
[36] Specht DF. A general regression neural network. IEEE Transactions on Neural Networks. 1991; 2(6): 568-576.
[37] Quiñonero-Candela J, Rasmussen CE. A unifying view of sparse approximate Gaussian process regression. Journal
of Machine Learning Research. 2005; 6: 1939-1959.
[38] Rasmussen CE. Gaussian processes in machine learning. Summer School on Machine Learning. 2003; 3176: 63-71.
[39] Cichocki A, Unbehauen R, Swiniarski RW. Neural Networks for Optimization and Signal Processing. New York:
John Wiley & Sons, Inc.; 1993.
[40] Ye W, Chen C, Wang Z, Chu I-H, Ong SP. Deep neural networks for accurate predictions of crystal stability. Nature
communications. 2018; 9(1): 1-6.
[41] Latypov MI, Kühbach M, Beyerlein IJ, Stinville J-C, Toth LS, Pollock TM, et al. Application of chord length
distributions and principal component analysis for quantification and representation of diverse polycrystalline
microstructures. Materials Characterization. 2018; 145: 671-685.
Volume 1 Issue 1|2021| 11 Materials Genome EngineeringYou can also read