Studies in Applied Finance - INVESTMENT THESIS FOR ACTIVISION BLIZZARD, INC. (NASDAQ: ATVI) - JScholarship
←
→
Page content transcription
If your browser does not render page correctly, please read the page content below
SAF/No.16/April 2017

              Studies in Applied Finance

              INVESTMENT THESIS FOR
             ACTIVISION BLIZZARD, INC.
                  (NASDAQ: ATVI)

                                        Andrew Ravan

  Johns Hopkins Institute for Applied Economics,
Global Health, and the Study of Business Enterprise
Investment Thesis for Activision Blizzard, Inc. (NASDAQ: ATVI) by Andrew Ravan

         Investment Thesis for Activision Blizzard, Inc. (NASDAQ: ATVI)
                                          By Andrew Ravan
Disclaimer: These research reports are primarily student reports for academic purposes and are not
specific recommendations to buy or sell a stock. Potential investors should consult a qualified investment
advisor before making any investment. This study was completed in December 2016.

                                           About the Series
The Studies in Applied Finance series is under the general direction of Professor Steve H. Hanke, Co-
Director of the Johns Hopkins Institute for Applied Economics, Global Health, and the Study of Business
Enterprise (hanke@jhu.edu) and Dr. Hesam Motlagh (hesamnmotlagh@gmail.com), a Fellow at the
Johns Hopkins Institute for Applied Economics, Global Health, and Study of Business Enterprise.

This working paper is one in a series on applied financial economics, which focuses on company
valuations. The authors are mainly students at the Johns Hopkins University in Baltimore who have
conducted their work at the Institute as undergraduate and graduate researchers.

                                          About the Author
Andrew Ravan (aravan1@jhu.edu) is a sophomore at The Johns Hopkins University. He conducted the
research for this paper while serving as Prof. Hanke’s research assistant at The Johns Hopkins Institute of
Applied Economics, Global Health, and the Study of Business Enterprise during the Fall of 2016. Andrew
is graduating in May 2019 with a major in Economics.

                                               Summary
This working paper is an in-depth analysis Activision Blizzard, Inc. Our analysis examines the factors that
impact ATVI’s underlying business. This economic analysis is then combined with our unique Probabilistic
Discounted Cash Flow (P-DCF) model to determine ATVI’s financial position. The P-DCF model will be
presented along-side Monte-Carlo simulations to reveal the distribution of probable free cash flows and
the likelihood of future earnings. We also studied the proxy report to examine the compensation
practices of ATVI and determine whether they are well-aligned with shareholder interests. Our objective
is for readers to understand ATVI’s business plan and financial standing to construct a sound
investment decision.

                                         Acknowledgements
Many thanks to Prof. Steve H. Hanke and Dr. Hesam Motlagh for guidance and draft comments.
Additional thanks to Tal Boger and Ed Li for draft comments.

Keywords: Financial Modeling, Activision Blizzard, Inc. Discounted Cash Flow, Net Present Value,
Monte-Carlo Simulation, Investment Thesis, Management Compensation.

JEL codes: C63, G11

                                                                                                         1
Investment Thesis for Activision Blizzard, Inc. (NASDAQ: ATVI) by Andrew Ravan
Rating: BUY - Average Free Cash Flow per Share: $43.63
Company Name: Activision Blizzard, Inc.
NASDAQ Symbol: ATVI
Contributors: Andrew Ravan
Date: 12/1/16
Fiscal year ends (current period): Dec. 31, 2016
Current Price: $35.58
52 week high: $45.55
52 week low: $26.49
Market Cap: $26.54B
Enterprise Value: $28.87B
Total Debt: $6.36B
Cash: $4.029B
Net Debt/Enterprise Value 14.00%
Dividend $0.26
Diluted Shares Outstanding: 743.2M
Current P/E 31.71
2018 P/E (EPS) 18.17 (2.44)
2017 P/E (EPS) 20.38 (2.17)
2016 P/E (EPS) 22.29 (1.99)
2015 EPS 1.19
2014 EPS 1.13
2013 EPS 0.95
1Investment Thesis for Activision Blizzard, Inc. (NASDAQ: ATVI) by Andrew Ravan
Table of Contents
EXECUTIVE SUMMARY ................................................................................................................. 3
CATALYSTS AND RISKS .............................................................................................................. 3
COMPANY DESCRIPTION AND HISTORICAL PERFORMANCE.................................................... 3
BUSINESS SEGMENTS ................................................................................................................ 4
HISTORICAL PERFORMANCE ...................................................................................................... 6
.................................................................................................................................................... 14
MODEL ASSUMPTIONS .............................................................................................................. 14
BALANCE SHEET AND INCOME STATEMENT TRENDS ............................................................ 15
VALUE DRIVERS TAB ................................................................................................................. 16
MODEL RESULTS ....................................................................................................................... 16
MANAGEMENT COMPENSATION .............................................................................................. 17
BASE SALARY ............................................................................................................................ 18
ANNUAL CASH INCENTIVES (CASH BONUSES)................................................................................ 18
EQUITY AWARDS ........................................................................................................................ 19
STOCK OWNERSHIP GUIDELINES ................................................................................................. 19
MULTIPLES ................................................................................................................................. 21
HOLDERS AND INSIDER TRADING ............................................................................................ 24
CORPORATE ACTIONS .............................................................................................................. 26
CONCLUSIONS .......................................................................................................................... 29
APPENDIX ................................................................................................................................... 30
2Investment Thesis for Activision Blizzard, Inc. (NASDAQ: ATVI) by Andrew Ravan
Executive Summary
Activision Blizzard, Inc. (NASDAQ: ATVI, herein referred to as “ATVI” or the “Company”) is
a leading global developer and publisher of interactive entertainment. The company
currently offers games for video game consoles, personal computers (PC), and handheld
(mobile and tablet) devices. ATVI maintains significant operations in the United States,
Canada, the United Kingdom, France, Germany, Ireland, Italy, Sweden, Spain, the
Netherlands, Australia, South Korea, and China. Based on historical averages and recent
statements from ATVI’s management, our Proprietary Discounted Cash Flow (P-DCF)
model in conjunction with Monte Carlo simulations reveal that ATVI’s probable free cash
flow generation, on a per-share basis, is $43.63. Our model takes into account the
historical trends in Activision Blizzard’s value drivers, such as cost of sales, product
development, sales and marketing, and general and administrative costs. Additionally,
ATVI’s revenue guidance for 2016 is $6.13 billion, a 31% year-over-year increase. As of
December 1, 2016 ATVI shares are trading at $35.58, at a 22.63% discount compared to
our model estimates. Historical performance and expectations of booming growth in the
video gaming industry reassure us that we can expect future appreciation in the
Company’s stock price. Management’s ability to allocate capital to effectively drive
shareholder return – particularly through their acquisition of King Digital Entertainment, PLC
– is reflective of The Company’s continuing potential. Considering ATVI’s strong business
model, competitive advantages, and the company’s per-share price discount, relative to
our P-DCF model, we consider the security to be an exceptional investment opportunity.
Therefore, we are rating ATVI a BUY.
Catalysts and Risks
- P-DCF model shows that there is currently a significant margin of safety on the ATVI
security
- Overreaction by investors to management’s revised-down Q4 2016 earnings is not
reflective of the Company’s solid business model and performance
- ATVI’s stock price is highly sensitive to their quarterly earnings and revenue
performance, as seen by the dip and spike in the security price for the first and
second quarters respectively
- Growth play: global video game industry expected to grow at 4.8% compounded
annual growth rate (CAGR), to reach $90 billion by 2020
- General macroeconomic slowdown, and/or market downturn, could have
drastically negative effects on ATVI’s stock price
Company Description
ATVI is one of the largest gaming and entertainment companies in the world. The current
Company structure was founded in 2008 when Vivendi Games and Activision merged.
ATVI includes five business units: Activision Publishing, Blizzard Entertainment, Major
League Gaming, Activision Blizzard Studios, and King Digital Entertainment. The
Company’s three main units are Activision Publishing Inc. (herein referred to as Activision),
3Investment Thesis for Activision Blizzard, Inc. (NASDAQ: ATVI) by Andrew Ravan
Blizzard Entertainment Inc. (herein referred to as Blizzard), and King Digital Entertainment
PLC (herein referred to as King).
Through its Activision segment, ATVI is a leading international developer and publisher of
interactive software products and content. Activision develops, markets and sells products
through their retail channels or digital downloads, which are principally based on internally
developed intellectual properties, as well as some licensed properties. Call of Duty is one
of Activision’s leading franchises, which launched in 2003, and has been the best-selling
Western interactive franchise since its launch.
Blizzard is a leader in online PC gaming, including the subscription-based massively multi-
player online role-playing game (MMORPG) category in terms of subscriber base and
revenues generated through its World of Warcraft franchise. Blizzard generates revenues
worldwide through the following means: subscriptions; sales of prepaid subscription cards;
in-game purchases and services; retail sales of “boxed” products; online download of
sales of PC products; purchases and downloads via third-party console; mobile and tablet
platforms; and licensing of software to third-party companies that distribute Blizzard
products.
King created interactive entertainment for the mobile world. This unit has over 200 titles,
including Candy Crush, Farm Heroes, and Pet Rescue. ATVI acquired King in 2016 for
$5.9 billion.
ATVI is headquartered in Santa Monica, CA and generated over $4.6 billion in sales in
2015. The Company is traded on the NASDAQ, and falls into the ‘Computer and Video
Games Interactive Entertainment’ industry. The Company joined the Standard & Poor’s
500 index during Q3 of 2015, becoming only the second video game company to be part
of the index (Electronic Arts being the first).
Business Segments
ATVI frequently realigns their business segments. Most recently, The Company has divided
their business into the following four operating segments:
- Console
o Products that fall in this business segment operate on the PS4, PS3, Xbox
One, Xbox 360, Wii U, and Wii console systems
o Call of Duty: Black Ops III was the #1 best-selling console game in 2015
o The ‘Console’ business segment has consistently accounted for
approximately 50% of ATVI’s revenue since 2008
- Online
o ATVI is a leader in online PC gaming, through its subscription-based
massively multi-player online role-playing game ("MMORPG") category in its
World of Warcraft® franchise
4Investment Thesis for Activision Blizzard, Inc. (NASDAQ: ATVI) by Andrew Ravan
o Revenues from ATVI’s ‘Online’ segment are generated from: World of
Warcraft® products
o Revenues include subscriptions, boxed products, expansion packs,
licensing royalties, and value-added services
o Skylanders SuperChargers® includes online multiplayer gameplay
o Destiny® is an online universe of first-person action gameplay
o The margin on total revenue for the ‘Online’ business segment has
consistently decreased from approximately 38% in 2008 to 18% in 2015
- PC & Other
o World of Warcraft is the #1 PC franchise by lifetime revenues
o Diablo III® was released for the PC in China in 2015
o Net revenues from PC increased in 2015, YoY, due to higher revenues from
Hearthstone: Heroes of Warcraft® and Heroes of the Storm®
o The margin on total revenue for the ‘PC & Other’ business segment has
consistently increased from approximately 3% in 2008 to approximately 22%
in 2015
- Mobile & Ancillary
o This segment includes revenues generated from: handheld, mobile and
tablet devices; non-platform specific game-related revenues such as
standalone sales of toys and accessories products from ATVI’s Skylanders®
franchise
o The acquisition of King Digital Entertainment PLC was targeted at increasing
revenues for this business segment
o The margin on total revenue for the ‘Mobile & Ancillary” segment has
consistently decreased from approximately 15% in 2008 to approximately
9% in 2015
5Investment Thesis for Activision Blizzard, Inc. (NASDAQ: ATVI) by Andrew Ravan
Historical Performance
Over the last 8 years, ATVI has grown their revenue at a 5.63% compound annual growth
rate (CAGR) (Table 1).
Table 1: ATVI’s 8 Year Revenue Breakdown (Source: Company Filings, SEC 10-K)
Year 2008 2009 2010 2011 2012 2013 2014 2015
Revenue by Segment
Console $1,294 $2,199 $2,330 $2,439 $2,186 $2,379 $2,150 $2,391
Revenue Growth Rate (%) 41.16% 5.62% 4.47% -11.57% 8.11% -10.65% 10.08%
Margin on Total Revenue (%) 43.00% 51.40% 52.39% 51.29% 45.02% 51.91% 48.77% 51.27%
Online $1,152 $1,248 $1,230 $1,357 $986 $912 $867 $851
Revenue Growth Rate (%) 7.69% -1.46% 9.36% -37.63% -8.11% -5.19% -1.88%
Margin on Total Revenue (%) 38.29% 29.17% 27.66% 28.54% 20.30% 19.90% 19.67% 18.25%
PC & other $99 $164 $325 $374 $1,214 $663 $958 $1,004
-
Revenue Growth Rate (%) 39.63% 49.54% 13.10% 69.19% 83.11% 30.79% 4.58%
Margin on Total Revenue (%) 3.29% 3.83% 7.31% 7.87% 25.00% 14.47% 21.73% 21.53%
Mobile & ancillary $464 $667 $562 $585 $470 $629 $433 $418
Revenue Growth Rate (%) 30.43% 18.68% 3.93% -24.47% 25.28% -45.27% -3.59%
Margin on Total Revenue (%) 15.42% 15.59% 12.64% 12.30% 9.68% 13.72% 9.82% 8.96%
Total Revenue $3,009 $4,278 $4,447 $4,755 $4,856 $4,583 $4,408 $4,664
Revenue Growth Rate (%) 42.17% 3.95% 6.93% 2.12% -5.62% -3.82% 5.81%
6Investment Thesis for Activision Blizzard, Inc. (NASDAQ: ATVI) by Andrew Ravan
ATVI's Efficiency: Long-Term Asset Turns (LAT) and
Useful Life
Long-term Asset Turns (LAT) 0.70 140.00
0.61 124.88
0.60 0.60 0.59 120.00
Useful Life (years)
0.55 0.54
0.50 0.51 100.00
90.01
0.40 0.39 80.00
71.95
0.33 66.05
0.30 60.00
53.36
0.20 40.51 40.00
0.10 23.91 24.24 20.00
- -
2008 2009 2010 2011 2012 2013 2014 2015
Long-Term Asset Turnover Useful Life
Figure 1: ATVI’s Long-Term Asset Turns (Blue) & Useful Life (Orange)
Long-term asset turns indicate a company’s efficiency: namely, the Company’s ability to
generate revenue from a given amount of assets. In general, a higher long-term asset
turnover ratio indicates that a company has more effectively utilized their assets to generate
revenue.
LAT = Revenue/Long-term assets
Useful Life = Long-term assets/D&A
Source: ATVI’s SEC 10-K filings
We calculated ATVI’s Long-Term Asset Turns and Useful Life in order to analyze The
Company’s efficiency in generating revenue from their assets. After hitting its peak in 2012,
ATVI’s Long-Term Asset Turns have been decreasing for the past 4 years (Figure 1). The
drop in LAT from 2012 to 2013, and again from 2013 to 2014, can be explained by ATVI’s
negative total revenue growth in 2013 and 2014. The more drastic drop in LAT from 2014
to 2015 can be explained by the fact that ATVI’s “Cash in escrow” increased by $3.56
billion in 2015, causing The Company’s total long-term assets to spike. According to
ATVI’s 2015 10-K annual report, the $3.56 billion “Cash in escrow” was tied to the
acquisition of King Digital Entertainment Plc.
7Investment Thesis for Activision Blizzard, Inc. (NASDAQ: ATVI) by Andrew Ravan
Figure 2: ATVI’s Revenue (White) & EPS (Green)
The spikes and dips of the Company’s revenue and earnings per share indicate the cyclicality
of ATVI’s business. The spikes generally occur during Q4, as the holiday season brings in
higher revenues for ATVI.
Source: Bloomberg Terminal. Command: . Accessed 12/1/2016
Figure 2 gives us insight into ATVI’s cyclicality, and where their business model allows
them to generate huge revenue numbers: holiday video game gifts. It is clear that sales
during the holiday season determine a significant portion of the overall business sales for
each year. Thus, it comes as no surprise that the stock may appreciate or depreciate
significantly from quarterly earnings which may glean insight into the overall health of the
video game market. Despite these fluctuations, it is clear that ATVI has demonstrably out-
performed the market.
8Investment Thesis for Activision Blizzard, Inc. (NASDAQ: ATVI) by Andrew Ravan
Figure 3: 5 Year Historical Stock Performance
ATVI’s 5 Year Historical Line Chart (White) vs. SPX Index (Green), including ATVI’s quarterly
earnings performances.
Source: Bloomberg Terminal. Command: . Accessed 12/1/2016
This can be appreciated by inspection of Figure 3. Since 2011, ATVI has rewarded its
shareholders sizably, to the tune of an approximate 200% total return. This growth
produced approximately 2.7 times the returns of the Standard and Poor’s 500 (75%), and
outpaced the NASDAQ’s growth (101%) by approximately two-fold. Despite this out-
performance over a five-year period, the stock has recently pulled back over 20% due to
fears of weak Call of Duty: Infinite Warfare sales during the holiday season.
9Investment Thesis for Activision Blizzard, Inc. (NASDAQ: ATVI) by Andrew Ravan
Figure 4: 1 Year Historical Stock Performance
ATVI’s 1 Year Historical Line Chart (White) vs. SPX Index (Green).
Source: Bloomberg Terminal. Command: . Accessed 12/1/2016
Specifically, this sell off seems to have started around approximately October 24, 2016
This sell-off is also due to management’s decision to revise down on The Company’s Q4
earnings estimates. Q4 is historically ATVI’s strongest quarter – the holiday season brings
in huge sales, as video games are bought on a large scale. This fact may explain the
reaction to management’ decision to revise down on their final quarter’s earnings
estimates (down to $0.05 per share). As we can see on the 1-year stock chart above
(Figure 4), ATVI’s price and return profile has diverged from the S&P Index’s upward trend
since this news hit the markets. This news, and subsequent stock price drop, has
catalyzed the gap in the security’s currently traded price and our target price, acquired
from our proprietary P-DCF.
10Investment Thesis for Activision Blizzard, Inc. (NASDAQ: ATVI) by Andrew Ravan
Figure 5: ATVI WACC
This figure details the Company’s capital structure: the percent of ATVI owned by equity-
holders versus deb- holders. ‘WACC’ stands for Weighted Average Cost of Capital.
Source: Bloomberg Terminal. Command: . Accessed 12/2/2016
We can analyze The Company’s fundamental health – by delving into ATVI’s capital
structure and publically traded debt. This will yield us useful information; specifically, is the
recent sell-off driven mostly by sentiment or fundamentals? 16.2% of the Company is
owned by debt-holders, while the remaining 83.8% is owned by equity-holders. More
specifically, 12.4% of the capital structure is from Long-Term debt (Figure 5). This yields a
gearing ratio (a ratio of a company’s long-term debt to equity) of 0.19. Despite the fact that
ATVI’s 16.2% debt structure is relatively high compared to competitors – such as
Electronic Arts Inc.’s 3.7% debt – The Company has proven their ability to use debt
successfully and responsibly. As aforementioned, and as will be further discussed in this
paper, ATVI’s use of debt to re-purchase stock from Vivendi and to acquire King have
proven to be strategically brilliant moves. ATVI has continued to grow its market
capitalization and has seen an appreciation in their stock price. The 16.2% debt structure
should not be a point of concern for investors, as ATVI’s management have proven their
ability to allocate capital optimally in their efforts to drive shareholder return.
11Investment Thesis for Activision Blizzard, Inc. (NASDAQ: ATVI) by Andrew Ravan
Figure 6: ATVI Bond Details
Moody’s Investors Service rates ATVI’s debt as Baa2, while Standard & Poor’s rates the
Company’s debt as BBB-. The Company’s 6.125 coupon has a yield of 2.445, and matures in
September of 2023.
Source: Bloomberg Terminal. Command: à . Accessed 12/2/2016
Moody’s and S&P’s ratings of ATVI’s debt as Baa2 and BBB-, respectively, indicate that
both ratings agencies view the Company’s debt as investment-grade (Figure 6). Under
ATVI’s ‘Issuance & Trading’ information, we see that the bond’s amount issues are equal
to the amount outstanding, indicating that this specific bond is fairly liquid. Given that
investors in the bond market are incredibly critical in their analysis of company debt, and
fully scrutinize a company’s debt before investing, potential ATVI shareholders should take
comfort in these ratings and metrics. The company’s debt ratings and bond analysis can
serve as a litmus test before deciding whether or not to purchase a company’s debt; ATVI
passes this litmus test.
12Investment Thesis for Activision Blizzard, Inc. (NASDAQ: ATVI) by Andrew Ravan
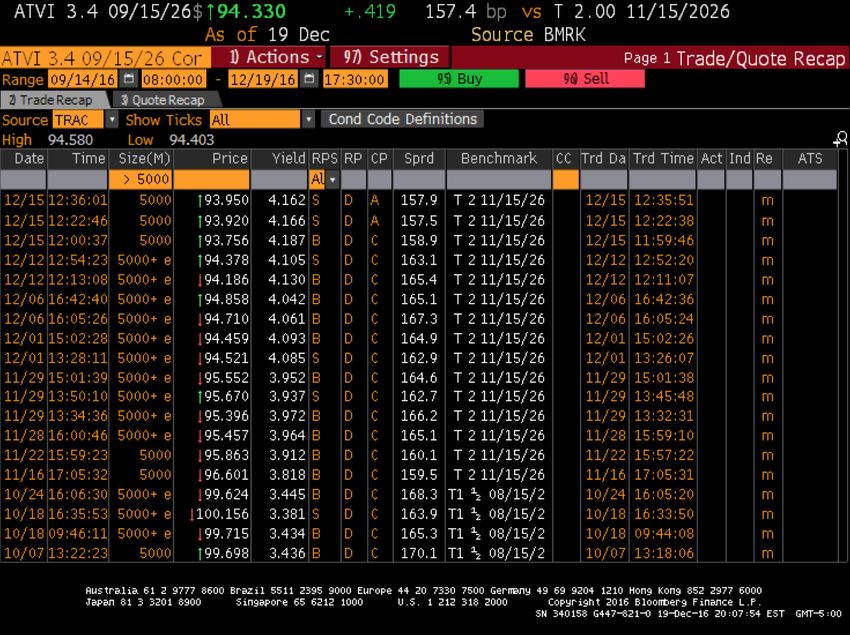
Figure 7: ATVI Bond Trading Price
ATVI’s bond trades – in quantities over 5,000 – and their prices from September through
December of 2016.
Source: Bloomberg Terminal. Command: . Accessed 12/19/2016
Over the past three months, ATVI’s bond price has decreased from approximately $100 to
approximately $94 (Figure 7). The bond’s yield has increased from 3.436% to 4.162% in
the same period of time. This decrease in the bond price is correlated to the drop in ATVI’s
stock price over the past several months. As such, this drop in bond price does not seem
to speak to the quality of the underlying debt in the Company’s bond. A Quick Yield
Analysis confirms ATVI’s bond health. The current yield is 3.619%, whereas the bond’s
yield is 4.162% - a far cry from what we would expect for a distressed debt issuance from
a company.
13Investment Thesis for Activision Blizzard, Inc. (NASDAQ: ATVI) by Andrew Ravan
Figure 8: Analyst Recommendations for ATVI
Eighty-three percent of analysts rate the ATVI stock a BUY, while the remaining 17% of
analysts rate the security a HOLD. We built a Proprietary Discounted Cash Flow (P-DCF)
model, as detailed below, to determine if our position of BUY is supported by the quantitative
analysis of the security.
Source: Bloomberg Terminal. Command: . Accessed 12/1/2016
Additionally, as can be seen in Figure 8, the vast majority of analysts are bullish on the
ATVI security lending credence to the health of the overall business. Analysts have been
bullish on the Company’s stock for months – even before a recent price decline, which
makes the stock look particularly attractive at the moment. We will now delve into our
model, and its underlying assumptions, to determine if we agree with these analysts and
their “BUY” rating.
Model Assumptions
We use the P-DCF model to determine if the security under analysis is undervalued,
overvalued, or fairly valued. Given the recent sell-off of ATVI that seems sentiment driven
(as per the previous bond analysis), it will be important to determine the fundamental value
distribution of ATVI and whether or not this represents a buying opportunity. At the root of
this endeavor is the idea that the market is a voting machine, not a weighing machine. This
idea, coined by Benjamin Graham, describes the biggest underlying assumption about this
model: securities may be mispriced by market participants.
14Investment Thesis for Activision Blizzard, Inc. (NASDAQ: ATVI) by Andrew Ravan
The P-DCF model typically uses historical averages for revenue growth, cost structure,
working capital, and Capital Expenditures (CAPEX). However, given the historical trends,
management guidance, and the nature of ATVI as a technology stock, we have altered a
majority of our assumptions in order to better tailor the revenue, value drivers and cash
flow drivers’ growth rates to the Company. Historical long-term asset turns (LAT:
Revenue/Long-term assets) are also used to gauge whether our assumptions are too
aggressive or conservative.
For Console and Personal Computer (PC) revenue, for the 2016 fiscal year, we assumed
that ATVI would grow their revenue by 30%, year-over-year (YoY). Meanwhile, we
assumed that the Company’s Online and Mobile & Ancillary segments would see a 5%
increase in revenue growth. We assumed these percentages, which give ATVI a 21.37%
revenue growth from 2015 to 2016, because management’s guidance expects to reach
$6.13 billion in revenue by 2016. Given our assumptions, ATVI will reach $5.62 billion in
revenue by 2016, which is relatively conservative. Given that the 30% growth assumption
for ATVI’s console and PC segments is unsustainable, we decreased the growth rates for
both segments so that they would plateau at 10% from 2021 through 2025.
We grew revenue aggressively for the first few years of our projections, and then
attenuated the growth to represents market saturation, the presence of competitors, and
to create a conservative tapering-off effect. The decision to treat our assumptions in such
a manner helped us keep our total revenue CAGR at a relatively conservative level.
The cost structure is another major area where assumptions play an important role. For
Cost of Sales, we assumed 35% of sales. Despite the historical average of 37.1%, we
assumed 35% because of the steadily declining margin over the last 8 years. Similarly, we
set General and Administrative costs at 7% of revenue, despite the 10% historical average,
because of the downward trend. On the other hand, we set Sales and Marketing costs at
14% of revenue, slightly above he 13.7% average, because of an upward trend in the cost
as a percent of revenue.
We set Change in Working Capital to zero, despite the -4% historical average. We felt that
keeping -4% for Change in Working Capital was too aggressive and unrealistic of an
assumption to make when modeling out ATVI into perpetuity. Moreover, we assumed that
Capital Expenditures would equal Depreciation and Amortization, at 2.4% of revenue, into
the future.
Balance Sheet and Income Statement Trends
These results are contained in the ‘Balance Sheet’ and ‘Income Statement’ tabs of the accompanying spreadsheet.
ATVI’s “cash and cash equivalents” line on the Balance Sheet drops drastically in 2015,
and as a result, the Company’s “cash in escrow” line spikes for the equivalent amount.
This shift in cash on the Balance Sheet is attributed to ATVI’s acquisition of King Digital
Entertainment Plc.
15Investment Thesis for Activision Blizzard, Inc. (NASDAQ: ATVI) by Andrew Ravan
The Company’s Long-term debt spiked to approximately $4.6 billion in 2013, from 0 in
2012. This is due to ATVI’s acquisition of approximately 429 million ATVI shares and
certain tax attributes from Vivendi (Euronext Paris: VIV).
ATVI’s Income Statement is generally straightforward, and lacks any huge changes, year-
over-year. One of the most important trends to pay attention to is the YoY change in
Product Sales versus the YoY change in Subscription, Licensing, and Other Revenues.
ATVI’s revenue from Product Sales has been consistently decreasing since 2011, while
their revenue from Subscription, Licensing, and Other Revenues has been steadily
increasing since 2011.
Value Drivers Tab
These results are contained in the ‘Value Drivers’ tabs of the accompanying spreadsheet.
In order to accurately forecast ATVI’s future free cash flow, we must understand the
Company’s historical performance. Therefore, we determined the Company’s historical
margins and value drivers. ATVI has above a 5% standard deviation for its revenue growth
rate, which makes it difficult to predict the Company’s revenue growth rate for any
particular year. Additionally, the Company has a historical average Change in Working
Capital of -4%, with a standard deviation of 4.75%. Lastly, ATVI’s standard deviation on its
yearly Capital Expenditures margin (as a percent of revenue) is approximately 40%,
meaning this line item fluctuates wildly, and is extremely difficult to predict. The historical
average for CAPEX margin is approximately 24%. ATVI’s CAPEX is relatively high for a
number of reasons. First of all, our P-DCF model defines CAPEX as:
CAPEX = (Long-term Assets)t – (Long-term Assets)t-1 + (D&A)t.
Moreover, the Company’s long-term assets have increased due to their acquisitions. As a
result, ATVI’s historical CAPEX averages may not be the most reliable input parameters
into our model. However, the CAPEX averages reflect the Company’s willingness to make
large acquisitions, which have historically ameliorated ATVI’s revenue generation.
Model Results
After carefully examining ATVI’s historical performance, trends in revenue growth, patterns
in cost margins (on revenue), and management’s guidance, we inputted our precisely
calibrated assumptions into our model. Our P-DCF model yields a probable free cash flow
of $43.36 per share of ATVI. This means that ATVI is currently trading at a 22.63%
discount at $35.58 (as of this writing, 12/1/16 – Figure 9). Considering that ATVI is a
growing technology company, we found it appropriate to incorporate moderate-to-
aggressive revenue growth assumptions in our model. Given these revenue assumptions,
and other cost assumptions grounded in historical trends, our per-share target price is
significantly above ATVI’s current per-share price.
16Investment Thesis for Activision Blizzard, Inc. (NASDAQ: ATVI) by Andrew Ravan
Figure 9: ATVI Estimated Discounted FCF per Share
This distribution was derived from running 100,000 Monte-Carlo simulations of ATVI’s
proprietary P-DCF model. The Y-axis represents probability, while the X-axis represents the
range of probable free cash flows, on a per share basis. The probable free cash flows range
from approximately -$100 per share, to $180 per share. The pink range of free cash flows
indicate the potential stock prices below ATVI’s currently trading stock price. The blue range
represents the potential stock prices above the security’s current per share price.
Source: Monte-Carlo Simulation, Crystal Ball.
Furthermore, our Monte Carlo simulation shows that the target stock price projected by
our P-DCF model falls in the mid-50th percentiles of the estimated FCF/share distribution,
while the current price sits in the 40th percentiles. This Monte Carlo simulation tells us that
a slightly higher stock price (as represented by discounted free cash flows, per share) is
more likely to occur for the Company than its current stock price. In other words, at
$35.58/share, the security is most likely trading at a discount to its intrinsic value.
The wide distribution on the Monte Carlo simulation above, from -$90 to $180 per share, is
reflective of the high standard deviations on ATVI’s historical revenue growth, Capital
Expenditures (margin on revenue), and Change in Working Capital. This is not uncommon
with a high-growth company such as ATVI and reflects the uncertainty in future forecasts.
However, to ensure that management is incentivized to create long-term shareholder
value, we inspected management compensation in the following section to assess
whether management has motive consistent with our investment thesis.
Management Compensation
These results are based on an in-depth analysis of the proxy statement: SEC Filing DEF-14A.
We dissected management’s compensation in order to determine if management is
incentivized to drive shareholder returns consistent with our investment thesis.
17Investment Thesis for Activision Blizzard, Inc. (NASDAQ: ATVI) by Andrew Ravan
Management compensation is an important indicator of a company’s direction, given that
management has the discretion to allocate capital. Thus, the analysis in this section helps
us determine whether or not the ATVI executive compensation package aligns
management’s interests with those of the shareholders.
Robert A. Kotick serves as the Company’s President and CEO. Prior to assuming his role
in ATVI, Mr. Kotick, age 53, served as CEO of Activision Inc. (1991-2008). Mr. Kotick also
sits on the board of directors of The Coca-Cola Company.
According to Activision Blizzard’s 2016 proxy statement, executive compensation is
divided into three segments, as follows:
1. Base Salary
2. Annual Cash Incentives (Cash Bonuses)
3. Equity Awards
Base Salary
Salary increases for Activision’s named executive officers ranged from 4% to 5% of
previous year’s base salaries during the 2015 annual review of executive base salaries.
The salary increased were based on individual performance and comparable competitive
market rates.
Annual Cash Incentives (Cash Bonuses)
In 2015, the named executives received 81% to 108% of their performance-based cash
incentives goals, under Activision’s Corporate Annual Incentive Plan (CAIP). 60% of
executive’s target opportunity under the CAIP is weighted base on the following financial
measures:
- Adjusted non-GAAP operating income
- Non-GAAP diluted earnings per share
- And/or adjusted non-GAAP free cash flow
The remaining 40% of the target opportunity was based on specific and measurable
individual performance measures that ATVI’s Compensation Committee believes
supported the Company’s overall strategy.
If Activision’s adjusted non-GAAP operating income does not reach 85% or more of the
adjusted non-GAAP operating income target for the year, the Company’s Compensation
Committee reduced or eliminates all bonuses under the CAIP.
The compensation committee establishes limits on the payment made under the CAIP for
“overachievement,” capping payments in respect of individual performance measures at
120% of target, and payments in respect of financial performance measures at 150% to
200% of target.
18Investment Thesis for Activision Blizzard, Inc. (NASDAQ: ATVI) by Andrew Ravan
Table 2: Reconciliation of GAAP Operating Income to Non-GAAP Measures
This table details the changes in ATVI’s accounting measures for operating income, from GAAP to non-GAAP.
Source: ATVI’s SEC 10-K filings
Equity Awards
Named executive officers do not generally receive annual equity awards. No named
executive officer received an equity award during 2015.
However, equity awards made in connection with a new or amended employment
agreement with an executive officer should include an award with performance-based
vesting criteria. Certain restricted share unit awards made Messrs. Kotick, Durkin, Tippl
and Hirshberg during or prior to 2015 have vesting that is contingent on the achievement
of specified profitability-focused performance objectives.
The Compensation Committee chooses performance objectives that relate to measures of
overall Company performance. For the performance awards to Mr. Kotick, vesting is based
on non-GAAP diluted EPS, adjusted non-GAAP free cash flow and relative total
shareholder return. For Mr. Durkin, vesting is based on non-GAAP diluted EPS. For
Mr. Tippl, vesting is based on non-GAAP diluted EPS, adjusted non-GAAP free cash flow
and Blizzard Entertainment’s adjusted non-GAAP operating income. For Mr. Hirshberg,
vesting is based on Activision Publishing’s adjusted non-GAAP operating income.
Stock Ownership Guidelines
In 2012, Activision’s Compensation Committee adopted guidelines requiring the CEO to
own shares of common stock with a value at least equal to three times his/her annual base
salary, and requiring each other executive officer to own common stock with a value at
least equal to his/her annual base salary. The executive officers must accumulate said
amount of stock within five years.
19Investment Thesis for Activision Blizzard, Inc. (NASDAQ: ATVI) by Andrew Ravan
Table 5: Peer Company Compensation Reference
20Investment Thesis for Activision Blizzard, Inc. (NASDAQ: ATVI) by Andrew Ravan
Multiples
Figure 11: Price-to-Book Ratio, 2012 – 2016
The price-to-book ratio measures the value of a company’s assets relative to the company’s
stock price. The P:B ratio trend seen above has a tight correlation to ATVI’s five year historical
stock price.
Source: Bloomberg Terminal. Command: . Accessed 12/2/2016
As seen in the Figure 11 above, ATVI’s Price to Book Value (P/B) ratio spiked since the
start of 2016, reaching a P/B of approximately 3.84. According to this P/B ratio, the ATVI
stock was being valued at approximately $68 on a per-share basis. Given that 3.84 is the
highest P/B ratio that ATVI had seen in the past 8 years, this figure may indicate that the
Company’s shares were being overvalued, according to the 8-year historical average.
However, since that peak, the Company’s P/B ratio has dropped significantly, to
approximately 3.01 (at the time of this writing, 12/1/2016).
21Investment Thesis for Activision Blizzard, Inc. (NASDAQ: ATVI) by Andrew Ravan
Figure 12: ATVI Revenue & EPS, 2012 – 2017
This figure displays ATVI’s revenue and earnings per share, on a quarterly basis. The
Company’s revenue generated in their main geographic segments – North America, Europe,
and Asia Pacific – are also broken down.
Source: Bloomberg Terminal. Command: . Accessed 12/1/2016
As can be seen in Figure 12 above, ATVI’s revenue and earnings per share (EPS) have
been somewhat inconsistent since 2012 (and, as can be seen in the accompanying excel
model’s historical revenue, has a high standard deviation over the past 8 years). On a
quarterly basis, there is a clear trend: Q4 revenue and EPS are significantly higher than any
other quarter, as ATVI sells the most products during the holiday season. ATVI is expected
to generate solid revenue and EPS for 2016, and continue their growth into 2017.
22Investment Thesis for Activision Blizzard, Inc. (NASDAQ: ATVI) by Andrew Ravan
Figure 13: Price-to-Earnings Ratio, 2012 – 2016
The price-to-earnings ratio measures a company’s stock price, relative to earnings on a per-
share basis. This is one of the most common ratios used to determine a stock’s weight,
relative to competitors, the industry average, and/or the entire market.
Source: Bloomberg Terminal. Command: . Accessed 12/2/2016
ATVI’s P/E ratio spiked from approximately 30 to 40, from Q1 until Q3 of 2016. However,
since the start of the Company’s Q3, ATVI’s Price to Earnings ratio dropped to 31.7,
below the industry average of approximately 40. As aforementioned, this un-constituted
price drop is a great sign for potential investors, who now have the opportunity to
purchase the security at a temporary discount.
23Investment Thesis for Activision Blizzard, Inc. (NASDAQ: ATVI) by Andrew Ravan
Holders and Insider Trading
Figure 14: ATVI Institutional & Insider Shareholders
ATVI’s largest shareholders are sorted in order of stake in The Company. ATVI has 743.2
million shares outstanding. All investors displayed in Figure 13 are institutional shareholders.
Source: Bloomberg Terminal. Command: . Accessed 12/2/2016
Fidelity Investments (FMR LLC), BlackRock, and Vanguard Group have 14.96%, 6.91%,
and 5.69% stakes in ATVI, respectively. In September of 2016, Fidelity and Vanguard
acquired 5.86 and 9.01 million shares in the Company, respectively. BlackRock increased
their stake in ATVI by 2.95 million shares on December 1 of 2016. This recent acquisition is
a great sign for a potential ATVI shareholder, as it shows the confidence of an institutional
investor in the security, and its recent deviation from its fundamental value.
24Investment Thesis for Activision Blizzard, Inc. (NASDAQ: ATVI) by Andrew Ravan
Figure 15: Insider Transactions, Trailing Twelve Months
This figure displays ATVI’s open market buy and sell transactions projected onto The
Company’s trailing twelve-month stock chart. The red figures indicate an insider selling off
ATVI stock, while the green figures indicate a purchase of stock.
Source: Bloomberg Terminal. Command: . Accessed 12/2/2016
The largest sell-off in the past year took place in June of 2016, as Blizzard CEO sold 436
thousand shares of the ATVI security. More recently, in August of 2016, ATVI Director
Peter Nolan purchased 20,000 shares. Mr. Nolan is a senior advisor to Leonard Green
Partners, a private equity firm based in Los Angeles, CA.
25Investment Thesis for Activision Blizzard, Inc. (NASDAQ: ATVI) by Andrew Ravan
Corporate Actions
Figure 16: Effective Mergers & Acquisitions
This figure details ATVI’s effective mergers and acquisitions since December of 2008.
Source: Bloomberg Terminal. Command: . Accessed 12/2/2016
ATVI has had three effective acquisitions since 2008.
ATVI’s most recent and notable acquisition took place in February of 2016, when ATVI
sought and acquired 100% of King Digital Entertainment PLC (King). King is an interactive
entertainment company which produces and distributes digital games on multiple
platforms in the U.S., U.K., Germany, and other countries. King’s main games are the
Candy Crush Saga, Candy Crush Soda Saga, Farm Heroes Saga, Pet Rescue Saga, and
Bubble Witch 2 Saga. One of the Company’s main goals in acquiring King was to increase
revenue generation through ATVI’s ‘mobile and ancillary’ business segment. King’s
impressive success and revenue generation are a testament to ATVI’s management, and
their ability to strategically and successfully allocate capital.
In October of 2013, the Company sought and acquired 38.39% of ATVI shares from its
former parent, Vivendi SA. By the end of this acquisition, Vivendi SA was no longer the
parent company of ATVI.
26Investment Thesis for Activision Blizzard, Inc. (NASDAQ: ATVI) by Andrew Ravan
In January of 2016, ATVI sought and acquired 100% of MLG Legacy Holdings Inc. MLG
Legacy Holdings, Inc. is an eSports company, which operates: MLG.tv, an online
broadcast network for professional level competitive gaming; MLG Pro Circuit, an eSports
league in North America; and GameBattles, a platform online gaming tournament system
with users worldwide.
Figure 17: Effective Corporate Actions
ATVI’s loan pricing, amounts, rates and debt repayment are listed under the “Action Type.”
The summary of these effective actions are listen in the last column, under “Summary,” while
the dates of the actions are listed under the second column, titled “Effective.”
Source: Bloomberg Terminal. Command: . Accessed 12/2/2016
27Investment Thesis for Activision Blizzard, Inc. (NASDAQ: ATVI) by Andrew Ravan
Figure 18: Effective Cash Dividend Payouts
This figure lists ATVI’s effect cash dividends paid to shareholders, from March, 2011 through
March of 2016.
Source: Bloomberg Terminal. Command: . Accessed 12/2/2016
ATVI has been paying dividends since 2010. The Company has steadily and consistently
increased their dividends for all six years during which they have paid dividends. The cash
dividends have increased from 16 cents per share in 2010, to 26 cents per share in 2016.
Within each fiscal year, ATVI’s quarterly earnings per share (EPS) fluctuate significantly.
This is due to the cyclical nature of ATVI’s business, which sees a spike in sales during the
holiday season (typically December through January).
On a YoY basis, the consistency and reliability from the Company’s dividend payout
shows management’s top-tier ability to run ATVI smoothly, and to generate profits – year
after year.
28Investment Thesis for Activision Blizzard, Inc. (NASDAQ: ATVI) by Andrew Ravan
Conclusions
ATVI is an exceptionally managed company whose executives, particularly CEO Bobby
Kotick, are incentivized so that their interests are aligned with those of the shareholders.
We have confidence that the Company’s management will deploy capital to develop
products and services that continue to provide growth for the Company, and create higher
shareholder value. ATVI’s Call of Duty, Destiny, Candy Crush, etc. prove that the
Company’s human capital has the ability to produce top-tier products. The Company has
also positioned themselves well for the future, as they have created incredible market
dominance in eSports with their Major League Gaming (MLG) division reflecting
management’s ability to be forward thinking.
Considering the results obtained from our P-DCF in conjunction with our Monte Carlo
simulation, and our overall qualitative and quantitative analysis of the Company, we believe
that the market is currently undervaluing the ATVI security. We view this investment
opportunity as a play on a proven growth company, trading at a discounted price. Given
ATVI’s dislocation from its fundamental value (as defined by our P-DCF model), we rate
ATVI as a BUY.
29Investment Thesis for Activision Blizzard, Inc. (NASDAQ: ATVI) by Andrew Ravan
Appendix
Management’s high level of stock ownership has allowed them to run ATVI efficiently, while
driving shareholder return. Tables A1 and A2 display ATVI’s executive compensation, as
they relate to security ownership and non-equity payment. Furthermore, Figure 1A
illustrates management’s share buy-back program.
Table A1: Security Ownership of Officers & Directors (April 1, 2016)
This table details the the different equity ownership stakes in ATVI by The Company’s executives and directors.
CEO Bobby Kotick and Chairman of the Board Brian Kelly own 24.4% and 23.7% of shares outstanding,
respectively.
Source: ATVI’s SEC 10-K filings
Table A2: Executive Compensation Summary
ATVI’s top executives received an average of $6.6 million in compensation for the 2015 fiscal year. COO Thomas
Tippl received the highest compensation ($8.9 million), while CFO Dennis Durkin received the lowest ($1.9 million).
Source: ATVI’s SEC 10-K filings
30Investment Thesis for Activision Blizzard, Inc. (NASDAQ: ATVI) by Andrew Ravan
Figure A1: Shares Outstanding (orange) & Equity Float (blue), 2012 – 2016
There are currently 743 million shares of ATVI outstanding, while equity float is at 683 million
shares. In Q4 of 2013, The Company’s shares outstanding dropped from nearly 1.15 billion to
just above 700 million shares. This drop in shares outstanding was the result of a major share
buyback program, in which Activision bought a majority of shares from Vivendi (sending
Vivendi’s stake in the company from 61% to 12%).
Source: Bloomberg Terminal. Command: . Accessed 12/2/2016
31You can also read