LIBERTY GLOBAL PLC INVESTOR CALL | Q1 2020 - May 7th, 2020

 
CONTINUE READING
LIBERTY GLOBAL PLC INVESTOR CALL | Q1 2020 - May 7th, 2020
LIBERTY GLOBAL PLC
INVESTOR CALL | Q1 2020
         May 7th, 2020
LIBERTY GLOBAL PLC INVESTOR CALL | Q1 2020 - May 7th, 2020
“SAFE HARBOR”
                                                                                                                                   consummation of the Proposed Transaction; expected financing and recapitalization transactions undertaken in
  Forward-Looking Statements + Disclaimer                                                                                          connection with the Proposed Transaction and risks associated such transactions; any negative effects of the
  This presentation contains forward-looking statements within the meaning of the Private Securities Litigation Reform Act         announcement, pendency or consummation of the Proposed Transaction; the ability of our operating companies and
  of 1995. In this context, forward-looking statements often address expected future business and financial performance            affiliates to access cash of their respective subsidiaries; the impact of our operating companies' and affiliates’ future
  and financial condition, and often contain words such as “expect,” “anticipate,” “intend,” “plan,” “believe,” “seek,” “see,”     financial performance, or market conditions generally, on the availability, terms and deployment of capital; fluctuations in
  “will,” “would,” “may,” “target,” and similar expressions and variations or negatives of these words. These forward-             currency exchange and interest rates; the ability of suppliers, vendors and contractors to timely deliver quality products,
  looking statements may include, among other things, statements with respect to our strategies, future growth prospects           equipment, software, services and access; our and our affiliates’ ability to adequately forecast and plan future network
  and opportunities, results of operations, uses of cash, and other measures that may impact our financial performance;            requirements including the costs and benefits associated with network expansions; other factors detailed from time to
  expectations with respect to our rebased OCF decline, our rebased OFCF growth and our Adjusted FCF; our share                    time in our filings with the U.S. Securities and Exchange Commission; and management’s response to any of the
  buyback program; expectations with respect to cost reductions; anticipated headwinds in 2020; our medium-term                    aforementioned factors. For additional information on identifying factors that may cause actual results to vary materially
  outlook; expectations with respect to the development, launch and benefits of our innovative and advanced products               from those stated in forward-looking statements, please see our filings with the U.S. Securities and Exchange
  and services, including gigabit speeds, new technology and next generation platform rollouts or launches; the strength           Commission, including our most recently filed Form 10-Q. These forward-looking statements speak only as of the date
  of our balance sheet and tenor of our third-party debt; expectations with respect to our operations models; anticipated          of this release. We expressly disclaim any obligation or undertaking to disseminate any updates or revisions to any
  benefits and synergies and estimated costs of the proposed transaction with Telefonica S.A. (the “Proposed                       forward-looking statement contained herein to reflect any change in our expectations with regard thereto or any change
  Transaction”) to form a joint venture between the U.K. operations of Virgin Media and O2 (the “Joint Venture”) and/or            in events, conditions or circumstances on which any such statement is based.
  other transactions that may have closed prior to the date hereof; and the expected timing of completion of the Proposed
  Transaction; are not historical fact. These forward-looking statements involve certain risks and uncertainties that could
  cause actual results to differ materially from those expressed or implied by these statements. These risks and
  uncertainties include events that are outside of our control, such as the continued use by subscribers and potential
                                                                                                                                   Presentation of Continuing & Discontinuing Operations:
  subscribers of our and our affiliates’ services and their willingness to upgrade to our more advanced offerings; our and         On May 2, 2019, we sold our UPC DTH operations, which provide direct-to-home satellite services in Hungary, the
  our affiliates’ ability to meet challenges from competition, to manage rapid technological change or to maintain or              Czech Republic, Romania and Slovakia. On July 31, 2019, we sold our operations in Germany, Hungary, Romania and
  increase rates to subscribers or to pass through increased costs to subscribers; the effects of changes in laws or               the Czech Republic. Our operations in Germany, Hungary, Romania and the Czech Republic, along with our former
  regulation; the effects of the U.K.'s exit from the E.U.; general economic, legislative, political and regulatory factors, and   UPCDTH operations are collectively referred to herein as the “Discontinued Operations” and have all been accounted
  the impact of weather conditions, natural disasters, or any epidemic, pandemic or disease outbreak (including COVID-             for as discontinued operations for the three months ended March 31, 2019, in our March 31,2020 Form 10-Q.
  19); our and our affiliates’ ability to obtain regulatory approval and satisfy regulatory conditions associated with
  acquisitions and dispositions, including with respect to the Proposed Transaction; our and affiliates’ ability to
  successfully acquire and integrate new businesses and realize anticipated efficiencies from acquired businesses; the
                                                                                                                                   Additional Information Relating to Defined Terms:
  availability of attractive programming for our and our affiliates’ video services and the costs associated with such
                                                                                                                                   Please refer to the Appendix at the end of this presentation, as well as our press release dated February 13, 2020 and
  programming; our and our affiliates’ ability to achieve forecasted financial and operating targets; the outcome of any
                                                                                                                                   our SEC filings, for the definitions of the following terms which may be used herein, including: Rebased Growth,
  pending or threatened litigation, including any potential litigation that may be instituted with respect to the Proposed
                                                                                                                                   Operating Cash Flow (“OCF”), Adjusted Free Cash Flow (“FCF”), Operating Free Cash Flow (“OFCF”), Revenue
  Transaction or other material transactions; that the Proposed Transaction may not be completed on anticipated terms
                                                                                                                                   Generating Units (“RGUs”), Average Revenue per Unit (“ARPU”), as well as non-GAAP reconciliations, where
  and timing or completed at all; our and Telefonica S.A.’s respective affiliates’ ability to successfully integrate the
                                                                                                                                   applicable. .
  combined businesses of the Joint Venture and realize anticipated efficiencies and synergies from the Proposed
  Transaction; the potential impact of unforeseen liabilities, future capital expenditures, revenues, expenses, economic
  performance, indebtedness, financial condition on the future prospects and business of the Joint Venture after the

                                                                                                                                                                                                                                                             2
EXECUTIVE SUMMARY

FINANCIAL RESULTS

APPENDIX

                    3
RESPONSE TO COVID-19
             OUR FOCUS                               OPERATIONS                           OUTLOOK
   Protect Employees                         Solid Network Performance            Not changing or
   • Enabled home working                    • Absorbed increased bandwidth:      suspending guidance
                                                                                  today
   • Following all local safety guidelines     • >20% downstream increase
                                                                                  • Still assessing medium-term
   • $4m Employee Relief Fund                  • >50% upstream increase
                                                                                    impact
   Serve Customers                           Sales stable; churn reduced          • Encouraged by operating
   • Speed boosts and increased data         • Broadband sales steady               prospects

   • Additional entertainment                • Premium video impacted by Sports   • Expect to update investors at
                                                                                    Q2
   • Enhanced business support               • Mobile roaming down; handsets
                                               impacted by store closures
   Thoughtful Capital Allocation
   • Strong balance sheet                    Operating Model adapted
                                             • Insourced/repurposed FTEs
   • Investing in Lightning & Digital
     initiatives                             • Emphasizing online sales

                                                                                                                    4
Q1 2020 HIGHLIGHTS                                                                                       Q1 2020 (1)
1   Tackling COVID-19 head on                                                                                OPERATIONS         ACTUAL
                                                                                                                                           YOY
                                                                                                                                         GROWTH
          Focused on employee safety and well-being
                                                                                                          Customer Net Adds     (19k)     (17k)
          Keeping our customers connected and entertained
                                                                                                             Fixed Customer
          Anticipating modest operational and financial impact                                               Rebased ARPU      $59.59    +0.6%
                                                                                                                Fixed Mobile
2   Delivered solid Q1 results                                                                                 Convergence       23%      +2%
          Stable customer base with positive ARPU growth
                                                                                                                                           YOY
          Driving convergence and extending speed leadership with 1 Gig rollouts                             FINANCIALS         ACTUAL   GROWTH

          Swiss KPIs encouraging but financials remain under pressure                                      Rebased Revenue     $2.88bn   (0.3%)

3   Outlook & Capital Allocation                                                                              Rebased OCF      $1.15bn   (3.6%)
          Still assessing medium-term impact from COVID-19 on our financial                                   P&E Additions    $654m     $(44m)
          guidance; expect to update investors on our Q2 earnings call
          Repurchased ~$500 million of stock from February 24 to April 30                                    Rebased OFCF      $496m     (2.4%)

4   Powerhouse FMC combination in U.K.                                                                         Adjusted FCF    $(317m)

          Creation of 50:50 JV by merging Virgin Media & O2
          Fastest broadband network and largest mobile platform
          Attractive transaction multiples and substantial synergies
                                                                                                                                            5
    (1)   Please refer to the Appendix for definitions and non-GAAP reconciliations, where applicable.
VIRGIN MEDIA + O2: TRANSACTION SUMMARY (1)
                            DEAL SUMMARY                                                                                                                    LIBERTY GLOBAL BENEFITS
                              • 50:50 joint venture with Telefonica; equal governance;                                                                       • Clear convergence champion with the best fixed &
                                rotating Chairman; management agreed by closing                                                                                mobile networks, strong brands and significant scale (46
                              • Virgin Media valued at £18.7 billion TEV and                                                                                   million mobile and fixed subscribers)
                                transferred into JV with £11.3 billion of debt (2)                                                                           • Premium entry multiple for Virgin Media of 9.3x OCF (4)
                              • O2 valued at £12.7 billion TEV and transferred on a                                                                            and 25x OFCF (2019)
                                debt free basis (2)                                                                                                          • Net cash proceeds at closing, plus 50% of ongoing FCF
                              • Equalization payment from Liberty to Telefonica of                                                                             and recap proceeds
                                £2.5 billion                                                                                                                 • 50% of synergies valued at NPV of £6.2 billion
                              • 5x leverage (3) at closing; total debt of approx. £18                                                                                JV FINANCIAL INFORMATION (5)
                                billion and new proceeds of approx. £6 billion                                                                                      Year ended 31 Dec 2019                                       VIRGIN MEDIA                   O2      TOTAL
                                                                                                                                                                    (millions)                                                       U.K.                       U.K.      JV

                              • Net cash to Liberty of £1.4 billion after equalization                                                                               REVENUE                                                        £4,766                 £6,235      £11,001
                                payment
                                                                                                                                                                     OCF (6)                                                        £2,042                 £1,661      £3,703
                              • Expected to close middle of 2021 and subject to
                                                                                                                                                                     OCF (net of shareholder svcs) (7)                              £1,917                 £1,620      £3,537
                                regulatory and financing conditions
                                                                                                                                                                     OFCF                                                             £751                      £819   £1,570
(1)   Figures, other than those included in the JV Financial Information table, represent estimated amounts at closing
(2)   Virgin Media’s £11.3 billion of net debt is based upon third-party net debt and transaction related debt-like adjustments as of December 31, 2019 and is subject to customary closing adjustments. O2 is subject to £0.3 billion of transaction related
      debt-like and working capital adjustments as of December 31, 2019 and is subject to customary closing adjustments.
(3)   Including charges in connection with all Incremental Shareholder Services and liabilities associated with operating leases
(4)   Based on Reported OCF of £2,042m less £40m of estimated opex related shareholder charges and excluding £85m of estimated capital related shareholder charges, both of which we expect to be reported in OCF post transaction
(5)   Amounts represent the simple aggregation of revenue, OCF and OFCF (as customarily defined by Liberty Global) for the year ended December 31, 2019, based on U.S. GAAP for Virgin Media U.K. and IFRS (pre IFRS-16) for O2 U.K.
      Presentation is for illustrative purposes and does not reflect the basis of accounting that will be applied subsequent to the closing of the transaction.
(6)   Operating income for Virgin Media U.K was £50 million, including depreciation and amortization of £1,672 million, related-party fees and allocations of £190 million and other operating items of £130 million.
                                                                                                                                                                                                                                                                                 6
(7)   Includes estimated shareholder charges as indicated in note 4 for Liberty Global and £41m for Telefonica.
VIRGIN MEDIA + O2: COMBINED GROUP AT A GLANCE
                                                                  #1
                                                                                                                           Competitive
          BEST IN-CLASS                                                                                                    Spectrum
        INFRASTRUCTURE                                                                                                     Position                                  15mm fixed homes passed
                                                                UK’s largest                                                                                                                                             Significant high speed
                                                                                                                                                                     of which 95% are gigabit ready and
                                                                mobile network                                                                                       13% are launched                                    coverage with 1Gbps
                                                                                                                                                                                                                         across the UK by 2021

          STRONGER,                                                 32.6 Million                                                                     5.3 Million                                                         3.6 Million
        LARGER & MORE                                               Mobile subscribers
                                                                    (EX. 5.1mm M2M subs)
                                                                                                                                                     Internet subscribers                                                Pay-TV subscribers

          DIVERSIFIED                                                                                              £11bn                                                                  £3.7bn
            GROUP                                                                                                  Revenue (1)                                                            OCF (1)

                                                      #1 Mobile                                                             #3 Broadband                                                          #2 Pay-TV
                                                      Market Share                                                          Market Share                       20%                                Market Share                        23%
             LEADING                                                                         38%
           CONVERGED
           CHALLENGER

                                                            Premium Brands                                     Wide MVNO Offering                                 Fiber Backhaul and 5G                                    Best Entertainment
         BEST PRODUCT
           OFFERING
           IN THE UK

  (1)   Amounts represent the simple aggregation of revenue, OCF and OFCF (as customarily defined by Liberty Global) for the year ended December 31, 2019, based on U.S. GAAP for Virgin Media U.K. and IFRS for Telefonica U.K. Presentation is
                                                                                                                                                                                                                                                   7
        for illustrative purposes and does not reflect the basis of accounting that will be applied subsequent to the closing of the transaction.
LIBERTY GLOBAL: PRO FORMA GROUP

                            50%                                        60%                                      50%                                       100%                                        100%

                                                                                                                                                                                                             Other (Ventures,
                       UK                                        BE                                         NL                                       CH                                    PL/SK              Content, etc.)

 EUROPEAN FMC SCALE                                                                                                                     VALUE CREATION STRATEGY
 • Best converged assets in the best markets                                                                                            • Creation of national FMC champions
 • 80mm combined fixed and mobile subscribers (RGUs) (1)                                                                                • Focus on FCF growth & yield; potential public listings
 • $18bn of JV revenue and ~ $6bn consolidated revenue (2)                                                                              • Disciplined consolidation & opportunistic investments
 • Significant OCF, OFCF and FCF generation (3)                                                                                         • Levered equity capital allocation
  (1)   Based on 100% of Vodafone Ziggo JV’s, Virgin Media O2 U.K. JV’s and Liberty Global’s consolidated (ex- Virgin Media U.K.) 2019 RGUs.
  (2)   Based on 2019 amounts. JV revenue includes 100% of revenue for both the Vodafone Ziggo JV and the Virgin Media O2 U.K. JV. Consolidated revenue excludes 100% of Virgin Media U.K. revenue.
                                                                                                                                                                                                                                8
  (3)   OCF, OFCF and FCF are used as customarily defined by Liberty Global
LIBERTY GLOBAL: SUM-OF-THE-PARTS (1)

                               50%                                          60%                                         50%                            100%

                                                                                                                                                                                     Other
                          UK                                          BE                                           NL                                CH             Cash(3)          Assets

                    Per Share

 Deal Value            ~$14                                                                                                                                                            Ireland
                                                                                                           2019 (4)                                  2019 (5)
                                                                    Market                                                                                                             Poland
                                                                                                       OCF: $2.0 billion                        OCF: $628 million   $7.4 billion
 Synergies               ~$6                                       Value of                                                                                                           Slovakia
                                                                                                      OFCF: $1.1 billion                       OFCF: $298 million      at Q1
                                                                    Stock                                                                                                            Ventures,
                                                                                                      FCF: $519 million                         FCF: $176 million
 Proceeds                ~$3                                                                                                                                                         less Corp

      Total            ~$23                                        ~$4 (2)                                                      Equity Value                           $12         Equity value

    (1)   Calculations based on 605,968,770 basic ordinary shares outstanding at April 30, 2020 as disclosed in the Liberty Global form 10-Q
    (2)   Based on our ownership of 66.3 million shares at current market price of €35.72
    (3)   Includes SMAs
    (4)   NL JV operating income of $120 million
                                                                                                                                                                                                  9
    (5)   CH operating income of $187 million
VIRGIN MEDIA: Q1 2020 OPERATING UPDATE
                    HIGHLIGHTS                                              GROWING ARPU WHILE HOLDING CUSTOMERS STABLE                                           GROWING POSTPAID MOBILE
                                                                                                                                                              Total Postpaid subscribers: 3.1m
    WINNING AND RETAINING                                          Fixed Line Customers                                       SPEED LEADERSHIP (3)
    CUSTOMERS                                                      (000s)                                                                                     Postpaid Net Adds (Consumer)
                                                                      5,972 5,966 5,963 5,954 5,952                      Average UKIE base speed: 140Mbps
    •    Fixed customers held stable                                                                                                                          (000s)
                                                                                                                                                                                      107
    •    Record Q1 postpaid adds +72k                                                                                        1Gbps                                                             75         72
                                                                                                                                                U.K.    95%       26       57
                                                                                                                             Ready
    •    SoHo customer base +7% YoY
    •    Significant wholesale contract                                                                                    1Gbps
                                                                                                                                                                 Q1'19    Q2'19      Q3'19    Q4'19      Q1'20
                                                                                                                          Launched       13% U.K.
         wins                                                           Q1'19         Q2'19    Q3'19    Q4'19    Q1'20

    DRIVING UPSELL AND CROSS-                                                                                                                                             GROWING SOHO
    SELL TO GROW ARPU                                              Net Customer Adds (000s)                                     ENTERTAINMENT (3)             SOHO Revenue (1)
                                                                   Lightning / BAU                                                                            Rebased YoY growth %
    •    FMC gaining traction, +2.5%                                                                                     U.K. V6 box penetration
         YoY                                                                                    31                       / total video base                     23.1%
                                                                          29           27                29       25
    •    95% of BB base taking 100+                                       (4)
         Mbps following speed boost for                                                                          (26)                                                    12.8%
                                                                                      (33)     (34)     (38)                                                                                 10.6%
         1m subs                                                                                                                                                                     6.3%                7.2%
                                                                                                                                                        65%
    EXTENDING SPEED                                                     Q1'19         Q2'19    Q3'19    Q4'19    Q1'20                                           Q1'19    Q2'19      Q3'19   Q4'19       Q1'20
    LEADERSHIP
    •    On-track for network-wide                                 Customer ARPU                                                                                   OPTIMIZING OFCF MARGINS
                                                                   Rebased Growth YoY 1.6%                                                FMC
         coverage by end 2021,                                                                                                                                OFCF / Revenue % (2)             Pre-Lightning
         delivering >50% of UK                                                                                  1.2%     % broadband                                                         construction capex
         Government national ambition                                                                                    subscribers that
                                                                                                                         also take a postpaid          22%               23.5%                          23.0%
         4 years early                                                           0.5%         0.5%                                                              21.3%                22.3%   22.3%
                                                                                                                         mobile subscription
                                                                                                                                                                16.3%    17.4%       16.2%   15.9%      16.9%
    DRIVING EFFICIENCY
    •    Digitalization transforming care                             (0.3%)
         and sales capabilities                                        Q1'19         Q2'19    Q3'19    Q4'19    Q1'20                                           Q1'19     Q2'19      Q3'19   Q4'19       Q1'20

  (1)   Total revenue including non-subscription and mobile
  (2)   Includes Centrally attributed P&E Additions, see Appendix for more details
                                                                                                                                                                                                                  10
  (3)   1Gbps and EOS rollouts in Ireland are due to commence later in 2020
EXECUTIVE SUMMARY

FINANCIAL RESULTS

APPENDIX

                    11
DIVISIONAL OVERVIEW
       Strong OFCF conversion post Centrally-held P&E attributions

                                                                                                                                                                                                                     50-50
                          In millions, except %s                                                  U.K. & IRELAND                                  BELGIUM                             SWITZERLAND
                                                                                                                                                                                                                  DUTCH JV (3,4)
                                                                                                   Q1' 19             Q1' 20                 Q1' 19            Q1' 20                 Q1' 19             Q1' 20   Q1' 19   Q1' 20

                          REVENUE                                                                  $1,661            $1,621                   $712              $718                   $316               $317    $1,094   $1,097
                          Rebased revenue growth                                                                      (0.6%)                                   (0.4%)                                    (2.7%)            3.3%

                          OCF (1)                                                                   $692               $655                   $339              $332                   $156               $134    $494     $503
                          Rebased OCF growth                                                                          (3.5%)                                    0.6%                                    (16.0%)            4.9%
                          % Revenue                                                                  42%               40%                    48%                46%                    49%               42%      45%      46%

                          OFCF pre Lightning Construction Capex (2)                                 $354               $372                   $197              $187                    $89                $55    $302     $258
                          % Revenue                                                                  21%               23%                    28%                26%                    28%               17%      28%      24%

                          Lightning Construction Capex (5)                                           $84                $99

                          OFCF (2)                                                                  $270               $273
                                                                                                     16%               17%

(1)   2019 based on our updated definition of segment OCF which, effective from Q4 2019, now includes Centrally allocated opex. For information on centrally-held operating cost allocations, see the appendix.
(2)   Includes Centrally attributed P&E Additions. For information on our centrally-held P&E attributions, see the appendix included in our Q1 2020 Liberty Global earnings release
(3)   Represents 100% of the non-consolidated Dutch JV
(4)   OCF for the Dutch JV as shown in the table above includes $28 million of FSA charges from Liberty Global with the corresponding amount recognized as revenue within our Central segment.
(5)   Lightning Construction capex includes construction Capex only. Excludes Customer Premises Equipment                                                                                                                     12
GROUP OVERVIEW
Stable top line; OCF growth impacted by COVID-19; ~$10bn of total liquidity
        REVENUE GROWTH(1)                                                                        OCF GROWTH(1)                                                                            OFCF(1) ($m and % of Revenue)
                                                                                                                                                                                          % exclude Lightning capex
                                                                                                                                                                                                                                                  Pre-Lightning
                                                                                                                                                                                                                                                construction capex

                                                                                                                                                                                                                             649
                                                                                                                                                                                                                 607                                   593
                                                                                                                                                                                                     569                     553
                                                                                                                                                                                                                 508                      536
                                                                                                                                                                                                     485                                               496
                                                                                                                                                                                                                                          433

                                                                       (0.3%)                            (0.5%)
                  (0.6%)                     (0.6%)       (0.5%)                                                                                                                                     20%         21%          23%         18%           21%
                               (0.9%)
                                                                                                                      (3.9%)       (3.7%)        (4.1%)       (3.6%)
                   Q1'19        Q2'19        Q3'19         Q4'19        Q1'20
                                                                                                          Q1'19        Q2'19        Q3'19         Q4'19        Q1'20
                                                                                                                                                                                                   Q1'19        Q2'19       Q3'19       Q4'19          Q1'20

        P&E ADDITIONS (as % of Revenue)                                                          LIQUIDITY(2)                                                                             LEVERAGE(3)
                                                                                                                                                                                          (LTM basis)
                     24.4%        24.0%        23.2%        28.2%        22.8%
                                                                                                     Revolving
                                                                                                                                                                                                         $25.1bn
         Lightning
                                                             3.8%                                    Credit                                                                                                                               $17.7bn
      construction    2.9%         3.5%
            capex                               3.4%                       3.4%                      Facilities                                                                                               5.2x
                                                                                                     $2.9bn                         Total                                                                                                       3.7x
        Underlying 21.5%
                                                             24.4%                                                                Liquidity
                                   20.5%        19.8%                     19.4%
              P&E
                                                                                                                                  $10.3bn                      Cash                                           Gross                              Net
                                                                                                           SMAs                                                $5.4bn
                                                                                                           $2.0bn                                                                                     WACD                                  4.1%
                     Q1'19         Q2'19        Q3'19        Q4'19        Q1'20                                                                                                                       Average tenor                         >7 years
      (1)   Revenue, OCF and OFCF growth rates presented on a rebased basis after internal recharges. See appendix for definitions and reconciliations of non-GAAP measures, as applicable.
      (2)   Liquidity refers to our consolidated cash and cash equivalents, investments held under separately managed accounts (SMAs), plus the maximum undrawn commitments under our subsidiaries' borrowing facilities without regard to covenant
            compliance calculations                                                                                                                                                                                                                                  13
      (3)   Debt balances presented on swapped basis, taking into account derivative positions.
ADJUSTED FCF
   Q1 outflow driven by interest payments; consistent with prior years

                      $m                                                               FY 2019   Q1 2020   Comments

                      OCF                                                              $4,949    $1,150

                      P&E pre-Lightning Capex                                          (2,490)    (555)
                      OFCF pre-Lightning Capex                                         $2,459     $595

                      NET INTEREST                                                     (1,118)    (579)    •   Payments in Q1 and Q3

                      CASH TAX                                                          (358)      5       •   FY20 expected to be lower than FY19

                      VODAFONE ZIGGO JV (1)                                             214        11      •   FY20 upstream €200-250m expected H2
                      (Dividend & Interest)

                                                                                       $1,197     $32
                      WORKING CAPITAL (2)                                               (37)      (250)    •   Targeting broadly flat again in FY20
                      ADJUSTED FCF pre-Lightning Capex                                 $1,160    ($218)
                      LIGHTNING CAPEX                                                   (390)     (99)     •   Construction capex only

                      ADJUSTED FCF                                                      $770     ($317)

(1) 2019 loan repayment of €100m not included within FCF
                                                                                                                                                      14
(2) Includes working capital, operational finance (vendor finance) and restructuring
OUTLOOK
Maintaining 2020 Guidance; revisiting at Q2

             •     Still assessing medium-term impact from COVID-19
             •     Expect to update investors on our Q2 earnings call
             •     Encouraged by operating prospects
             •     No current need to change or suspend full-year guidance

             FY 2020 (1)                                                       Original                                                                                   Comments
                                                                              Guidance
             Rebased Revenue                                                    Not guided                                         Negative impacts expected on handset sales and
                                                                                                                                   premium video, both low margin

             Rebased OCF                                           Mid-single digit decline
                                                                                                                                   Assumptions:
             Rebased OFCF                                          Mid-single digit growth
                                                                                                                                   •      Lock-downs lifted from Q2

             Adjusted FCF (2)                                                    ~$1 billion                                       •      Gradual economic recovery occurs thereafter
                                                           Including Lightning Construction Capex

       (1)   Quantitative reconciliations to operating income (including operating income growth rates) and cash flows from operating activities for our OCF and adjusted free cash flow guidance cannot be provided without unreasonable efforts as we do not forecast (i)
             certain non-cash charges including depreciation and amortization and impairment, restructuring and other operating items included in operating income, nor (ii) specific changes in working capital that impact cash flows from operating activities. The items
             we do not forecast may vary significantly from period to period.
                                                                                                                                                                                                                                                                               15
       (2)   Based on EUR/USD 1.13; GBP/USD 1.33
EXECUTIVE SUMMARY

FINANCIAL RESULTS

APPENDIX

                    16
VIRGIN MEDIA: PROJECT LIGHTNING UPDATE
             HIGHLIGHTS                         CONSTRUCTION ACTIVITY                                                                    KPIs
  • Government allowing
                                         PREMISES CONSTRUCTED (000s)                                                               ARPU £
    construction to continue
    however some COVID-19            Lightning to date: 2,182k
                                                                                                                                                          46.48          46.15
    delays                                                                                    45.39                   45.39              45.75

  • Driving attractive returns:                                     154
                                                  130      119
                                       102                                    93
    • ARPU in line with core
      business post-discounts

    • Pre-SAC OCF margins              Q1 '19     Q2 '19   Q3 '19   Q4 '19   Q1 '20           Q1 '19                  Q2 '19             Q3 '19           Q4 '19         Q1 '20

      estimated ~60%
                                        NATIONAL FOOTPRINT COVERAGE                                                    U.K. PENETRATION
    • Cumulative CPP stays flat at
      ~£670                                                                  52%
                                                                                                                                                                                   35%

                                                           50%      51%                                                                                                      31%
                                                  49%                                                                                                  28% 28% 28% 29% 28%
  • Exploring potential for            47%
                                                                                                                     25%   25% 26%
                                                                                                                                   27%   27% 28% 27%                               30%

    greenfield expansion via
                                                                                                               24%
                                                                                                         22%
                                                                                                   20%

    Liberty Networks                                                                         18%

                                                                                       14%

                                       2016       2017     2018     2019     Q1 2020
                                                                                       3 6 9 12 15 18 21 24 27 30 33 36 39 42 45 48 51 54 57 60

                                                                                                                                                                                         17
UPC SWITZERLAND: Q1 2020 OPERATING UPDATE
Operating trends encouraging but pricing pressure continues
                       HIGHLIGHTS                                              GROWING ARPU WHILE HOLDING CUSTOMERS STABLE                                         GROWING POSTPAID MOBILE
                                                                                                                                                               Total Postpaid subscribers: 213k
       • Turnaround initiatives                                       Fixed Line Customers                                     SPEED LEADERSHIP
         progressing well,                                            (000s)                                                                                   Postpaid Net Adds (Consumer)
                                                                                                                         Average base speed: 310Mbps
         contributing to improved                                                                                                                              (000s)
                                                                          1,092 1,071 1,062 1,039
         digital churn                                                                            1,012                                                                               16
                                                                                                                                                                   13       14
                                                                                                                             1Gbps                                                             12       12
            • Positive 1Gbps take-up                                                                                         Ready                       98%

            • FMC % +5% YoY
                                                                                                                                                                  Q1'19    Q2'19     Q3'19    Q4'19    Q1'20
                                                                                                                           1Gbps
            • EOS nps +21pts vs legacy                                     Q1'19        Q2'19   Q3'19    Q4'19   Q1'20    Launched                       98%
              video platform
                                                                                                                                                                            GROWING SOHO
       • Financials pressured:                                        Net Fixed Line
                                                                      Customer Adds (000s)
                                                                                                                                 ENTERTAINMENT                 SOHO Revenue (1)
            • Competitive market                                                                                         EOS box penetration
                                                                                                                                                               Rebased YoY Growth %
              depressing consumer and                                                                                    / total video base
              SOHO ARPU, however                                                                                                                                 12.6%
                                                                                                 (9)                                                                       10.6%
                                                                                        (18)                     (16)                                  28%
              B2B continues to grow                                        (24)                          (23)                                                                        7.4%      0.7%    (3.1%)
            • Higher share of lower
                                                                          Q1'19         Q2'19   Q3'19    Q4'19   Q1'20
              margin mobile revenue
              and higher MVNO costs                                                                                                                               Q1'19    Q2'19     Q3'19     Q4'19   Q1'20

              from increased usage
                                                                      Customer ARPU
            • CHF2m OCF impact from                                                                                                       FMC                       OPTIMIZING OFCF MARGINS
                                                                      Rebased Growth YoY
              accelerated Ice Hockey                                    3.6%                                                                                   OFCF / Revenue % (2)
                                                                                                                         % broadband
              cost recognition                                                                                           subscribers that
                                                                                                                                                               Includes Centrally attributed P&E
                                                                                        1.5%
                                                                                                                         also take a                   21%
            • Cost optimization impacts
                                                                                                                         mobile subscription
              from Q2 onwards                                                                                                                                    27.7%
                                                                                                (0.7%)                                                                     22.8%    23.7%
            • OFCF impacted by higher                                                                                                                                                         20.3%    17.4%
              CPE inventory & new build                                                                  (2.5%) (2.8%)
              / B2B projects                                               Q1'19        Q2'19   Q3'19    Q4'19   Q1'20
                                                                                                                                                                  Q1'19    Q2'19     Q3'19     Q4'19   Q1'20

     (1)   Total revenue including non-subscription and mobile
                                                                                                                                                                                                               18
     (2)   Includes Centrally attributed P&E Additions, see Appendix for more details
TELENET: Q1 2020 OPERATING UPDATE
Executing against all key strategic drivers
                       HIGHLIGHTS                                              GROWING ARPU WHILE HOLDING CUSTOMERS STABLE                                        GROWING POSTPAID MOBILE
                                                                                                                                                              Total Postpaid subscribers: 2.1m
       • Draft wholesale pricing                                      Fixed Line Customers                                    SPEED LEADERSHIP
                                                                      (000s)                                                                                  Postpaid Net Adds (Consumer)
         notified to EC for review                                                                                      Average base speed: 202Mbps
                                                                         2,100 2,092 2,079 2,072 2,065                                                        (000s)
                                                                                                                                                                           54
       • Lower handset sales &                                                                                                                                                       43       39
                                                                                                                            1Gbps                                 34
         advertising revenue due to                                                                                         Ready                      100%                                            24
         COVID-19.
                                                                                                                                                                 Q1'19    Q2'19     Q3'19    Q4'19    Q1'20
                                                                                                                          1Gbps
       • €10m of prepaid sports                                            Q1'19        Q2'19   Q3'19   Q4'19   Q1'20    Launched                      100%

         costs written off in Q1 due                                                                                                                                       GROWING SOHO
         to fixture disruption                                        Net Fixed Line
                                                                      Customer Adds (000s)
                                                                                                                                ENTERTAINMENT                 SOHO Revenue (1)
                                                                                                                                                              Rebased YoY Growth %
       • Digitization initiatives                                                                                       EOS box penetration
         delivering underlying opex                                                                                     / total video base
                                                                                                                                                  8%                                         11.3%    11.1%
         benefits                                                                        (8)             (7)     (8)                                                      10.7%
                                                                             (15)               (13)                                                                                8.8%
                                                                                                                                                                 7.4%
       • Local IFRS guidance
         updated for COVID-19:                                              Q1'19       Q2'19   Q3'19   Q4'19   Q1'20
                                                                                                                                                                 Q1'19    Q2'19     Q3'19     Q4'19   Q1'20

            • Rebased revenue
                                                                      Customer ARPU
              growth -2% (previously                                                                                                     FMC                       OPTIMIZING OFCF MARGINS
                                                                      Rebased Growth YoY
              broadly stable)                                            4.4%                                                                                 OFCF / Revenue % (2)
                                                                               3.7%                                     % broadband
                                                                                                                                                              Includes Centrally attributed P&E
                                                                                                                        subscribers that
            • Rebased OFCF growth                                                               2.4%                    also take a
                                                                                                        2.2%    1.9%
              1-2% (previously ~2%)                                                                                     mobile subscription            45%                         33.4%
                                                                                                                                                                27.7%     29.6%
                                                                                                                                                                                             25.2%    26.0%
            • Lower end of previous
              €415-435m Adjusted
              FCF range                                                     Q1'19       Q2'19   Q3'19   Q4'19   Q1'20
                                                                                                                                                                 Q1'19    Q2'19     Q3'19    Q4'19    Q1'20

                                                                                                                                                                                                              19
     (1)   Total revenue including non-subscription and mobile
     (2)   Includes Centrally attributed P&E Additions, see Appendix for more details
VODAFONE ZIGGO: Q1 2020 OPERATING UPDATE                                                                                                                                                                                                (1)

Operating momentum continues in Q1 2020
                     HIGHLIGHTS                                              GROWING ARPU WHILE HOLDING CUSTOMERS STABLE                                                                                       GROWING POSTPAID MOBILE
                                                                                                                                                                                                           Total Postpaid subscribers: 2.8m
      • Regulated access                                            Fixed Line Customers                                                         SPEED LEADERSHIP
        requirement annulled                                        (000s)                                                                                                                                 Postpaid Net Adds (Consumer)
                                                                       3,677 3,675 3,662 3,654 3,647                                    Average base speed: 180Mbps
                                                                                                                                                                                                           (000s)
      • Targeting 1Gbps rollout by                                                                                                                                                                                                55       52
                                                                                                                                              1Gbps                                                                                                46
        end of 2021                                                                                                                           Ready                                       99%                 13       34

      • First operator to launch 5G                                                                                                                                                                          Q1'19    Q2'19    Q3'19      Q4'19   Q1'20
                                                                                                                                          1Gbps
        network                                                          Q1'19      Q2'19      Q3'19      Q4'19     Q1'20                Launched            11%

      • ~90% of €210m synergy                                                                                                                                                                                          GROWING SOHO
                                                                    Net Fixed Line
        target realized                                             Customer Adds (000s)
                                                                                                                                                    ENTERTAINMENT                                          SOHO Revenue (2)
                                                                                                                                                                                                           Rebased YoY Growth %
                                                                                                                                        Mediabox Next penetration
      • Local JV guidance                                                                                                               / total video base                                                                                4.5%
                                                                                                                                                                                  10%                         4.0%
        updated for COVID-19:                                                        (3)                                                                                                                              2.9%                        2.8%
                                                                                                          (9)        (8)
                                                                         (17)                  (13)
            • Stable to modest OCF                                                                                                                                                                                             (2.1%)

              growth (previously 2-                                      Q1'19     Q2'19      Q3'19      Q4'19      Q1'20
              3%)                                                                                                                                                                                             Q1'19   Q2'19    Q3'19      Q4'19   Q1'20

            • €400-500m of cash                                     Customer ARPU
                                                                                                                                                                                                                OPTIMIZING OFCF MARGINS
              available for potential                               Rebased Growth YoY                                                                          FMC
                                                                                                                   5.9%                                                                                    OFCF / Revenue %
              shareholder                                                                               5.0%                           % broadband
                                                                                                                                       subscribers that
              distributions (no                                                               4.0%
                                                                                                                                       also take a
              change)                                                              2.7%                                                mobile subscription                              42%                  27.6%                        26.3%
                                                                        1.7%                                                                                                                                          23.4%    22.5%              23.5%

                                                                         Q1'19     Q2'19      Q3'19      Q4'19      Q1'20
                                                                                                                                                                                                             Q1'19    Q2'19    Q3'19      Q4'19   Q1'20

      (1)   We own a 50% non-controlling interest in the VodafoneZiggo JV in the Netherlands and all results are as disclosed and as reported by the JV. Results are not consolidated by Liberty Global.                                                  20
      (2)   Total revenue including non-subscription and mobile
REBASE INFORMATION
  For purposes of calculating rebased growth rates on a comparable basis for all businesses that     The following table provides adjustments made to the 2019 amounts to derive our rebased
  we owned during 2020, we have adjusted our historical revenue, OCF and OFCF for the three          growth rates for our continuing operations:
  months ended March 31, 2019 to (i) include the pre-acquisition revenue, OCF and P&E
  additions of entities acquired during 2019 in our rebased amounts for the three months ended
  March 31, 2019 to the same extent that the revenue, OCF and P&E additions of these entities
  are included in our results for the three months ended March 31, 2020, (ii) include revenue and
  costs for the temporary elements of transitional and other services provided to the
  VodafoneZiggo JV, Vodafone, Deutsche Telekom (the buyer of UPC Austria), Liberty Latin
  America and M7 Group (the buyer of UPC DTH), to reflect amounts related to these services
  equal to those included in our results for the three months ended March 31, 2020 and (iii)
  reflect the translation of our rebased amounts for the three months ended March 31, 2019 at
  the applicable average foreign currency exchange rates that were used to translate our results     (i) Relates to rebase adjustments for agreements to provide transitional and other services to
  for the three months ended March 31, 2020. We have reflected the revenue, OCF and P&E              the VodafoneZiggo JV, Vodafone, Liberty Latin America, Deutsche Telekom and M7 Group.
  additions of these acquired entities in our 2019 rebased amounts based on what we believe to       These adjustments result in an equal amount of fees in both the 2020 and 2019 periods for
  be the most reliable information that is currently available to us (generally pre-acquisition      those services that are deemed to be temporary in nature.
  financial statements), as adjusted for the estimated effects of (a) any significant differences
  between U.S. GAAP and local generally accepted accounting principles, (b) any significant
  effects of acquisition accounting adjustments, (c) any significant differences between our
  accounting policies and those of the acquired entities and (d) other items we deem appropriate.
  We do not adjust pre-acquisition periods to eliminate nonrecurring items or to give retroactive
  effect to any changes in estimates that might be implemented during post-acquisition periods.
  As we did not own or operate the acquired businesses during the pre-acquisition periods, no
  assurance can be given that we have identified all adjustments necessary to present the
  revenue, OCF and OFCF of these entities on a basis that is comparable to the corresponding
  post-acquisition amounts that are included in our historical results or that the pre-acquisition
  financial statements we have relied upon do not contain undetected errors. The adjustments
  reflected in our rebased amounts have not been prepared with a view towards complying with
  Article 11 of Regulation S-X. In addition, the rebased growth percentages are not necessarily
  indicative of the revenue, OCF and OFCF that would have occurred if these transactions had
  occurred on the dates assumed for purposes of calculating our rebased amounts or the
  revenue, OCF and OFCF that will occur in the future. The rebased growth percentages have
  been presented as a basis for assessing growth rates on a comparable basis, and are not
  presented as a measure of our pro forma financial performance.

                                                                                                                                                                                                      21
GLOSSARY
  10-Q or 10-K: As used herein, the terms 10-Q and 10-K refer to our most recent quarterly or annual report as i.       For purposes of our condensed consolidated statements of cash flows, expenses financed by an intermediary
  filed with the Securities and Exchange Commission on Form 10-Q or Form 10-K, as applicable.                           are treated as hypothetical operating cash outflows and hypothetical financing cash inflows when the expenses
                                                                                                                        are incurred. When we pay the financing intermediary, we record financing cash outflows in our condensed
  Adjusted Free Cash Flow (FCF): net cash provided by our operating activities, plus (i) cash payments for              consolidated statements of cash flows. For purposes of our Adjusted Free Cash Flow definition, we add back the
  third-party costs directly associated with successful and unsuccessful acquisitions and dispositions and (ii)         hypothetical operating cash outflow when these financed expenses are incurred and deduct the financing cash
  expenses financed by an intermediary, less (a) capital expenditures, as reported in our condensed                     outflows when we pay the financing intermediary.
  consolidated statements of cash flows, (b) principal payments on amounts financed by vendors and
                                                                                                                 ii.    Represents the estimated interest and related derivative payments made by UPC Holding associated with our
  intermediaries and (c) principal payments on finance leases (exclusive of the portions of the network lease in
                                                                                                                        discontinued UPC Holding operations in Hungary, Romania and the Czech Republic during the applicable period.
  Belgium that we assumed in connection with certain acquisitions), with each item excluding any cash provided          These estimated payments are calculated based on Hungary, Romania and the Czech Republic’s pro rata share
  or used by our Discontinued Operations, as applicable. We believe that our presentation of Adjusted Free Cash         of UPC Holding's OCF and UPC Holding's aggregate interest and derivative payments during the applicable
  Flow provides useful information to our investors because this measure can be used to gauge our ability to            period. Although we believe this adjustment to interest and related derivative payments results in a reasonable
  service debt and fund new investment opportunities. Adjusted Free Cash Flow should not be understood to               estimate of the annual ongoing interest and related derivative payments that will occur in relation to the
  represent our ability to fund discretionary amounts, as we have various mandatory and contractual obligations,        continuing UPC Holding operations, no assurance can be given that the actual interest and derivative payments
  including debt repayments, which are not deducted to arrive at this amount. Investors should view Adjusted            will be equivalent to the amounts presented. No pro forma adjustments were required with respect to
  Free Cash Flow as a supplement to, and not a substitute for, U.S. GAAP measures of liquidity included in our          Unitymedia's interest and derivative payments as substantially all of Unitymedia’s debt and related derivative
  condensed consolidated statements of cash flows.                                                                      instruments were direct obligations of the entities being disposed. As a result, the interest and related derivative
                                                                                                                        payments associated with such debt and derivative instruments of Unitymedia are included in discontinued
  The following table provides a reconciliation of our net cash provided by operating activities from continuing        operations.
  operations to Adjusted Free Cash Flow for the indicated periods. In addition, in order to provide information
  regarding our Adjusted Free Cash Flow that excludes the Discontinued Operations, we also present Adjusted iii.        Represents our preliminary estimate of the net cash flows that we would have received from transitional services
  Free Cash Flow on a pro forma basis for the three months ended March 31, 2019 as if the sale of the                   agreements if the sale of the Discontinued Operations had occurred on January 1, 2019. The estimated net cash
                                                                                                                        flows are based on the estimated revenue that we expect to recognize from our transitional services agreements
  Discontinued Operations had been completed on January 1, 2019.
                                                                                                                        during the first 12 months following the completion of the sale of the Discontinued Operations, less the estimated
                                                                                                                        incremental costs that we expect to incur to provide such transitional services. As a result, the pro forma
                                                                                                                        adjustments during the year ended March 31, 2019 include $38.2 million related to our discontinued operations in
                                                                                                                        Germany, Hungary, Romania and the Czech Republic and $0.7 million related to our discontinued DTH business.

                                                                                                                  iv.   Represents the Adjusted FCF that we estimate would have resulted if the sale of the Discontinued Operations
                                                                                                                        had been completed on January 1, 2019. Actual amounts may differ from the amounts assumed for purposes of
                                                                                                                        this pro forma calculation. For example, our Pro forma Adjusted FCF does not include any future benefits related
                                                                                                                        to reductions in our corporate costs as a result of our operating model rationalization or any other potential future
                                                                                                                        operating or capital cost reductions attributable to our continuing or discontinued operations.

                                                                                                                                                                                                                                                22
GLOSSARY
  ARPU: Average Revenue Per Unit is the average monthly subscription revenue per average cable customer           calculations. Customers who move within our cable footprint and upgrades and downgrades between
  relationship or mobile subscriber, as applicable. ARPU per average fixed-line customer relationship is          services are also excluded from the disconnect figures used in the churn calculation.
  calculated by dividing the average monthly subscription revenue from residential cable and SOHO services
  by the average number of fixed-line customer relationships for the period. ARPU per average mobile              Enhanced Video Subscriber: a home, residential multiple dwelling unit or commercial unit that receives our
  subscriber is calculated by dividing residential mobile and SOHO revenue for the indicated period by the        video service over our broadband network or through a partner network via a digital video signal while
  average number of mobile subscribers for the period. Unless otherwise indicated, ARPU per cable customer        subscribing to any recurring monthly service that requires the use of encryption-enabling technology.
  relationship or mobile subscriber is not adjusted for currency impacts. ARPU per RGU refers to average          Enhanced Video Subscribers are counted on a unique premises basis. For example, a subscriber with one or
  monthly revenue per average RGU, which is calculated by dividing the average monthly subscription revenue       more set-top boxes that receives our video service in one premises is generally counted as just one
  from residential and SOHO services for the indicated period, by the average number of the applicable RGUs       subscriber. An Enhanced Video Subscriber is not counted as a Basic Video Subscriber. As we migrate
  for the period. Unless otherwise noted, ARPU in this release is considered to be ARPU per average cable         customers from basic to enhanced video services, we report a decrease in our Basic Video Subscribers
  customer relationship or mobile subscriber, as applicable. Fixed-line customer relationships, mobile            equal to the increase in our Enhanced Video Subscribers.
  subscribers and RGUs of entities acquired during the period are normalized. In addition, for purposes of
  calculating the percentage change in ARPU on a rebased basis, we adjust the prior-year subscription             Fixed-Line Customer Relationships: the number of customers who receive at least one of our internet,
  revenue, fixed-line customer relationships, mobile subscribers and RGUs, as applicable, to reflect              video or telephony services that we count as RGUs, without regard to which or to how many services they
  acquisitions, dispositions and FX on a comparable basis with the current year, consistent with how we           subscribe. Fixed-Line Customer Relationships generally are counted on a unique premises basis.
  calculate our rebased growth for revenue and OCF.                                                               Accordingly, if an individual receives our services in two premises (e.g., a primary home and a vacation
                                                                                                                  home), that individual generally will count as two Fixed-Line Customer Relationships. We exclude mobile-
  ARPU per Mobile Subscriber: Our ARPU per mobile subscriber calculation that excludes interconnect               only customers from Fixed-Line Customer Relationships.
  revenue refers to the average monthly mobile subscription revenue per average mobile subscriber and is
  calculated by dividing the average monthly mobile subscription revenue (excluding handset sales and late        Fixed-Mobile Convergence (FMC): Fixed-mobile convergence penetration represents the number of
  fees) for the indicated period, by the average of the opening and closing balances of mobile subscribers in     customers who subscribe to both a fixed broadband internet service and postpaid mobile telephony service,
  service for the period. Our ARPU per mobile subscriber calculation that includes interconnect revenue           divided by the total number of customers who subscribe to our fixed broadband internet service.
  increases the numerator in the above-described calculation by the amount of mobile interconnect revenue
                                                                                                                  Homes Passed: homes, residential multiple dwelling units or commercial units that can be connected to our
  during the period.
                                                                                                                  networks without materially extending the distribution plant. Certain of our Homes Passed counts are based
  Basic Video Subscriber: a home, residential multiple dwelling unit or commercial unit that receives our         on census data that can change based on either revisions to the data or from new census results.
  video service over our broadband network either via an analog video signal or via a digital video signal
                                                                                                                  Internet Subscriber: a home, residential multiple dwelling unit or commercial unit that receives internet
  without subscribing to any recurring monthly service that requires the use of encryption-enabling technology.
                                                                                                                  services over our networks, or that we service through a partner network. Our Internet Subscribers do not
  Encryption-enabling technology includes smart cards, or other integrated or virtual technologies that we use
                                                                                                                  include customers that receive services from dial-up connections.
  to provide our enhanced service offerings. We count RGUs on a unique premises basis. In other words, a
  subscriber with multiple outlets in one premises is counted as one RGU and a subscriber with two homes          Leverage and Liquidity: Our debt and net debt ratios defined as total debt and net debt, respectively,
  and a subscription to our video service at each home is counted as two RGUs.                                    divided by OCF of the last twelve months (LTM OCF). Prior to December 31,2019, we presented our debt
                                                                                                                  and net debt ratios under an annualized OCF approach using the OCF from the most recent quarter. Net
  Blended fully-swapped debt borrowing cost: the weighted average interest rate on our aggregate
                                                                                                                  debt is defined as total debt less cash and cash equivalents and investments under separately managed
  variable- and fixed-rate indebtedness (excluding finance leases and including vendor financing obligations),
                                                                                                                  accounts. For purposes of these calculations, debt is measured using swapped foreign currency rates,
  including the effects of derivative instruments, original issue premiums or discounts and commitment fees,
                                                                                                                  consistent with the covenant calculation requirements of our subsidiary debt agreements, and excludes the
  but excluding the impact of financing costs.
                                                                                                                  loans backed or secured by the shares we hold in ITV plc and Lions Gate Entertainment Corp.
  B2B: Business-to-Business.
                                                                                                                  Liquidity refers to cash and cash equivalents, investments held under separately managed accounts and the
  Customer Churn: the rate at which customers relinquish their subscriptions. The annual rolling average          maximum undrawn commitments under subsidiary borrowing facilities, without regard to covenant
  basis is calculated by dividing the number of disconnects during the preceding 12 months by the average         compliance calculations.
  number of customer relationships. For the purpose of computing churn, a disconnect is deemed to have
                                                                                                                  Lightning premises: includes homes, residential multiple dwelling units and commercial premises that
  occurred if the customer no longer receives any level of service from us and is required to return our
                                                                                                                  potentially could subscribe to our residential or SOHO services, which have been connected to our networks
  equipment. A partial product downgrade, typically used to encourage customers to pay an outstanding bill
                                                                                                                  as a part of our Project Lightning network extension program in the U.K. and Ireland. Project Lightning infill
  and avoid complete service disconnection, is not considered to be disconnected for purposes of our churn
                                                                                                                  build relates to construction in areas adjacent to our existing network.
                                                                                                                                                                                                                                   23
GLOSSARY
  Mobile Subscriber Count: the number of active SIM cards in service rather than services provided. For              OCF margin: calculated by dividing OCF by total revenue for the applicable period.
  example, if a mobile subscriber has both a data and voice plan on a smartphone this would equate to one
  mobile subscriber. Alternatively, a subscriber who has a voice and data plan for a mobile handset and a data       OFCF: As used herein, Operating Free Cash Flow or “OFCF” represents OCF less property and equipment
  plan for a laptop would be counted as two mobile subscribers. Customers who do not pay a recurring                 additions. OFCF is an additional metric that we use to measure the performance of our operations after
  monthly fee are excluded from our mobile telephony subscriber counts after periods of inactivity ranging from      considering the level of property and equipment additions incurred during the period. For limitations of OFCF,
  30 to 90 days, based on industry standards within the respective country. In a number of countries, our            see the definition of OCF.
  mobile subscribers receive mobile services pursuant to prepaid contracts.
                                                                                                                     A reconciliation of our total OCF to total OFCF for our continuing operations is presented in the following
  MVNO: Mobile Virtual Network Operator.                                                                             table:
  NPS: Net Promoter Score.

  OCF: As used herein, OCF has the same meaning as the term "Adjusted OIBDA" that is referenced in our
  10-Q. OCF is the primary measure used by our chief operating decision maker to evaluate segment
  operating performance. OCF is also a key factor that is used by our internal decision makers to (i) determine
  how to allocate resources to segments and (ii) evaluate the effectiveness of our management for purposes of
  annual and other incentive compensation plans. As we use the term, OCF is defined as operating income
  before depreciation and amortization, share-based compensation, provisions and provision releases related
  to significant litigation and impairment, restructuring and other operating items. Other operating items include
  (a) gains and losses on the disposition of long-lived assets, (b) third-party costs directly associated with       OFCF margin: OFCF margin is calculated by dividing OFCF by total revenue for the applicable period.
  successful and unsuccessful acquisitions and dispositions, including legal, advisory and due diligence fees,
  as applicable, and (c) other acquisition-related items, such as gains and losses on the settlement of              Property and equipment additions (P&E additions): includes capital expenditures on an accrual basis,
  contingent consideration. Our internal decision makers believe OCF is a meaningful measure because it              amounts financed under vendor financing or finance lease arrangements and other non-cash additions.
  represents a transparent view of our recurring operating performance that is unaffected by our capital
  structure and allows management to (1) readily view operating trends, (2) perform analytical comparisons           Rental ARPU: subscription ARPU less out-of-bundle telephony usage and pay-per-view
  and benchmarking between segments and (3) identify strategies to improve operating performance in the              RGU: A Revenue Generating Unit is separately a Basic Video Subscriber, Enhanced Video Subscriber,
  different countries in which we operate. We believe our OCF measure is useful to investors because it is one       Internet Subscriber or Telephony Subscriber. A home, residential multiple dwelling unit, or commercial unit
  of the bases for comparing our performance with the performance of other companies in the same or similar          may contain one or more RGUs. For example, if a residential customer in our U.K. market subscribed to our
  industries, although our measure may not be directly comparable to similar measures used by other public           enhanced video service, fixed-line telephony service and broadband internet service, the customer would
  companies. OCF should be viewed as a measure of operating performance that is a supplement to, and not             constitute three RGUs. Total RGUs is the sum of Basic Video, Enhanced Video, Internet and Telephony
  a substitute for, operating income, net earnings or loss, cash flow from operating activities and other U.S.       Subscribers. RGUs generally are counted on a unique premises basis such that a given premises does not
  GAAP measures of income or cash flows. A reconciliation of our operating income to total OCF for our               count as more than one RGU for any given service. On the other hand, if an individual receives one of our
  continuing operations is presented in the following table:                                                         services in two premises (e.g., a primary home and a vacation home), that individual will count as two RGUs
                                                                                                                     for that service. Each bundled cable, internet or telephony service is counted as a separate RGU regardless
                                                                                                                     of the nature of any bundling discount or promotion. Non-paying subscribers are counted as subscribers
                                                                                                                     during their free promotional service period. Some of these subscribers may choose to disconnect after their
                                                                                                                     free service period. Services offered without charge on a long-term basis (e.g., VIP subscribers or free
                                                                                                                     service to employees) generally are not counted as RGUs. We do not include subscriptions to mobile
                                                                                                                     services in our externally reported RGU counts. In this regard, our RGU counts exclude our separately
                                                                                                                     reported postpaid and prepaid mobile subscribers.

                                                                                                                                                                                                                                      24
GLOSSARY
  SIM: Subscriber Identification Module

  SOHO: Small or Home Office Subscribers

  Telephony Subscriber: a home, residential multiple dwelling unit or commercial unit that receives
  voice services over our networks, or that we service through a partner network. Telephony
  Subscribers exclude mobile telephony subscribers.

  U.S. GAAP: Accounting principles generally accepted in the United States.

  YoY: Year-over-year.

                                                                                                      25
APPENDIX
 Q1 HIGHLIGHTS

                 26
APPENDIX
 CENTRALLY-HELD OPERATING COST ALLOCATIONS
 During the fourth quarter of 2019, we changed the presentation of certain operating costs related to our centrally-managed technology and innovation function. These costs, which were previously
 included in Central and Corporate, are now allocated to our consolidated reportable segments. This change, which we refer to as the “Centrally-held Operating Cost Allocations”, was made as a
 result of internal changes with respect to the way in which our chief operating decision maker evaluates the OCF of our operating segments. Segment information for the three months ended March
 31, 209 has been revised in our reported U.S. GAAP disclosures to reflect this change. The following table provides a summary of the impact on the OCF of our consolidated reportable segments
 and Central and Corporate that resulted from the Centrally-held Operating Cost Allocations.

                                                                                                                                                                                                     27
APPENDIX
 CENTRALLY-HELD P&E ATTRIBUTIONS / ATTRIBUTED OFCF
 Property and equipment additions presented for Central and Corporate include certain capital costs incurred for the benefit of our operating segments. Generally, for purposes of the consolidated financial
 statements of our borrowing groups, the expense associated with these capital costs is allocated and/or charged to our operating segments as related-party fees and allocations in their respective
 statements of operations over the period in which the operating segment benefits from the use of the Central and Corporate asset. Related-party fees and allocations are excluded from the reported OCF
 metric of these borrowing groups. These amounts are based on (i) our estimate of its share of underlying costs, (ii) our estimate of its share of the underlying costs plus a mark-up or (iii) commercially-
 negotiated rates. These charges and allocations differ from the attributed OFCF approach, as further described below.

 For internal management reporting and capital allocation purposes, we evaluate the OFCF of our operating segments on an "attributed" basis, whereby we estimate and attribute certain capital costs
 incurred by Central and Corporate to our operating segments as if that operating segment directly incurred its estimated share of the capital costs in the same period the costs were incurred by Central
 and Corporate. These capital costs represent assets that are jointly used by our operating segments. In the context of evaluating our operating segments, we believe this non-GAAP approach, which we
 refer to as the "Centrally-held Property and Equipment Attributions", is a meaningful measure as it represents a transparent view of what the estimated capital spend for our operating segments might be
 if they were to operate as a stand-alone business (excluding, among other considerations, any impact from lost economies of scale) and allows us to more accurately (i) review capital trends by operating
 segment, (ii) perform benchmarking between operating segments and (iii) drive alignment and accountability between Central and Corporate and our operating segments with respect to our consolidated
 capital spend. The amounts attributed to each operating segment are estimated based on (a) actual costs incurred by Central and Corporate, without any mark-up, and (b) each respective operating
 segment's estimated use of the associated assets.

 A reconciliation of our OCF to attributed OFCF, including Centrally-held Property and Equipment Attributions, consistent with our internal management reporting approach, of (i) our operating segments
 and (ii) consolidated continuing operations is presented in the following table. This presentation is for illustrative purposes only and is intended as a supplement to, and not a substitute for, our U.S. GAAP
 presentation of the property and equipment additions of our reportable segments.

                                                                                                                                                                                                                    28
APPENDIX
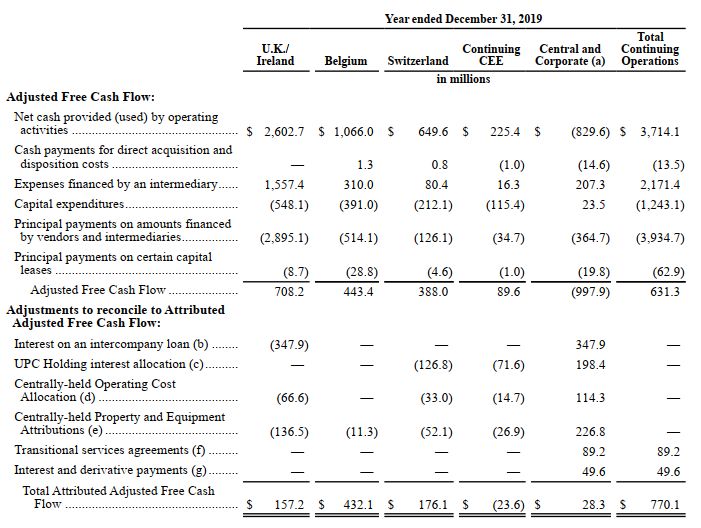
  ADJUSTED ATTRIBUTED FREE CASH FLOW
  We define adjusted free cash flow as net cash provided by our operating activities,
  plus (i) cash payments for third-party costs directly associated with successful and
  unsuccessful acquisitions and dispositions and (ii) expenses financed by an
  intermediary, less (a) capital expenditures, as reported in our consolidated statements
  of cash flows, (b) principal payments on amounts financed by vendors and
  intermediaries and (c) principal payments on finance leases (exclusive of the portions
  of the network lease in Belgium that we assumed in connection with certain
  acquisitions), with each item excluding any cash provided or used by our Discontinued
  Operations, as applicable.

  The following table provides a reconciliation of our net cash provided by operating
  activities from continuing operations to Adjusted Free Cash Flow. In addition, in order
  to provide information regarding our Adjusted Attributed Free Cash Flow, which is
  used for internal management reporting and capital allocation purposes and is
  consistent with the way in which our chief operating decision maker evaluates our
  operating segments, we have provided a reconciliation of our Adjusted Free Cash Flow
  to our Adjusted Attributed Free Cash Flow, which incorporates adjustments related to
  (i) interest on an intercompany loan, (ii) the allocation of interest within the UPC
  Holding borrowing group, (iii) the Centrally-held Operating Cost Allocation and (iv) the
  Centrally-held Property and Equipment Attribution, each as further described below.
  The Adjusted Attributed Free Cash Flow for the year ended December 31, 2019 is also
  presented on a pro forma basis as if the sale of the Discontinued Operations had been
  completed on January 1, 2019. We believe that our presentation of Adjusted Free
  Cash Flow and Adjusted Attributed Free Cash Flow provides useful information to our
  investors because these measures can be used to (a) gauge our ability to service debt
  and fund new investment opportunities and (b) in the case of our Adjusted Attributed
  Free Cash Flow, provide additional pro forma information for our operating segments
  to show what the adjusted free cash flow of our operating segments might look like
  were they to operate on a stand alone basis. Adjusted Free Cash Flow and Adjusted
  Attributed Free Cash Flow should not be understood to represent our ability to fund
  discretionary amounts, as we have various mandatory and contractual obligations,
  including debt repayments, which are not deducted to arrive at these amounts.
  Investors should view Adjusted Free Cash Flow and Adjusted Attributed Free Cash
  Flow as supplements to, and not substitutes for, U.S. GAAP measures of liquidity
                                                                                             29
  included in our consolidated statements of cash flows.
You can also read