Seeking Zen: A Post-Pandemic 3PL Market - Latest Third-Party Logistics Market Results and Predictions for 2021 Including Estimates for 190 ...
←
→
Page content transcription
If your browser does not render page correctly, please read the page content below

Seeking Zen:
A Post-Pandemic 3PL Market
Latest Third-Party Logistics Market
Results and Predictions for 2021
Including Estimates for 190 Countries
August 2021

                          Phone: +1-800-525-3915
                          Website: www.3PLogistics.com
                          Email: Armstrong@3PLogistics.com
ABOUT ARMSTRONG & ASSOCIATES, INC.
Armstrong & Associates, Inc. (A&A) was established in 1980 to meet the needs of a newly deregulated domestic
transportation market. Since then, through its leading Third-Party Logistics (3PL) market research and history of
helping companies outsource logistics functions, A&A has become an internationally recognized key resource
for 3PL market information and consulting.

A&A’s mission is to have leading proprietary supply chain knowledge and market research not available
anywhere else. As proof of our continued work in supporting our mission, A&A’s 3PL market research is
frequently cited in media articles, publications, and securities filings by publicly traded 3PLs. In addition, A&A’s
email newsletter currently has over 88,000 subscribers globally.

A&A’s market research complements its consulting activities by providing continually updated data for analysis.
Based upon its unsurpassed knowledge of the 3PL market and the operations of leading 3PLs, A&A has
provided strategic planning consulting services to over 30 3PLs, supported 24 closed investment transactions,
and provided advice to numerous companies looking to benchmark existing 3PL operations or outsource
logistics functions.

All Rights Reserved.

No part of this publication may be reproduced, stored in a retrieval system or transmitted in any form by
any means, electronic, mechanical, photocopied, recorded or otherwise, without the prior permission of the
publisher, Armstrong & Associates, Inc.

The facts of this report are believed to be correct at the time of publication but cannot be guaranteed. Please
note that the findings, conclusions and recommendations that Armstrong & Associates delivers will be based
on information gathered in good faith from both primary and secondary sources, whose accuracy we are not
always in a position to guarantee. As such, Armstrong & Associates can accept no liability whatsoever for
actions taken based on any information that may subsequently prove to be incorrect.

          ©2021 Armstrong & Associates, Inc.
U.S. 3PL MARKET

   COVID, Volatility and the Reopening
   The volatile 2020 U.S. COVID-driven Third-Party Logistics (3PL) Market created growth opportunities
   for Third-Party Logistics Providers (3PLs) with strong carrier management, e-commerce, and air freight
   forwarding capabilities, while other 3PLs did not fare as well. After having a lackluster 2019 when we saw
   a year-over-year decline in transportation activity as import tariffs took hold, we awoke to a pandemic
   nightmare in March of 2020 with vast economic shutdowns. In May things began bouncing back as
   shutdowns were dialed back and the V-shaped recovery took hold. Even with its local and regional
   economic “spits and spurts”, inventories needed to be replenished, and PPE (Personal Protective
   Equipment) drove strong air freight demand. There was no time like the present for logistics expertise,
   and 3PL prevailed as an essential industry.

   Overall, strong domestic and international transportation demand has continued into 2021 further driving
   up domestic and international transportation rates. With inventories increasing and COVID case counts
   waning, demand for 3PL services seems to be becoming more stable and manageable. As we get closer
   to herd immunity in the COVID battle, and barring any shut downs from variants, we should continue to
   see increasingly strong demand as more consumers continue to leave quarantine and boost spending.
   2021 might be the true start of our generations’ roaring 20’s.

   Armstrong & Associates’ (A&A’s) current estimates show U.S. 3PL Market gross revenues grew 8.8%,
   bringing the total U.S. 3PL Market to $231.5 billion. Most of the growth came from international and
   domestic transportation management which responded to COVID-related demands for PPE and to
   restock inventories upon economic reopenings. Overall, 2020 was a better year for 3PLs than 2019,
   which registered the Market’s first decline since 2009, but segment growth was uneven.

    Figure 1. U.S. 3PL Market 2010 - 2021E (US$ Billions)

©2021 Armstrong & Associates, Inc.                          3
U.S. 3PL MARKET

   Total 3PL segment net revenues (gross revenues less purchased transportation) grew 2.1% to $93.5
   billion reflecting gross margin compression due to a volatile carrier sourcing market and transportation
   management 3PLs spending more to secure hard-to-find carrier capacity. The overall gross margin for
   all segments declined from 44% to 41%.

    Table 1. U.S. 3PL Market Growth by Segment

                               Gross Revenue                                          2020 vs. 2019                1995-2020
                                                             Net Revenue
     3PL Segment                  (Turnover)                                          Net Revenue                 Net Revenue
                                                            (US$ Billions)
                                (US$ Billions)                                           YOY %                       CAGR

    DTM                                           91.2                      13.2                   -1.8%                        10.5%
    ITM                                           70.0                      24.6                   11.4%                        10.8%
    DCC                                           20.0                      20.0                    0.3%                         7.3%
    VAWD                                          46.7                      35.7                   -1.1%                        10.2%
    Total*                                      227.9                      93.5                     2.1%                         9.6%
   *Total 2020 gross revenue (turnover) for the 3PL market in the U.S. is estimated at $231.5 billion. $3.6 billion is included for the
   contract logistics software segment.

   International Transportation Management (ITM)
   Leading all 3PL segments for revenue growth in 2020 was International Transportation Management
   (ITM) which consists of air and ocean freight forwarding, customs brokerage, and complementary value-
   added services. Air freight revenues swelled in 2020 with the pandemic and extraordinary demand for
   PPE. With commercial passenger aircraft making up approximately 40% of total air cargo capacity, the
   pandemic upended air freight forwarding, and rates surged albeit on lower overall volumes. While air
   freight volumes are now above pre-pandemic levels, even with ongoing additions to increase air carrier
   capacity, it is still under pre-pandemic levels.

   With the economic reopenings in May of 2020, ocean freight demand came on strong as shippers
   worked on replenishing inventories. The ongoing results have been port congestion, tight container
   drayage capacity, and increased rates. “Blank Sailings” where a scheduled ship is cancelled from a route,
   and stronger ocean carrier alliances, have also reduced ocean capacity and buoyed rates.

   Overall, ITM realized a 19.2% gross revenue gain in 2020 expanding to $70 billion. While having a lower
   growth rate than overall gross revenue, due to a tight carrier capacity market, net revenue increased a
   healthy 11.4% to $24.6 billion.

   As of July 2021, the good news is that overall capacity is trending up in most ocean and air markets, as
   we dig out of the critical situation earlier this year, and port conditions in the U.S. are improving.

   For North Asia to the U.S., ocean capacity is still very tight and spot rates are continuing to rise. The air
   freight situation is improving, and spot-rate pressure is declining.

   The South Asian market is still very strained as COVID has gripped the area. Ocean capacity is declining,
   and spot rates are on the rise. Shippers are having to book 2-4 weeks in advance to get capacity. Air

©2021 Armstrong & Associates, Inc.                                 4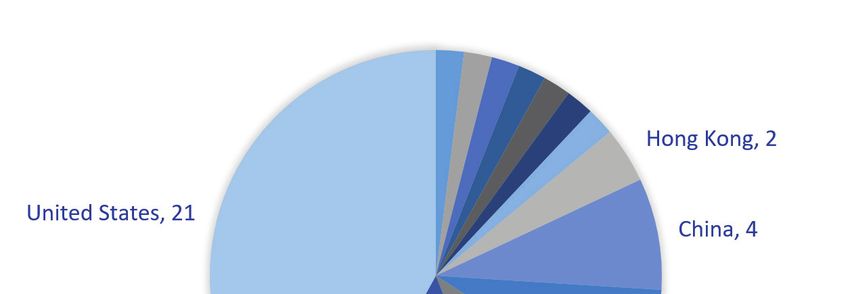
U.S. 3PL MARKET

   freight capacity is starting to improve, and spot rates are moderating.

   Europe to U.S. ocean capacity is improving, but equipment shortages in Europe are affecting port
   operations. This is forcing some shippers to utilize air freight. Air freight capacity is improving and should
   improve as more passenger aircraft come online. The main challenge now is flight cancellations.

   We expect an improving but tight carrier capacity situation going into 2022 which will keep an upward
   pressure on rates. Air capacity will continue to grow with increased passenger belly capacity availability.

   A&A’s Top 25 Global Freight Forwarders list for 2020 is provided below. This list is compiled using a
   combined overall average ranking which is based on each provider’s individual rankings for gross
   logistics revenue, ocean freight 20-foot equivalent units/containers (TEUs), and air freight metric tons
   handled in 2020. Averages for this year’s Top 25 Global Freight Forwarders show that although year-
   over-year gross logistics revenue growth was up 8.2%, ocean and air freight volumes both fell 3.2% over
   2019.

    Table 2. Top 25 Global Freight Forwarders*

                                                                            Gross Revenue                  Air Metric
          Rank                   Provider                  Headquarters                    Ocean TEUs
                                                                               (US$ M)                       Tons
            1    DHL Supply Chain & Global Forwarding      Germany                  28,453   2,862,000      1,667,000
            1    Kuehne + Nagel                            Switzerland              25,787   4,529,000      1,433,000
            2    DB Schenker                               Germany                  20,761   2,052,000      1,094,000
            2    DSV Panalpina                             Denmark                  18,269   2,204,902      1,272,405
            3    Sinotrans                                 China                    12,174   3,750,000        532,300
            4    Expeditors                                United States            10,116   1,091,380        926,730
            5    Nippon Express                            Japan                    19,347     660,152        720,115
            6    CEVA Logistics                            France                    7,416 **1,081,100        363,300
            7    C.H. Robinson                             United States            15,490   1,200,000        225,000
            7    UPS Supply Chain Solutions                United States            11,048     620,000        988,880
            8    Kerry Logistics                           Hong Kong                 6,867   1,019,924        493,903
            9    GEODIS                                    France                    9,135     866,631        290,506
            10   Bolloré Logistics                         France                    5,265     761,000        574,000
            11   Hellmann Worldwide Logistics              Germany                   2,740     905,100        552,640
            12   Kintetsu World Express                    Japan                     5,750     640,063        556,875
            13   Agility                                   Kuwait                    4,018     771,000        372,000
            14   Yusen Logistics                           Japan                     4,248     764,000        337,000
            15   CTS International Logistics               China                     2,160   1,021,007        398,175
            16   DACHSER                                   Germany                   6,591   **492,440        310,860
            17   Toll Group                                Australia                 7,260     523,300        117,400
            18   Hitachi Transport System                  Japan                     6,346     462,000        221,000
            19   Maersk Logistics                          Netherlands               6,963     401,369        138,086
            20   Apex Logistics International              Hong Kong                 2,274     190,000        750,000
            21   Logwin                                    Luxembourg                1,292     698,000        167,000
            22   Mainfreight                               New Zealand               2,467     347,638        114,736

   *Revenues and volumes are company reported or Armstrong & Associates, Inc. estimates. Revenues have been converted to
   US$ using the average annual exchange rate in order to make non-currency related growth comparisons. Freight forwarders are
   ranked using a combined overall average based on their individual rankings for gross revenue, ocean TEUs and air metric tons.
   **Includes LCL shipments.

   In the following table we provide a comparison of 12 of the largest global freight forwarders broken out
   by region. For Asia, Apex Logistics International was the clear winner. In Europe, the combined DSV
   Panalpina took the cake, and in the United States, C.H. Robinson came out on top.

©2021 Armstrong & Associates, Inc.                            5
U.S. 3PL MARKET

    Table 3. Top Global Freight Forwarders 2020 vs. 2019 Select Providers Comparison

                                                                   Gross Revenue    Ocean TEUs Air Metric Tons
                          Provider                 Headquarters
                                                                      YOY %           YOY %        YOY %
            Sinotrans                              China                     8.7%          -0.5%           6.0%
            Apex Logistics International           Hong Kong               51.6%         137.5%          44.2%
            Kerry Logistics                        Hong Kong               30.2%          -18.4%         20.6%
            Kintetsu World Express                 Japan                   13.5%           -0.7%          -1.8%
            Nippon Express                         Japan                    -3.0%          -6.1%          -4.4%
            CEVA Logistics                         France                    4.1%           3.0%        -12.7%
            DHL Supply Chain & Global Forwarding   Germany                   4.2%         -10.8%        -18.7%
            DB Schenker                            Germany                   7.3%         -10.5%          -7.8%
            DSV Panalpina                          Denmark                 27.3%           15.6%         18.8%
            Kuehne + Nagel                         Switzerland              -0.3%          -6.8%        -12.8%
            C.H. Robinson                          United States             5.9%          20.0%           7.1%
            Expeditors                             United States           23.7%           -3.0%          -3.0%

   While headquartered in Hong Kong, Apex Logistics International has significant operations in the U.S.
   and is one of the largest China/U.S. air freight forwarders. Its air freight metric tons grew 44% from
   520,000 in 2019 to 750,000 in 2020 driving a 52% increase in gross revenue to $2.3 billion. Apex Logistics
   managed multiple weekly air charters of PPE from China to the U.S. and has burgeoning e-commerce
   business. It also more than doubled its ocean freight forwarding business which ended 2020 with
   190,000 TEUs.

   In May 2021, Kuehne + Nagel completed its purchase of Apex Logistics for approximately $1.5 billion. The
   combination makes Kuehne + Nagel the largest global air freight forwarder with over 2.1 million metric
   air tons surpassing DHL Supply Chain & Global Forwarding. It also significantly expands Kuehne +
   Nagel’s Asian 3PL operating network.

   2020 marked the first full year of the combined DSV Panalpina, since the August 2019 merger of DSV
   and Panalpina, and the combination is working out nicely with double-digit growth in global 3PL
   revenues and freight forwarding volumes. The Americas division of Denmark headquartered DSV
   Panalpina also grew its top-line ITM gross revenue 38.6% to $3.2 billion and net revenue by 29.5% to
   $731.8 million with increases in both air and ocean volumes. Volume-wise, it is the third largest air freight
   forwarder globally and fourth largest ocean freight forwarder.

   C.H. Robinson, the largest Domestic Transportation Manager, saw a 6% increase in overall 3PL revenues
   in 2020. Its Global Forwarding division grew 33.2% to $3.1 billion and net revenue increased 17.8% to
   $629 million. It has been expanding rapidly in ITM via a mix of acquisitions and organic growth. In 2011,
   it had net revenue of $100 million. To add significant capabilities and operational scale, it acquired $807
   million ITM provider Phoenix International in 2012. From there, it added $251 million Aussie provider APC
   Logistics in 2016, $124 million Canadian ITM Milgram in 2017, and $84 million Madrid, Spain based Space
   Cargo in 2019.

   Expeditors International, the largest of the U.S. based freight forwarders, had a better than average
   2020 with gross revenue increasing 23.7% to $10.1 billion and net revenue increasing 11% to $2.9 billion.
   Growth primarily came from air freight where gross revenue grew a whopping 63% to $4.8 billion from
   $2.9 billion in 2019. Ocean gross revenue was up 6% to $2.4 billion. Net revenues grew at a lesser rate
   due to increased costs of purchased transportation decreasing operating profit margins in both air and

©2021 Armstrong & Associates, Inc.                          6
U.S. 3PL MARKET ocean. Dedicated Contract Carriage (DCC) The asset-heavy Dedicated Contract Carriage (DCC) 3PL segment had the second highest net revenue growth of the four 3PL segments with just 0.3% to $20 billion. Gross revenue declined 2%. The negative effect of COVID made 2020 a volatile and lower-volume year versus 2019 when DCC net revenues grew 12.1%. Traditional DCC contracts have one- to three-year terms with specific trucking assets being dedicated to customers. This makes DCC contracts much “stickier” than standard shipper/carrier trucking contracts. A&A’s market research shows dry van trailers being used for 70% of DCC truckloads, reefers 16%, flatbeds 6%, and tankers and others 8%. Three‐fourths of major DCC providers have dry vans and reefers. Half of major DCC providers have flatbeds. Customer trailers/containers are often used especially for retail operations like Walmart. Other types of equipment include bulk tankers, curtain sides, roller beds, end dumps, drop decks, and dry vans with lift gates. The DCC segment leader J.B. Hunt Dedicated Contract Services (DCS) with 9,911 power units in dedicated, posted above average net revenue growth of 3.2% to $2.2 billion making its DCC market share 11% on a net revenue basis. It has over 160 customers and A&A estimates that about half of J.B. Hunt’s dedicated tractors are tandem axle sleepers. About as many are day cabs used in regional operations. A significant part of Hunt’s DCS operations involve direct store delivery. It has also developed a large last-mile delivery network which has significant home delivery capabilities. Penske Logistics, helped by its 2020 acquisition of Black Horse Carriers and 2018 acquisition of EPES Transport System, has grown into the second largest dedicated fleet with 8,436 power units. Combined DCC revenues are estimated at over $1 billion. Werner Dedicated also generated above average growth of 2.2%, expanding net revenue to $1.1 billion. It now ranks fifth with 4,945 power units in DCC. It manages over 120 individual customer fleets ranging from one to over 100 tractors. About 70% of the fleets are managed on-site at customer locations and approximately 30% of its smaller customer fleets are managed from Werner Enterprises’ operations center in Omaha, Nebraska. We expect moderate DCC demand and growth for 2021 as the economy further rebounds. A lot will hinge upon continued strength in contract truckload rates. Domestic Transportation Management (DTM) Non-asset based Domestic Transportation Management (DTM) includes Freight Brokerage which is 83% of segment revenues and Managed Transportation which accounts for 17%. In 2020, 3PLs scrambled to find carrier capacity to meet shipper demand. Gross revenue increased 9.9% to $91.2 billion, but net revenue decreased 1.8% to $13.2 billion as volatility in motor carrier capacity quickly increased spot market rates compressing segment gross margins by 1.7%. The ongoing digitalization of transactional truckload DTM/Freight Brokerage continues at a rapid pace as more large shippers have built integrations to 3PL’s transportation management systems (TMS) for ©2021 Armstrong & Associates, Inc. 7
U.S. 3PL Market

   API (Application Program Interface) truckload spot-market rate quoting and automated load tendering
   and booking. In turn, about 20 3PLs have built TMS interfaces which provide these shippers instant rate
   quotes and the ability to complete load tendering and booking through the system APIs. This process
   automates traditional spot-market freight brokerage sales functions and is increasing shippers’ use of
   more spot versus contract pricing.

   Sales automation for spot-market truckload automation is happening in conjunction with the automation
   of carrier sales (procurement) functions within freight brokers using intelligent capacity management
   systems to digitally match shippers’ loads to carriers based upon historical and real-time carrier capacity
   data analyzed via machine learning/artificial intelligence algorithms. This Digital Freight Matching
   (DFM) capability has become a competitive differentiator within the DTM segment as DTM 3PLs look to
   increase the number of loads/shipments they manage per person per day. Ultimately, this automation
   will put further pressure on freight brokerage gross margins, while it should improve overall profitability.

   Top DTM/Freight brokers, C.H. Robinson, TQL, XPO Logistics, Hub Group and Echo Global Logistics, are
   some of the 3PLs driving industry automation along with the newer tech-first Digital Freight Brokers and
   DTM Market entrants Convoy, Transfix, and Uber Freight. At this point, most of the top freight brokers
   are strategically looking at ways to digitalize operations while adding value through improved carrier
   management, and customer and carrier experiences.

   The DTM “watch list” again includes rapidly growing Nolan Transportation Group (NTG) which had
   year-over-year net revenue growth of 33.7% to $167 million and 2020 gross revenue of $1.2 billion.
   Gryphon Investors bought a majority stake in NTG through its portfolio company Transportation Insight
   in December 2018. Nolan too is leading the digitalization charge. The combined entity now ranks third on
   our Top DTM/Freight Brokers list.

   LTL-centric Priority1 also saw rapid growth with increasing net revenue 31.7% to $79 million on gross
   revenue of $425 million. Also of mention is PepsiCo’s DTM operation, Pepsi Logistics, which grew net
   revenue 14.6% to $40 million on $469 million in gross revenue.

   Value-Added Warehousing and Distribution (VAWD)
   Rapid growth in e-commerce fulfillment could not offset the loss of business-to-business related activity
   as overall revenues for the Value-Added Warehousing and Distribution (VAWD) 3PL segment sagged in
   2020 versus its 9% growth 2019. VAWD net revenues declined 1.1% to $35.7 billion.

   VAWD 3PLs continue to benefit from growth in retail e-commerce business, which continues to be the
   fastest growing domestic 3PL segment with a compound annual growth rate of 28% since 2017. Many
   VAWD 3PLs are supporting retail brands’ strategies to manage their own order fulfillment channels
   and avoid being captive to large e-retailer platforms such as Amazon. Operationally, the growth in in
   e-commerce business has meant an expansion in multi-client warehousing/fulfillment operations; many
   having footprints of under 100,000 square feet.

   An ongoing headwind for VAWD 3PLs has been the “Amazon Effect”. 3PLs are continuing to see
   increased competition from Fulfillment by Amazon (FBA) which controls 60% of the U.S. E-commence
   3PL Market. It has dramatically impacted warehouse employee wages and lease rates in key distribution
   areas such as Plainfield, Indiana, and California’s Inland Empire. In turn, it is driving significant interest

©2021 Armstrong & Associates, Inc.                     8
U.S. 3PL Market

   from VAWD 3PLs to automate warehouses with autonomous robotic solutions. With some autonomous
   robots costing less than $500 per month to operate, the cost/benefit and positive return on investment
   are increasing 3PLs’ interest in warehouse robots to support activities such as picking, putaway, and
   cycle counting.

   In terms of North American warehousing square footage, when Amazon and its over 185 million square
   feet of estimated 3PL warehousing space is excluded, DHL Supply Chain leads the pack with 140 million
   square feet, GXO Logistics (formerly XPO Logistics) is second with 101 million, Ryder SCS is third with 64
   million, NFI is fourth with 53 million and Geodis rounds out the top five with 52.2 million square feet of
   warehousing space within North America.

   Walton, Kentucky based Verst Logistics was one of the growth leaders in 2020 with net revenue growing
   14.6% to $240 million. As a mid-market 3PL, it manages large contract packaging operations for
   customers in consumer goods, and food and beverage industries. Verst also manages a 396,000 square
   foot multi-client e-commerce fulfillment center in Hebron, Kentucky.

   RLS Logistics, a mid-market 3PL based in Newfield, New Jersey focusing on refrigerated and frozen
   food, also had a good year with 18% revenue growth to $123 million. RLS has 20 million cubic feet of
   refrigerated warehousing space in the U.S. Its service offering includes frozen pick/pack e-commerce
   fulfilment operations and refrigerated and frozen less-than-truckload consolidation. In September 2020,
   RLS expanded its presence in northeast Pennsylvania with the acquisition of third-generation, family-
   owned cold storage provider Gress Refrigerated Services & Logistics.

   In terms of U.S. segment net revenue compound annual growth rates, ITM has surpassed DTM with a
   CAGR of 10.8% since 1995. The most mature segment, DCC, has grown only 7.3% versus its double-digit
   contenders and is seeing growing competition from Dedicated Truckload Capacity (DTC) providers.

    Figure 2. U.S. 3PL Market Segment Net Revenues (US$ Millions) and CAGRs*

               $41,000
               $39,000
               $37,000
               $35,000                                                                                10.2%
               $33,000
               $31,000
               $29,000
               $27,000
               $25,000                                                                                10.8%
               $23,000
               $21,000
               $19,000                                                                                 7.3%
               $17,000
               $15,000
               $13,000
               $11,000                                                                                10.5%
                $9,000
                $7,000
                $5,000
                $3,000
                $1,000

                                Value-Added Warehousing & Distribution (VAWD) - Asset Based
                                Dedicated Contract Carriage (DCC) - Asset Based
                                International Transportation Management (ITM) - Non-Asset Based
                                Domestic Transportation Management (DTM) - Non-Asset Based

   *CAGRs are from 1995-2020.

©2021 Armstrong & Associates, Inc.                                9
U.S. 3PL MARKET
In Dedicated Truckload Capacity, a provider agrees to provide ongoing trucking capacity to a customer
account in specific lanes or routes, and equipment can be shared between customers versus traditional
DCC. In a recent study conducted by A&A, it was found that DTC is growing at over five times the rate of
traditional DCC.
Going into 2021, ITM and DTM remain the strongest segments with year-over-year gross revenue growth
expected at an astounding 42.5% and 22.3%, respectively, over 2020. Segment net revenues should see
double-digit growth as well.
Overall, the U.S. 3PL Market is expected to grow 24% to $287 billion.
Table 4. U.S. 3PL Segment Growth Predictions for 2021
2021E
2021E vs. 2020 2021E 2021E vs. 2020
Gross Revenue
3PL Segment Gross Revenue Net Revenue Net Revenue
(Turnover)
(YOY %) (US$ Billions) (YOY %)
(US$ Billions)
DTM 111.5 22.3% 15.8 20.3%
ITM 99.8 42.5% 30.6 24.2%
DCC 21.0 4.8% 21.0 4.8%
VAWD 50.9 8.9% 38.6 8.2%
Total* 283.2 23.9% 106.0 13.4%
*Total 2021 gross revenue (turnover) for the 3PL market in the U.S. is estimated at $286.9 billion. $3.7 billion is included for the
contract logistics software segment.
Top U.S. 3PLs
On this year’s Top 50 list, after mainstays C.H. Robinson, XPO Logistics and UPS Supply Chain Solutions,
the largest U.S. freight forwarder Expeditors passed J.B. Hunt for fourth place; although Hunt remains a
Top 5 player for the foreseeable future.
Transportation Insight and Total Quality Logistics hit Top 10 status this year pushing out Ryder Supply
Chain Solutions and Hub Group. Total Quality Logistics, also the fourth largest DTM, achieved this via
organic growth. Whereas 4PL, Transportation Insight, was helped by acquisitions. The most notable
being, Nolan Transportation Group, making the combined entity the third largest DTM.
New to this year’s list are the Americas operations of Netherlands based Maersk Logistics (Primarily
the former Damco. The brand was discontinued in October 2020), and Hong Kong’s Kerry Logistics as
well as U.S. based 3PLs AIT Worldwide Logistics, Ascent Global Logistics, Capstone Logistics and Uber
Freight.
AIT was helped by recent purchases of UK based next-day delivery specialist, Panther Logistics,
in November 2020 and Germany’s Fiege Group’s international freight forwarding division, Fiege
Forwarding, a month later. In March, AIT was taken over by private equity firm The Jordan Company in
what is expected to mark the start of another period of growth.
©2021 Armstrong & Associates, Inc. 10U.S. 3PL MARKET
U.S. Express and Cardinal Logistics Management just missed the list at 51st and 52nd, respectively.
Radiant Logistics, Nippon Express (Americas), Neovia Logistics, and SEKO fell a few notches.
Table 5. Top 50 U.S. 3PLs by Gross Logistics Revenue
2020 Gross Revenue
Rank Provider
(US$ Millions)*
1 C.H. Robinson 15,490
2 XPO Logistics 12,107
3 UPS Supply Chain Solutions 11,048
4 Expeditors 10,116
5 J.B. Hunt 9,198
6 Kuehne + Nagel (Americas) 6,789
7 DHL Supply Chain (North America) 4,415
8 Coyote Logistics 4,280
9 Transportation Insight/Nolan Transportation Group 4,270
10 Total Quality Logistics 4,138
11 Burris Logistics 4,100
12 DSV Panalpina (Americas) 4,020
13 Ryder Supply Chain Solutions 3,774
14 Hub Group 3,646
15 Transplace 3,400
16 Penske Logistics 3,200
17 Schneider 2,814
18 NFI 2,631
19 DB Schenker (North America) 2,627
20 GEODIS (North America) 2,543
21 Echo Global Logistics 2,512
22 Ingram Micro Commerce & Lifecycle Services 2,300
23 Landstar 2,196
24 FedEx Logistics 2,100
24 MODE Transportation 2,100
25 CEVA Logistics (Americas) 2,000
26 Americold 1,983
27 GlobalTranz Enterprises 1,651
28 Worldwide Express/Unishippers 1,650
29 Lineage Logistics 1,645
30 BDP International 1,552
31 Werner Logistics 1,527
32 Knight-Swift Transportation 1,430
33 Maersk Logistics (Americas) 1,300
33 TransGroup Global Logistics 1,300
34 Ruan 1,223
35 AIT Worldwide Logistics 1,220
36 syncreon 1,203
37 Radial 1,200
38 Universal Logistics Holdings 1,190
39 Nolan Transportation Group 1,172
40 Kerry Logistics (Americas) 1,115
41 Capstone Logistics 1,040
42 Odyssey Logistics & Technology 1,018
43 Uber Freight 1,011
44 Ascent Global Logistics 974
45 Crane Worldwide Logistics 916
46 OIA Global 876
47 Pilot Freight Services 874
48 APL Logistics (Americas) 867
**Revenues cover all four 3PL Segments (DTM, ITM, DCC and VAWD), are company reported or A&A estimates, and have been
converted to US$ using the annual average exchange rate.
©2021 Armstrong & Associates, Inc. 11GLOBAL COSTS AND REVENUE
Global Logistics Market and Third-Party Logistics
Revenues
Global Third-Party Logistics (3PL) Market revenues reached $962 billion in 2020 resulting in a meager
0.1% increase over 2019 versus the U.S. 3PL Market which saw 8.8% year-over-year growth. As with the
U.S., the ITM segment led the way due to COVID-19 response.
For 2021, we expect a rise of over 15% in 3PL revenues globally as the market continues to evolve
unevenly with some countries still being significantly impacted by COVID-19 versus those with higher
vaccination rates.
Over the next three years, through 2023, we estimate the global 3PL market will see a CAGR near 10%.
Developed countries with longstanding transportation and warehouse contracting practices have
the largest 3PL revenues. Developing countries are growing at faster rates, but have lower total 3PL
revenues. The numbers reflect the greater outsourcing of functions to 3PLs in developed and more
economically sophisticated countries.
Table 6. 2020-2021E Global Logistics Market and 3PL Segment Revenues by Country/Region (US$ Billions)
2020 3PL 2020 ITM 2020 VAWD 2020 TM 2021E Logistics 2021E 3PL 2021E ITM 2021E VAWD 2021E TM
Country/Region 2020 Logistics Cost
Revenue Revenue Revenue Revenue Cost Revenue Revenue Revenue Revenue
Algeria 23.8 1.9 0.6 0.5 0.8 25.0 2.0 0.7 0.5 0.8
Egypt 30.0 2.6 0.8 0.7 1.1 30.0 2.6 0.9 0.7 1.0
Morocco 17.0 1.4 0.4 0.4 0.6 18.6 1.6 0.6 0.4 0.6
Nigeria 69.1 5.1 1.6 1.3 2.2 82.8 6.2 2.2 1.6 2.4
South Africa 32.9 3.4 1.1 0.9 1.5 35.9 3.8 1.3 1.0 1.5
Sudan 6.0 0.5 0.1 0.1 0.2 6.3 0.5 0.2 0.1 0.2
Africa-Others 165.3 12.9 4.0 3.3 5.6 180.0 14.3 5.0 3.6 5.5
Africa Total 344.2 27.9 8.5 7.0 12.0 378.6 30.9 10.9 7.8 12.0
Australia 116.9 12.4 3.8 3.1 5.4 139.1 14.9 5.3 3.8 5.8
Bangladesh 51.3 4.3 1.3 1.1 1.8 55.1 4.6 1.6 1.2 1.8
Brunei Darussalam 1.8 0.2 0.0 0.0 0.1 2.3 0.2 0.1 0.0 0.1
Cambodia 4.3 0.3 0.1 0.1 0.1 4.5 0.4 0.1 0.1 0.1
China 2,134.8 227.4 69.7 57.5 98.2 2,413.1 259.4 91.5 65.6 100.3
Hong Kong 29.7 3.4 1.0 0.9 1.5 31.3 3.6 1.3 0.9 1.4
India 351.8 26.0 8.0 6.6 11.2 396.1 29.7 10.5 7.5 11.5
Indonesia 233.1 18.0 5.5 4.5 7.8 254.9 19.9 7.0 5.0 7.7
Japan 429.1 46.8 14.3 11.8 20.2 457.1 50.3 17.7 12.7 19.4
Lao P.D.R. 3.4 0.3 0.1 0.1 0.1 3.6 0.3 0.1 0.1 0.1
Macao SAR 2.4 0.3 0.1 0.1 0.1 3.9 0.4 0.1 0.1 0.2
Malaysia 44.0 3.3 1.0 0.8 1.4 50.3 3.8 1.3 1.0 1.5
Myanmar (Burma) 14.0 1.1 0.3 0.3 0.5 13.1 1.0 0.4 0.3 0.4
New Zealand 23.4 2.3 0.7 0.6 1.0 27.3 2.7 1.0 0.7 1.1
Philippines 47.1 3.5 1.1 0.9 1.5 52.3 3.9 1.4 1.0 1.5
Singapore 28.9 3.5 1.1 0.9 1.5 31.8 3.9 1.4 1.0 1.5
South Korea 146.7 16.9 5.2 4.3 7.3 162.5 18.8 6.6 4.8 7.3
Sri Lanka 15.1 1.1 0.3 0.3 0.5 15.8 1.1 0.4 0.3 0.4
Taiwan 60.4 6.8 2.1 1.7 2.9 68.5 7.8 2.8 2.0 3.0
Thailand 75.3 5.8 1.8 1.5 2.5 80.8 6.3 2.2 1.6 2.4
Vietnam 68.2 5.4 1.7 1.4 2.3 71.0 5.7 2.0 1.4 2.2
Asia Pacific-Others 15.3 1.2 0.4 0.3 0.5 16.1 1.3 0.4 0.3 0.5
Asia Pacific Total 3,896.9 389.9 119.6 98.7 168.5 4,350.6 440.0 155.2 111.3 170.2
Kazakhstan 24.9 2.1 0.6 0.5 0.9 28.4 2.4 0.9 0.6 0.9
Russia 237.2 19.2 5.9 4.9 8.3 256.2 20.9 6.9 5.3 8.5
Ukraine 24.1 2.0 0.6 0.5 0.9 26.2 2.2 0.8 0.5 0.8
CIS-Others 42.8 3.4 1.0 0.9 1.5 46.0 3.7 1.3 0.9 1.4
CIS Total 329.1 26.7 8.2 6.8 11.6 356.7 29.2 9.9 7.4 11.7
©2021 Armstrong & Associates, Inc. 12TOP GLOBAL 3PLS
2020 Logistics 2020 3PL 2020 ITM 2020 VAWD 2020 TM 2021E 2021E 3PL 2021E ITM 2021E VAWD 2021E TM
Country/Region
Cost Revenue Revenue Revenue Revenue Logistics Cost Revenue Revenue Revenue Revenue
Austria 35.9 3.9 1.2 1.0 1.7 40.3 4.3 1.5 1.1 1.7
Belgium 41.1 4.4 1.3 1.1 1.9 46.4 5.0 1.8 1.3 1.9
Czech Republic 21.5 2.4 0.7 0.6 1.0 24.6 2.7 1.0 0.7 1.1
Denmark 30.8 3.2 1.0 0.8 1.4 34.4 3.6 1.3 0.9 1.4
Finland 22.8 2.4 0.7 0.6 1.1 25.3 2.7 1.0 0.7 1.0
France 228.2 23.8 7.0 4.8 11.8 258.0 27.0 9.1 4.8 12.8
Germany 308.5 32.4 9.8 6.5 15.8 350.3 36.9 12.8 6.5 17.2
Greece 23.4 2.1 0.7 0.5 0.9 25.9 2.4 0.8 0.6 0.9
Hungary 15.5 1.7 0.5 0.4 0.7 17.7 2.0 0.7 0.5 0.8
Ireland 32.4 3.8 1.2 1.0 1.7 36.9 4.4 1.5 1.1 1.7
Italy 169.4 17.4 5.1 3.5 8.6 189.2 19.5 6.6 3.5 9.3
Netherlands 67.5 9.9 2.9 2.0 4.9 75.2 11.0 3.7 2.0 5.2
Norway 32.4 3.3 1.0 0.8 1.4 39.7 4.1 1.4 1.0 1.6
Poland 60.3 6.1 1.9 1.6 2.7 65.2 6.6 2.3 1.7 2.6
Portugal 24.4 2.5 0.8 0.6 1.1 27.1 2.7 1.0 0.7 1.1
Romania 28.6 2.9 0.9 0.7 1.2 33.4 3.4 1.2 0.9 1.3
Spain 105.0 10.7 3.1 2.2 5.3 120.0 12.3 4.1 2.2 5.8
Sweden 42.2 4.4 1.3 1.1 1.9 49.1 5.1 1.8 1.3 2.0
Switzerland 62.1 6.6 2.0 1.7 2.8 68.6 7.2 2.6 1.8 2.8
United Kingdom 230.2 22.6 6.6 4.6 11.2 265.3 26.1 8.8 4.6 12.4
Europe-Others 71.8 7.2 2.2 1.8 3.1 81.2 8.1 2.9 2.1 3.1
Europe Total 1,653.7 173.8 52.0 38.0 82.2 1,873.8 197.1 67.9 39.9 87.7
Iran 103.0 8.3 2.6 2.1 3.6 110.6 9.1 3.2 2.3 3.5
Israel 45.5 4.5 1.4 1.1 1.9 50.5 5.0 1.8 1.3 2.0
Pakistan 41.0 3.4 1.0 0.9 1.5 41.0 3.4 1.2 0.9 1.3
Saudi Arabia 91.2 8.4 2.6 2.1 3.6 104.6 9.7 3.4 2.5 3.8
Turkey 89.2 8.5 2.6 2.1 3.7 98.5 9.5 3.3 2.4 3.7
United Arab Emirates 35.4 3.6 1.1 0.9 1.6 40.2 4.2 1.5 1.1 1.6
Middle East-Others 93.6 7.8 2.4 2.0 3.4 105.3 8.9 3.1 2.3 3.5
Middle East Total 498.9 44.6 13.7 11.3 19.3 550.7 49.8 17.6 12.6 19.3
Canada 147.9 15.7 4.8 4.0 6.8 169.5 18.1 6.3 4.6 7.1
Mexico 129.1 13.9 4.2 3.5 6.1 143.1 15.6 5.4 3.9 6.1
United States 1,674.6 231.5 70.0 46.7 111.2 1,814.0 286.9 99.8 50.9 132.5
North America-Others 73.8 6.3 1.9 1.6 2.7 79.2 6.8 2.4 1.7 2.6
North America Total 2,025.5 267.4 80.9 55.8 126.8 2,205.8 327.5 114.0 61.2 148.3
Argentina 46.6 4.3 1.3 1.1 1.9 50.2 4.7 1.7 1.2 1.8
Brazil 166.4 15.6 4.8 4.0 6.8 173.0 16.4 5.8 4.2 6.4
Chile 29.1 2.8 0.9 0.7 1.2 35.4 3.5 1.2 0.9 1.4
Colombia 33.9 2.9 0.9 0.7 1.3 37.0 3.2 1.1 0.8 1.2
Peru 25.5 2.2 0.7 0.6 1.0 28.2 2.5 0.9 0.6 1.0
Venezuela 5.6 0.4 0.1 0.1 0.2 5.1 0.4 0.1 0.1 0.1
South America-Others 36.8 3.0 0.9 0.8 1.3 38.5 3.2 1.1 0.8 1.2
South America Total 343.8 31.4 9.6 8.0 13.6 367.4 34.0 12.0 8.6 13.1
Grand Total 9,092.1 961.8 292.5 225.5 433.9 10,083.7 1,108.6 387.4 248.8 462.3
Sources: International Monetary Fund WEO April 2021, Nominal GDP forecast, Armstrong & Associates, Inc.
Top Global 3PLs
The Top 10 3PLs on this year’s list are fairly the same compared to 2019 except DB Schenker replaced
Nippon for 3rd, Sinotrans and XPO swapped places for 7th and 8th and Expeditors rounded out the Top
10 replacing J.B. Hunt.
Providers’ that have scaled this year’s list include GEODIS, NFI and Ingram Micro Commerce & Lifecycle
Services.
GEODIS’s revenues were reevaluated and now include its European last-mile delivery operations driving
its rank from 16th to 12th place.
©2021 Armstrong & Associates, Inc. 13TOP GLOBAL 3PLS
NFI grew its revenues 23.5% and its rank from 42nd to 36th. With acquisitions including Long Beach,
California based port logistics provider CalCartage and Canadian 3PL Dominion Warehousing &
Distribution, NFI’s distribution footprint is now 53 million square feet and consists of warehousing,
e-commerce, automated, cross-dock, transloading, and customs examination facilities. Its August 2020
acquisition of CAI Logistics, the non-asset logistics division of CAI International, Inc., marks NFI’s 20th
acquisition since 2000.
For Ingram Micro Commerce & Lifecycle Services, it’s all in the name. E-commerce is its game and it’s
playing well. Ingram Micro Commerce & Lifecycle Services is one of the largest B2C and B2B operations
in the country. It made its first debut on our Global list last year coming in at 46th place (from 53rd) and
this year it lands at 41st.
New to this year’s list are two Asia based companies. Hong Kong headquartered Apex Logistics
International and its 52% year-over-year increase in revenues landed it at 42nd place. China based, CTS
International Logistics, has freight forwarding as its core. The segment accounted for 70% of its business
in 2020. Other services CTS provides include cross-border e-commerce logistics, project logistics,
warehousing, and aviation supplies logistics.
APL Logistics and Worldwide Express/Unishippers, both at the bottom of the list last year, fell off this
year. However, with Worldwide Express’ recent merger with GlobalTranz and the combined company
generating $3.3 billion revenues in 2020, we expect it will place nicely on the list in 2021.
Table 7. Top 50 Global 3PLs by Gross Logistics Revenue
2020 Gross Revenue
Rank Provider
(US$ Millions)*
1 DHL Supply Chain & Global Forwarding 28,453
2 Kuehne + Nagel 25,787
3 DB Schenker 20,761
4 Nippon Express 19,347
5 DSV Panalpina 18,269
6 C.H. Robinson 15,490
7 Sinotrans 12,174
8 XPO Logistics 12,107
9 UPS Supply Chain Solutions 11,048
10 Expeditors 10,116
11 J.B. Hunt 9,198
12 GEODIS 9,135
13 CEVA Logistics 7,416
14 Toll Group 7,260
15 CJ Logistics 7,174
16 Maersk Logistics 6,963
17 Kerry Logistics 6,867
18 DACHSER 6,591
19 Hitachi Transport System 6,346
20 Kintetsu World Express 5,750
21 Bolloré Logistics 5,265
22 GEFCO 4,464
23 Coyote Logistics 4,280
24 Transportation Insight/Nolan Transportation Group 4,270
25 Yusen Logistics 4,248
26 Total Quality Logistics 4,138
27 Burris Logistics 4,100
28 Agility 4,018
29 Ryder Supply Chain Solutions 3,774
30 Hub Group 3,646
©2021 Armstrong & Associates, Inc. 14TOP GLOBAL 3PLS
2020 Gross Revenue
Rank Provider
(US$ Millions)*
31 Transplace 3,400
32 SAIC Anji Logistics** 3,202
33 Penske Logistics 3,200
34 Schneider 2,814
35 Hellmann Worldwide Logistics 2,740
36 NFI 2,631
37 Echo Global Logistics 2,512
38 Sankyu 2,491
39 Mainfreight 2,467
40 Imperial Logistics 2,334
41 Ingram Micro Commerce & Lifecycle Services 2,300
42 Apex Logistics International 2,274
43 Landstar 2,196
44 CTS International Logistics 2,160
45 FedEx Logistics 2,100
45 MODE Transportation 2,100
46 Groupe CAT 1,990
47 Americold 1,983
48 ID Logistics Group 1,930
49 Fiege Logistik 1,925
*Revenues cover all four 3PL Segments (DTM, ITM, DCC and VAWD), are company reported or A&A estimates, and have been
converted to US$ using the annual average exchange rate.
**In-house logistics revenues were capped at 50% for fairness.
In this year’s global Top 50, the number of U.S. based 3PLs that made the list fell from 22 to 21. Due to
CEVA Logistics’ headquarters move from Switzerland to France, Switzerland fell from 2 to 1 and France
gained another Top 50 Global 3PL. China’s CTS International Logistics and Hong Kong based Apex
Logistics International made the list growing China’s Global 3PL count from 3 to 4 and Hong Kong’s
from 1 to 2. Singapore based APL Logistics fell off the list bringing Singapore’s Global 3PL count to zero;
however, parent Japan headquartered Kintetsu World Express moved up two notched becoming a Top
20 Global 3PL.
Figure 3. Top 50 Global 3PLs by Country
Australia, Denmark, Kuwait,
Netherlands, New Zealand,
South Africa, Switzerland, 1 each
©2021 Armstrong & Associates, Inc. 15MERGERS & ACQUISITIONS
Merger and Acquisition Activity
Where COVID is still raging, M&A activity is still muted. In countries where vaccines have stemmed the
spread, M&A activity is on the rise.
2020 saw eight large 3PL M&A deals with purchase prices over $100 million including one billion-dollar
deal slipping in at the end of 2020. Although the number of large deals is down from 2019’s level, 2021
has already experienced 11 large deals in just the first seven months with several $1B+ deals starting
to flourish in July. With the 3PL market as strong as it is, there are a lot of 3PL sellers eyeing up big
valuations.
Figure 4. 3PL Acquisitions over $100 Million 1999-July 2021
20
18 18
16
14
12 12
11 11 11
10
9 9
8 8
6 6
5 5 5 5 5
4 4 4
3 3 3
2 2
1 1
0 0
Americold snagged 2020’s largest deal with its purchase of the world’s fourth-largest temperature-
controlled operator, Agro Merchants Group, for $1.74 billion. Based in the Netherlands, Agro’s facilities
cover 236 million cubic feet across 10 countries in Europe, North America, South America and Australia.
After closing, Americold’s warehousing footprint comprised 229 owned and managed facilities and 1.35
billion refrigerated cubic feet of space.
Americold also made two additional purchases over $100 million in 2020. In January 2020, Americold
acquired Canada’s Nova Cold Logistics, and its 19 million cubic feet of temperature-controlled storage
space in Canada, from Brookfield Business Partners for $260.5 million. In its second largest deal of
2020, Americold bought New Jersey based, regional warehousing 3PL Hall’s Warehouse Corp. for $480
million. The deal added 1.6 million square feet of frozen, refrigerated, and dry warehousing space in
eight locations throughout New Jersey to Americold’s warehousing footprint. Americold also snatched
up two of the three $1 billion plus deals that were made in 2019.
Americold’s closest competitor, Lineage Logistics, also made the “purchases over $100 million” club
in 2020 with its acquisition of Emergent Cold for $900 million in June 2020. Just before the purchase,
Emergent Cold had acquired Polarcold, New Orleans Cold Storage, and Oxford Cold Storage
expanding Lineage’s footprint of facilities in the Asia Pacific region.
©2021 Armstrong & Associates, Inc. 16MERGERS & ACQUISITIONS In April 2020, Netherlands based Maersk acquired U.S. cross dock and international deconsolidation and distribution specialist Performance Team for $545 million including lease liabilities of around $225 million. With its footprint of facilities on both coasts (Los Angeles and New York/New Jersey), Dallas, and the Southeastern U.S. region and similar industry focus on consumer electronics, home goods, apparel/ footwear and retail, Performance Team should fit nicely in Maersk’s North American logistics portfolio. In March 2020, C.H. Robinson finalized its $225 million acquisition of Prime Distribution Services (PDS) from Roadrunner Transportation. PDS is a provider of retail consolidation and value-added warehousing and distribution services in North America. The addition expands C.H. Robinson’s retail consolidation business and adds some company-owned warehousing capability to its domestic service offering. In another $225 million dollar deal, Canada’s TFI International acquired DLS Worldwide in November 2020. Previously a business unit of R.R. Donnelley & Sons Company, Bolingbrook, Illinois based DLS Worldwide provides its logistics services through a network of internal sales personnel, commissioned sales agents and agent-stations. The acquired business will continue to operate as a standalone within TFI International’s Logistics segment under its new name “TForce Worldwide, Inc.” As for major 2021 deals, in February, it was announced that SF Holdings and Kerry Logistics were merging. SF, which has most of its operations within the PRC, will benefit from Kerry’s international expansion since its 2013 IPO and growing operations in Southeast Asia and Europe. Kerry Logistics’ business portfolio encompasses contract logistics, international freight forwarding, warehousing, transportation, distribution, trading, merchandising and a wide variety of value-added services and is now managing 52 million square feet of warehouse space, logistics centers and port facilities globally. Its International Freight Forwarding division accounts for 60% of revenues, and its Integrated Logistics division, mainly value-added warehousing and distribution, accounts for the rest. The Greater China region generates about half of gross revenues. Kerry Logistics has acquired several freight forwarders allowing it to expand internationally in countries such as Spain, Italy, Germany, Africa, and the U.S. Its joint venture with Dubai based freight forwarder, Globalink Logistics DWC LLC, expands Kerry Logistics’ coverage in Central Asia and the CIS region. Other recent joint ventures include expansion in e-commerce and food/cold chain logistics. In August 2019, the group acquired a majority interest in Turkey’s ASAV Logistics Services Inc. to further the expansion of its global network. On March 31, 2020, the group completed the acquisition of the remaining 49% in U.S. based Apex Maritime, the third largest NVOCC in terms of volume from Asia to the U.S. in 2019, at a consideration of approximately $176 million. The acquisition of Apex Logistics International, and its rapidly growing air freight forwarding and air charter operations, by Kuehne + Nagel for $1.2 billion was finalized in May. Apex has significant charter operations from China to the U.S. and has been developing significant air freight capacity out of Southeast Asia including Vietnam. Apex Logistics has grown quickly serving e-commerce, high-tech, and healthcare customers. Closer to home, in June 2021, Worldwide Express and GlobalTranz Enterprises announced their merger creating the 7th largest Domestic Transportation Manager/Freight Broker in the U.S. with combined 2020 gross revenue of $3.3 billion and the 32nd largest global 3PL. It combines Worldwide Express’ small parcel network and SMB customer focus with GlobalTranz’s LTL, TL freight brokerage and ©2021 Armstrong & Associates, Inc. 17
MERGERS & ACQUISITIONS

   managed transportation capabilities allowing for significant cross-selling opportunities. Worldwide
   Express will also be able to benefit from GlobalTranz’s proprietary technology platform which is above
   average among leading freight brokers.

   We would also be amiss if we didn’t mention Uber Freight’s recent $2.25 billion acquisition of Transplace.
   It combines Uber’s growing transactional Digital Freight Brokerage operations with Transplace’s leading
   managed transportation operations, which should avail itself to good cross-selling opportunities. Both
   have similar continuous improvement cultures and aren’t afraid to invest in leading tech.

©2021 Armstrong & Associates, Inc.                   18
Market Research
 New Releases from Armstrong & Associates, Inc.

                                                Expert Information Service (E.I.S.)
                                                Our premium market research and analysis offering includes
                                                access to our most popular 3PL market research reports and a
                                                subscription to our leading 3PL guide, Who’s Who in Logistics
                                                Online. Discounted phone consulting is available.

                                                INCREASINGLY
                                                 TRENDS INSTRATEGIC:
                                                TRENDS IN 3PL / CUSTOMER
                                                 3PL / CUSTOMER
                                                RELATIONSHIPS
                                                 RELATIONSHIPS
                                                May 2020

                                                  November 2016

                                                                       Phone: +1-800-525-3915
                                                                       Website: www.3plogistics.com
                                                                       Email: Armstrong@3plogistics.com

Digitization – The Convergence                   Increasingly Strategic –                                           Rising Tide –
of Modern Freight Brokerage, Digital                 Trends in 3PL / Customer                                   The Rapid Growth of
 Freight Matching, and Automation                         Relationships                                      E-Commerce Logistics, 3PL
    in Domestic Transportation                                                                              Solutions, Last-Mile Delivery,
           Management                                                                                      and the Dominance of Amazon

  Since our first report on Digital Freight     This definitive analysis is an expanded                     This comprehensive report covers the
  Matching (DFM) in 2016 where we dubbed        update of Armstrong & Associates’ best-                     growth of e‐commerce logistics in the
  the term “Digital Freight Matching”, there    selling report. From its analysis of over                 U.S., e-commerce fulfillment and last-mile
  has been increasing focus on these            7,700 current 3PL customer relationships                     delivery, third-party logistics provider
  companies which have been seen by             in 44 countries, totaling nearly 21,000                   alternatives to Amazon, Amazon’s leading
  investors as market disruptors. This report   services, the report identifies and                       market position, and an “apples-to-apples”
  details the convergence of DFM, modern        details key trends in outsourced third-                    cost comparison between Fulfillment by
  Domestic Transportation Managers,             party logistics provider (3PL) customer                    Amazon (FBA) and 3PL solutions using
  and Digital Freight Brokers. It provides      relationships. Armstrong & Associates                       our proprietary e-commerce fulfillment
  insights into what systems drive a 3PL’s      has been tracking and analyzing 3PL/                           pricing benchmarks from 21 3PLs
  classification as a DFB and what systems      Customer relationships for over a decade                      representing over 1,000 customers.
  can be deployed to augment a TMS              with ever-increasing detail.
  and digitalize a DTM/Freight Brokerage
  operation.

               Reports are available for purchase at http://www.3plogistics.com
You can also read