Planning for State Transportation Revenue in a Coming Era of Electric Vehicles - WHITE PAPER
←
→
Page content transcription
If your browser does not render page correctly, please read the page content below

WHITE PAPER

   Planning for State
Transportation Revenue
   in a Coming Era of
    Electric Vehicles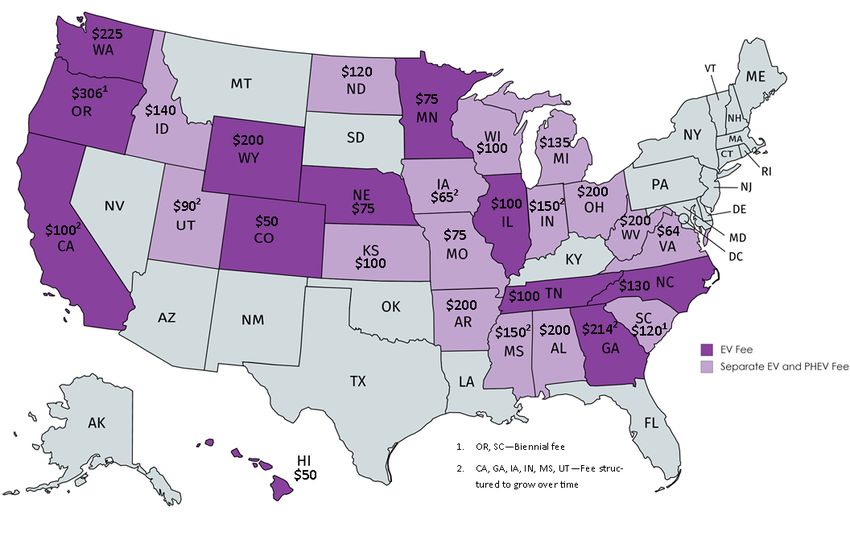
State Transportation Revenue in a Coming
                    Era of Electric Vehicles

                           AUTHORS
                         Jake Varn
                        Policy Analyst

 Energy, Infrastructure and Environment Division
          NGA Center for Best Practices
                  jvarn@nga.org

                    Garrett Eucalitto
                     Program Director

 Energy, Infrastructure and Environment Division
          NGA Center for Best Practices

                       Sue Gander
                      Division Director

 Energy, Infrastructure and Environment Division
          NGA Center for Best Practices

The NGA Energy, Infrastructure and Environment Division thanks
the state officials and other experts who attended the Experts’
Roundtable in November 2019 that informed this paper. NGA
appreciates the additional experts who offered insights and feedback.
NGA also thanks the Energy Foundation for its support of the
roundtable and publication of this paper.

       Recommended Citation Format
Varn, J., Eucalitto, G., & Gander, S. (2020, February). Planning for
state transportation revenue in a coming era of electric vehicles.
Washington, DC: National Governors Association Center for Best
Practices.

                                 -2-
State Transportation Revenue in a Coming
Era of Electric Vehicles
Executive Summary
States face a grave transportation funding situation: Revenues are not keeping pace with needs as
vital infrastructure assets reach the end of their designed life cycle and populations grow and shift.
The funding gap is significant. According to an estimate from the American Society of Civil
Engineers, $1.4 trillion in additional funding is required to meet the country’s infrastructure needs
by 2025, and that gap is growing. At current funding levels, the gap will rise to $4.3 trillion by 2040.1
Traditionally, states have relied on a variety of revenue sources for transportation funding under a
“user pays, user benefits” principle that roughly approximates a “user fee” to at least some degree.
These sources include vehicle registration fees, tolls and state and federal gas and diesel taxes, also
known as “motor fuel taxes,” which represent the largest portion of revenue, ranging from 29% to
60% of state revenue. Fees and tolls are often regularly adjusted, and 31 states have increased their
motor fuel taxes in the past six years, but a combination of factors has diminished the value of motor
fuel taxes over time. Such factors include the rising fuel efficiency of vehicles, a shifting federal-state
cost share on infrastructure investments and inflation (for taxes that are not indexed, which
includes the federal motor fuel taxes that has remained at the same price since 1993 and 33 state
taxes). Across all levels of government, the proportion of user-fee funding for highways has fallen
over time. In 1965, user revenue accounted nearly 75% of spending, as of 2012, it has fallen to under
50%.2
As states are facing these challenges, the transportation sector is moving toward greater
electrification. This shift is occurring as the technology improves, consumer appeal increases and
states and others support greater electric vehicle (EV) use stemming from benefits for: economic
development, sustainability, cost savings, health outcomes, air quality, climate change and fuel
security. The move also spans multiple fleets, including personal, private and government-owned
light-duty, transit and medium- and heavy-duty vehicles.
The growing popularity of EVs is adding to states’ concerns about transportation funding. Vehicle
electrification will ultimately lessen a mainstay of traditional sources of funding for the
transportation system: motor fuel taxes. However, EVs currently make up less than 1% of the
nation’s total fleet and only 2% of new sales across the United States. Even in states with the highest
EV adoption — California, Oregon and Washington — EV sales make up less than 8% of all
new vehicle sales. EVs are expected to grow in popularity, although estimates vary. The Edison
Electric Institute (EEI) projects that EVs could account for 7% of the total light-duty fleet in the
United States by 2030, or 18.7 million of the projected 259 million light-duty vehicles on the road.3
Concern with this growth, while not yet a reality, coupled with concern about the larger
-3-State Transportation Revenue in a Coming
Era of Electric Vehicles
transportation funding shortfall, has prompted more than half of states to introduce an additional
annual registration fee on EVs, ranging from $50 to $225 per year.
Many have raised concerns about the adoption of EV registration fees and question the role of EVs
in the transportation funding crisis. A first-order concern is that EV registration fees do not
currently make a significant contribution to the goal of supporting transportation revenue, and in
fact, they may adversely affect the goal of advancing EV adoption, particularly because the fees are
annually paid all at once, up front. A nationwide survey by the University of California Institute of
Transportation Studies (UC ITS) found that even a $100 annual EV registration fee reduced
consumers’ likelihood of purchasing a battery-powered EV by 11%; it reduced their likelihood of
purchasing a plug-in hybrid by 18%.4 Notably, in conversations with the Oregon Department of
Transportation, officials suggested that their analysis of new vehicle sales found that consumers
were insensitive to registration and title fee changes. A related problem is that annual, upfront
registration fees disproportionately affect lower-income vehicle purchasers in contrast with motor
fuel taxes, which are paid incrementally at the pump. Further, there are overarching concerns that
any imposition of an EV fee will increase overall costs and therefore weaken adoption incentives
and the implicit cost drivers that encourage higher fuel efficiency. Some states have balanced these
concerns by developing plans to only adopt EV-specific fees when the share of EVs reach a certain
level within the overall fleet.
A second area of concern is that some view the fee amounts adopted in some states as greater than
the equivalent amount of taxes paid by similar gasoline-fueled vehicles. Thus, fees are seen as
creating an inequitable approach to maintaining the road network. Consumer Reports has issued
the most comprehensive version of such an analysis, in which the authors determined that of the 28
states that charge an extra registration fee for EVs, 11 have set the fee higher than the equivalent
gasoline taxes that new car owners pay.5 The issue of equivalency is complex, including which
metrics should be used to determine the “equivalent” of gasoline taxes, because of the rising and
varied nature of fuel efficiency between the average vehicle in the fleet compared with new vehicles,
making it an issue that states must examine carefully. The Consumer Reports analysis set a metric
for EV fees as “justifiable” if it provides the same highway funding revenue as the average new
gasoline vehicle. Further complicating matters, the user-pay model embodied by motor fuel taxes
does not provide for a simple one-to-one comparison. The added wear and tear on the
transportation system attributable to each light-duty passenger vehicle is low because most roads
are designed and built to withstand the significantly higher weight of freight vehicles. This is the
case even for EVs, which are slightly heavier than other light-duty vehicles. In principle, each user
-4-State Transportation Revenue in a Coming
Era of Electric Vehicles
is expected to contribute to use the road, but the physical impact on the roadway is generally not
proportionally considered.
These dynamics presents a dilemma for decision makers who want to advance policy goals to
support transportation electrification and meet transportation funding needs. This dilemma is
particularly pronounced in the 28 states that have an extra EV registration fee. Of those states, eight
also have a goal for EV adoption, and they and others have EV tax incentives, outreach programs or
other adoption efforts in place. At the state level, this dilemma plays out in executive and legislative
branch priorities; the most pronounced example being state departments of transportation that
may have a directive specifically on reducing emissions, while simultaneously maintaining existing
systems and achieving longstanding transportation missions of service delivery and performance.
The role of revenue sources directly drives and shapes many of these decisions. Governors can help
meet these two distinct yet interconnected goals by considering the broad range of existing and
emerging policy options available and by collaborating across state agencies and stakeholders to
craft solutions.
The developments and concerns surrounding EVs have prompted a broader consideration of how
states are approaching their transportation revenue needs, and the various incentives and
disincentives that are associated with each potential revenue source. Efforts to explore alternative
approaches have centered on how best to reflect the user-pays principle. These efforts are driving
an examination of how states, including those that are debating to retain or adopt an EV fee, can
dampen these areas of concern. Some measures that states are adopting or considering include:
• Increasing existing motor fuel tax rates.
• Indexing motor fuels to inflation.
• Implementing mileage-based user fees (MBUFs), also known as “road usage charges” (RUCs).
• Studying fuel-neutral fees, based on energy consumption.
This paper examines a variety of funding methods in an era of increased electrification of the
transportation sector. In addition, it highlights best practices from across the country. As
policymakers look to the 2020 legislative session and weigh decisions about current and future
sources of transportation revenue, governors can consider these measures to help their state better
plan for a robust, sustainable and equitable approach to transportation revenue. Such efforts help
ensure that transportation revenue sources and the mechanisms implemented for collection align
with broader state policy goals. This document is intended to help states develop a comprehensive
approach for addressing long-term transportation infrastructure needs that avoids dampening EV
sales while simultaneously encouraging EV adoption through other programs and incentives.
-5-State Transportation Revenue in a Coming
Era of Electric Vehicles
Introduction
In 2019, cross-agency teams from 40 states and territories participated in four regional workshops
that the National Governors Association (NGA) hosted on transportation electrification. The
findings of these regional workshops, published in the paper “Transportation Electrification: States
Rev Up” emphasized the need for collaboration among state agencies to ensure diverse interests at
the table.6 The discussions held during these workshops included an examination of transportation
funding and the fees imposed on EV. The findings led NGA to prepare this white paper to help states
explore the topic further. This paper was later informed by an experts’ roundtable, hosted by NGA
on Nov. 4, 2019, and follow-up discussions with experts.
Background
State transportation networks and the agencies that construct, operate and maintain them are
facing pressures that require an increase in spending and investment. In 2017, state and local
governments collectively spent an estimated $240 billion on infrastructure operations and
maintenance — nearly a 10% increase from the prior decade.7 Critical pieces of state transportation
systems that were built 30, 40 and 50 years ago are nearing the end of their designed life cycle.
Meanwhile, Americans are driving more than ever before, in both light-duty and heavy-duty
vehicles. Collectively, vehicle-miles travelled in the United States have risen from 2.57 trillion miles
in 1998 to 3.2 trillion miles in 2018.8 This increase in mileage results in increased wear and tear on
the 4.1 million miles of public highways and the nearly 615,000 bridges in the United States.9
Importantly, since the completion of the interstate highway system, federal investment in
transportation infrastructure has largely stagnated. In 1980, the federal-state share of spending on
transportation and water infrastructure was 63% state and local spending and 37% federal. Today,
state and local governments account for 78% of all infrastructure spending, and the federal
government’s share has fallen to 22%.10
The portfolio of revenue sources for funding transportation infrastructure and operations varies
from state to state, but the primary source for most states and territories is motor fuel taxes, which
were first used by Oregon in 1919.11 In 2016, 29% of state highway funding was raised through state
motor fuel taxes. For some states, motor fuel taxes account for as much as 60% of highway funding;
for at least 20 states, motor fuel taxes are the single largest source of revenue.12
However, most state motor fuels taxes have not been indexed to rise with inflation, weakening their
purchasing power. Only 22 states have variable motor fuel taxes indexed to inflation, the consumer
price index or other factors.13 In addition, the federal motor fuel tax has remained at the same
level — 18.4 cents per gallon for gasoline and 24.4 cents per gallon for diesel — since 1993, losing
73% of its value to inflation.14
In addition to inflation, the incremental rise in fuel efficiency of the vehicle fleet has affected revenue
from motor fuel taxes. Since 2004, the average fuel economy for new vehicles has increased by
29%.15 Vehicle miles traveled have increased, as well, but that increase has been more than offset by
the combination of inflation and increased fuel efficiency, leading to a net decrease of 18% in federal
motor fuel tax revenue and a 7% decrease at the state level between 1999 and 2013 (see Figure 1).16
-6-State Transportation Revenue in a Coming
Era of Electric Vehicles
Figure 1: Fuel Consumption and Vehicle-Miles Traveled as Indices: 1960-2011
1.8
1.6
1.4
1.2
Indexed in 1987
1
0.8
0.6
0.4
0.2
0
1960 1965 1970 1975 1980 1985 1990 1995 2000 2005 2010
Vehicle Miles of Travel Motor Fuel Consumption Gallons per Vehicle
Source: Federal Highway Administration: Highway Statistics Series 2011.17
To supplement motor fuel taxes, states collect revenue from tolls, vehicle sales taxes, general sales
taxes and vehicle registration fees (see Figure 2 and Table 1).
-7-State Transportation Revenue in a Coming
Era of Electric Vehicles
Figure 2: State Revenues Used For Highways, 2014-2017 (Thousands of Dollars)
Source: Federal Highway Administration: Highway Statistics Series 2014-2017.18
-8-State Transportation Revenue in a Coming
Era of Electric Vehicles
Table 1: Percentage of State Transportation Revenue Sources
Motor Motor Vehicle and Road and Other
Fuel Motor Carrier Crossing State General
Year Taxes Bonds Taxes Tolls Fees Miscellaneous Funds
2014 24.5% 23.8% 18.9% 9.5% 8.0% 7.8% 7.5%
2015 25.7% 20.5% 21.8% 9.1% 8.3% 9.3% 5.2%
2016 27.0% 17.4% 20.2% 9.8% 9.9% 10.1% 5.6%
2017 25.2% 22.8% 20.9% 9.6% 9.2% 8.1% 4.3%
As noted above, EVs comprise a marginal percentage of vehicles in all states. Yet, as EV sales have
increased, several states have implemented additional registration fees for EVs as a means to raise
new revenue or collect revenue that would otherwise have been collected through a gas tax.
Consumer Reports conducted a comprehensive analysis in which the authors determined that of
the 28 states that charge an extra registration fee for EV owners, 11 have set the fee higher than the
equivalent gasoline taxes that new car owners pay.19 The issue is complex, and agencies must decide
which metrics governments should use to determine the “equivalent” of gasoline taxes based on the
rising and varied nature of fuel efficiency between the average vehicle in the fleet and new vehicles
(see Figure 3), while acknowledging that flat registration fees do not account for variance in usage
or mileage.20
Figure 3: Annual EV Registration Fees by State
Between January 2011 to July 2019, only 677,000 battery-powered EVs were sold in the United
States.21 In comparison, 17.3 million total vehicles were sold in 2018 alone, adding to the total light-
duty fleet of 259 million vehicles.22 Projections for future EV sales vary and may largely depend on
future policy decisions. According to a recent report from EEI and the Institute for Electric
-9-State Transportation Revenue in a Coming
Era of Electric Vehicles
Innovation, EVs could account for 7% of the total light-duty fleet in the United States by 2030 —
18.7 million of the projected 259 million light-duty vehicles.23 Barring any unforeseen change in
policy or technology, the current rate of adoption of EVs does not pose an immediate threat to
transportation revenue through significant losses in motor fuel taxes, especially compared with the
ongoing effects of inflation.
States are looking to spur vehicle electrification based on a variety of motivations, including the
benefits of economic development, sustainability, cost savings, health outcomes, air quality, climate
change and fuel security. Vehicle electrification can support emissions reductions and play a vital
role in improving public health. A 2016 study estimated that the avoided health costs associated
with EVs, from reduced emissions of fine particulate matter that can cause early death,
cardiovascular issues, respiratory damages and other harms, amounts to nearly $1,700 over the life
cycle of each vehicle.24 The emissions footprint of an EV depends on manufacturing practices, like
all vehicles, and the electricity sources the vehicle uses, but overall an EV has less than half of the
lifetime carbon emissions of the average internal combustion engine (ICE) vehicle, based on the
emission profile of the electricity grid in 2016. Emissions associated with EVs would fall to less than
1/10th of an ICE vehicle if the electricity used to charge those vehicles came from 100% renewable
or carbon-free energy, such as nuclear power.25
For individual drivers, there are motivations to purchase an EV beyond societal benefits. One key
motivator for buyers is the appeal of lower maintenance and fuel costs over the lifespan of the
vehicle. According to the U.S. Environmental Protection Agency (EPA), with the latest models of
EVs, drivers can save up to $1,000 per year in fuel costs and nearly $1,500 in maintenance costs
over the life of the vehicle.26
State governments have implemented EV fees largely based on the user-pay principle. Several
aspects of the user-pay principle, however, have been misunderstood in these policy debates. For
example, a recurrent view is that the slightly higher curb weight of light-duty battery-powered EVs
inflicts a greater portion of wear and tear on the roads and that, under a strict application of the
user-pay principle, drivers of EVs should pay more. Current EV models do have a heavier curb
weight than their ICE counterparts, but the impact on the roadway is negligible because roads are
built to high levels of performance. Indeed, the user-pay principle has historically not incorporated
the proportional physical roadway impacts of heavier vehicles. For example, a single 18-wheeler
with a fully loaded weight of 80,000 pounds produces physical road and bridge damage equivalent
to 9,600 light-duty vehicles.27 The external cost to build and maintain highway infrastructure that
can accommodate freight travel is not proportional to the levied user fees.28
If EV fees are set at a level that significantly decreases the affordability of the vehicle or offsets the
financial benefit that motivates its purchase, the fees can be counterproductive to states making
efforts to reduce pollution and carbon emissions and increase electrification. A nationwide survey
from UC ITS found that a $100 annual registration fee reduced the likelihood of people purchasing
a battery-powered EV by 11% and reduced people likelihood of purchasing a plug-in hybrid vehicle
by 18%.29 Registration fees, including extra fees for EVs, also have associated equity concerns
stemming from the disproportionate impact imposed on low-income drivers and their lump-sum
nature compared with the incremental approach of a motor fuel tax.
- 10 -State Transportation Revenue in a Coming
Era of Electric Vehicles
Importantly, increasing the affordability of EVs has been a key incentive strategy to increase
adoption rates. Notably, 45 states have policies to further incentivize the sale of EVs through
additional tax credits or rebates, high-occupancy vehicle lane exemptions, emission testing or
inspection exemptions, parking incentives, utility rate reductions, alternative fuel technology loans
and financial incentives for commercial fleets and charging infrastructure.30,31 Participants at NGA’s
roundtable noted that, compared to other financial incentive strategies, foregoing a fee could be one
of the lowest-cost ways for states to encourage EV adoption.
Revenue Policy Levers, Impacts and Goals
As governors head into the 2020 legislative session and beyond, they will likely encounter one or
more transportation revenue policy options, each with many considerations. To address the
dilemma of securing sufficient transportation revenue while supporting EV sales growth, an
opportunity exists to examine best practices to date to enact new policies or improve existing
revenue mechanisms. Some of the leading approaches governors can consider include a mix of
tried-and-true and evolving mechanisms: motor fuel taxes, MBUFs, general registration fees, sales
taxes, fuel-neutral fees or taxes and EV fees. Table 2 profiles these options, which are described in
more detail below. Additional measures such as congestion pricing, carbon taxes, weight-based fees,
and external-cost taxes are also being considered to varying degrees at federal, state and local levels.
Table 2: Matrix of Transportation Revenue Policy Options
Mileage- General
Motor Fuel Based User Registration Fuel Neutral Electric
Tax Fees Fees Sales Tax Fees or Taxes Vehicle Fees
Can account for
Does not Does not Does not
Accounts for usage, requires
Usage and Accounts for account for account for account for
usage and specific design
Mileage mileage. usage and usage and usage and
mileage. to account for
mileage. mileage. mileage.
mileage.
Requires Requires Requires
Does not
Encourages specific design specific design Encourages fuel specific design
Fuel Efficiency consider fuel
fuel efficiency. to encourage to encourage efficiency. to encourage
efficiency.
fuel efficiency. fuel efficiency. fuel efficiency.
Costs are
Costs are Costs can be
Cost Costs are spread Costs are disassociated Costs are
spread over spread over
Distribution over time. upfront. and spread over upfront.
time. time.
time.
Obscures
Discourages EV
Annual upfront connection to
Susceptible to EV charging fees adoption and
Majority of fees affect the transportation
inflation and require further requires
states have not affordability of systems and
Policy long-term testing to additional
studied how to car ownership competes with
Considerations trends in fleet account for design to
enact an MBUF for lower- other policy
efficiency and usage and avoid support EV-
system. income objectives that
electrification. fare evasion. specific
households. rely on sales
infrastructure.
taxes.
- 11 -State Transportation Revenue in a Coming
Era of Electric Vehicles
Motor Fuel Taxes
Every state levies motor fuel taxes, but only 22 states have variable rate structures that adjust to
keep pace with either inflation or the price of gas.32 Since 2013, 31 states have raised their state
motor fuel taxes. When set at an adequate level and given a variable structure to avoid the
cumulative diminishing effects of inflation, motor fuel taxes are still a powerful source of
transportation revenue that have the added benefit of encouraging vehicle fuel efficiency. There is
also an array of innovative proposals to modernize the gas tax, including proposals to link the gas
tax with EPA’s mileage-per-gallon equivalency metric, 33 or to index motor fuel taxes to the average
fuel economy, as used in used in some states.34
Considerations:
• Without being indexed to inflation or another variable metric, the purchasing power of
motor fuel tax revenue will continue to diminish over time as vehicles continue to become
more fuel efficient. The rise in EV sales poses long-term risks to motor fuel taxes as a leading
revenue stream, but the projected adoption rates suggest that well-maintained motor fuel
taxes will remain a viable and effective transportation revenue source for the next decade.
Mileage-Based User Fees
As an alternative to the gas tax, several states have begun to study, test and implement an MBUF,
also known as a RUC. MBUFs set a per-mile rate, with mileage reported through physical
inspections of the vehicle’s odometer or digitally through a device plugged into the car’s OBD-II
port. Notably, the federal government has encouraged the development of MBUF programs through
the U.S. Department of Transportation’s Surface Transportation System Funding Alternatives grant
program.
The Oregon Department of Transportation’s OReGO has become one of the most advanced pilots
of an MBUF system. Established in 2015, OReGO operates on a volunteer basis, with a set rate of
1.7 cents per mile. The state legislature indexed the MBUF rate to the fuel tax rate so as fuel tax
increases occur, the MBUF rate increases as well. Volunteers have a variety of mileage reporting
options, including a choice between devices. Volunteers can use either a global positioning system
(GPS)-equipped device and supporting app or a non-GPS OBD-II device. Volunteers receive a credit
of state fuel tax as fuel is used to drive taxable miles. Starting in 2020, registered owners of vehicles
that are rated at 40+ miles per gallon that are enrolled in the OReGO program can avoid paying the
enhanced registration fee.
Starting in 2020, EV and hybrid vehicle drivers in Utah will have an option to pay a RUC in lieu of
an increased annual fee.35 Similar to Oregon’s MBUF program, the Utah RUC will operate on a
volunteer basis, but it will be available only for alternative-fuel vehicles. The mileage rate is initially
set at 1.5 cents per mile and will annually adjust for inflation. Volunteers will have the option to use
an OBD-II device, telematics, a smartphone app or manual odometer reporting.
On the East Coast, the I-95 Corridor Coalition is operating a multistate MBUF pilot to study both
in-state mileage and out-of-state mileage reporting. The coalition has also begun studying a
multistate truck pilot for interstate freight mileage. Currently, volunteers in the I-95 pilots are not
paying a fee and are receiving simulated monthly bills.36
- 12 -State Transportation Revenue in a Coming
Era of Electric Vehicles
Considerations:
• MBUFs present many benefits as an alternative or replacement for the gas tax. MBUFs offer
policy flexibility and can be applied in a fuel-neutral manner. However, if applied without
consideration for the vehicle’s fuel efficiency, there is a concern that MBUFs can also have a
negative impact on the adoption of EVs and on the cost pressures that drive the overall
efficiency of the total fleet.
• These approaches are relatively new, but there have been challenges, including concerns
over privacy and higher administrative costs (compared with other revenue mechanisms):
o OReGO has found that targeted messaging and communication efforts have
alleviated some privacy concerns. OReGO has also implemented strict privacy
policies for the data that the department and private partners collect. OReGO
account managers must undergo and maintain certification and are contractually
obligated to protect personally identifiable information.37
o Higher administrative costs are expected to decline as these programs grow and a
market develops to provide services to the public.
• Mileage does not occur in a vacuum. Related policy areas, such as land-use, affordable
housing and the availability of other mobility options, can have a dramatic effect on the
average mileage required for people to meet their basic needs.
General Registration Fees
All states require that vehicles be registered and
titled for residents in their state. Vehicle
registration fees are typically levied annually or OTHER GENERAL FEES
biennially. Charges range from $15 to $300,
depending on the state and the age or value of States have also levied a variety of one-time or
the vehicle. Notably, vehicle registration fees reoccurring fees to offset costs of a particular
vary widely from state to state, both in terms of service and provide additional revenue,
including:
the rate level and in the assessed vehicle metrics.
• Driver’s license fees.
As of 2019, every state has a vehicle registration
• Insurance background check fees.
fee; 12 states scale these fees by the weight of the • Transportation network company
vehicle, and 16 states adjust the fee based on the fees.
vehicle’s price or age.38 On average, general
vehicle registration fees account for nearly 22%
of state transportation funding, and nine states
collect at least 40% of their funding through registration fees.39 Notably, the same inflation-related
concerns that apply to motor fuel taxes affect nonvariable or indexed registration fees.
Considerations:
• Because registration fees are typically levied only annually or biennially and are paid in a
single lump sum, the unexpected expense can catch vehicle owners by surprise. According
to the Federal Reserve, nearly 40% of Americans are unable to seamlessly cover an
unexpected bill of $400.40 Overall, low-income households already spend a disproportionate
share of their income on transportation. According to the U.S. Bureau of Labor Statistics,
the average household spends 15% of its annual expenditures on transportation. However,
households in the lowest segment spend upwards of 58% of their income on transportation-
related expenses.41 The annual lump-sum nature of registration fees also stands in sharp
- 13 -State Transportation Revenue in a Coming
Era of Electric Vehicles
contrast to the incremental nature of motor fuel taxes or the monthly billing options of
MBUFs.
• Registration fees do not have the policy flexibility that MBUFs or motor vehicle taxes offer
to serve as a tax on fuel consumption or vehicle usage.
Sales Taxes
Several states raise a significant portion of their total transportation revenue from general sales
taxes and taxes on individual items such as alcohol and tobacco. In 2018, voters in 34 states passed
58% of the proposed transportation-related ballot measures, approving over $40 billion for a variety
of projects.42 This trend continued in 2019, with voters in 20 states passing over 100 transportation
ballot measures, totaling $8 billion in investments.43 Of the 2019 ballot measures, there were 28
proposals related to sales taxes for transportation across state and local government, of those, 18
passed (seven new or increased taxes).
Considerations:
• Although an effective revenue-generating option, sales taxes have been criticized for having
the effect of disassociating and obscuring the cost of the transportation system from the
general public.44
• For states without a history of levying a sales tax for transportation, a new tax or adjustment
of a current tax could place infrastructure in direct competition with other policy areas and
programs that already rely on a sales tax for funding.
• Sales taxes on non-essential items can distribute the burden of transportation infrastructure
that currently disproportionately falls on low-income people.
Fuel-Neutral Fees or Taxes
Similar to experiments with MBUFs, policy makers are examining mechanisms to collect
transportation revenue based on fuel consumption, either in addition to or regardless of mileage –
creating a gas tax equivalent that is neutral to a vehicle’s fuel type. For these models, capturing the
fuel consumption of fully electric and hybrid vehicles requires either tracking and setting a rate for
the charging of those vehicles, or applying a generalized rate based on the vehicle model.
Utilities, researchers and policymakers have begun experimenting with the potential of levying fees
on drivers of EVs through vehicle charging. Charging fees based on kilowatt-hours are analogous to
the pay-at-the-pump nature of motor fuel taxes, but this concept is not without its complications.
Precisely measuring where and when an EV is charging to determine the appropriate fee or tax
requires a combination of submetering and on-vehicle technology. Today, some utilities are making
inroads for this approach, offering EV owners specific overall energy rates, as well as discounts and
special rates for off-peak charging.
Alternatively, rather than tracking the specific charging location, policymakers and researchers are
also examining a vehicle model-based approach to fuel neutral fees or taxes. The EPA’s mileage-
per-gallon equivalency (MPGe) metric provides a rate for vehicles that do not use liquid fuels,
including fully electric vehicles, plug-in hybrids, and compressed natural gas vehicles, quantifying
how many miles each vehicle could travel if “using a quantity of fuel with the same energy content
as a gallon of gasoline.”45 Utilizing the MPGe metric, a fuel neutral fee or tax would set a universal
rate for all vehicles, fees or taxes would then be levied on an annual basis, or spread over time, for
vehicles that are not paying at the pump.46
- 14 -State Transportation Revenue in a Coming
Era of Electric Vehicles
Considerations:
• Charging-specific fees require further study and testing to accurately account for usage and
avoid the risk of fare evasion. Most charging occurs at home for individuals with garages or
driveways, and submetering would likely necessitate electrical infrastructure installation.
• Taxes and fees on publicly available charging infrastructure could discourage their use and
hinder EV adoption efforts at a time when many states are experimenting with ways to
increase user adoption.
• Levying fuel neutral fees or taxes based on the vehicle model’s mileage-per-gallon or MPGe
would require supportive policies and on-vehicle technology or manual mileage reporting
similar to the MBUF approach in order to account for the actual usage and mileage of all
vehicles.
• As with all fees and taxes, indexing for inflation would be necessary to prevent the
purchasing power of any fuel-neutral fee or tax revenue from diminishing over time.
Electric Vehicle Fees
As of 2019, 28 states have levied annual registration fees specifically for EVs. Although EV fees can
be crafted to align with the “user-pay” principle of transportation funding, these fees can also place
a disproportionate burden on drivers of EVs compared with drivers of ICE vehicles, conflict with
broader state policy goals and weaken a nascent industry. In some cases, the introduction of EV
fees, coinciding with the removal of EV purchasing incentives has been tied to considerable declines
in EV sales.47
Considerations:
• From an administrative cost perspective, EV registration fees are a relatively low-cost option
as a revenue source. However, specifically how the fees are set and collected can have a
tremendous impact on equity, affordability and adoption rates. For states that are
considering imposing a new EV fee or looking to revise their existing fee structures, a few
best practices have emerged. For example, using an equivalency metric for comparing EV
efficiency with ICE vehicles can help set an equitable rate structure. Some states have also
sought to dedicate a portion of the revenue from EV fees to the installation or construction
of EV charging infrastructure. In Alabama, EV owners must pay an additional $200 annual
fee. However, 25% of the revenue collected will be dedicated to the state’s Electric
Transportation Infrastructure Grant Program to support the installation and construction
of EV charging infrastructure.
• Applying a flexible collection method on EV fees can also help maintain their affordability.
For fees that are at a relatively significant level, particularly in the $100 or more range,
allowing for monthly or quarterly payment options could help alleviate the financial impact
of registration fees, which disproportionately affect low-income households.
• Some states have decided to postpone enacting any EV fees until these vehicles hit a more
significant proportion of the market share or of the total fleet within the state, other states
have decided to convene multi-agency commissions to conduct comprehensive studies of
the various revenue options to plan for future scenarios.
• Without additional policy mechanisms, these fees are not connected to mileage driven. As
such, those who drive an EV a low number of miles will pay more per mile than those who
drive an EV further, creating a disparity between EV drivers and the amount paid for road
usage.
- 15 -State Transportation Revenue in a Coming
Era of Electric Vehicles
Conclusion
Meeting transportation revenue needs for investment, maintenance and operations is a pressing
challenge for governors. This challenge is made more difficult by the diminishing purchasing power
of motor fuel taxes, driven primarily by inflation and the rising fuel efficiency of the overall fleet.
Despite these trends, the gradually increasing popularity of EVs has attracted the attention of
policymakers as an opportunity to bolster transportation revenue. However, creating an equitable
user-pay revenue stream from EVs is a complex matter and one that may not necessarily align with
broader state goals.
While general vehicle registration fees have become a mainstay in the transportation revenue
ecosystem, the nature of an annual flat fee can have a disproportionate impact on low-income
drivers and weaken fuel efficiency incentives. Further, some of the registration fees levied
specifically on owners of EVs to date have been enacted at levels significantly higher than the fees
and taxes collected from owners of an average new vehicle. Overall, EV fees, especially those set at
exceptionally high levels, can have a detrimental impact on EV adoption rates.
States that are currently examining this issue should consider how transportation revenue sources
can align with broader state emission and long-term electrification goals by coordinating across
related agencies, including transportation, energy and environmental protection, and by consulting
with relevant stakeholders and advocates.
- 16 -State Transportation Revenue in a Coming
Era of Electric Vehicles
Citations
1American Society of Civil Engineers. (2016). Failure to act: Closing the infrastructure investment gap for America’s
economic future. Retrieved from https://www.infrastructurereportcard.org/wp-content/uploads/2016/10/ASCE-
Failure-to-Act-2016-FINAL.pdf
2
Dutzik, Tony and Weissman, Gideon. (2015). Who Pays for Roads? How the “Users Pay” Myth Gets in the Way
of Solving America’s Transportation Problem. Retrieved from
https://frontiergroup.org/sites/default/files/reports/Who%20Pays%20for%20Roads%20vUS.pdf
3Cooper, A., & Schefter, K. (2018, November). Electric vehicle sales forecast and the charging infrastructure
required through 2030. Retrieved from
https://www.edisonfoundation.net/iei/publications/Documents/IEI_EEI%20EV%20Forecast%20Report_Nov2018.p
df
4 Jenn, A. (2018, December). Assessing alternatives to California’s electric vehicle registration fee. Retrieved from
https://escholarship.org/uc/item/62f72449
5Harto, C., & Baker-Branstetter, S. (2019, September). Rising trend of punitive fees on electric vehicles won’t dent
state highway funding shortfalls but will hurt consumers. Retrieved from https://advocacy.consumerreports.org/wp-
content/uploads/2019/09/Consumer-Reports-EV-Fee-analysis.pdf
6 Rogotzke, M., Eucalitto, G., & Gander, S. (2019, September). Transportation electrification: States rev up. Retrieved
from https://www.nga.org/wp-content/uploads/2019/09/2019-09-15-NGA-White-Paper-Transportation-
Electrification-States-Rev-Up.pdf
7 Congressional Budget Office. (2018, October). Public spending on transportation and water infrastructure, 1956 to
2017. Retrieved from https://www.cbo.gov/system/files/2018-10/54539-Infrastructure.pdf
8 U.S. Department of Transportation Federal Highway Administration, Policy and Governmental Affairs, Office of
Highway Policy Information. (2019). Travel monitoring: Traffic volume trends. Retrieved from
https://www.fhwa.dot.gov/policyinformation/travel_monitoring/tvt.cfm
9 American Road & Transportation Builders Association. (2017, September). Highways policy. Retrieved from
https://www.artba.org/government-affairs/policy-statements/highways-policy
10 Congressional Budget Office. (2018, October). Public spending on transportation and water infrastructure, 1956
to 2017. Retrieved from https://www.cbo.gov/system/files/2018-10/54539-Infrastructure.pdf
11 Oregon Department of Transportation. (n.d.). Fuels tax. Retrieved from
https://www.oregon.gov/ODOT/FTG/Pages/About-Us.aspx
12 U.S. Department of Transportation Federal Highway Administration, Policy and Governmental Affairs, Office of
Highway Policy Information. (2018, June 29). Highway statistics 2016: Revenues used by states for highways - 2016
1/. Retrieved from https://www.fhwa.dot.gov/policyinformation/statistics/2016/sf1.cfm
13 National Conference of State Legislatures. (2019, April 11). Variable rate gas taxes. Retrieved from
http://www.ncsl.org/research/transportation/variable-rate-gas-taxes.aspx
14 Congressional Budget Office. (2019). Increase excise taxes on motor fuels and index for inflation. Retrieved from
https://www.cbo.gov/budget-options/2018/54817
U.S. Environmental Protection Agency. (2019, March). The 2018 EPA automotive trends report: Greenhouse gas
15
emissions, fuel economy, and technology since 1975 (Report No. EPA-420-S-19-001). Retrieved from
https://nepis.epa.gov/Exe/ZyPDF.cgi?Dockey=P100W3WO.pdf
16 Vock, D. C. (2015, May 18). States, not just feds, struggle to keep gas tax revenue flowing. Governing. Retrieved
from https://www.governing.com/topics/transportation-infrastructure/gov-gas-tax-revenue-states-inflation.html
17 U.S. Department of Transportation Federal Highway Administration, Policy and Governmental Affairs, Office of
Highway Policy Information. (2014, November 7). Highway statistics series. Vehicle registrations, fuel consumption,
and vehicle miles of travel as indices: 1960-2011. Retrieved from
https://www.fhwa.dot.gov/policyinformation/statistics/2011/rc1c.cfm
18 U.S. Department of Transportation Federal Highway Administration, Policy and Governmental Affairs, Office of
Highway Policy Information. (2014, November 7). Highway statistics 2014: Revenues used by states for highways -
2014 1/. Retrieved from https://www.fhwa.dot.gov/policyinformation/statistics/2014/sf1.cfm
19 Harto, C., & Baker-Branstetter, S. (2019, September). Rising trend of punitive fees on electric vehicles won’t dent
state highway funding shortfalls but will hurt consumers. Retrieved from
https://advocacy.consumerreports.org/wp-content/uploads/2019/09/Consumer-Reports-EV-Fee-analysis.pdf
- 17 -State Transportation Revenue in a Coming
Era of Electric Vehicles
20 Harto, C., & Baker-Branstetter, S. (2019, September). Rising trend of punitive fees on electric vehicles won’t dent
state highway funding shortfalls but will hurt consumers. Retrieved from
https://advocacy.consumerreports.org/wp-content/uploads/2019/09/Consumer-Reports-EV-Fee-analysis.pdf
21 Auto Alliance. (n.d.). Advanced technology vehicle sales dashboard. Retrieved from https://autoalliance.org/energy-
environment/advanced-technology-vehicle-sales-dashboard
22 U.S. Department of Transportation Bureau of Transportation Statistics. (2019). “U.S. automobile and truck fleets
by use. Retrieved from https://www.bts.gov/content/us-automobile-and-truck-fleets-use
23 Cooper, A., & Schefter, K. (2018, November). Electric vehicle sales forecast and the charging infrastructure
required through 2030. Retrieved from
https://www.edisonfoundation.net/iei/publications/Documents/IEI_EEI%20EV%20Forecast%20Report_Nov2018.
pdf
24 Malmgren, I. (2016). Quantifying the societal benefits of electric vehicles. World Electric Vehicle Journal, 8(4),
996–1007.
25 Cornell, R. (2019). The climate change mitigation potential of electric vehicles as a function of renewable energy.
International Journal of Climate Change: Impacts and Responses 11(1), 15–24. https://doi.org/10.18848/1835-
7156/CGP/v11i01/15-24
26 Malmgren, I. (2016). Quantifying the societal benefits of electric vehicles. World Electric Vehicle Journal, 8(4),
996–1007.
27 Eschwege, H. (1979, July 23). Truck weight and its effect on highways. Retrieved from
https://www.gao.gov/assets/100/99181.pdf
28 Austin, D. (2015, March). Pricing freight transport to account for external costs (Working Paper No. 2015-03).
Retrieved from https://www.cbo.gov/sites/default/files/114th-congress-2015-2016/workingpaper/50049-
Freight_Transport_Working_Paper-2.pdf
29 Jenn, A. (2018, December). Assessing alternatives to California’s electric vehicle registration fee. Retrieved from
https://escholarship.org/uc/item/62f72449
30 U.S. Department of Energy, Office of Energy Efficiency & Renewable Energy. (n.d.). Electric vehicles: Tax credits
and other incentives. Retrieved from https://www.energy.gov/eere/electricvehicles/electric-vehicles-tax-credits-and-
other-incentives
31 Hartman, K., & Dowd, E. (2017, September 26). State efforts to promote hybrid and electric vehicles. Retrieved
from http://www.ncsl.org/research/energy/state-electric-vehicle-incentives-state-chart.aspx
32 National Conference of State Legislatures. (2019, April 11). Variable rate gas taxes. Retrieved from
http://www.ncsl.org/research/transportation/variable-rate-gas-taxes.aspx
33 Baumhefner, M. (2019, August 2). A simple way to fix the gas tax forever. Retrieved from
https://www.nrdc.org/experts/max-baumhefner/simple-way-fix-gas-tax-forever
34 American Road & Transportation Builders Association. (2016, August). The economic cost of allowing Georgia’s
inflation-based variable gas tax rate to sunset: More than $33 billion in state economic activity at stake. Retrieved
from https://www.artba.org/wp-content/uploads/2017/09/Georgia_Report_August_2016_Final.pdf
35 Utah Department of Transportation. (2019, August 26). Road usage charge. Retrieved from
https://www.udot.utah.gov/main/f?p=100:pg:0:::1:T,V:5090
36 I-95 Corridor Coalition. (n.d.). Mileage-based user fee pilot. Retrieved from
https://static1.squarespace.com/static/5a600479ccc5c5e5c8598516/t/5d13b2b404c48b0001add45f/1561572023279
/I-95+MBUF_Phase+1+Pilot_Fact+Sheet.pdf
37 OReGO. (n.d.). Frequently asked questions. Retrieved from http://www.myorego.org/frequently-asked-questions
38 Compare.com. (2019, March 15). Vehicle title, tax & registration costs by state. Retrieved from
https://www.compare.com/auto-insurance/coverage/vehicle-costs
39 Harto, C., & Baker-Branstetter, S. (2019, September). Rising trend of punitive fees on electric vehicles won’t dent
state highway funding shortfalls but will hurt consumers. Retrieved from
https://advocacy.consumerreports.org/wp-content/uploads/2019/09/Consumer-Reports-EV-Fee-analysis.pdf
40 Board of Governors of the Federal Reserve System. (2019, May). Report on the economic well-being of U.S.
households in 2018. Retrieved from https://www.federalreserve.gov/publications/files/2018-report-economic-well-
being-us-households-201905.pdf
41 U.S. Bureau of Labor Statistics. (2019, September 10). Consumer expenditures—2018. Retrieved from
https://www.bls.gov/news.release/cesan.nr0.htm
42
Eno Center for Transportation. (2019, January). Eno Brief: Transportation at the Ballot Box 2018. Retrieved from
https://www.enotrans.org/transportation-at-the-ballot-box-2018/
- 18 -State Transportation Revenue in a Coming
Era of Electric Vehicles
43
Eno Center for Transportation. (2019, November 6). Rapid Response Webinar: Transportation at the Ballot Box
2019. Retrieved from https://www.enotrans.org/event/rapid-response-webinar-transportation-at-the-ballot-box-2019/
44Eno Center for Transportation. (2013, February 26). Virginia’s transportation funding proposal and the user-pay
concept. Retrieved from https://www.enotrans.org/article/virginias-transportation-funding-proposal-user-pay-
concept
45
U.S. Department of Energy. Electric Vehicles: Learn More About the Label. Retrieved from
https://www.fueleconomy.gov/feg/label/learn-more-electric-label.shtml
46
Baumhefner, M. (2019, August 2). A simple way to fix the gas tax forever. Retrieved from
https://www.nrdc.org/experts/max-baumhefner/simple-way-fix-gas-tax-forever
47Auto Alliance. (n.d.). Advanced technology vehicle sales dashboard. Retrieved from
https://autoalliance.org/energy-environment/advanced-technology-vehicle-sales-dashboard
- 19 -You can also read