A Review of Beijing's Vehicle Lottery - Environment for Development
←
→
Page content transcription
If your browser does not render page correctly, please read the page content below
Environment for Development Discussion Paper Series January 2014 EfD DP 14-01 A Review of Beijing’s Vehicle Lottery Short-Term Effects on Vehicle Growth, Congestion, and Fuel Consumption J un Y an g, Yi ng Li u, Pi ng Q i n, an d An tu ng A. Li u
Environment for Development Centers

 Central America
 Research Program in Economics and Environment for Development
 in Central America
 Tropical Agricultural Research and Higher Education Center
 (CATIE)
 Email: centralamerica@efdinitiative.org

 Chile
 Research Nucleus on Environmental and Natural Resource
 Economics (NENRE)
 Universidad de Concepción
 Email: chile@efdinitiative.org

 China
 Environmental Economics Program in China (EEPC)
 Peking University
 Email: china@efdinitiative.org

 Ethiopia
 Environmental Economics Policy Forum for Ethiopia (EEPFE)
 Ethiopian Development Research Institute (EDRI/AAU)
 Email: ethiopia@efdinitiative.org

 Kenya
 Environment for Development Kenya
 University of Nairobi with
 Kenya Institute for Public Policy Research and Analysis (KIPPRA)
 Email: kenya@efdinitiative.org

 South Africa
 Environmental Economics Policy Research Unit (EPRU)
 University of Cape Town
 Email: southafrica@efdinitiative.org

 Tanzania
 Environment for Development Tanzania
 University of Dar es Salaam
 Email: tanzania@efdinitiative.org

 Sweden
 Environmental Economics Unit
 University of Gothenburg
 Email: info@efdinitiative.org

 USA (Washington, DC)
 Resources for the Future (RFF)
 Email: usa@efdintiative.org

The Environment for Development (EfD) initiative is an environmental economics program focused on international
research collaboration, policy advice, and academic training. Financial support is provided by the Swedish International
Development Cooperation Agency (Sida). Learn more at www.efdinitiative.org or contact info@efdinitiative.org.
A Review of Beijing’s Vehicle Lottery: Short-Term Effects on Vehicle
              Growth, Congestion, and Fuel Consumption
                            Jun Yang, Ying Liu, Ping Qin, and Antung A. Liu

        Abstract
                Many cities worldwide have considered vehicle restriction policies to curb proliferating
        problems of traffic and pollution. At the beginning of 2011, Beijing became the first city to allocate
        vehicle license plates using a lottery. We provide background on Beijing’s lottery, and analyze its short-
        term effects. We find that vehicle growth has been sharply curtailed, and congestion has been reduced.
        However, this policy may not reduce fuel consumption as much as expected.

        Key Words: vehicle lottery, air pollution, traffic congestion, Beijing

Discussion papers are research materials circulated by their authors for purposes of information and discussion. They have
not necessarily undergone formal peer review.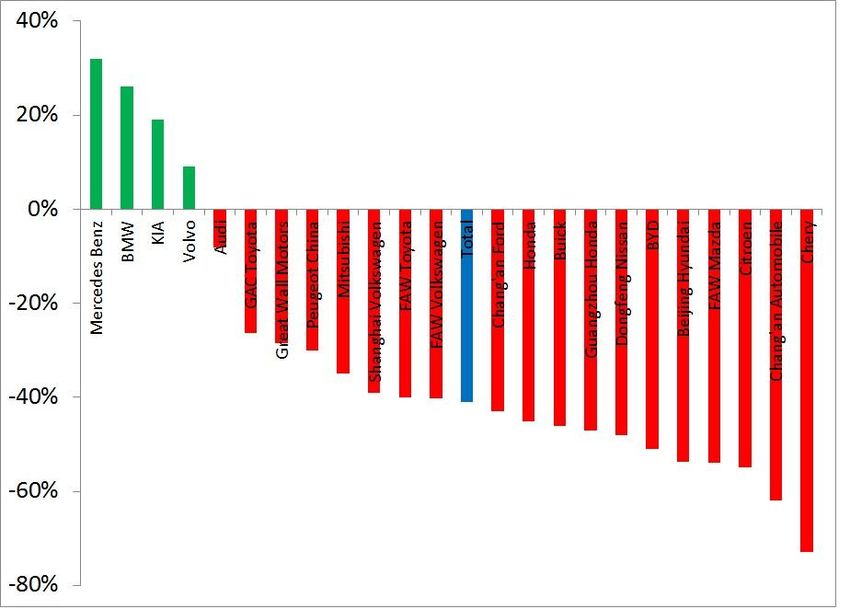
Contents

Introduction ............................................................................................................................. 1

Why did Beijing Implement a Lottery? ................................................................................ 3
     The Need for Restrictions on Cars ...................................................................................... 3
     Other Attempts to Control Congestion ............................................................................... 4

Implementation of the Beijing Lottery ................................................................................. 6

Effects of the Lottery System ................................................................................................. 8
     Impacts on the Demand for License Plates ......................................................................... 8
     Effects on the Quantity of Motor Vehicles ....................................................................... 10
     Effects on Congestion ....................................................................................................... 10
     Effects on the Composition of Motor Vehicles Purchased ............................................... 11

The Effect of the Lottery on Fuel Use ................................................................................. 12
     Effects of the Policy on Vehicle Growth .......................................................................... 12
     Effects on Fuel Use ........................................................................................................... 13
         Effects on Vehicle Distance Travelled ........................................................................13
         Effects on the Average Fuel Consumption Rate (AFCR) ............................................14
         Effects on Total Fuel Use ............................................................................................15

Discussion and Conclusion ................................................................................................... 15

References .............................................................................................................................. 17

Figures and Table ................................................................................................................. 18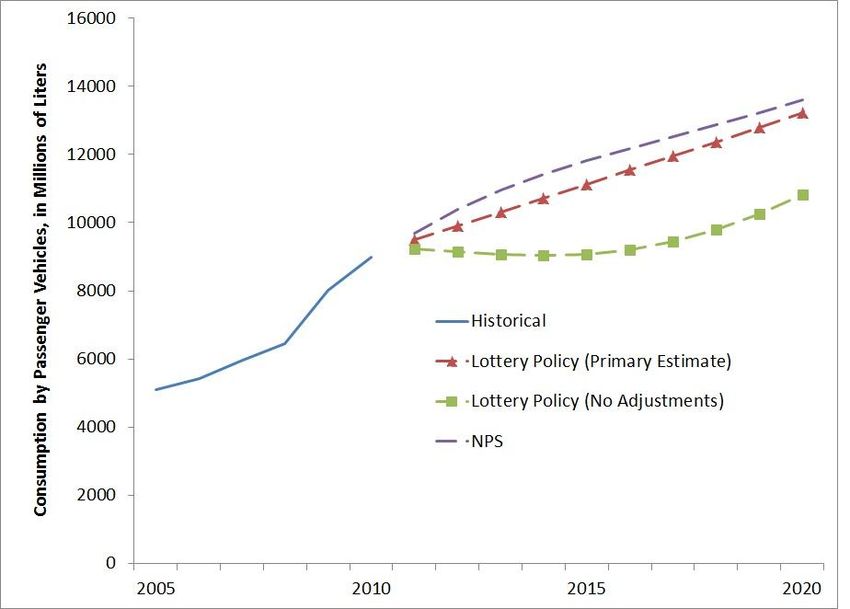
Environment for Development Yang et al.
A Review of Beijing’s Vehicle Lottery: Short-Term Effects on Vehicle
Growth, Congestion, and Fuel Consumption
Jun Yang, Ying Liu, Ping Qin, and Antung A. Liu
Introduction
China’s economic development has propelled the issue of cars into the forefront of its
current policy discussions. Although the wider availability of cars has improved the standard of
living of China’s residents, it has also exacerbated problems of air pollution, resulted in intense
traffic congestion, and driven a rapid growth in the demand for energy.
At the beginning of 2011, Beijing restricted the purchase of automobiles by distributing
new license plates via a publicly-held lottery. While the concept of restricting license plates is no
longer new, Beijing is unique in restricting license plates via a lottery rather than using an
auction system.
Singapore was the first country to implement license plate restrictions. Singaporeans
participate in a monthly auction for the right to purchase a car. Revenues from these auctions are
used in improving roads and public transport. Following Singapore’s experience, Shanghai
implemented a similar auction system in 1994. Chen and Zhao (2013) surveyed Shanghai
residents and concluded that the public held a negative attitude toward the fairness of the policy
and toward auctioning.
As of the writing of this paper, four Chinese cities have implemented license plate
restrictions: Beijing, Shanghai, Guangzhou, and Guiyang. Guangzhou began restricting cars
using a system with hybrid auction and lottery components. Many more cities in China are also
considering restrictions. Internationally, many cities struggling with traffic are considering
various models of restricting their automobiles.
Jun Yang, College of Environmental Science & Engineering, Peking University, China. Email:
yangj@bjtrc.org.cn. Yang Liu, Beijing Transport Energy and Environment Center, China. Email:
liuying@bjjtw.gov.cn. Ping Qin, Department of Energy Economics of School of Economics, Renmin University of
China, China. Email: pingqin2009@gmail.com. Antung A. Liu, Resources for the Future, Washington, DC, USA
and Cheung Kong Graduate School of Business, Beijing, China. Email: liu@rff.org and antung@ckgsb.edu.cn. We
are grateful to Sida (through the Environment for Development Initiative) for financial support for this research.
1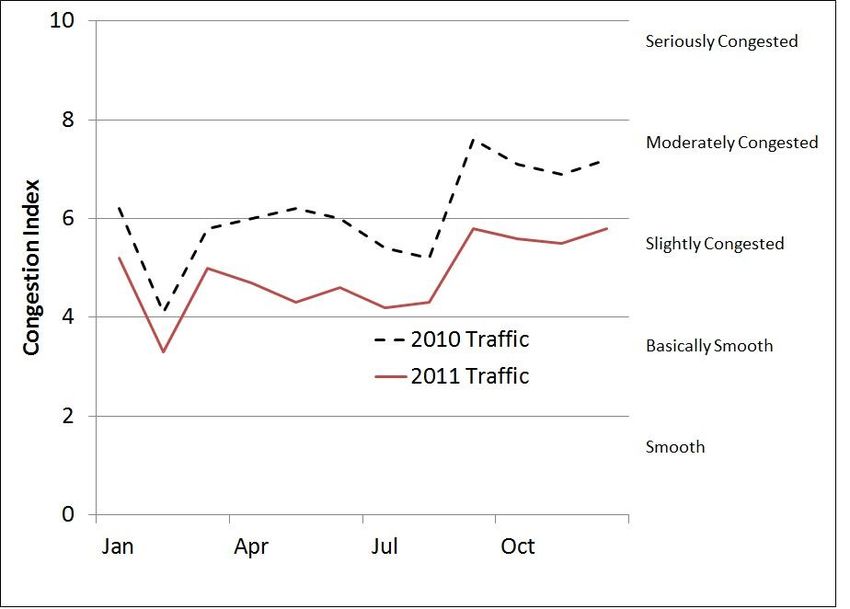
Environment for Development                                                           Yang et al.

       In this paper, we provide an in-depth look at Beijing’s experience with allocating vehicles
through random assignment. We highlight three key differences between using a lottery and
using an auction to allocate cars.

       First, an auction raises revenue, while a lottery does not. Chen and Zhao (2013)
document that 5 billion RMB were raised through the Shanghai lottery in 2011; Beijing’s lottery
does not raise any revenue. In Shanghai, these revenues were allocated to developing roads and
building public transportation.

       A second difference we found in Beijing is that not all those who received quotas after
winning the lottery used them. Many of the lucky few who won the car lottery let their quotas
expire without buying a car, with over 10% of lottery winners allowing their quotas to expire in
some months. It is difficult to imagine auction entrants purchasing expensive permits and then
allowing them to expire. As a result, vehicle ownership grows somewhat more slowly under the
lottery system than under an auction system.

       A third difference is that an auction system should result in those with the highest
willingness-to-pay receiving cars. In a lottery system, the recipients of vehicles are a random
subset of entrants. This has potential consequences that could be the subject of future research.

       The primary purposes of this study are to present background on Beijing’s lottery policy,
and to provide analysis of its short-term impacts. We first provide a brief history of Beijing’s
vehicle regulation efforts. We then discuss how Beijing’s lottery is implemented, and what
intended and unintended consequences have resulted from its implementation.

        Our paper is the first to study the impact of the car lottery on automobile trends in
Beijing. We add to an extensive literature studying China’s car market and projected demand for
fuel. Because of China’s size and growth rates, its automobile market is currently the largest and
most important in the world, and has an outsized impact on global energy consumption patterns.
The most directly comparable paper is Hao et al. (2011), who compared policies in Beijing and
Shanghai to study their impact on fuel consumption. That paper did not study the substantial
impacts of the lottery.

        We find that, in the first few years after the policy, the growth of cars in Beijing has been
sharply reduced. In combination with other traffic-easing policies, congestion has also improved
significantly. Finally, we use a few simple calculations to provide rough estimates of the lottery’s
impact on fuel consumption, and conclude that it is unlikely to reduce fuel consumption as much
as might be expected.

                                                     2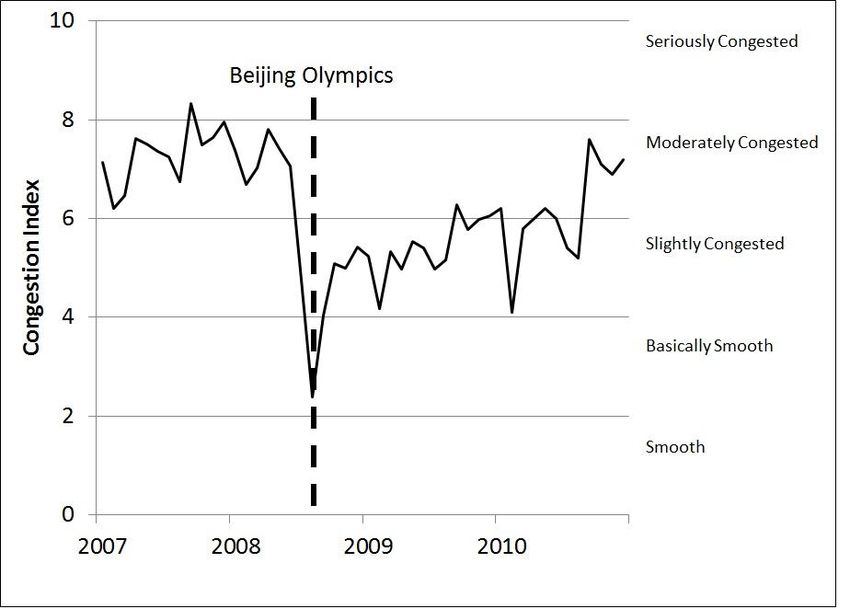
Environment for Development Yang et al.
Why did Beijing Implement a Lottery?
The Need for Restrictions on Cars
China’s rapid economic development is reflected in the rise in incomes of the residents of
its capital Beijing. Beijing’s GDP per capita has shot up in recent decades. In 2000, GDP per
capita was $US 2,915. In 2010, it was $US 11,218, an annual growth rate of 14%.
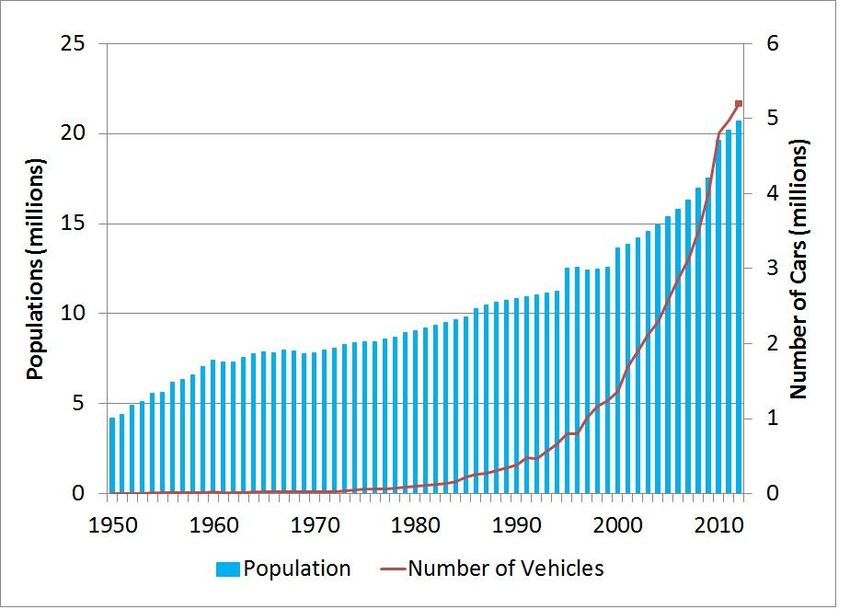
Along with its growth in GDP per capita, Beijing’s population has grown rapidly.
Between 1990 and 2000, its population grew 26%, and between 2000 and 2010, its population
grew a further 44%. In 2010, its population of permanent residents reached 19.6 million (Figure
1).
The municipality of Beijing officially occupies an area of 16,400 square kilometers,
roughly the size of Connecticut. Most of Beijing’s population and cars are concentrated in the
central city area, which is enclosed by the concentric rings forming the primary highway system
of the city. Its rapidly growing population and limited prime real estate have led to a densely
packed downtown. Land area per capita within its core commercial area, enclosed by the 2nd
Ring, is only 44 square meters per person.1 About 84% of vehicles are distributed within the 6th
Ring highway.
The rapid growth in population and per capita wealth has been reflected in the purchases
of cars. Beijing waited 7 years to advance from 1 million cars to 2 million cars, but only 4 years
to reach 3 million, and 3 years to reach 4 million. In 2005, it had 2.6 million cars. In 2010, it had
4.8 million vehicles, an annual growth rate of 13%.
The rapid increase in cars was accompanied by the rapid expansion of existing roads, and
the construction of new road networks, yet the continuously increasing demand seemed to
outpace the city’s best efforts. Beijing has been named by numerous international organizations
as one of the most congested cities in the world (see, for example, IBM 2010). The Beijing
Transportation Annual Report stated that the average speeds of vehicles on arterial roads during
morning rush hour decreased from 30 km/h in 2003 to 20 km/h in 2010, with even larger drops
in vehicle speeds on secondary roads.
11 By comparison, the central city portion of the New York metropolitan area had a land area per capita of 97
square meters per person (Table 3 from Manville and Shoup 2005).
3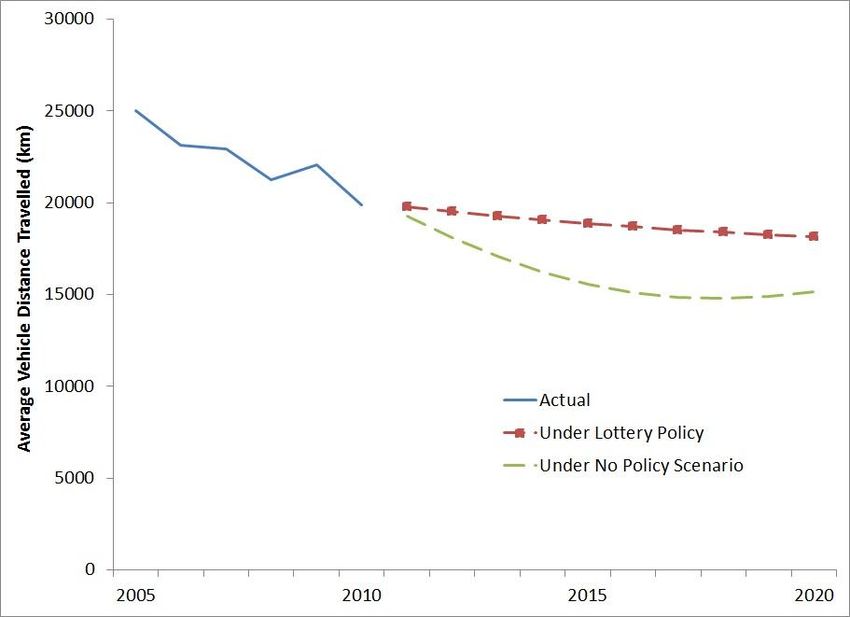
Environment for Development                                                          Yang et al.

        Beijing’s automobile congestion has large and growing costs. Using data on vehicle flow
rates and speeds, Xie et al. (2011) estimated that the costs of time delay, fuel consumption, and
air pollution were between 5 and 25 billion RMB in 2008, about 0.5% to 2.5% of Beijing’s GDP.

        Moreover, Beijing’s growing fleet of cars emits massive amounts of carbon monoxide
(CO), nitrous oxide (NOx), and volatile organic compounds (VOCs); these contribute to
Beijing’s painfully poor air quality. According to data from the Beijing Municipal
Environmental Protection Bureau, motor vehicle exhaust accounts for 40%-60% of suspended
particulates, 80% of hydrocarbons, 70%-80% of NOx, and 23% of PM10. Liu et al. (2008)
estimate that motor vehicles are the second largest source of PM2.5.

Other Attempts to Control Congestion
       Beijing’s government has been fully aware of the problems caused by too many cars. It
has undertaken a series of administrative policies to relieve the stresses caused by congestion.
These policies have taken a number of different forms, and we outline them in rough
chronological order here.

       As early as the 1990s, Beijing began taking measures to restrict the total number of motor
vehicles. Beginning on March 1, 1998, Beijing imposed a parking certificate system on newly
purchased motor vehicles in eight urban districts. This system required all motor vehicle owners
applying for a license plate in the urban and inner suburban districts of Beijing to submit parking
certificates checked by local public security and transportation administration authorities. This
system was designed to restrict the number of vehicles in urban districts and to relieve
congestion. However, the system was largely ineffective because of the slow registration and
administration of parking certificates, the high costs of verification, and the arbitrary collection
of fees. In addition, some parking certificates were faked. On January 1, 2004, the parking
certificate system was officially cancelled.

       At the beginning of 2004, the parking restriction system was replaced by a vehicle
purchase tax, promulgated by the Interim Regulations of the People’s Republic of China on
Vehicle Purchase Taxes. A tax was levied on all organizations and individuals within the
boundaries of China who purchased designated vehicles, including motor vehicles, motorcycles,
tramcars, trailers, and agricultural trucks. Despite a tax of 10% on the purchase of cars, Beijing
continued to experience high rates of motor vehicle growth.

       Starting in 2005, Beijing sharply accelerated the amounts it invested in its fundamental
transportation facilities (Figure 2). In 2010, 72 billion RMB were invested, over 5% of Beijing’s

                                                     4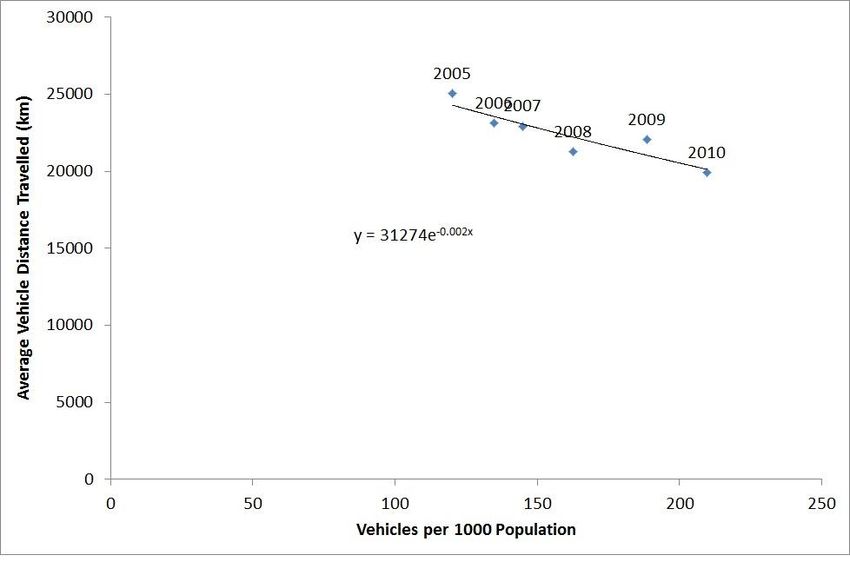
Environment for Development                                                                         Yang et al.

GDP. Of this amount, 7.7 billion RMB were invested in railways, 9.7 billion RMB in roads, and
41.1 billion RMB in urban public transport. Beijing’s railway system has expanded rapidly. At
the end of 2009, railway tracks spanned 228 kilometers. In 2010, 2011 and 2012, it expanded its
tracks by 108 kilometers, 36 kilometers, and 70 kilometers, respectively.

        In 2007, Beijing implemented a low-price public transport policy, which reduced subway
fares and reduced all bus fares by 60%. The intention of this policy was to increase the
attractiveness of buses and the subway system. As a result, the fares of most buses and the
subway decreased to just 0.4 RMB and 2 RMB, respectively. However, this policy did not
appear to have a substantial impact on travel habits. A survey conducted by the website
People.net.com found that very few Beijing citizens actually changed their typical modes of
transport despite the lower fares.

       Because these market-based systems appeared to have only limited impact, Beijing has
more recently relied on administrative means to restrict the growth in vehicles. During the
Olympics in August 2008, Beijing implemented a license plate restriction, where cars could only
drive on the road during certain days, according to whether they had an even- or odd-numbered
plate.

        Before the Olympics, the monthly congestion index consistently averaged above 7,
reflecting “moderate” congestion.2 The new restrictions had an immediate effect, sharply
reducing congestion (Figure 3). In combination with other simultaneous reforms, large
reductions in air pollution were observed.

        Following the Olympics, Beijing implemented an ongoing license plate restriction, where
cars could not drive on Beijing roads for one weekday each week, depending on the last digit of
the license plate number. Congestion remained improved in the early months of 2008, and stayed
below 6 for most months of 2009. However, the rapid increase in new vehicle ownership in
Beijing during 2009 and 2010 gradually caused traffic to worsen until, by the end of 2010, the
congestion index was at the same level as before the license plate restriction was implemented.

2 The Beijing Municipal Commission of Transport classifies traffic congestion into five levels according to a 10
point congestion index (Figure 3). According to this index, congestion is qualitatively described as “smooth,”
“basically smooth,” “slightly congested,” “moderately congested,” and “seriously congested.”

                                                              5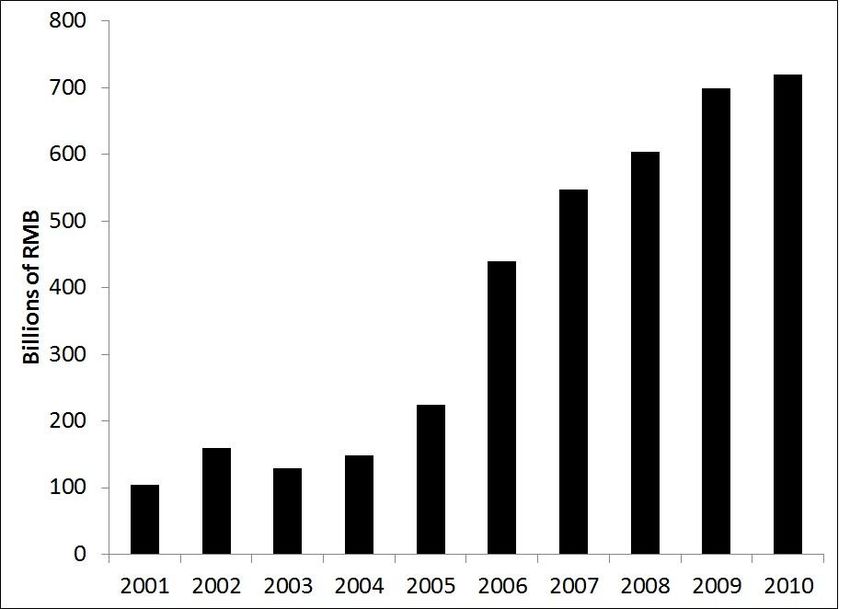
Environment for Development                                                            Yang et al.

       In some ways, Beijing’s experience with license plate restrictions mirrored that of
Mexico City. Many citizens in Mexico City circumvented the policy by purchasing another car,
causing second-hand vehicle sales to soar in the market. Until the year 1995, 22% of the drivers
bought second vehicles (Eskeland and Feyzioglu 1997), resulting in increased traffic congestion.
Davis (2008) found that the policy restriction did not improve air quality in Mexico City; instead,
air pollution worsened during weekends and at off-peak periods during working days.

         Similarly, in Beijing, drivers gradually found ways to circumvent the license plate
restrictions. Drivers took detours and avoided restricted periods. In some cases, drivers
purchased multiple cars with different license plate numbers to avoid restrictions on their driving
times. Each of these measures eroded the usefulness of the license plate restrictions.

        In summary, prior to the lottery, each of Beijing’s attempts to control its congestion was
either ineffective or only temporarily effective. Market-based reforms such as increasing the
price of parking or taxing the sales of cars were inadequate to dent the enormous demand
generated by Beijing’s growth. Even restrictions on driving days seemed to only delay the
overwhelming problems of dense traffic.

Implementation of the Beijing Lottery
       Beijing’s decision to impose restrictions on the number of cars sold each year was
perhaps precipitated by a pair of embarrassing incidents. On September 14, 2010, construction
work on roads between Beijing and neighboring Zhangjiakou triggered a paralyzing traffic jam
stretching over 100 kilometers on the highway just outside of Beijing. For three days, traffic
came to a standstill, with those affected progressing as little as a third of a mile per day. Then, on
September 17, 2010, a traffic jam triggered by heavy rain affected the entire city. The congestion
index remained at 10 for three consecutive hours, and 4,321 roads were seriously congested
during the evening peak period. The jam lasted until 1:00 a.m. the next day.

        There is no announcement or report documenting the official reasons why Beijing chose
a lottery to restrict vehicle growth, rather than an auction. For years before Beijing’s policy, both
Singapore and Shanghai had successfully restricted cars with auctions. However, as a result of
our interviews with administrators within Beijing’s transportation agencies, we suggest two
reasons.

        First, a lottery system is seen as more equitable. A resident of average income would
have a higher chance of obtaining a license plate through a lottery than he might if plates were
sold through an auction. Income equality has become an increasingly important issue in China,

                                                      6
Environment for Development Yang et al.
particularly to its urban residents. Car ownership is not seen as a luxury for the rich, but rather a
symbol of entering the middle class. Second, Beijing had used a lottery in the past to allocate
affordable housing. This policy was seen as successful, and may have inspired its use in
allocating vehicles.
On December 13, 2010, Beijing first issued a plan to its residents that hinted at the
upcoming cap on vehicle registrations. The plan also raised parking fees, expanded public
transportation options, and announced the construction of new roads.
Starting on December 24, 2010, new registrations were frozen. Before purchasing a
license plate, individuals and corporations were required to win a publicly-held lottery
administered by the Beijing Municipal Commission of Transport. The lottery is held on the 26th
day of each month, with 20,000 new car registrations to be selected each month from the pools
of eligible applicants.
Individual applicants compete for 17,600 license plates each month. They register on a
government website to be entered into the lottery, with no monetary cost. The application
consists of ten questions, including the applicant's registration number, address, and contact
information. Applicants are screened to make sure they are qualified to enter the lottery. Only
those with a Beijing registration or residents who have paid taxes in Beijing for 5 years are
allowed to enter the lottery. In addition, individuals who already have vehicles may not enter the
lottery. However, a second driver in a household that has a car may enter the lottery; that person
may win the right to buy a second car for the household.
Businesses can also win vehicle license plates, entering a separate lottery with 2,000
winners per month.3 Government-sponsored institutions, social organizations, and other
organizations are also able to apply for a license plate each year. Enterprises that pay VAT and
sales taxes amounting to at least 50,000 RMB can also apply for a license plate each year, and
can add a license plate with every 500,000 RMB of taxes paid. However, they cannot purchase
more than 8 vehicles per year.
3 Commercial cars such as rental cars and taxis were also allocated 400 license plates each month. In sum, with
individuals competing for 17,600 plates, businesses competing for 2,000 plates, and commercial cars competing for
400 plates, there are 20,000 new vehicle licenses available each month.
7Environment for Development Yang et al.
The license-plate lottery begins with six applicant representatives, members of the
Beijing Municipal People’s Congress, and members of the Beijing Municipal Committee of the
Chinese People’s Political Consultative Conference. Each lottery participant draws a number to
generate a six-digit random seed. Under the supervision of notaries and the staff of the Discipline
Inspection and Supervision Commission, the lottery numbers are sealed, and a technician inputs
the sealed numbers into a computer. The computer determines the starting point in relation to the
6-digit seed, and then produces license-plate numbers on the spot. The technician inputs all the
chosen numbers onto a disc, and the notary office, the Beijing Municipal Bureau of Supervision,
and the Beijing Municipal Car Quota Control and Administration Office keep a copy of the disc.
The chosen numbers are published on the license-plate lottery system website.
Winners of the lottery receive a “quota,” a downloadable certificate functioning as a
permit allowing the lottery winner the right to purchase a new or used car. Once the lottery has
been won, the quota is free. Quota holders may purchase a license plate costing 125 RMB.
Quotas are non-transferrable and cannot be sold. Winners have 6 months to purchase a car before
their permit expires. If the lottery winner does not purchase a car during this interval, the permit
goes back to expand the pool of quotas available in the next lottery.
Existing car owners do not have to win the lottery in order to retain their car registration.
If they have their car destroyed, or sell their car to a used car dealer, they retain their license
plates and can purchase a new car.
Enforcement of the lottery plate system is severe. Only cars with Beijing plates are
permitted to drive in downtown Beijing during the weekday rush hours of 7:00 a.m. to 9:00 a.m.,
and 5:00 p.m. to 8:00 p.m. Cars with outside plates found driving during rush hour are fined
100RMB for each violation.
Effects of the Lottery System
Impacts on the Demand for License Plates
Residents reacted to Beijing’s mid-December announcement of the lottery restriction by
moving forward vehicle purchase decisions. There were two weeks between the initial
announcement and a complete freeze on new vehicle registrations. In that interval, new vehicle
registrations rose more than 50% (Figure 4). News articles at the time reported that customers
would go into dealerships and purchase vehicles without bargaining and without having the
opportunity to select their cars.
8Environment for Development Yang et al.
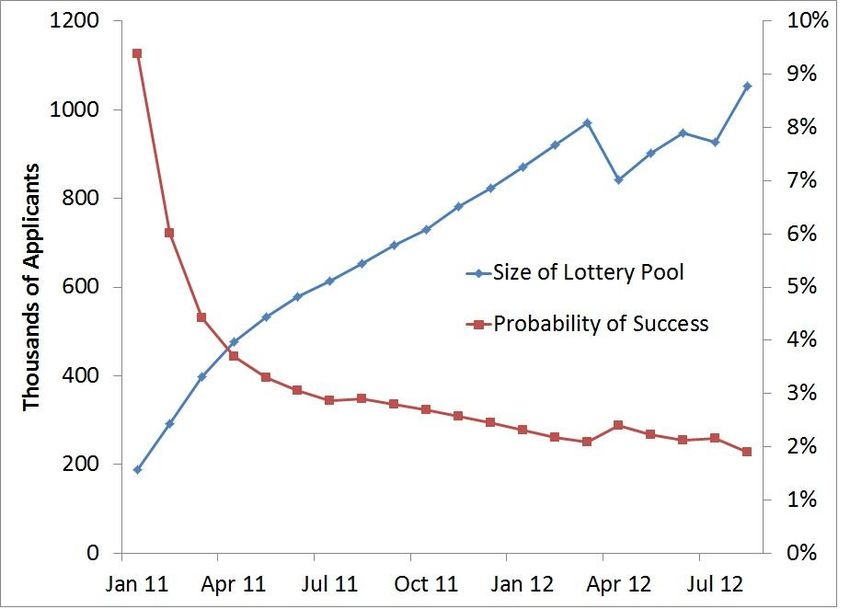
Over time, the lottery pool saw dramatic increases in the number of entries, and
commensurate decreases in the probability of success (Figure 5). While those who participated in
the first lottery in January 2011 had a 9% chance of winning, that probability decreased to less
than 2% by August 2012.
The lottery’s setup is likely to have artificially swelled the number of entries. Qualified
applicants can enter the lottery by filling out a short online application and do not have to pay a
fee. This structure led all members of the family to enter the lottery in many cases. In addition,
households without an immediate need for a car entered the lottery, hoping that they would need
a car by the time they won it.
As a result, many people who won the lottery did not purchase a vehicle within the
allotted six months. This invalidated their quota. In June 2012, 10.9% of individual lottery
winners did not purchase vehicles within the specified period. Even among corporate entrants,
22.8% of winners failed to purchase a vehicle.
The difficulty of winning the lottery suggests that many entrants with a high willingness-
to-pay for a vehicle were unable to buy a car. At the same time, many quotas held by those who
won the lottery expired without being used.
The high rate of quota expirations is fully rational under Beijing’s lottery system.
Entering the lottery is free for qualified applicants and requires only filling out a short online
form. If the lottery is won, the applicant then has the option to purchase a vehicle, with no
financial cost if the quota expires. If a lottery winner’s quota expires, she can just enter the
lottery again with no additional cost. The system is set up so that the act of entering the lottery
generates positive value for the entrant, in the form of a chance to win an option to purchase a
car.
Beijing revised its policy in January 2012 to address this problem. The validity period for
applications was limited: those who wanted to participate in the license-plate lottery were
required to use the lottery website to confirm their interest in obtaining a vehicle every three
months; otherwise, their applications would be removed. Despite the relatively low bar now
imposed, this change led to thousands of expired applications beginning in April 2012; we see
dramatic fluctuations in the number of active lottery applications starting from this date.
A vigorous black market sprung up temporarily to service the shortage in available
license plates. An illegal trade called “license plate renting” emerged. In this trade, an individual
needing a car purchases a vehicle in the name of a lottery winner, paying the winner for this
service. Once the individual needing a car obtains his own quota by winning the lottery himself,
9Environment for Development Yang et al.
he transfers the vehicle purchased from the original lottery winner to his own name. A second,
related practice involved car dealerships. Many of these enterprising dealerships purchased
hundreds of additional license plates before the restriction on license plates was implemented.
An individual needing a car would purchase a vehicle designated by the dealer, paying several
thousand additional RMB for the privilege of using the dealer’s license plate. The arrangement is
made with the understanding that the purchaser will return the rented license plate to the dealer
when the purchaser has won the lottery himself.
Consequently, the People’s Government of Beijing Municipality sternly declared that no
special quotas or quota trading were permitted, with quotas to be recalled in serious cases. Those
caught breaking the law would be held legally liable. It is believed that these new regulations are
generally obeyed; media reports of black market license plates have diminished in recent months.
Effects on the Quantity of Motor Vehicles
The license plate lottery dramatically curbed increases in motor vehicles (Figure 4). New
car registrations were cut over 75% between 2010 and 2011. Similarly, the growth in the number
of total cars was dramatically slowed (Table 1).
Total sales of new vehicles in Beijing dropped commensurately. Sales of new
automobiles dropped from 920,000 in 2010 to 400,000 in 2011, a decrease of 57%. Retail sales
in Beijing decreased from 155.7 billion RMB to 86.8 billion RMB, a decrease of 44%. The
second-hand automobile market also suffered from the new policy: sales of second-hand
automobiles dropped from 520,000 in 2010 to 400,000 in 2011.4
Although the motor vehicle market clearly suffered from the policy, the overall economy
of the Beijing municipality did not seem to suffer ill effects. Beijing’s gross regional product
grew from 1.41 trillion RMB in 2010 to 1.60 trillion RMB in 2011, a growth rate of 13.4%.
Effects on Congestion
Traffic congestion improved immediately in 2011 after the advent of the license plate
lottery. Figure 6 compares congestion in 2010 and 2011. For each month in 2011, congestion is
noticeably lower, suggesting that the set of policies enacted during this time had a significant
4 Because used cars can be sold in adjacent provinces, second-hand car sales did not drop as much.
10Environment for Development Yang et al.
effect. According to the 2011 Beijing Transport Annual Report, average driving speeds rose
from 22.6 km/h in 2010 to 25.3 km/h in 2011.
Although the absolute number of vehicles on the road did not decrease (Table 1), the
growth of the number of vehicles slowed dramatically with the lottery policy. Along with
restricting vehicles, Beijing continued to reinforce its policies targeted at controlling congestion,
including upgrades to road capacity, increases in parking fees, and the construction of more bus
lanes. Although these measures had been ongoing in the years before the Beijing lottery,
congestion continued to swell (see Figure 3.) While vehicle restrictions in isolation did not
reduce vehicle numbers, they did reduce the growth in automobiles and allow these other
measures to take effect. In other words, lottery restrictions reduced the growth in demand for
roads, allowing the growth in the supply of roads and transportation alternatives to finally reduce
congestion.
It is too early to judge whether reduced congestion will continue into the medium and
long term. The post-Olympics policy restricting the weekdays that each car was able to drive on
the road was effective in the short run, but lost its effectiveness after about two years. While part
of this loss of effectiveness was undoubtedly due to the increased number of cars, part of it had
to be attributed to driver adaptations to the car restrictions.
Effects on the Composition of Motor Vehicles Purchased
Statistics from the Beijing Municipal Office of State Administration of Taxation show
that the average unit price of automobiles grew 28% between 2010 and 2011. Between 2003 and
2010, the average unit price of automobiles increased by a combined 14% (Figure 7).
There are many possible reasons for this increase in unit sales price, such as increased
incomes and increased numbers of very wealthy residents in Beijing. One additional reason is the
lottery policy. Because families have to win the lottery before purchasing a new car, they tend to
concentrate their investment in transportation into a single car. As a result, when a vehicle is
purchased, a single high-end car is purchased, rather than two low-end cars.
Evidence on the distribution of sales by brand supports this interpretation (Figure 8.)
This figure shows that the total sales of vehicles declined sharply. While many mid-market firms
took punishing double digit drops in sales, the steepest drops were suffered by domestic Chinese
firms, which have more limited brand reputations. Luxury imported brands, like Mercedes-Benz
and BMW, actually expanded their sales.
11Environment for Development Yang et al.
The Effect of the Lottery on Fuel Use
In this portion of our study, we perform simple estimates of the impacts of Beijing’s
lottery policy on the sales of its cars and the total consumption of fuel.
The total amount of fuel consumed is calculated using Equation 1:
Fuel Used = Number of Vehicles * Vehicle Distance Travelled * Average Fuel
Consumption Rate (1)
We must estimate each of the items on the right-hand side of Equation 1 between the
years 2011 and 2020. In each section, we estimate these items under both the lottery policy and
under the no-policy scenario (NPS).
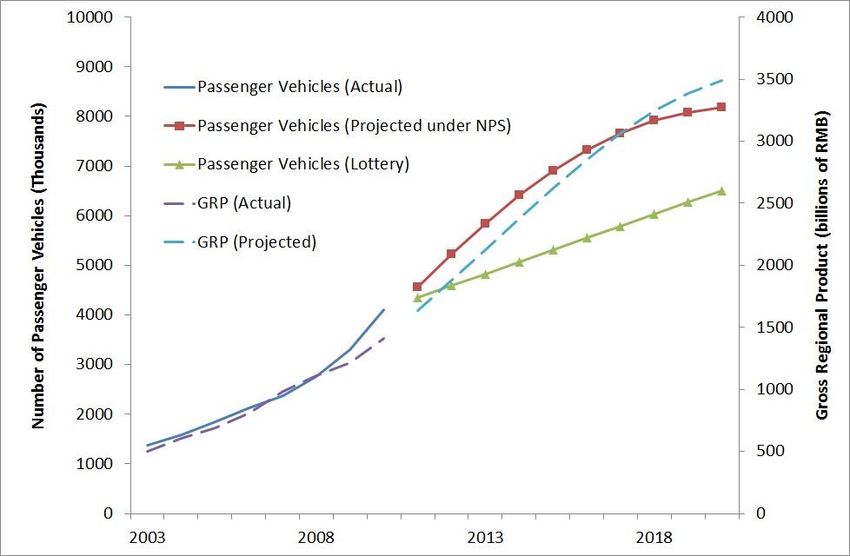
Effects of the Policy on Vehicle Growth
The lottery restricted new license plates in Beijing to only 240,000 per year; contrast this
with the net increase of 803,000 vehicles in 2010. We plot the actual number of vehicles in
Beijing, and the number expected under the lottery policy, in Figure 9.5
To estimate the counterfactual sales of cars in Beijing under the no-policy scenario, we
rely on estimates of the elasticity of demand for cars with respect to Beijing’s gross regional
product. Figure 9 offers visual evidence that the demand for cars and Beijing’s gross regional
product grew in tandem until 2010, when the announcement of the lottery prompted a surge in
car sales (Figure 4).
First, we project Beijing’s gross regional product. Growth averaged 16.1% between 2001
and 2010, falling no lower than 9.3% in any year. Given the impossibility of growing at those
rates forever, we assume that growth in 2011 will be 16.1%, and then fall linearly until it reaches
3% in 2020. Although this implies a drastic slowdown from recent growth rates, it still implies
that Beijing’s gross regional product will grow almost 150% over the next 10 years.
Then, we estimate the elasticity of car growth with respect to GRP growth between 2003
and 2010, the years for which we have vehicle data. This elasticity averaged 1.12, with a low of
0.52. We remove 2010 from our estimate, because that year had a surge in demand that would
5 Note that car owners can replace their existing cars without having to win the lottery. Hence, the 240,000 cars that
are added each year under the lottery policy represent a net increase in vehicles.
12Environment for Development Yang et al.
not have occurred had the lottery not been enacted. We assume that the elasticity of car demand
will be 1.12 in 2010, and that it will fall linearly until it reaches 0.4 under our no policy scenario.
The results of our estimates are diagrammed in Figure 9. The gap between counterfactual
growth in vehicle sales and the projected growth under the lottery policy is immediately visible
in 2011, and remains large and significant over the next 10 years.
Effects on Fuel Use
Effects on Vehicle Distance Travelled
We now turn to estimating the second term in Equation 1, the average vehicle distance
travelled (VDT). A few prior studies have also examined this problem in China. He et al. (2005)
estimated that the overall annual VDT of cars decreased from 27,200 km in 1997 to 26,000 km
in 2002, a very small fall. A more useful analysis for us is Hao et al. (2011), which used some
data from Beijing, and projected a much sharper drop based on the aging of the car fleet and
shifts in vehicle composition.
We use part of the analysis of Hao et al. (2011) to project vehicle distance travelled in
Beijing. Using data between 2003 and 2008, they note that declines in VDT have linearly tracked
rates of private car ownership. We analyzed 2005 to 2010 vehicle distance travelled data from
the Beijing Transport Development Annual Report, and confirmed this relationship (Figure 10).
Our strategy is to assume that this linear relationship will continue to hold. We then use
the estimated relationship to project vehicle distance travelled based on simple calculations of
vehicle ownership rates.
We first calculate private car ownership rates. We assume that Beijing’s population will
continue to grow at its 10-year average of 2.8% per year. Then we use vehicle growth estimates
to estimate private car ownership rates under both the lottery policy and the NPS. Using these
projected vehicle density rates and the linear relationship calculated above, we derive rough
estimates of vehicle distance travelled; results are presented in Figure 11.
Under the NPS scenario, we expect vehicle miles travelled to continue the recent trend of
sharp decline for the next five years. Gradually, the vehicle miles travelled should flatten out.
Under the lottery policy, vehicle density rates do not grow as quickly as they would under the
NPS. As a result, vehicle distance travelled continues to decrease, but at a much slower rate.
There are intuitive reasons why vehicle distance travelled may be related to vehicle
density rates; explanation of these reasons may shed light on our projection that the lottery policy
13Environment for Development Yang et al.
will result in a slower fall in VDT. First, congestion decreases the vehicle distance travelled; cars
drive less when driving is less efficient. Because the lottery may result in improved congestion,
we might expect VDT to increase. Second, lower overall vehicle ownership rates will result in
fewer cars per household; as a result, those cars may be driven more intensively. The lottery
limits the ability of households to expand from one car to two cars, because household members
who already hold car registrations cannot enter the lottery.
Effects on the Average Fuel Consumption Rate (AFCR)
As documented above, one effect of the lottery policy was a shift in the composition of
motor vehicles purchased. Beijing car buyers moved upmarket, purchasing imported cars and
luxury cars at a much higher frequency. Because these cars tend to be larger and heavier, they
also tend to be less fuel efficient.
To illustrate this point, Mercedes-Benz, Volvo, BMW, Toyota, and Audi are 5 of the 6
least fuel efficient brands of vehicles. After bouncing up and down between 2008 and 2010, their
collective market share grew by 80% in 2011 and held steady in 2012. It is likely that the advent
of the lottery shifted buyers toward these brands.
Using 2008-2012 data on sales by brand and AFCR by brand from the China Association
of Automobile Manufacturers, we estimate the AFCR of each year’s mix of cars sold in Figure
12. Based on the shift in sales toward cars with higher AFCR, we calculate that the AFCR of cars
sold in Beijing increased by 3.3% between 2010 and 2011.
We assume that the AFCR under the no policy scenario will hold at 11 liters per 100 km;
this is the AFCR we calculated for sales between 2008 and 2010. To estimate the AFCR under
the lottery policy, we assume that Beijing will add 400,000 new cars with a higher AFCR mix to
its car fleet each year.6 Using our estimates of the total number of passenger vehicles from earlier
in this section, we then calculate what fraction of this fleet will be composed of the older mix of
cars, which we assume to have an AFCR of 11 liters per 100 km travelled, and what fraction will
be composed of the newer mix of cars, which have an AFCR of 11.4 liters per 100 km travelled.
The result of our estimate is that the AFCR of the overall car fleet increases in an approximately
linear fashion from 11 to 11.2 liters per 100 km between 2010 and 2020 under the lottery policy.
6 In 2011, the first year of the lottery, 400,000 vehicles were sold in Beijing.
14Environment for Development Yang et al.
Effects on Total Fuel Use
Using Equation 1, and our estimates from earlier in this section, we calculate three
scenarios. First, we calculate the fuel used under the NPS. Second, we calculate the fuel used
under the lottery policy.
We also calculate, as a third scenario, the lottery policy without other adjustments. In this
scenario, we calculate the fuel used when the number of vehicles has been restricted by the
lottery, but use the VDT and the AFCR estimated from the no policy scenario.
The results of these simple calculations are displayed in Figure 13. Consider first the fuel
used under the no policy scenario and under the lottery policy scenario with no adjustments. The
wide gap between these two lines reflects the effect of restricting the number of cars sold through
the lottery policy. The total fuel consumed is expected to decline in the years immediately
following the lottery policy, reflecting the continuation of the sharp downward trend in vehicle
distance travelled.
Now consider the fuel used under our primary estimate of the lottery policy. Although the
amount of fuel consumed in Beijing by passenger vehicles is lower than it would be with no
lottery policy in place, this line is far closer to the no policy scenario than it is to the lottery
policy scenario with no adjustments. In 2020, the total number of vehicles under the lottery
policy is 20% lower than the number under the NPS. However, total fuel consumed is only 3%
lower.
There are two reasons for this disparity. First, we anticipate that vehicle distance travelled
will fall less sharply under the lottery policy. Second, the lottery policy has encouraged
consumers to concentrate their purchases on more expensive cars, resulting in a gradual shift in
the vehicle mix toward less fuel-efficient vehicles. These factors have the combined of effect of
mitigating the fuel savings that would be expected from cutting the number of vehicles by means
of the lottery policy.
Discussion and Conclusion
We have analyzed a policy that is unique in the world: the use of a lottery to allocate
vehicle license plates. To conclude, we would like to highlight three key findings from this
study.
First, the lottery policy did have a significant effect on both vehicles sold and congestion.
With this policy put in place alongside other policies aimed at improving transportation, Beijing
15Environment for Development Yang et al.
experienced a sharp drop in the number of vehicles sold and immediate improvements in
congestion. Increases in average driving speeds were also reported.
Second, the lottery policy might not decrease fuel consumption as much as might be
expected. Our projections suggest that, while the total number of vehicles in Beijing will be
decreased 20% by 2020, the annual consumption of fuel will decrease only 3%. This disparity
results because the lottery blunts expected increases in vehicle density rates, causing vehicle
distance travelled to fall less rapidly than expected. In addition, the lottery has caused Beijing
customers to buy less fuel-efficient cars.
Finally, the lottery had the unintended consequence of allocating vehicles to people who
clearly did not have the highest willingness-to-pay. The number of entries in Beijing rapidly
dwarfed the number of license plates available until the chance of winning was only 2% in
August 2012. Because each resident can enter the lottery only once each month, even a resident
with very high willingness-to-pay may not be able to purchase a license plate under these
circumstances. At the same time, a large number of lottery winners failed to buy vehicles.
Winning the lottery is similar to receiving the option to purchase a car; this has positive value
because the financial cost of entering the lottery is zero.
In summary, the Beijing Government has adopted a battery of market and non-market
policy instruments (e.g., driving restrictions, lottery, expansion of the subway system, parking
fees, fuel taxes, high-speed transit facilities, etc.) in an attempt to reduce the negative transport
externalities so apparent in the city. Compared to non-market mechanisms, market-based
mechanisms have often been advocated by economists as a better approach to allocating scarce
public resources, on grounds of economic efficiency and revenue generation. For example, fuel
taxes offer a second-best and administratively simple policy to deal with multiple externalities
from automobile use (Parry et al. 2007). Our analysis suggests that it is not enough to simply
prefer market to non-market mechanisms, but that it is also important to look closely at the
operation of specific policies, individually and in combination. In the future, evaluation of
possible unintended consequences of each policy, or comparisons of different policies such as
lottery versus auction, or auction versus gasoline tax, is needed.
16Environment for Development Yang et al.
References
Chen, X., and Zhao, J. 2013. Bidding to Drive: Car License Auction Policy in Shanghai and its
Public Acceptance. Transport Policy 27: 39–52.
Davis, L.W. 2008. The Effect of Driving Restrictions on Air Quality in Mexico City. Journal of
Political Economy 116: 38–81.
Eskeland, G.S., and T. Feyzioglu. 1997. Rationing Can Backfire: The “Day without a Car” in
Mexico City. The World Bank Economic Review 11(3): 383–408.
Hao, H., H. Wang, and M. Ouyangm. 2011. Comparison Policies on Vehicle Ownership and use
between Beijing and Shanghai and Their Impacts on Fuel Consumption by Passenger
Vehicles. Energy Policy 39: 1016–1021.
He, K.B., H. Huo, Q. Zhang, D.Q. He, F. An, M. Wang, M.P. Walsh. 2005. Oil Consumption
and CO2 Emissions in China’s Road Transport: Current Status, Future Trends, and Policy
Implications. Energy Policy 33: 1499–1507.
IBM. June 30, 2010. “The Globalization of Traffic Congestion: IBM 2010 Commuter Pain
Survey.”
Liu, D.M., S.P. Gao, and X.H. An. 2008a. Distribution and Source Apportionment of Polycyclic
Aromatic Hydrocarbons from Atmospheric Particulate Matter PM2.5 in Beijing.
Advances in Atmospheric Sciences 25: 297–305.
Manville, M., and D. Shoup. 2005. Parking, People, and Cities. Journal of Urban Planning and
Development 131(4): 233–245.
Parry, I., W. Harrington, and M. Walls. 2007. Automobile Externalities and Policies. Journal of
Economic Literature XLV: 374–400.
Xie, X., S. Zhang, R. Yi, D. Wu, and D. Huang. 2011. The Social Cost of Traffic Congestion in
Beijing. China Population Resources and Environment (in Chinese).
17Environment for Development Yang et al.
Figures and Table
Figure 1. Population Growth and Vehicle Growth in Beijing
Source: Beijing Transportation Research Center
18Environment for Development Yang et al.
Figure 2. Investment in Fundamental Transport Facilities in Beijing from 2001 to 2010
Source: Beijing Transportation Research Center
19Environment for Development Yang et al.
Figure 3. Congestion Index for Beijing (2007-2010)
Source: Beijing Transportation Research Center
20Environment for Development Yang et al.
Figure 2. Monthly Changes in New Cars in Beijing, 2010 and 2011
Source: Beijing Municipal Traffic Management Bureau
21Environment for Development Yang et al.
Figure 5. The Growing Number of Applicants to the Car Lottery, and the Diminishing
Chance of Success
Source: “Work Report of Thoughts and Measures on Controlling the Total Quantity of Motor Vehicles in the Face
of International Cities,” Beijing Municipal Transport Commission and Beijing Transportation Research Center
(November 2012).
22Environment for Development Yang et al.
Figure 6. Congestion Index Levels, before and after the Advent of the Beijing Car Lottery
Source: Beijing Transportation Research Center
23Environment for Development Yang et al.
Figure 7. Average Sales Price of Vehicles in Beijing
Source: Beijing Municipal Office of State Administration of Taxation
24Environment for Development Yang et al.
Figure 8. Changes in Sales of Cars between 2010 and 2011 in Beijing, by Brand of Car
Source: www.beiyacheshi.com
25Environment for Development Yang et al.
Figure 9. Projections of the Number of Passenger Vehicles in Beijing.
26Environment for Development Yang et al.
Figure 10. The Relationship between Vehicle Density and Average Distance Travelled in
Beijing.
27Environment for Development Yang et al.
Figure 11. Projections of Vehicle Distance Travelled in Beijing
28Environment for Development Yang et al.
Figure 12. Calculation of Overall Average Fuel Consumption Rate in Beijing
29Environment for Development Yang et al.
Figure 13. Calculation of Overall Fuel Consumption Rate in Beijing
Table 1. Total Numbers of Motor Vehicles in Beijing, in Millions
Year Motor Vehicles Private Vehicles Private Cars
2003 2.124 1.389 9.29
2004 2.296 1.547 1.107
2005 2.583 1.798 1.343
2006 2.876 2.065 1.612
2007 3.128 2.358 1.928
2008 3.504 2.693 2.289
2009 4.019 3.186 2.818
2010 4.809 3.909 3.566
2011 4.984 N/A 3.717
Source: Beijing Transport Annual Report (2003-2012)
30You can also read