ELECTRIC CARS AN OVERVIEW OF THE ELECTRIC CAR INDUSTRY AND ASSOCIATED TECHNOLOGY - Innovation Origins

Page created by Richard Moss
 
CONTINUE READING
ELECTRIC CARS AN OVERVIEW OF THE ELECTRIC CAR INDUSTRY AND ASSOCIATED TECHNOLOGY - Innovation Origins
ELECTRIC CARS
    AN OVERVIEW OF THE ELECTRIC CAR
INDUSTRY AND ASSOCIATED TECHNOLOGY
ELECTRIC CARS AN OVERVIEW OF THE ELECTRIC CAR INDUSTRY AND ASSOCIATED TECHNOLOGY - Innovation Origins
Table of contents

    Technology: The road to greater range and faster charging   Adoption: The drivers behind demand
    ▪ Batteries                                                 ▪ Sales growth

    ▪ Range                                                     ▪ Penetration rate

    ▪ Charging infrastructure                                   ▪ Sales potential

    Investment: The ideas leading to innovation                 Revenue: The segments and regions of growth
    ▪ Auto industry R&D                                         ▪ Market growth

    ▪ EV investments                                            ▪ Electric vehicle market size

    ▪ Patents                                                   ▪ EV battery market size

    Production: The leading regions, companies, and models      Sustainability: The issues that need to be tackled
    ▪ Assembly                                                  ▪ Transportation-related emissions

    ▪ Manufacturers                                             ▪ Renewable sources in power generation

    ▪ Models                                                    ▪ Materials used in batteries

2
ELECTRIC CARS AN OVERVIEW OF THE ELECTRIC CAR INDUSTRY AND ASSOCIATED TECHNOLOGY - Innovation Origins
Executive Summary

The history of motor vehicle manufacturing can be compared to a long and winding road which began in the second half of the 19th
century. Although the early 20th century saw the electric car accounting for about one third of road vehicles in operation in the United
States and Europe, this type of vehicle quickly became marginalized by diesel and gasoline-powered automobiles, including Ford’s
Model T. The so-called Tin Lizzy was built at such an exceptionally low cost that it became hard for electric vehicles (EVs) to compete.
The superior driving range of the internal combustion engine (ICE) used in gasoline and diesel-powered cars, coupled with a growing
number of gas stations which made refueling quick and easy, added further to the decline in the electric car’s popularity.
However, the love for diesel and gasoline-powered vehicles among customers in Europe and North America still took some unexpected
turns between 1973 and 2011. During these four decades, several instances of fossil fuel shortages roiled the world’s leading
economies and affected the prices of petroleum products. Additionally, some countries began to introduce higher taxes on fuel to
incentivize ecological sustainability. Since the first United Nations Framework Convention on Climate Change (UNFCCC) Conference of
the Parties was held in 1995, the rise of greenhouse gas (GHG) emissions has raised concerns among the United Nations member
states that greenhouse gases will increase surface temperature levels and thus lead to the destruction of the earth’s ecosystem.
Considering that the transportation sector is one of the leading producers of greenhouse gases, cutting GHG emissions from car travel
has emerged as an effective way to curb emission growth.
In light of these efforts to tackle GHG emissions, passenger electric vehicles have made a comeback: If electricity from renewable
energy sources is used to fuel them, EVs have the potential to play a vital role in the reduction of carbon dioxide and nitrogen oxide
emissions. This is an even more important undertaking today, as the light vehicle market has increased tremendously over the past two
decades, approaching the 100 million vehicle sales mark.
Batteries remain the electric car’s greatest vulnerability. Recharging will have to become easier, and range will have to improve. In the
end, EVs can only be environmentally benign if the industries providing the commodities used in electric vehicle batteries are able to
reduce their impact on the planet.

3
ELECTRIC CARS AN OVERVIEW OF THE ELECTRIC CAR INDUSTRY AND ASSOCIATED TECHNOLOGY - Innovation Origins
Electric vehicle timeline

1832   Robert Anderson creates the first crude electric carriage
1900   Ferdinand Porsche develops the world’s first hybrid
1935   Gasoline-powered cars force EVs out of the market
1996   General Motors launches the EV1
1997   Toyota releases the Prius - the first mass-produced hybrid car
2008   Tesla Motors launches its Roadster, an all-electric luxury sports car
       BYD releases the F3DM - the world’s first plug-in hybrid compact sedan
2010   General Motors introduces the Chevy Volt - the first mass-produced plug-in hybrid;
       Nissan releases the all-electric Leaf
2014   Nissan Leaf sales surpass the 100,000 unit mark
2018   The Model 3 becomes Tesla’s best-selling model

4
ELECTRIC CARS AN OVERVIEW OF THE ELECTRIC CAR INDUSTRY AND ASSOCIATED TECHNOLOGY - Innovation Origins
01   Technology: The road to greater range
     and faster charging
     ▪ Batteries
     ▪ Range
     ▪ Charging infrastructure
ELECTRIC CARS AN OVERVIEW OF THE ELECTRIC CAR INDUSTRY AND ASSOCIATED TECHNOLOGY - Innovation Origins
Improved battery technology is the key to competitiveness

While Toyota is betting big on fuel cell electric vehicles (FCEVs), many other carmakers are focusing on battery technology. There are
two major categories of batteries holding the potential to power EVs: solid-state batteries and liquid electrolyte batteries. While solid-
state batteries for EVs have not yet reached market commercialization, the latter have been used in EVs for many decades.
In 2016, the lithium-ion batteries in some Samsung Galaxy Note 7 devices caught fire and exploded. This incident shows how difficult it
is to manufacture lithium-ion batteries that are both efficient and stable. When the EV battery industry began to add nickel to their
battery cells to increase the range of electric vehicles, the inclusion of cobalt and manganese was required to prevent the battery from
losing stability by controlling how nickel and lithium ions move between the battery cell’s anode and cathode.
▪ Research into electric vehicle battery technology aims to achieve the following:
    › low costs
    › high capacity and stability
    › quick and easy recharging
▪ 50 percent of BEV manufacturing costs are powertrain-related
▪ Declining battery costs are expected to push electric vehicle sales
▪ Finding the right material mix will be key to winning the EV battery race
▪ Consumers demand higher range, lower costs, and easier access to charging infrastructure
▪ Electric vehicle energy charging demand will push electricity use in the United States – and probably across all other markets too

6
ELECTRIC CARS AN OVERVIEW OF THE ELECTRIC CAR INDUSTRY AND ASSOCIATED TECHNOLOGY - Innovation Origins
50 percent of BEV manufacturing costs are powertrain-related                                                         As of 2018, the costs
                                                                                                                     unrelated to the electric
                                                                                                                     powertrain in a battery
                                                                                                                     electric vehicle (BEV) only
                                                                                                                     account for about 50
                                                           Share of BEV manufacturing costs in 2018                  percent of the overall
                                        0   10             20               30                   40   50        60   manufacturing costs.
                                                                                                                     Battery cells currently
                         Battery cell                                 25                                             account for around 25
                                                                                                                     percent of costs attributed
                                                                                                                     to the manufacturing of all-
                                                                                                                     electric vehicles, and thus
Electric motor and power electronics                  15
                                                                                                                     hold the greatest potential
                                                                                                                     for cost reduction.

                  Battery integration            10

    Costs unrelated to the powertrain                                                                      50

      Note: Worldwide
      Source(s): JPMorgan Chase; BCG
7
ELECTRIC CARS AN OVERVIEW OF THE ELECTRIC CAR INDUSTRY AND ASSOCIATED TECHNOLOGY - Innovation Origins
Lithium-ion battery pack costs are set to reach a record low in 2019                                                                                                                                                                    This year, lithium-ion
                                                                                                                                                                                                                                        battery pack costs are
                                                                                                                                                                                                                                        expected to drop to 158
                                                                                                                                                                                                                                        U.S. dollars per kilowatt
                                                                                                                                                                                                                                        hour.
                                                                     1200
                                                                                                                                                                             Estimated cost in 2018 in U.S. dollars per battery pack    Battery pack costs are
                                                                                                                                                                         0             500           1000          1500          2000
     Costs between 2010 and 2019 in U.S. dollars per kilowatt hour

                                                                                                                                                                                                                                        driven by size, production
                                                                                 1,000
                                                                     1000                                                                                                                                                               volumes, and costs
                                                                                                                                                               Cobalt                                                        1,764      attributable to the
                                                                                                                                                                                                                                        commodities used in the
                                                                      800                                                                                                                                                               manufacturing process.
                                                                                                                                                                                                                                        Electric vehicles may be
                                                                                                                                                                Nickel                                              1,433
                                                                                                  599                                                                                                                                   less vulnerable to fossil
                                                                      600
                                                                                                                                                                                                                                        fuel prices, but they
                                                                                                                                                                                                                                        continue to be susceptible
                                                                      400
                                                                                                                                                                                                                                        to a volatile commodity
                                                                                                                                                     Lithium carbonate                                   1,005                          market. As a result of
                                                                                                                   273
                                                                                                                                                                                                                                        cobalt’s contribution to EV
                                                                      200                                                           158                                                                                                 battery pack costs in 2018,
                                                                                                                                                                                                                                        automotive manufacturers
                                                                                                                                                             Graphite                       536                                         and suppliers are now
                                                                        0                                                                                                                                                               seeking alternatives to this
                                                                                 2010             2013             2016            2019*
                                                                                                                                                                                                                                        commodity and other
                                                                                                                                                                                                                                        expensive materials.

                                                                     Note: Worldwide
                                                                     Source(s): Bloomberg New Energy Finance; Bloomberg; PwC; Strategy&; Various sources
 8
ELECTRIC CARS AN OVERVIEW OF THE ELECTRIC CAR INDUSTRY AND ASSOCIATED TECHNOLOGY - Innovation Origins
Battery chemistry trends diverge between China and the rest of the world                                                          By 2020, natrium-
                                                                                                                                  manganese-nickel (NMC)
                                                                                                                                  battery cathodes are
                                                                               LMO        LFP   NCA   NMC-622   NMC-811           expected to include more
                                      120.0%                                                                                      nickel than today’s
                                                                                                                                  batteries and the cobalt
                                                                                                                                  content in the more novel
                                      100.0%
                                                                                                                                  NMC-622 and NMC-811
                                                                                                                                  types is projected to be
                                                                                                                          15%
                                                                                                                                  significantly lower than in
                                                                       32%                                                        the NMC-111 batteries that
     Projected market share in 2020

                                      80.0%
                                                                                                                                  are used most commonly
                                                                                                                                  today. Taking into
                                                                                                                                  consideration that cobalt
                                      60.0%                                                                                       prices rose fourfold
                                                                                                                                  between 2016 and 2018,
                                                                       40%                                                73%     the trend towards lower
                                      40.0%                                                                                       cobalt levels may make
                                                                                                                                  EV batteries more cost-
                                                                                                                                  effective in the long run.
                                      20.0%                                                                                       Concurrently, the level of
                                                                       26%                                                        nickel in the NMC-811 and
                                                                                                                           2%
                                                                                                                                  the nickel-cobalt-aluminum
                                                                                                                          10%
                                       0.0%
                                                                        2%                                                        (NCA) variants is set to
                                                            Worldwide (excluding China)                                   China   exceed the 80 percent
                                                                                                                                  mark, leading to enhanced
                                                                                                                                  battery capacity.
                                      Note: Worldwide
                                      Source(s): McKinsey
 9
ELECTRIC CARS AN OVERVIEW OF THE ELECTRIC CAR INDUSTRY AND ASSOCIATED TECHNOLOGY - Innovation Origins
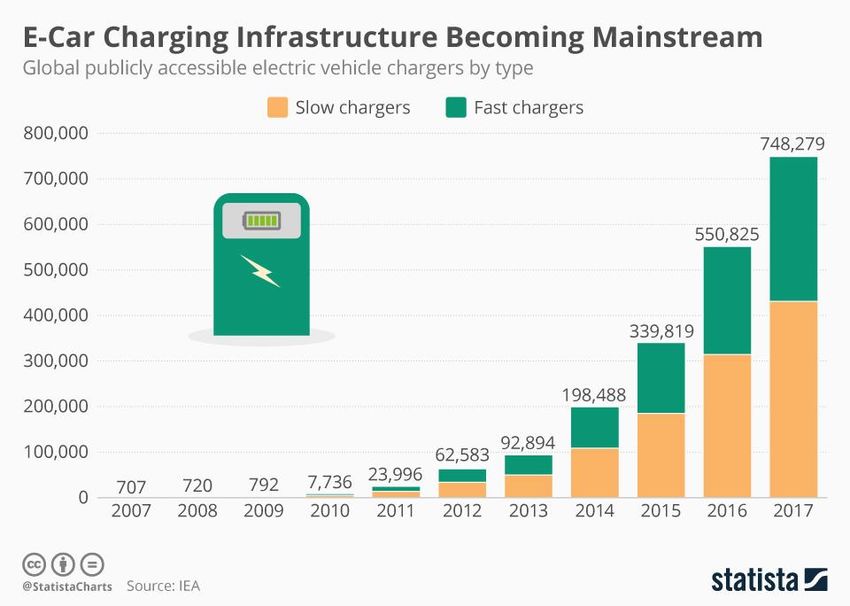
Battery chemistry composition is expected to drive mild increases in battery capacity levels

                                                                                                       Plug-in hybrid electric vehicles          Battery electric vehicles

                                                50

                                                                                                                                                                                         45
                                                45                                                                                                      43
                                                                                                 41
                                                40
 Estimated battery capacity in kilowatt hours

                                                35

                                                30

                                                25

                                                20

                                                15
                                                                        10.2                                              10.6                                               11
                                                10

                                                5

                                                0
                                                                                    2017                                                  2021                                    2025

                                                     Note: Worldwide
                                                     Source(s): Various sources; BMO Capital Markets
 10
Consumers are expected to welcome the converging range gap between electric and ICE cars

                                 EV range in kilometers                                Share of respondents surveyed in 2018 who will not consider buying
 500                                                                                                                  EV

                                                                                                   0.0%        10.0%         20.0%     30.0%        40.0%
 450                                                               440

                                                                                        Price/cost                                                35%
 400                                           380

 350
                                                                                         Charging                                    24%
                   300
 300

                                                                                            Range                             18%
 250

 200                                                                                                                                                        Cost reductions,
                                                                          Uncertainty about future
                                                                                                                       12%
                                                                            tech developments                                                               better charging
 150                                                                                                                                                        infrastructure,
                                                                                                                                                            and longer
 100                                                                       Suitability for daily use               11%                                      ranges will help
                                                                                                                                                            convince those
  50                                                                                                                                                        who said they
                                                                                             Image        1%                                                would not switch
     0                                                                                                                                                      to an electric car
                   2020                       2025                 2030                                                                                     in 2018.

         Note: Worldwide; 18 years and older; 2,028 Respondents;
         Source(s): Oliver Wyman; VDA; Merrill Lynch; KPMG

11
Electric vehicle public charging infrastructure growth is waning globally

                                                    80.0%

                                                                                71%
                                                                                       69%
                                                    70.0%
 EV public charging infrastructure percent growth

                                                    60.0%

                                                    50.0%

                                                    40.0%
                                                                                              33%

                                                    30.0%

                                                    20.0%

                                                    10.0%

                                                    0.0%
                                                                                2015   2016   2017

                                                      Note: Worldwide
                                                      Source(s): AlixPartners
 12
Range anxiety remains a
     common concern among
     those consumers who are
     hesitant to purchase an
     electric car.
     In addition to this,
     consumers are concerned
     that the electric car
     charging infrastructure in
     place today is not yet
     sufficient for widespread,
     carefree recharging.
     No matter how much the
     number of charging outlets
     has grown over the past
     decade, consumers want
     to be able to recharge
     whenever their battery is
     low – and they want to do
     it fast.

13
Slow   Fast                                    Number of chargers
                                                                                           was not equally
                                        Number of EV chargers in 2017
                     0         50000   100000                   150000   200000   250000   distributed across
            China
                                                                                           markets in 2017
                                                                                           Consumers cannot yet
     United States                                                                         expect to find a charging
                                                                                           outlet whenever they need
      Netherlands
                                                                                           it although the number of
            Japan
                                                                                           electric vehicle supply
                                                                                           equipment (EVSE)
           Others                                                                          chargers grew a
                                                                                           thousandfold between
         Germany                                                                           2007 and 2017.

           France
                                                                                           Moreover, there is a
                                                                                           distinction between slow
United Kingdom                                                                             and fast chargers, different
                                                                                           socket standards, and
          Norway                                                                           payment methods, making
                                                                                           it even more difficult for
          Canada
                                                                                           consumers to find the
                                                                                           charging point they need.
            Korea

          Sweden

        Note: Worldwide
        Source(s): IEA; EAFO
14
Despite being the second
     largest sales market for
     electric vehicles, the
     United States trailed most
     countries in terms of
     electric vehicle charging
     density in 2017.
     In addition to this, the
     charging outlets that do
     exist are provided by a
     number of charging
     networks using varying
     standards in terms of plug
     size and power limits.

15
Electric vehicle charging infrastructure fragmentation left consumers confused in 2018

                                                                              Number of charging outlets as of July 18, 2018 by network
                  0                          5000                           10000                      15000                        20000   25000    30000

 ChargePoint                                                                                                                                23,992

         Tesla                                                      7,758

          Blink                          3,494

SemaConnect                        2,657

         EVgo                    2,372

      Greenlots          992

        Note: United States
        Source(s): Alternative Fuels Data Center; Automotive News
 16
Energy demand for electric vehicle charging is expected to be highest in North America by 2030

                                                                         Projected demand in 2030 in megawatt hours
                 0                                  50                      100                            150        200            250

 North America                                                   78.74

         China                                           68.32

       Europe                               34.16

        Japan           10.17

     Worldwide                                                                                                              207.99

     Note: Worldwide
     Source(s): Wood Mackenzie; Bloomberg
17
Electric vehicle energy charging demand will push electricity use in the United States

                   EV charging demand in billion kilowatt hours                            Electricity use in billion kilowatt hours
 60                                                                      6000

                                                                  53
                                                                                                                                               5,193
                                                                                                                                       4,932
 50                                                                      5000
                                                                                                                             4,712
                                                                                                                    4,509
                                                                                                          4,352
                                                                                                4,203
                                                                                        4,039
 40                                                                      4000   3,853

 30                                                                      3000

                                         23

 20                                                                      2000

 10                                                                      1000
                 6

  0                                                                         0
               2020                     2025                      2030          2017    2020     2025      2030     2035      2040     2045    2050

      Note: United States
      Source(s): McKinsey; EIA
 18
02   Investment: The ideas leading to
     innovation
     ▪ Auto industry R&D
     ▪ EV investments
     ▪ Patents
Investments are the foundation on which the industry stands

Investments need to be made not only in the field of electric vehicle-related battery technology, but also with regards to the sufficient
provision of charging outlets. Providing the infrastructure for all the various types of electric vehicles proves to be a difficult task, after an
entire industry had focused on diesel and gasoline-propelled motor vehicles for almost a century.
The tightening of environmental regulation puts pressure on carmakers and suppliers alike to invest in emerging electric vehicle
technologies. The shift away from internal combustion engines may not come without risks, but the introduction of new technologies
offers additional opportunities for automotive suppliers and manufacturers.
While some original equipment manufacturers (OEMs) in the motor vehicle manufacturing and parts industry started shifting their
attention towards the connected driving and mobility services realms, others have made it paramount to invest in green vehicles:
•    Globally operating traditional automakers invest most heavily in R&D activities
•    Tesla has the highest R&D intensity in the industry
•    France is the leading European nation in terms of electric vehicle-related technology

20
“I hope you will still recognize us as being the inventor of
                                                                     „
     the car, but we should be defined by our future, not by our
                                  past.”

                         – Dieter Zetsche,
     Chairman of Daimler AG and Head of Mercedes-Benz Cars

21
Traditional OEMs invest most heavily in R&D activities                                                                                                                 Traditional automotive
                                                                                                                                                                       OEMs were the ones
                                                                                                                                                                       investing most heavily in
                                                            R&D spending in FY 2018 in billion U.S. dollars                                                            research and development
                   0                 2                4                 6                8                10                12               14           16      18   (R&D) activities during the
                                                                                                                                                                       2018 fiscal year.
     Volkswagen*                                                                                                                                          15.53        That said, the highest ratio
                                                                                                                                                                       of R&D spending to
                                                                                                                                                                       revenue was yielded by a
                                                                                                                                                                       firm with a comparatively
        Daimler*                                                                                                 10.36                                                 small sales base: Tesla.

        Toyota**                                                                                          9.58

            Ford                                                                             8.2

General Motors                                                                            7.8

       Note: Worldwide
       Source(s): Statista; Volkswagen; Daimler; Toyota; Ford; General Motors
       * VW: the value refers to R&D costs in the automotive division; VW & Daimler: These figures have been converted at the following rate, correct
       as of March 1, 2019: 1 euro = 1. 13835 U.S. dollars; ** this figure has been converted at the following rate, correct as of March 1, 2019: 1,000
       Japanese yen = 9. 00558 U.S. dollars; the figure is for FY ended March 31, 2018.
22
R&D intensity by carmaker as of June 2018
                                                                                                                                                               Tesla outperformed its larger
                        0.0%             2.0%             4.0%         6.0%           8.0%          10.0%                    12.0%            14.0%            competitors in terms of R&D to
                                                                                                                                                               sales ratio in 2018
                  Tesla                                                                                                         11.7%
                                                                                                                                                               The following list includes a selection of
                                                                                                                                                               investments and partnerships:
     Volkswagen Group                                                        5.7%
                                                                                                                                                               ▪ Daimler: invests in ChargePoint,
                                                                                                                                                                 collaborates with BYD, is part of IONITY
                 Honda                                                    5.4%
                                                                                                                                                               ▪ BMW: invests in ChargePoint, is part of
                                                                                                                                                                 IONITY, collaborates with Umicore,
                   Ford                                                 5.1%                                                                                     Northvolt
                                                                                                                                                               ▪ VW: invests in ChargePoint , is part of
Isuzu Motors Limited                                                   5%
                                                                                                                                                                 IONITY
                                                                                                                                                               ▪ Ford: is part of IONITY
                  BMW                                                  5%                                                                                      ▪ GM: invests in Evgo
                                                                                                                                                               ▪ Hyundai: collaborates with Hawtai
       General Motors                                                  5%                                                                                      ▪ Delphi: is owner of NuTonomy
                                                                                                                                                               ▪ Shell: is owner of NewMotion, invests in
                Renault                                           4.4%                                                                                           Sonnen
                                                                                                                                                               ▪ BP: invests in PowerShare, FreeWire,
         Suzuki Motors                                            4.4%                                                                                           StoreDot, Chargemaster
                                                                                                                                                               ▪ Total SA: is owner of G2mobility, Saft SA,
        Note: Worldwide
                                                                                                                                                                 collaborates with Nexans
        Source(s): PwC; Strategy&; Various sources
        According to the source, all sales and R&D expenditure values in foreign currencies were converted into U.S. dollars at an average of the exchange rate over the relevant period;
        all figures are for the last fiscal year, as of June 30, 2018.
23
Daimler and Tesla dedicated ~ 90 percent of patents to green vehicles between 2012 and 2016

          0               10          20   30        40   50   60   70         80          90          100

Daimler                                                                                         90.4

  Tesla                                                                                         90.4

     VW                                                                             84.2

  Audi                                                                    77

  BMW                                                                    76.3

     GM                                         35

      Note: Worldwide
      Source(s): Oliver Wyman; WIPO

24
Globally operating carmakers are projected to account for almost two thirds of investments in 2023

                                                         Projected R&D funding in 2023 by investor in billion U.S. dollars
                                 0                  50      100                      150                           200       250         300

  Globally operating OEMs                                                                                    184

            Chinese OEMs                       32

Globally operating suppliers              21

         Chinese suppliers           10

           EV niche OEMs             9

                       Total                                                                                                       255

       Note: Worldwide
       Source(s): AlixPartners
25
Qualcomm has filed one of the most valuable patents in the field of EVs                                                                                         Qualcomm’s 2017 R&D
                                                                                                                                                                costs-to-revenue ratio was
                                                                                                                                                                comparatively high with
                                                                                                                                                                around 25 percent. The
                                                                                                                                                                company filed some 2,163
                                 4500         4,024                                                                                                             patents in 2017.
     Number of applications in

                                 4000
                                 3500                      2,965                                                                                                In 2018, an EV wireless
                                 3000                                   2,637        2,521
                                 2500                                                                   2,163        1,945                                      charging patent application
             2017

                                                                                                                                     1,818          1,757
                                 2000
                                 1500
                                                                                                                                                                was submitted on behalf of
                                 1000                                                                                                                           Qualcomm and approved
                                  500
                                    0
                                                                                                                                                                by the USPTO.
                                             Huawei       ZTE Corp.   Intel Corp.   Mitsubishi   Qualcomm Inc.   LG Electronics       BOE         Samsung
                                           Technologies                              Electric                                     Technological   Electronics   It was considered a
                                                                                                                                     Group                      scientific breakthrough and
                                                                                                                                                                acquired by WiTricity in
                                                                                                                                                                2019.
                                   30.0%
                                                                                                 25%                                       25%
 Qualcomm’s research and
  development costs as a

                                   25.0%                    22%
     share of revenue

                                   20.0%

                                   15.0%

                                   10.0%

                                    5.0%

                                    0.0%
                                                            2016                                 2017                                     2018

                        Note: Worldwide
                        Source(s): WIPO; Qualcomm
26
9000                                                                     Moderate
                                                                                                           8,500
                                                                                                                   growth in
                                          8000                                                                     EV-related
                                                                                         7,500                     patent
                                                                                                                   filings
                                          7000
                                                                                                                   can be
                                                                                                                   anticipated
                                          6000
     Number of EV-related patents filed

                                                                                                                   Most electric
                                                                                                                   vehicle-
                                          5000                                                                     related
                                                                                                                   patents were
                                                                                                                   granted in the
                                          4000                                                                     electric
                                                                                                                   propulsion
                                                                                                                   and
                                          3000
                                                                                                                   secondary cell
                                                                                                                   manufacturing
                                          2000                                                                     segments,
                                                                                                                   with most of
                                                                                                                   the activity
                                          1000                                                                     occurring in
                                                                                                                   China and the
                                             0
                                                                                                                   United States.
                                                                                          2018             2020

                                          Note: Worldwide
                                          Source(s): Power Electronics World (powerelectronicsworld.net)
27
Technology       Industry     Market                                                             France seemed better equipped in
                                                                                                                                                   terms of technology than other
                                                                    Index score
               0                    2                 4                  6                   8                  10                  12             European markets in 2018
                                                                                                                                                   Not only is France home to some of the
       China       0.9                                                5                                                5                           world’s leading automotive manufacturing
                                                                                                                                                   groups, such as Groupe Renault and
                                                                                                                                                   Groupe PSA, but the country is also the
        U.S.                1.8                                           4.6                                        4.5
                                                                                                                                                   domestic market of Total SA-owned Saft
                                                                                                                                                   Groupe SA, one of the few battery
                                                                                                                                                   manufacturers in Europe with an
                                                                                                                                                   international presence.
       Japan                1.8                                       4.3                                      4.2
                                                                                                                                                   France’s carmakers offer a range of electric
                                                                                                                                                   vehicles in the non-premium segment,
                                                                                                                                                   including Europe’s second-best-selling all-
     Germany                      2.2                          3                                                5
                                                                                                                                                   electric car, the Renault Zoe.

      France                            2.9          1.5                                                 5

South Korea                    2.1                                  3.8                            3.1

      Note: Worldwide
      Source(s): Roland Berger; fka

      The indicators are defined by the source as follows:
      Technology: Current status of electric vehicle-related technology developments made by domestic OEMs, and national subsidy program support
      Industry: National vehicle, system and component production industry added value
28    Market: National electric vehicle market size based on current customer demand
03   Production: The leading regions,
     companies, and models
     ▪ Production volume
     ▪ Models
     ▪ OEMs
„
     “   “The first step is to establish that something is possible;
                         then probability will occur.”

                             – Elon Musk,
                     CEO of Tesla, Inc. and SpaceX

30
Production volumes are beginning to pick up after a slow start

Policymakers saw the opportunity to replace ICE cars with electric vehicles as soon as the effects of road transportation on air quality
became apparent. However, the CEOs of traditional carmakers, such as Volkswagen or General Motors, seemed to lack the
imagination to believe in the electric vehicle’s success for the best part of two decades. Some 16 years after Tesla’s founding, traditional
automotive manufacturers have likely turned a corner, and, along with new entrants from the Chinese mainland - including BYD, Chery,
and Hawtai - they are now hot on Tesla’s heels.
It is expected that over 30 million hybrid cars and plug-in electric vehicles will be produced by 2025, with battery electric vehicles
accounting for almost 50 percent of total production.
▪ Worldwide production volume of all-electric vehicles is expected to grow fourfold
▪ Growth is expected to be highest in the plug-in electric vehicle segments, but hybrid production will continue to rise
▪ China is predicted to remain the largest market in terms of electric vehicle production by country
▪ Additional model launches are expected to trigger consumer demand

31
Battery and plug-in hybrid vehicles are projected to experience the highest growth

                                  16                                                                12
                                                               14.8
                                                                                                                       10.5
                                  14
                                                                                                    10

                                  12

                                                                                                    8

                                                                      PHEV production in millions
     BEV production in millions

                                  10

                                  8                                                                 6

                                  6
                                                                                                    4
                                                                                                                 3
                                  4                     3.5

                                                                                                    2
                                  2

                                                0.5                                                      0.2
                                  0                                                                 0
                                               2015     2020   2025                                      2015   2020   2025

                                  Note: Worldwide
                                  Source(s): McKinsey
32
6                                          Hybrid production
                                                                                   will continue despite
                                                                            5.4
                                                                                   smaller output levels
                                        5                                          The production of hybrid
                                                                                   electric vehicles is
                                                                                   projected to grow to about
                                                                                   5.4 million units globally by
                                        4                                          2025.
     Hybrid EV production in millions

                                                                                   This volume is significantly
                                                                                   lower than the anticipated
                                                                                   10.5 million units in the
                                        3                            2.9
                                                                                   plug-in hybrid electric
                                                                                   vehicle segment and the
                                                                                   14.8 million units in the
                                                                                   battery electric vehicle
                                        2
                                                                                   segment but the market is
                                                                                   still likely to grow.
                                                              1.2

                                        1

                                        0
                                                              2015   2020   2025

                                        Note: Worldwide
                                        Source(s): McKinsey
33
Asia will remain the leading producer of electric vehicles throughout 2030

                                                                                         Expected xEV production volume by 2030 in million units
                         0                      5                      10                    15                   20                    25         30   35          40

                 Asia*                                                                                                                                       37.6

               Europe                                                                                  16.5

       North America                           4.4

       South America          0.8

Middle East and Africa       0.4

     Note: Worldwide
     Source(s): IHS Markit
     * The figures for India, China, Japan, South Korea, and the ASEAN region have been added up.
     The term xEV refers to battery and plug-in hybrid vehicles.
34
EV* production in 2021 in thousand units
                                                                                                                                   China will continue to lead on a
                               0         1000          2000          3000          4000         5000        6000   7000     8000   country-by-country level through ‘21
                                                                                                                                   The following list presents a selection of
                      China                                                                                         6,843          announcements on EVs made by OEMs:
                                                                                                                                   ▪ Toyota is expected to release 10 EV
                                                                                                                                     models by 2020
               United States                                               3,058                                                   ▪ VW is committed to launch more than 50
                                                                                                                                     BEV models by 2025
                                                                                                                                   ▪ Renault-Nissan wants EVs to account for
                                                                                                                                     20 percent of sales by 2023
                   Germany                                     2,247
                                                                                                                                   ▪ GM will launch two EV models in 2019
     Country

                                                                                                                                   ▪ PSA is to launch 27 EV models by 2023
                      Japan                   1,023                                                                                ▪ Ford plans to release 40 EV models by
                                                                                                                                     2022
                                                                                                                                   ▪ By 2022, Daimler plans to release 10 EV
                                                                                                                                     models
                     France               763
                                                                                                                                   ▪ BMW is expected to launch the Mini E, the
                                                                                                                                     i5, and the X3 i between 2019 and 2021
                                                                                                                                   ▪ BAIC intends to add 10 EV models to its
               South Korea              632                                                                                          portfolio by 2025
                                                                                                                                   ▪ Geely plans to launch two more models
                                                                                                                                     under its Polestar brand by 2025
                Note: Worldwide
                Source(s): Forschungsgesellschaft Kraftfahrwesen Aachen; Roland Berger
                * Numbers refer to battery-powered and plug-in hybrid vehicles.
35
Global number of battery electric vehicle model launches between 2015 and 2020

                                   80

                                                                                             73

                                   70

                                                                                                    59
                                   60
                                                                                                           55
Number of new BEV model launches

                                   50
                                                                                      44

                                   40

                                   30

                                   20                                          17
                                                         14

                                   10

                                   0
                                                        2015                   2016   2017   2018   2019   2020

                                        Note: Worldwide
                                        Source(s): LMC Automotive; Citigroup
36
Global number of plug-in hybrid electric vehicle model launches between 2015 and 2020

                                    70

                                                                                                     64

                                    60
Number of new PHEV model launches

                                    50
                                                                                                            45
                                                                                              42
                                    40

                                    30

                                                                                       20
                                    20
                                                                                16

                                    10
                                                           7

                                    0
                                                         2015                   2016   2017   2018   2019   2020

                                         Note: Worldwide
                                         Source(s): LMC Automotive; Citigroup
37
04   Adoption: The drivers behind
     demand
     ▪ Sales
     ▪ Penetration rate
     ▪ Forecasts
Demand is affected by cost competitiveness and mobility trends

Ten years from now, plug-in electric vehicles are expected to account for close to half of all vehicle sales. It is also projected that electric
vehicle adoption will be driven by growing access to public charging infrastructure in tandem with increased vehicle model availability.
Furthermore, electric vehicles are projected to pique consumers’ interest, once the cost of ownership reaches parity with ICE vehicles;
this is predicted to happen over the course of the next two to four years.
Innovative trends in the field of mobility services such as car-sharing, ride-sharing, and ride-hailing are forecast to raise consumer
awareness and help users familiarize themselves with EV technologies.
▪ The share of ICE cars in overall light vehicle sales is forecast to fall to almost 50 percent by 2030
▪ As adoption levels pick up, the electric vehicle market is projected to gain traction
▪ Mobility service fleets are set to fuel electric vehicle demand
▪ Tesla has emerged as the market leader in battery electric vehicle sales
▪ The Model 3 has become Tesla’s best-selling model

39
Key drivers of electric vehicle adoption                                                                                                                     It is predicted that EV
                                                                                                                                                             buyers want the total cost
                                                                                                                                                             of ownership in tandem
                                                                                                                                                             with potential government
                                                           Supply side factors                             Demand side factors
                                                                                                                                                             subsidies to be within the
                                                                                                                                                             range of what they would
                                                                                                                                          Electricity/ oil
                                                                                                                                                             normally have to pay for a
                                                                                                                                             prices          comparable ICE car.
                                                                                                                                            Efficiency       New mobility trends are
                                                                       Availability of                                                                       projected to help
                                                                         vehicles
                                                                                                                                         Manufacturing       consumers familiarize
                                                                                                                                            costs
                                                                                                                                                             themselves with EV
                                                                         Variety of                      Cost              is driven
                               OEM competition        increases
                                                                          models                     competitiveness           by            National        technologies.
                                                                                                                                            subsidies
                                                                                                                                                             As soon as consumers are
 Political                                                                                 EV
                                                                                                                                          Maintenance        satisfied with the
                triggers                                                                                                                     costs
frameset                                                                                 adoption                                                            availability of suitable
                                                                       Availability of                                        are
                                                                         chargers
                                                                                                    Consumer attitudes
                                                                                                                          affected by                        models and a sufficient
                                Implementation
                                                                                                                                         Range anxiety       charging infrastructure,
                                                     increases
                                of infrastructure
                                                                                                                                                             adoption levels can be
                                                                                                                                           Awareness         expected to pick up speed.
                                                                         Speed of                    Adoption of new         are
                                                                         charging                     mobility trends    affected by
                                                                                                                                         Availability of
                                                                                                                                        Mobility services

                                                                                                                                          Availability of
                                                                                                                                        Autonomous cars

       Note: Worldwide
       Source(s): Statista; Nytimes.com; ICCT; Consumer Affairs; Renew Economy; L.E.K.
40
The cost of refueling ICE cars is often higher than the running costs of electric vehicles

                                      8
                                           6.89
                                                                                                                                                                                                                        Assuming that
     Gasoline prices as of Q4 2018

                                                     6.6      6.48
                                      7                                6.12     6.09   5.95      5.83                                                                                                                   an average
       in U.S. dollars per gallon

                                      6
                                      5
                                                                                                            4.85      4.7
                                                                                                                                4.22
                                                                                                                                                                                                                        ICE sedan
                                                                                                                                          3.95      3.95       3.94      3.88
                                      4                                                                                                                                                                                 has a fuel
                                                                                                                                                                                    2.6      2.48
                                      3                                                                                                                                                                 2.06            economy of
                                      2
                                                                                                                                                                                                                 0.54   30 mpg, and
                                      1
                                      0                                                                                                                                                                                 thus a
                                                                                                                                                                                                                        consumption
                                                                                                                                                                                                                        level of about
                                                                                                                                                                                                                        3.3 gallons
                                                                                                                                                                                                                        per 100 miles,
                                                                                                    U.S.     Norway       France     Germany                                                                            low power
                                      12                                                                                                                                                                                rates may
     Costs* in 2018 in U.S. dollars

                                      10
                                                                                                                                                                 9.57                                          9.68     help convince
                                                                         8.07                                      8.25
                                                                                                                                                                                                                        consumers to
             per 100 miles

                                      8
                                                                                                                                             5.69      5.69                                5.75      5.76               switch to an
                                      6                4.79      4.8                            4.9        4.91
                                                                                                                                   3.58                                          3.61
                                                                                                                                                                                                                        electric car,
                                      4       3.01                                     3.08
                                                                                                                                                                                                                        especially in
                                      2                                                                                                                                                                                 markets
                                      0                                                                                                                                                                                 where gas
                                                      Hyundai IONIQ                            Tesla Model 3                                 Nissan Leaf II                                 Renault Zoe
                                                                                                                                                                                                                        prices are
                            Note: Worldwide                                                                                                                                                                             high.
                            Source(s): Bloomberg; IMF; UN; World Bank; CleanTechnica; nextmove.de; Eurostat; chooseenergy.com
                            * The results are based on estimated consumption rates by model and average residential electricity prices by country. The values have been converted from euros to U.S. dollars
                            at an average annual rate of 1 euro = 1.18 U.S. dollars, as retrieved from the ECB.
41
The sales share of ICE vehicles continues to decline globally

                              Gasoline   Diesel   Mild hybrid electric vehicle (MHEV)   Hybrid electric vehicle (HEV)   Battery electric vehicle (BEV)   Plug-in hybrid electric vehicle (PHEV)

                     120.0%

                     100.0%
                                                                                             1%                                                          6%
                                                                                             1%
                                                                  19%                        2%                                                          14%
                     80.0%                                                                   1%
                                                                                                                                                         13%
Share of car sales

                     60.0%                                                                                                                               15%

                                                                                                                                                         5%

                     40.0%
                                                                  76%

                                                                                                                                                         47%
                     20.0%

                      0.0%
                                                                 2017                                                                                    2030

                       Note: Worldwide
                       Source(s): BCG
42
Projected size of the global electric vehicle fleet between 2020 and 2030

                                140

                                                                                            127

                                120

                                100

                                                                                     87
Vehicles in fleet in millions

                                 80

                                                                              60
                                 60

                                                                       40
                                 40

                                                                25

                                 20
                                                     13

                                  0
                                                    2020        2022   2024   2026   2028   2030

                                  Note: Worldwide
                                  Source(s): Business Insider
43
„
     “   “We are convinced that the future of carsharing is electric.”

                              – Olivier Reppert,
                             CEO of Share Now

44
Fleet size in 2025 in million units
                                                                                                                                  Mobility fleet electrification is set to
                                     0           5     10   15       20        25         30       35      40   45           50   spark EV adoption
                                                                                                                                  Electrification will be key to other mobility
                                                                                                                                  areas due to growing environmental
                       Carpooling                                                                                    44.98        commitments and lower maintenance costs
                                                                                                                                  associated with the parts in battery electric
                                                                                                                                  vehicle motors.
                                                                                                                                  Some firms have begun to unlock the value
                                                                                                                                  of mobility services:
                       Ridehailing                                                                      35.93                     ▪ Daimler: is owner of Share Now, ViaVan
                                                                                                                                  ▪ BMW: is owner of Share Now, Moovit
                                                                                                                                      › Share Now has 3,200 BEVs in fleet1
                                                                                                                                  ▪ VW: is owner of Moia
             Car rental & sharing                    7.26                                                                             › Moia has 100 BEVs in fleet2
                                                                                                                                  ▪ GM: is owner of Maven, BOOK, invests in
                                                                                                                                    Lyft
                                                                                                                                      › Maven has 20 BEVs in fleet3
                                                                                                                                  ▪ Hyundai-Kia: invests in Grab
Carsharing (fleet-based and P2P)          1.42
                                                                                                                                  ▪ Avis: is owner of Zipcar
                                                                                                                                  ▪ Uber: collaborates with Daimler, Toyota,
                                                                                                                                    VW
                                                                                                                                  ▪ Didi: collaborates with VW
     Note: Worldwide
     Source(s): Bank of America; Merrill Lynch
45
Battery electric vehicles   Plug-in hybrid electric vehicles   Hybrids           China
                                                      12000                                                                                                              holds the
                                                                                                                                                                         potential to
                                                                                                                                                                         extend its
                                                      10000
                                                                                                                                                                         lead with
                                                                                                                                                                 636     regards to
                                                                                                                                                                         EV sales
     Projected 2030 vehicle sales in thousand units

                                                                                                                                                                         throughout
                                                       8000
                                                                                                                                                                         2030
                                                                                                                                                                 3,863
                                                                                                                                                                         It is expected
                                                                                                                                                                         that sales to
                                                       6000                                                                                                              customers in
                                                                                                                                                                         China will
                                                                                                                              592
                                                                                                                                                                         continue to be
                                                                                436
                                                                                                                                                                         crucial for EV
                                                       4000
                                                                                                                             1,976                                       manufacturers
                                                                                1,638
                                                                                                                                                                         throughout
                                                                                                                                                                 5,507   2030. This is
                                                       2000
                                                                                                                                                                         true for the
                                                                                                                                                                         hybrid and
                                                                                                                             2,864
                                                                                2,293                                                                                    plug-in
                                                                                                                                                                         electric
                                                          0                                                                                                              vehicle
                                                                                U.S.                                        Europe                               China   segments.

                                                         Note: Worldwide
46                                                       Source(s): Citigroup
47
Estimated electric vehicles in use in selected countries as of 2017

                                                 PHEV     BEV

                                       Number of electric vehicles in thousands
            0            200   400        600                           800       1000   1200   1400

  China

     U.S.

  Japan

 Norway

Germany

       Note: Worldwide
       Source(s): IEA
48
China’s electric vehicle registration share is expected to grow                                                                                                                 While historical light
                                                                                                                                                                                vehicle registration data
                                                                                                                                                                                shows that Norway might
                                                                                                                                                                                reach an electric vehicle
                                                                                                                                                                                sales share of 50 percent
                                    Plug-in hybrid electric vehicle sales in China                                EVs as a share of light vehicle registrations in 2017         soon, several experts’
                                    Battery electric vehicle sales in China                                0.0%       10.0%      20.0%         30.0%         40.0%      50.0%   outlook figures show that
                       900000
                                                                                                    Norway                                                    39.2%
                                                                                                                                                                                China has the potential to
                                                                              ~ 770,000 PEV
                                                                              sales in 2017
                                                                                                                                                                                become the undisputed
                       800000                                                                       Sweden               6.3%                                                   leading market in terms of
                                                                                     125,000
                       700000                                                                   Netherlands        2.7%
                                                                                                                                                                                EV sales by 2030.

                                                                                     652,000        Finland
                                                                                                                                                                                The country has great
                       600000                                                                                      2.6%
                                                                                                                                                                                potential with combined
     Number of units

                       500000
                                                                                                      China       2.2%                                                          battery and plug-in electric
                                                            98,000
                                                                                                        UK        1.7%
                                                                                                                                                                                vehicle sales of around
                       400000                                                                                                                                                   770,000 units and a
                                                            409,000
                                                                                                     France       1.7%                                                          registration share of 2.2
                       300000          83,610                                                                                                                                   percent in 2017.
                                                                                                   Germany        1.6%
                       200000         247,482
                                                                                               United States      1.2%

                       100000                                                                  New Zealand        1.1%

                            0                                                                       Canada        1.1%
                                        2015                  2016                    2017

                       Note: Selected countries
                       Source(s): CAAM; IEA
49
Battery-electric vehicle sales worldwide in the 1st quarter 2018, by brand

                                                                             Sales in Q1 2018 in units
             0            5000                             10000                      15000              20000            25000                 30000

     Tesla                                                                                                                             27,529

     BAIC                                                                                                                         26,409

  Nissan                                                                                                         22,666

      JAC                                                               11,597

 Renault                                                           10,482

     Chery                                         8,193

      VW                                   6,779

     Zotye                         5,640

 Hyundai                          5,494

Chevrolet                        5,159

        Note: Worldwide
        Source(s): JATO
50
Worldwide plug-in electric vehicle sales in 2018, by model

                                                                        Sales in thousand units

                            0              20   40                       60                       80              100   120   140            160

            Tesla Model 3                                                                                                           145.85

          BAIC EC-Series                                                                                  90.64

              Nissan Leaf                                                                              87.15

           Tesla Model S                                        50.05

           Tesla Model X                                       49.35

          BYD Qin PHEV                                        47.45

             JAC iEV E/S                                     46.59

                  BYD e5                                     46.25

       Toyota Prius PHEV                                 45.69

Mitsubishi Outlander PHEV                             41.89

             Renault Zoe                             40.31

               BMW 530e                              40.26

            Chery eQ EV                          39.73

      Note: Worldwide
      Source(s): EV Sales; insideevs.com
51
After production and
Tesla has ramped up its Model 3 deliveries after a slow start                                  delivery volume targets
                                                                                               were missed in late 2017
                                                                                               and early 2018, the Model
                                                                                               3 has turned into Tesla’s
                                                       Model S   Model X   Model 3
                                                                                               best-selling model during
                                    100000
                                                                                               the fourth quarter of 2018.
                                     90000                                                     As of February 2019, the
                                                                                               Model 3 is Tesla’s most
                                     80000                                                     recent model addition, as
                                                                                               the first units rolled off the
                                     70000                                                     assembly line in 2017. It
     Number of vehicle deliveries

                                                                                               comes at a price tag of
                                     60000                                           63,150    35,000 U.S. dollars (and
                                     50000
                                                                                               up), thus targeting broader
                                                                                               customer segments than
                                     40000                                                     the Model S and Model X,
                                                                                               both of which are aimed
                                     30000    1,550                                            towards the high-end
                                                                                               market segments. Tesla’s
                                             13,120                                  14,050
                                     20000                                                     new Model Y was unveiled
                                                                                               in March 2019; production
                                     10000
                                             15,200                                  13,500    is expected to start in
                                        0
                                                                                               2020.
                                             Q4 2017                                 Q4 2018

52
05   Revenue: The segments and regions of
     growth
     ▪ Market growth
     ▪ Electric vehicle market size
     ▪ EV battery market size
The electric vehicle market is beginning to gain momentum

The fact that electric car sales accounted for about two to three percent of overall light vehicle sales leaves great opportunities for
growth for carmakers and automotive suppliers alike. Charging equipment manufacturers emerge as a third group of beneficiaries who
can expect a golden age of electrified transportation.
▪ The United States and China are market leaders in terms of market growth, while Europe lags behind
▪ The electric vehicle battery market has enormous potential
▪ Wireless electric vehicle charging is set to revolutionize the sector

54
China’s rising affluence correlates with electric vehicle market growth                                                                                                                  The electric vehicle market
                                                                                                                                                                                         in the Asia-Pacific region is
                                                                                                                                                                                         expected to expand its
                                                                                                                                                                                         volume at a compound
                                                                                                                                                                                         annual growth rate of
                                                                                                                                              Market volume CAGR between 2016 and 2026
                                                      40000
                                                                                                                                       0.0%   5.0% 10.0% 15.0% 20.0% 25.0% 30.0% 35.0%
                                                                                                                                                                                         almost 30 percent
                                                                                                              36,396.20                                                                  between 2016 and 2026.
                                                      35000
                                                                                                                                                                                         This comes as no surprise
     Per capita income of urban households in China

                                                                                                  31,194.80
                                                                                                                            Asia-Pacific                                       29.5%
                                                                                                                                                                                         considering the vast
                                                      30000
                                                                                                                                                                                         number of potential buyers
                                                                                      26,467.00
                                                                                                                                                                                         in this populous region,
                                                      25000                                                                                                                              coupled with the rising
                                                                          21,809.78
                                                                                                                                                                                         affluence of its growing
                         in yuan

                                                      20000                                                                                                                              middle class.
                                                              17,174.65                                                   North America                                       28.5%

                                                      15000

                                                      10000

                                                                                                                                Europe                                23.2%
                                                       5000

                                                          0
                                                                2009        2011        2013        2015        2017

                                        Note: Selected countries or regions
                                        Source(s): National Bureau of Statistics of China; BIS Research
55
Size of the global market for electric vehicles in 2017 and 2025

                                  600
                                                                                              567.3

                                  500
Revenue in billion U.S. dollars

                                  400

                                  300

                                  200

                                                                                     118.86
                                  100

                                    0
                                                                                      2017    2025

                                    Note: Worldwide
                                    Source(s): Allied Market Research; PR Newswire
56
Projected global wireless EV charging market size in 2020 and 2025                      Wireless charging
                                                                                        infrastructure is
                                           450                                          slated to be a game
                                                                                        changer
                                                                                 407
                                           400                                          The wireless technology is
                                                                                        set to facilitate the
                                                                                        charging process, and
                                           350
                                                                                        customers are expected to
                                                                                        welcome the
     Market size in million U.S. dollars

                                           300                                          seamlessness that will
                                                                                        accompany wireless
                                           250
                                                                                        charging.
                                                                                        Evatran and WiTricity are
                                           200
                                                                                        the leading providers in
                                                                                        this field.

                                           150

                                           100

                                            50

                                                                           8
                                             0
                                                                          2020   2025

                                           Note: Worldwide
                                           Source(s): MarketsandMarkets
57
58
Market cap of lithium-ion battery component manufacturers worldwide as of September 2017

                                                                Market cap as of September 4, 2017 in million U.S. dollars
                           0                2000       4000   6000              8000             10000                 12000   14000         16000            18000

            Asahi Kasei                                                                                                                              16,597

                  Toray                                                                                                                     15,328

     Mitsubishi Chemical                                                                                                           14,042

 Sumitomo Metal Mining                                                                                 9,946

                Umicore                                                                 8,406

        Mitsui Chemical                                           6,020

       Hitachi Chemical                                       5,610

          Ube Industries                           3,016

Mitsui Mining & Smelting                           2,982

           Central Glass              922

               W-scope            641

         Nippon Carbon          436

       Note: Worldwide
       Source(s): Goldman Sachs; Various sources
59
Global market share of lithium ion battery makers in the 1st quarter of 2018

                                                            Market share
                0.0%             5.0%           10.0%                      15.0%    20.0%           25.0%

Panasonic Sanyo                                                                             21.1%

          CATL                                                             14.41%

           BYD                                            10.99%

      LG Chem                                           10.59%

      Samsung                           5.57%

      Note: Worldwide
      Source(s): electrive.com
60
06   Sustainability: The issues that need to
     be tackled
     ▪ Transportation-related emissions
     ▪ Renewable sources in power generation
     ▪ Materials used in batteries
Today’s electric vehicles fall short of sustainability goals

While EVs clearly have the potential to outperform ICE cars in terms of fuel-related emissions, it is not easy to ascertain if electric
vehicles are environmentally sustainable, or not. There is no denying in the fact that all motor vehicles have an impact on the
environment, though.
▪ Questions about EVs financial sustainability aside, the key factors in gauging the sustainability of EVs include the following:
     › type of energy used as a source of power
     › battery material types
▪ Although electric cars have a smaller carbon footprint than gasoline or diesel-powered automobiles, a shift away from coal power will
  be necessary to soften the transportation sector’s carbon footprint
▪ To date, battery supply chain sustainability has not been achieved due to the continued unsustainable mining of key materials,
  including cobalt, lithium, and nickel
▪ The growing demand for those commodities that are used in the manufacture of electric vehicle batteries is likely to have an impact
  on spot prices

62
„
     “      “(…) [E]lectromobility alone is not effective climate
          protection. We need an energy transition alongside the
         transport transition to truly improve our carbon footprint”

                             – Herbert Diess,
                        CEO of Volkswagen Group

63
Rise in anthropogenic CO2 emission levels requires mitigation                                                                                                                                  Since the second half of the 20th century,
                                                                                                                                                                                               the combustion of fossil fuels has led to the
                                                                                                                                                                                               release of unfettered volumes of carbon
                                                                                                                                                                                               dioxide (CO2) emissions into the
                                                                                                                                                                                               atmosphere. The resulting concentration of
                                   41,396.8
                                                                                                                                             Emissions in 2016 in kilograms per capita         CO2 in the atmosphere continues to
                                                                                                                                         0      1000 2000 3000 4000 5000
                                                                                                                                                                                               exacerbate what has been dubbed the
                                   36,396.8                                                                           Total emissions                                            4,350         greenhouse effect: The earth’s surface
                                                                                                                                                                                               temperature rises because solar heat is
                                   31,396.8                                                                            Electricity and
                                                                                                                      heat generation                      1,805                               absorbed by molecules of carbon dioxide
Emissions in million metric tons

                                   26,396.8
                                                                                                                                                                                               and other greenhouse gases, including
                                                                                                                      Transportation*                 1,059                                    nitrous oxide, methane, and water vapor.
                                   21,396.8
                                                                                                            Manufacturing industries
                                                                                                                                                     822
                                                                                                                                                                                               Higher surface temperatures have been
                                                                                                               and construction
                                   16,396.8
                                                                                                                                                                                               linked to rises in sea levels, stronger
                                                                                                                           Residential         254                                             hurricanes, and changes in precipitation
                                   11,396.8                                                                                                                                                    patterns.
                                                                                                                   Other energy
                                                                                                                                               214
                                    6,396.8
                                                                                                                industries own use**                                                           The transportation sector contributes some
                                                                                                                     Commercial and                                                            eight gigatons of carbon dioxide
                                                                                                                                              113
                                    1,396.8                                                                           public services                                                          equivalents worth of emissions globally4.
                                                                                                                                                                                               Under the auspices of the UN, 197 ratifiers
                                   -3,603.2
                                                                                                                                                                                               have thus agreed to mitigate vehicle-
                                                                                                                                                                                               related fuel combustion CO2 emissions by
                                                                                                                                                                                               replacing ICE vehicles with EVs.

                                        Note: Worldwide
                                        Source(s): IEA, Global Carbon Project

                                        * Includes international bunkers in transport sector. ** Includes emissions from own use in petroleum refining, the manufacture of solid fuels, coal
                   64                   mining, oil and gas extraction and other energy-producing industries.
Conventional sources represent ~ 90 percent of the power mix                                                                                               About 40 percent of electricity generation
                                                                                                                                                           worldwide comes from the combustion of
                                                                                                                                                           coal. In order to be environmentally benign,
                                                                                                                                                           EVs need to make use of as little coal
                                                                                                                                                           power as possible because of the severe
                            14.0%
                                                                                                                                           11%
                                                                                                                                                   12.1%   health effects caused by its combustion. If
      Share of renewables

                            12.0%                                                                                             10%
                                                                                                        8.6%       9.2%                                    renewable sources are used as the primary
                            10.0%                                                             8%
                            8.0%                            5.9%       6.1%
                                                                                  6.9%                                                                     source of power though, the widespread
                                      5.2%       5.3%
                            6.0%                                                                                                                           adoption of electric cars is predicted to
                            4.0%                                                                                                                           reduce GHG emission levels in a significant
                            2.0%
                                                                                                                                                           manner.
                            0.0%
                                      2007                  2009                  2011                  2013                  2015                  2017   Although the share of renewable power in
                                                                                                                                                           electricity generation has more than
                                                                                                                                                           doubled over the past decade, electricity
                                                                                                                                                           generated from coal, oil, gas, nuclear, and
                                        5.39                                                                                                               conventional hydro sources still accounts
      in metric tons of carbon
      GHG emissions in2017

                                                          4.76                                                                                             for almost 90 percent of power generation.
       Transportation sector

         dioxide per capita

                                                                           4.04              4.03
                                                                                                                                                           Therefore, the current power mix is unlikely
                                                                                                               2.04
                                                                                                                                                           to lessen the carbon footprint associated
                                                                                                                                1.99             1.85
                                                                                                                                                           with emissions from the transportation
                                                                                                                                                           sector.
                                         U.S.           Canada           Australia       Saudi Arabia      South Korea        Germany            France    The transportation sector in the United
                                                                                                                                                           States produced the highest volume of
                                                                                                                                                           GHG emissions per capita in 2017, when
                                                                                                                                                           the U.S. car parc comprised almost 270
                             Note: Worldwide                                                                                                               million vehicles.
                             Source(s): Enerdata; Climate Transparency; UNEP; Bloomberg New Energy Finance; FS-UNEP Collaborating Centre
                             Large hydro is not considered a renewable energy source in this data set.

 65
Power mix continues to affect the carbon footprint of EVs                                                                           The increased use of electricity from
                                                                                                                                    renewable sources softens EVs’ carbon
                                                                                                                                    footprint, but electric car owners need to
                                                                                                                                    make an active choice to recharge where
                                             2017 share of coal power              2017 share of electric
                                                generation worldwide             vehicle stock worldwide                            coal is not used as the primary energy
                       China                                         44.8%                             39.5%                        source. However, this choice is not an easy
                       United States                                 13.5%                             24.5%
                                                                                                                                    one to make, considering the complex
                       Japan                                          3.5%                              6.6%
                                                                                                                                    nature of the energy market with all its
                                                                                                                                    regional regulations. Ultimately, it is the
                       Germany                                        2.5%                              3.5%
                                                                                                                                    share of coal power in a country’s
                       Netherlands                                    0.3%                              3.8%
                                                                                                                                    electricity mix that determines the carbon
                       UK                                             0.2%                              4.3%
                                                                                                                                    footprint of its EV fleet unless motorists
                       France*                                        0.1%                              3.8%
                                                                                                                                    select charging stations with low coal levels
                       Norway**                                            -                            5.7%
                                                                                                                                    in the power mix.
                                                                                                                                    China has the largest EV fleet, but also the
                                                       CO2 emissions in g/mile                                                      highest share of coal in its energy mix.
                            0           50            100           150           200           250           300
                                                                                                                                    Norway’s EV fleet has shown impressive
           EVs in China                                                           188.5                                             growth and the country’s coal use is
        EVs in the U.S.                                                147.5                                                        nonexistent, but Norway’s overall car
           EVs in Japan                                               142.7                                                         market is small: Norway saw passenger car
       EVs in Germany                                                140.4                                                          sales of under 150,000 units in 20185.
          EVs in the UK                            76.2
                                                                                                                                     France seems to be well prepared, but its
          EVs in France         2.7
                                                                                                                                    dependence on nuclear power has led
      Gasoline vehicles                                                                            248.5
                                                                                                                                    some experts to question the sustainable
                                                                                                                                    viability of the French EV market.
      Note: Worldwide
      Source(s): IEA; BP; Statista; Bloomberg New Energy Finance; World Economic Forum
      Coal power: * The value for France (10.52 TWh) is for 2016; was taken from IEA's website, as this country was not listed.
      ** The figure for Norway (146 GWh) is for 2016; it's based on information on IEA's website, as this country was not listed.
 66
Cobalt share of materials as of 2018
                                                                                                                Cobalt remains a critical ingredient
           0            5                10         15           20           25            30   35   40   45   in most battery types
                                                                                                                A growing electric vehicle industry is
     LCO                                                                                              39        expected to spur the demand for several
                                                                                                                materials, most notably cobalt, lithium, and
                                                                                                                nickel.
NMC-111                                            13                                                           The composition of these commodities
                                                                                                                varies among the different types of lithium-
                                                                                                                ion batteries that are used in electric cars,
NMC-433                                       11                                                                most notably nickel manganese cobalt
                                                                                                                (NMC) batteries.
                                                                                                                Currently, most electric vehicles are
NMC-532                              8                                                                          equipped with NMC-111 batteries. In 2018,
                                                                                                                cobalt accounted for around 13 percent of
                                                                                                                materials used in NMC-111 batteries, while
NMC-622                          7                                                                              lithium cobalt oxide (LCO) batteries
                                                                                                                reached the highest level of cobalt with
                                                                                                                about 40 percent.
     NCA                     6

NMC-811                 4

      Note: Worldwide
      Source(s): Bloomberg New Energy Finance; Bloomberg
      NMC: nickel manganese cobalt; LCO: lithium cobalt oxide; NCA: nickel cobalt aluminum
67
Africa and the Middle East   Americas   Asia-Pacific   Europe          Regional breakdown
                                       1600                                                                          of battery electric
                                                                                                                     vehicle sales shows
                                                                                                                     Asia-Pacific’s
                                       1400
                                                                                                                     dominance
                                                                                                                     The tremendous growth in
                                       1200                                                                          electric vehicle sales that
                                                                                                                     has already occurred
                                                                                                                     globally is slated to trigger
     Vehicle sales in thousand units

                                       1000
                                                                                                                     worldwide demand for the
                                                                                                                     various commodities used
                                                                                                                     in electric vehicle
                                        800
                                                                                                                     batteries, too.

                                        600

                                        400

                                        200

                                          0
                                              2012                                                            2018

68
Lithium-ion batteries will likely drive lithium consumption

                                                                                                                                                       Battery consumption      Other

                                  600                                                                                          160000

                                                                         509

                                                                                Consumption in metric tons lithium carbonate
                                                                                                                               140000                                                                     134,897
                                  500
                                                                                                                                                                                            118,505
                                                                                                                               120000                                        111,585
      Demand in kilotons of LCE

                                  400                                                                                                       100,942
                                                                                                                               100000
                                                                                                                                                           96,668

                                                                                                equivalent
                                                                 24.7%
                                                                 CAGR                                                                                                                                 77,821
                                  300                                                                                          80000
                                                                                                                                                                                        64,398
                                                                                                                               60000
                                  200
                                                                                                                                                                    39,463
                                                                                                                               40000
                                                                                                                                                      29,058
                                  100
                                                           87                                                                           20,026
                                                                                                                               20000

                                    0                                                                                              0
                                                          2017           2025                                                              2008          2010           2012               2014          2016

                                  Note: Worldwide
                                  Source(s): McKinsey; Roskill

 69
Battery-related demand for cobalt drives Congolese cobalt production                                                                                                                     The batteries segment
                                                                                                                                                                                         within the global cobalt
                                                                                                                                                                                         market is expected to see
                                                                                                                                                                                         a compound annual
                                                                                                                                                Share of global production in 2017       growth rate of just over 15
                                                                                                                                        0.0% 10.0% 20.0% 30.0% 40.0% 50.0% 60.0% 70.0%
                                                                                                                                                                                         percent.
                                                                   140
                                                                                                                              DR Congo                                       58.8%
                                                                                                                                                                                         Cobalt is often extracted in
                                                                                                                                  Russia      5.14%                                      regions where safe
      Battery-related cobalt demand in kilotons of refined metal

                                                                   120                                          117
                                                                                                                                Australia     4.59%                                      working conditions are not
                                                                                                                                 Canada       3.95%
                                                                                                                                                                                         always guaranteed,
                                                                   100                                                                                                                   including the Democratic
                                                                                                                                   Cuba      3.86%
                                                                                                                                                                                         Republic of the Congo. An
                                                                    80
                                                                                                                              Philippines    3.67%                                       estimated 20 percent of
                                                                                                                            Madagascar       3.49%
                                                                                                                                                                                         Congolese cobalt comes
                                                                                                                                                                                         from the country’s artisanal
                                                                    60                                                 Papua New Guinea      2.94%
                                                                                                                                                                                         mining sector, where
                                                                                                                                 Zambia      2.66%                                       workers lack basic
                                                                                         38
                                                                    40                                                    New Caledonia      2.57%                                       protective equipment,
                                                                                                                                                                                         exposing them to toxic,
                                                                                                                             South Africa    2.3%
                                                                    20
                                                                                                                                                                                         metal-containing dust6.
                                                                                                                           United States    0.6%

                                                                                                                          Other countries     5.42%
                                                                     0
                                                                                        2017                    2025

                                                                    Note: Worldwide.
                                                                    Source(s): US Geological Survey; McKinsey

 70
Low-level battery-related nickel demand is forecast to grow                                                                                        Nickel is expected to be the EV battery
                                                                                                                                                   commodity yielding the highest compound
                                                                                                                                                   annual growth rate between 2018 and 2025
                                                                           Primary nickel consumption in 2017 in thousand metric tons              with 41 percent.
                                                              0      200       400       600    800       1000     1200    1400      1600   1800
                                                                                                                                                   However, the toxicity of this metal has
Stainless steel and special steels                                                                                                    1,562.2      sparked concerns about the negative
                                                  Alloys                 171.2
                                                                                                                                                   impact of nickel mining on the environment
                                                                                                                                                   and production workers7.
                   Electroplating                                        149.8
                                                                                                                                                   While the metal manufacturing industry
                   Special steels                                        149.8                                                                     mainly uses low-grade nickel ores, the
                                                                                                                                                   more stable nickel sulfate is required for
                               Batteries                             107                                                                           the manufacture of batteries. This might be
                                                    Other         21.4
                                                                                                                                                   the reason why batteries only accounted
                                                                                                                                                   for about five percent of primary nickel
                                                                                                                                                   consumption worldwide in 2017.
                                                        700                                                            665
                       Consumption in thousand metric

                                                        600

                                                        500

                                                        400
                                   tons

                                                        300

                                                        200

                                                        100                      60

                                                          0
                                                                                 2018                                  2025

        Note: Worldwide
        Source(s): Norilsk Nickel; Various sources (Company data); UBS; Metal Bulletin

 71
Glossary

BEV - Battery electric vehicles run only on electricity, using power from a battery.
CO2 - Carbon dioxide is a greenhouse gas.
EV - BEVs, FCEVs, PHEVs, and hybrid electric vehicles.
EVSE - Electric vehicle supply equipment, or chargers, provide EVs with electricity.
FCEV - Fuel cell electric vehicles run only on electricity, using power from a fuel cell.
GHG - Greenhouse gases comprise methane, nitrous oxide, water vapor and carbon dioxide. GHG molecules absorb solar heat and
thus lead to an increase in the earth’s temperature.
Hybrid vehicles - Hybrid vehicles run mainly on gasoline or diesel, but have an electric motor as well.
ICE - Internal combustion engines create energy from burning fossil fuels such as diesel and gasoline.
MPG - Miles per gallon measure the number of miles a motorist can drive in a vehicle using one gallon.
NMC batteries - Nickel manganese cobalt batteries, also abbreviated NCM
PEV - Plug-in electric vehicles comprise PHEVs and BEVs, can be plugged in to charge from an off-board electric power source.
PHEV - Plug-in hybrid electric vehicles run mainly on electricity, but have an ICE as well.
Rechargeable batteries - In batteries, electricity is produced through the movement of electrons between anode and cathode.
Rechargeable batteries function according to the same principle, but also have the ability to be recharged.
xEV - BEVs and PHEVs

72
Footnotes

1   Share Now (2019): “Your Car is Always There”, retrieved from https://www.your-now.com/our-solutions/share-now
2Moia (2019): “Premiere am Rathaus: MOIA startet Testbetrieb”, retrieved from https://www.moia.io/de-DE/blog/premiere-am-rathaus-
moia-startet-testbetrieb-in-hamburg/
3 General Motors (2018): “Maven Joins City of Austin, Texas in Deploying All-Electric Shared Use Fleet of Chevrolet Bolt EVs”, retrieved
from https://media.gm.com/media/us/en/maven/pressroom.detail.html/content/Pages/news/us/en/2018/mar/0302-maven-austin.html
4 IEA   (2019): “CO2 Emissions Statistics”, retrieved from https://www.iea.org/statistics/co2emissions/
5 Opplysningsrådet    for Veitrafikken AS (2019): “Registreringsstatistikk”, retrieved from
https://ofv.no/registreringsstatistikk?selectedDistribution=Fylkesfordelt&selectedMonth=12&selectedVehicleCategory=Personbiler&selec
tedYear=2018
6 O‘Driscoll,  Dylan; University of Manchester (2017): “Overview of child labour in the artisanal and small-scale mining sector in Asia and
Africa “, retrieved from https://assets.publishing.service.gov.uk/media/5a5f34feed915d7dfb57d02f/209-213-Child-labour-in-mining.pdf
7 CDC    (2018): “Workplace Safety and Health Topics: Nickel“, retrieved from https://www.cdc.gov/niosh/topics/nickel/default.html

73
Sources
Alix Partners                   Electrive.com           MarketsandMarkets                        Tesla
Allied Market Research          Enerdata                Metal Bulletin                           Toyota
Alternative Fuels Data Center   Eurostat                Merrrill Lynch                           UBS
Automotive News                 EPA                     Moia                                     UN
Bank of America                 fka                     National Bureau of Statistics of China   UNEP
BCG                             Ford                    Nextmove.de                              US Department of Energy
BIS Research                    FS-UNEP                 New York Times                           US Geological Survey
Bloomberg                       General Motors          Norilsk Nickel                           VDA
Bloomberg New Energy Finance    Global Carbon Project   O‘Driscoll, Dylan                        Volkswagen
BMO Capital Markets             GlobeNewswire           Oliver Wyman                             WIPO
BP                              Goldman Sachs           Opplysningsrådet for Veitrafikken AS     World Bank
Business Insider                ICCT                    Power Electronics World                  Wood Mackenzie
CAAM                            IEA                     PR Newswire                              World Economic Forum
CDC                             IHS Markit              PwC
Chooseenergy.com                IMF                     Qualcomm
Citigroup                       Insideevs.com           Renew Economy
Climate Transparency            JATO                    Roland Berger
Consumer Affairs                JP Morgan Chase         Roskill
Daimler                         KPMG                    Samsung
EAFO                            McKinsey                Share Now
ECB                             L.E.K.                  Statista
EIA                             LMC Automotive          Strategy&

74
Recommendations

Dossiers
Electric vehicles worldwide
Electric vehicles in the U.S.
Electric vehicles in Italy
Electric vehicle industry in the Netherlands
Tesla

Top lists
Top 200 Companies: Electric Motors, Generators and Transformers

Mobility Market Outlook
Tesla (Passenger Cars)
In-depth: eMobility

Digital Market Outlook
Ride Hailing

75
Authors, Imprint, and Disclaimer
                                  Isabel Wagner
                                  Senior Researcher

                                  Isabel Wagner is the Statista
                                  specialist for research on
                                  transportation, metals, and
                                  electronics in the U.S. She is
                                  an expert for mobility-related
                                  trend topics such as electric
                                  and autonomous vehicles.

E-M ail: isabel.wagner@statista.com

Released: March 2019

Imprint
Statista, Inc. ▪ 55 Broad Street, 30th floor ▪ New York, NY 10004 ▪ +1 (212) 433 2270 ▪ www.statista.com

Disclaimer
Statista, Inc. shall not be liable for any loss, injury, claim, liability, or damage of any kind resulting in any way from (a) any errors in or omissions from the Statista, Inc. industry report(s) or
any Materials available or not included therein, (b) the unavailability or interruption of the Statista, Inc. industry report(s) or any features thereof or any Materials, (c) An Authorized User or
Member's use of the Statista, Inc. industry report(s), Online Services, or Materials, (d) the loss or corruption of any data or equipment in connection with the Statista, Inc. industry report(s), (e)
the content, accuracy, or completeness of Materials, all regardless of whether you received assistance in the use of the Statista, Inc. industry report(s) from a Covered Party, (f) any delay or
failure in performance beyond the reasonable control of a Covered Party, or (g) any content retrieved from the Internet even if retrieved or linked to from within the Statista, Inc. industry
report(s).

  76
You can also read