Superhuman spatial hearing technology for ultrasonic frequencies - Nature
←
→
Page content transcription
If your browser does not render page correctly, please read the page content below
www.nature.com/scientificreports
OPEN Superhuman spatial hearing
technology for ultrasonic
frequencies
Ville Pulkki*, Leo McCormack & Raimundo Gonzalez
Ultrasonic sources are inaudible to humans, and while digital signal processing techniques are
available to bring ultrasonic signals into the audible range, there are currently no systems which also
simultaneously permit the listener to localise the sources through spatial hearing. Therefore, we
describe a method whereby an in-situ listener with normal binaural hearing can localise ultrasonic
sources in real-time; opening-up new applications, such as the monitoring of certain forms of wild life
in their habitats and man-made systems. In this work, an array of ultrasonic microphones is mounted
to headphones, and the spatial parameters of the ultrasonic sound-field are extracted. A pitch-
shifted signal is then rendered to the headphones with spatial properties dictated by the estimated
parameters. The processing provides the listener with the spatial cues that would normally occur if the
acoustic wave produced by the source were to arrive at the listener having already been pitch-shifted.
The results show that the localisation accuracy delivered by the proof-of-concept device implemented
here is almost as good as with audible sources, as tested both in the laboratory and under conditions
in the field.
Human spatial hearing capability1 is an important sense for determining the location of events, actions, voices
and other sound sources within the surroundings of a listener. The highest level of accuracy of localisation is
obtained when one sound source is dominant and has a broad frequency spectrum with fast changes in temporal
structure. In a best-case scenario, a localisation accuracy of approximately 1–3◦ can be obtained on the horizontal
plane in front of the l istener2. The neurophysiological process for localisation occurs in parallel with analysis of
the frequency content of sound, and the perception of an auditory object provides information regarding what
happened and where it happened3. The ability to localise sound sources is a fast and potent sensing mechanism
to omnidirectionally perceive the surrounding three-dimensional world within a broad frequency range.
Although the sense of hearing is sensitive to a wide range of frequencies, there is an upper frequency limit.
This limit is approximately 20 kHz for young human subjects and is gradually lowered with increasing age.
The frequencies above 20 kHz are commonly referred to as ultrasonic frequencies. Many animals, such as bats,
rodents, insects, reptiles and amphibians produce strong vocalisations in the ultrasonic r ange4, and man-made
devices may also generate ultrasonic sounds in their normal or abnormal operation; such as gas leaks in p ipes5.
Ultrasonic signals can be brought to audible frequencies using signal processing techniques, for example, bats
are often monitored using specific detectors6, which can play back the down-shifted sound through a miniature
loudspeaker. However, while the sounds they produce are audible to the listener, such devices do not permit the
perception of the direction of ultrasonic sound sources.
The aim of this study was, therefore, to develop a technology to render ultrasonic frequencies audible
within the range of human hearing, while simultaneously allowing the directions of the ultrasonic sources to
be perceived by the listener in a real acoustic environment. For this task, we propose the use of a miniature
head-mounted ultrasonic microphone array, accompanied by parametric spatial audio reproduction of the
down-shifted sounds over headphones. The authors are not aware of any previous scientific work on this topic.
Specifically, the techniques developed in this article show how to obtain headphone signals from an ultrasonic
array of microphones with low latency, in such a manner that the directional information of ultrasonic sources
is imprinted onto a signal following a pitch-shifting operation.
In general, human spatial hearing acts as a signal analyser; estimating the most probable locations of perceived
sources. This is based on directional cues arising from the acoustical interaction between the listener and the
arriving wave front. More specifically, the directional cues have been found to be the differences between the
Acoustics Lab, Department of Signal Processing and Acoustics, Aalto University, Espoo, Finland. * email: Ville.
Pulkki@aalto.fi
Scientific Reports | (2021) 11:11608 | https://doi.org/10.1038/s41598-021-90829-9 1
Vol.:(0123456789)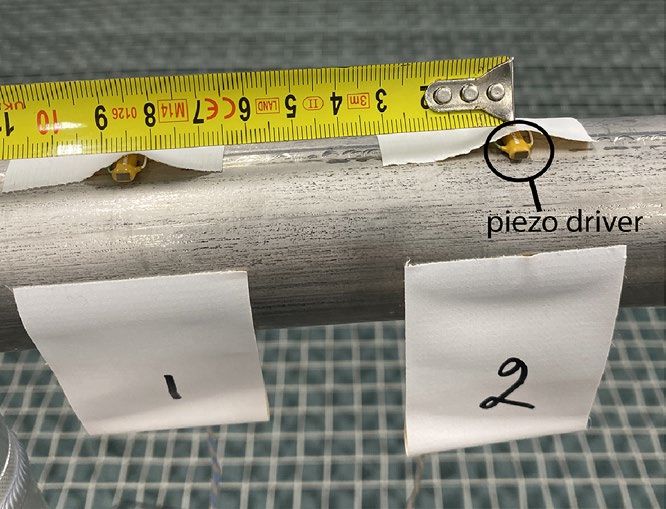
www.nature.com/scientificreports/
ear canal signals (interaural time and level differences), ear canal spectra (monaural cues) and the effect of head
motion on directional cues (dynamic cues)2,7.
A trivial solution for auralizing and localizing ultrasonic sounds could involve placing an ultrasonic micro-
phone next to each ear, shifting the ultrasonic frequency content down to the audible range, and then delivering
those down-shifted microphone signals to the respective ears of the listener. A less drastic version of such pro-
cessing is utilised by certain hearing a ids8, where high frequencies that are audible to normal-hearing subjects,
but inaudible to those who are hearing-impaired, are shifted down to the audible range of the wearer. However,
such an approach is problematic in terms of the preservation of directional cues, since the acoustic filtering
effects due to the d iffraction9 caused by the head and pinna vary substantially with frequency. Therefore, the
directional cues delivered by the pitch-shifted signals do not carry the appropriate information related to the
source direction that a human subject would have evolved and grown accustomed to.
Another solution could be to build two ultrasonic microphones into the ear canals of a miniature model of a
human head10. For example, if a ratio of 1:8 change of pitch is targeted, one could manufacture a 1:8 miniature
replica. This replica could then be mounted on top of the head of the listener, and their ultrasonic signals pitch-
shifted to audible frequencies and relayed to headphones worn by the listener. However, although through this
system the interaural level differences of sound could potentially be reproduced appropriately, the interaural time
difference cues would not; since the small distance between the ears of the miniature model would not produce
the arrival time differences that would occur naturally between the ears of a real human head. This approach
is also limited to a fixed ratio of pitch-shifting, and if some other degree of shifting was then required, a new
miniature replica of the listener would need to be manufactured.
A third technique that, in principle, could be used for the task, would be to employ a small array of ultrasonic
sensors and to utilise A mbisonics11 methods. However, such sensor arrays would require specialised manufactur-
ing, and the authors are not aware of any such device constructed in practice. For example, a tetrahedral array,
which is commonly employed for first-order Ambisonics techniques, would require four flat-response ultrasonic
capsules positioned in an array with an inter-microphone distance of less than 2 mm. This would be required in
order to push the upper frequency limit of the system, also referred to as the spatial aliasing frequency, to 50 kHz.
However, assuming that such a device could be constructed, Ambisonics rendering could be employed to first
obtain a set of signals for intermediate spherical arrangement of reproduction d irections11, with pitch-shifting
operations then applied to each signal. This would then be followed by the reproduction of each down-shifted
signal over headphones using the appropriate respective binaural filters.
A further technical difficulty with the three approaches postulated thus far, relates to the problem that pitch-
shifting operations significantly modify the original signals, and thus a number of signal-dependent quality
defects can occur. These signal artefacts could also be further compounded by the need to apply the pitch-shifting
processing onto more than one signal. Additionally, since real-time operation and low latency is required to
maintain the dynamic cues, the pitch-shifting operations should not be computationally prohibitive or employ
long temporal windows. Consequently, there is no guarantee that the directional cues relating to a miniature
dummy head would be preserved during pitch-shifting, or if pitch-shifted intermediate Ambisonic decoded
signals would still produce a clear spatial image.
To the best of the authors’ knowledge, there has been no prior scientific work which attempts to make
ultrasonic sound sources both audible and localisable for a listener. However, ultrasonic sound-fields have been
analysed for the purpose of visualisation. For example, a miniature array has been used to analyse the direction-
of-arrival of the sounds created by b ats12. Gas leaks in pipes also produce strong ultrasound emissions, and
ultrasonic microphone arrays have been employed to find such l eaks5. In these approaches, the aim is to visually,
rather than audibly, guide the user towards the locations of ultrasonic sound sources, by presenting the analysed
directional information to the user via a visual display.
Ultrasonic super‑hearing device
The proposed device is based on the application of time-frequency-domain parametric spatial audio techniques,
which have been previously developed for the enhancement of sound-field reproduction and compression of
spatial sound s cenes13. The methods first employ spatial analysis techniques over time and frequency, in order
to extract spatial parameters of sound-field from an array of microphones. These analysed parameters are then
subsequently used to synthesise the audio signals for the target reproduction setup. The processing stages of the
proposed technique are depicted in Fig. 1. Note that each signal from the microphone array is first transformed
into the short-time frequency domain, and the spatial analysis is conducted for each time-frequency tile indepen-
dently. The parameter representing the most prominent direction-of-arrival is defined as a unit vector pointing
to the direction of arriving sound r̂DoA (t, f ), where t and f are time and frequency parameters, respectively. The
second analyzed parameter corresponds to the diffuseness of the sound-field, defined as a real-valued number
ψ̂(t, f ) ∈ [0, 1], where ideally ψ̂ = 0 is obtained for sound-fields comprising a single plane wave, and ψ̂ = 1 is
obtained for a purely diffuse-field or for fields where several sources are active at the same time.
One of the sensor signals is then also modified via a pitch-shifting or down-modulating method, in order
to bring captured ultrasonic sounds down to the audible frequency range. This modified signal is first attenu-
ated depending on analysed diffuseness, and subsequently spatialised for playback over headphones, by using
the appropriate binaural filters corresponding to the analyed direction-of-arrival parameters. In practice, the
system reproduces sound when a single source is dominant, and de-emphasises all other portions of signal.
Non-individual head-related transfer function (HRTF) digital filters14 were employed for the spatialisation for
the device implemented in here.
In the current implementation, the direction-of-arrival was analysed with the rate of at least 40 Hz, with
higher rate at higher frequencies. The direction estimates were also averaged over frequency, because it was found
Scientific Reports | (2021) 11:11608 | https://doi.org/10.1038/s41598-021-90829-9 2
Vol:.(1234567890)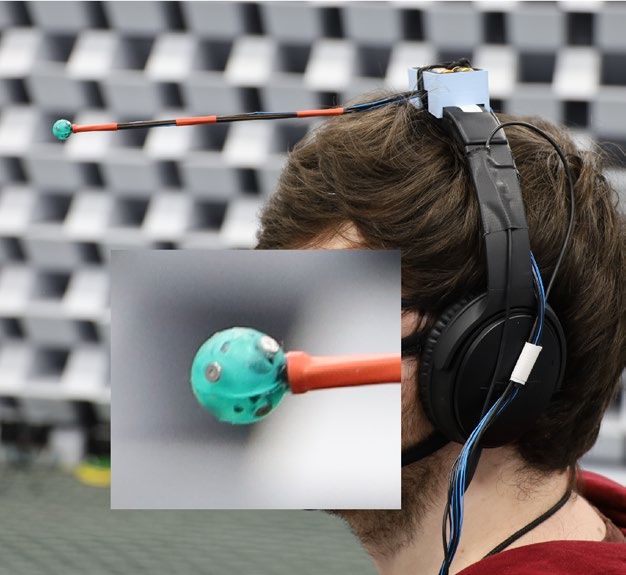
www.nature.com/scientificreports/
ultrasonic grid
N 1 pitch shifting 1 spatial 2
to audible range synthesis
N
analysis
N
• direction-of-arrival N-channel audio signal
spatial parameter signal
Figure 1. Left: Ultrasonic super-hearing device. Right: Signal processing chain for the device.
that the averaging produced a more stable spatialisation. This is a limitation of the current system, which, nev-
ertheless, did not impede its use. Note that the specific ultrasonic environments explored in this study seldomly
comprised more than a single sound source at any one time. However, it should be highlighted that the system
also supports frequency-dependent operation, which could improve performance for multi-source scenarios;
provided that the sound sources do not overlap significantly in both time and frequency.
In principle, any pitch-shifting technique may be employed, provided that the frequency-dependent param-
eters analysed from the ultrasonic sound-field are mapped correctly to the frequency scale of the pitch-shifted
signal. Since the spatial parameters are averaged over frequency in the currently employed configuration of the
device, the frequency mapping is not required in this case. Instead, each time frame of the pitch shifted signal is
spatialised according to a frequency-averaged direction. The pitch-shifting technique used for the application
targeted in this article should be capable of large pitch-shifting ratios, while also operating within an acceptable
latency. Based on these requirements, the phase-vocoder approach15,16 was selected for the real-time render-
ing in this study, due to its low processing latency and acceptable signal quality with large pitch-shifting ratios.
However, the application of other pitch-shifting methods is also demonstrated with recordings processed off-line
and described in the Results section.
In summary, the proposed processing approach permits frequency-modified signals to be synthesised with
plausible binaural and monaural cues, which may subsequently be delivered to the listener to enable the localisa-
tion of ultrasonic sound sources. Furthermore, since the super-hearing device turns with the head of the listener,
and the processing latency of the device was constrained to 44 ms, the dynamic cues should also be preserved.
Note that the effect of processing latency has been previously studied in the context of head-tracked binaural
reproduction systems, where it has been found that a system latency above 50–100 ms can impair the spatial
perception17,18. Therefore, it should be noted that a trade-off must be made between: attaining high spatial image
and timbral quality (which are improved through longer temporal windows and a higher level of overlapping)
and having low processing latency (which relies on shorter windows and reduced overlapping). The current
processing latency has been engineered so that both the spatial image and audio quality after pitch-shifting, as
determined based on informal listening, remain reasonably high.
One additional advantage of the proposed approach is that only a single signal is pitch shifted, which is
inherently more computationally efficient than pitch-shifting multiple signals; as would be required by the
three alternative suggestions described in the Introduction section. Furthermore, the imprinting of the spatial
information onto the signal only after pitch-shifting, ensures that the directional cues reproduced for the listener
are not distorted by the pitch-shifting operation. The requirements for the size of microphone array are also less
stringent compared to the requirements for an Ambisonics-based system. In this work, an array with a diameter
of 11 mm was employed, which has a spatial aliasing frequency of approximately 17 kHz. This therefore prohibits
the use of Ambisonics for the ultrasonic frequencies with the present array. By contrast, the employed spatial
parameter analysis can be conducted above the spatial aliasing frequency; provided that the geometry of the
array is known and that the sensors are arranged uniformly on the sphere.
The proof-of-concept device, which was built to demonstrate and evaluate the concept presented in this paper,
is shown in Fig. 1, and further detailed in the Methods section. A spherical array comprising 6 microphones,
with frequency responses up to approximately 100 kHz, was built and attached to the collar of the headphones
of the listener using a 23 cm long probe. The probe protrudes directly infront of the subject, in order to mitigate
acoustical shadowing effects for ultrasonic sources located in close frontal proximity to the subject; for example,
hand-held ultrasound emitting objects, such as leaking pipes or rubber tyres. Note that when the subject rotates
their head, the nominal position of the head relative to a sound source remains fixed. However, the array attached
to the probe moves laterally in accentuated left-right directions along an arc. Therefore, the relative azimuth angle
θ of a source on the horizontal plane from the perspective of the head position is different to the corresponding
azimuth angle θp from the array position,
sin θ
θp = arctan , (1)
cos θ − r/R
Scientific Reports | (2021) 11:11608 | https://doi.org/10.1038/s41598-021-90829-9 3
Vol.:(0123456789)www.nature.com/scientificreports/
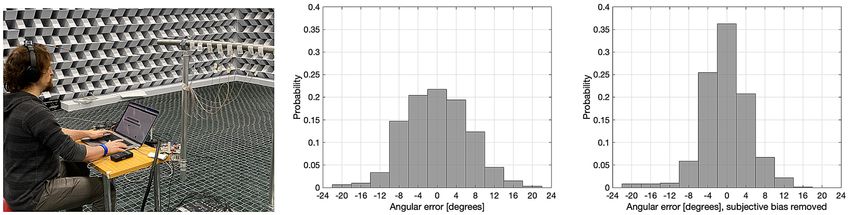
Figure 2. Left: The listening test arrangement. Centre: Distribution of azimuth angular errors in identification
of sources, N = 12, 66 repetitions. Data plotted with individual bias mainly caused by the orientation of the
head-worn device. Right: Data plotted after removal of individual bias.
where R is the distance of the source, and r is the length of the probe. This phenomenon diminishes with increas-
ing source distance, and is most prevalent when sources are in very close proximity to the listener. Owing to
this relative angle mismatch; nearby sources, which originate either to the left or right of the listener, appear
somewhat further to the left or right from the perspective of the array compared to that of the head. For example,
for a source at a distance of 1.5 m, this biasing effect for a source in ±30◦ of azimuth is approximately 5◦ towards
the lateral direction. Therefore, this effect should not have a significant influence on source localisation when
using the device, as the human accuracy of localisation is of the same o rder2.
However, the lateral biasing effect is still hypothesised to aid localisation of sound sources located close to the
listener. Note that humans commonly localise sound sources based on rotating their heads left and right until
a source is perceived as being directly in line with the median plane, which is where the directional accuracy of
the human auditory system is highest. The directional biasing caused by the probe therefore creates a so-called
“magnifying glass” effect, whereby source direction perception is slightly biased away from the true source
positions when they are located to the left or right side of the subject. Therefore, azimuthal head rotations may
become a more powerful perceptual tool when attempting to ascertain the true source directions using the device
in this particular configuration.
The functionality of the system is evaluated in two stages. A formal listening test quantifies the accuracy of
source localisation obtained with the system in the frontal horizontal plane. The performance of the system in
informal use is demonstrated with videos under both laboratory and field conditions.
Results
Formal listening test. The performance of the system was quantified using a formal subjective listening
test, where eight ultrasonic sources were mounted on an arc spanning 28◦ from the viewpoint of the subject. In
the test, one of the sources produced ultrasonic sound, and the subjects were asked to indicate which source it
was. This was repeated 66 times over randomly selected sources. In the analysis of the data a systematic individ-
ual bias was observed. However, such a bias term was expected, since the heads of people are usually asymmetric,
and subsequently the headphones to which the microphone array was mounted are oriented slightly differently
with each subject. The bias was known to the authors, who compensated for it in informal testing simply by
bending the probe left and right until the perceived direction matched-up with the actual direction. However, in
order to simplify the procedure, the probe was not manually adjusted. Instead, the individual bias was compen-
sated in the analysis of the subject’s results. The biases of 12 subjects varied between −7.3◦ and 7.2◦ quite evenly.
The distribution of angular errors in identifying the sources is shown in Fig. 2, with the individual bias being
included and removed. The distribution is demonstratively narrower when the bias effect is removed. The stand-
ard deviation of angular errors is 6.3 ± 0.7◦ with raw data, and 4.1 ± 0.5◦ with bias-compensated data, where
the value of deviation with a 95% confidence interval is presented. If the subjects had indicated the sources by
only guessing with equal probability assigned to each response direction, the standard deviation would have
been 11.6◦, which was computed via numerical simulation of the test. It can thus be stated, that since the subject
selected the source on a narrow spatial sector around the direction of the source, the device makes it possible
to localise ultrasonic sources.
The mean absolute azimuth error of localisation was 5.3◦ and 3.7◦ for the raw data and bias-compensated
data, respectively. For reference, the human accuracy of directional perception, of audible sound sources, is of
order of around 1–3◦ in the front of the listener in optimal c onditions2. This suggests that the localisation accu-
racy obtained through the currently implemented super-hearing device is somewhat lower than the accuracy of
directional hearing. Note that the aforementioned “magnifying-glass’’ effect could also be exaggerated based on
manipulating the analysed direction-of-arrival values, which could potentially further improve the localisation
accuracy of sources directly in front of the listener.
Non-individualised HRTF synthesis was employed in the super-hearing device for the listening experiment,
where the directional cues are imposed upon the pitch-shifted signal using a binaural-mannequin HRTF data
set. This processing, therefore, produces slightly different cues to what the listener have otherwise been used to
when encountering sound sources in natural environments. I n19,20 it has been found that the mean absolute error
of localisation on the horizontal plane with non-individualised HRTF synthesis was approximately 15◦ at first,
and around 8–10◦ with longer adaptation to the used HRTF set. The results of the listening tests in the current
study suggest that notably higher accuracy is obtained with the super-hearing device, which can be hypothesised
Scientific Reports | (2021) 11:11608 | https://doi.org/10.1038/s41598-021-90829-9 4
Vol:.(1234567890)www.nature.com/scientificreports/
to be caused by the fact that in current study the listeners were tracking the source with head rotations until it
was in the front, where the accuracy of human hearing is the best, while referenced works studied the accuracy
more widely on the frontal horizontal plane. Furthermore, the reported “magnifying-glass” effect of the device
further may also aid in finding the source.
Monitoring environments with ultrasonic sources. The device has been applied to various in-situ to
acoustical scenarios involving ultrasonic sources. A video camera was also mounted on top of the headphones
of the listener, and video footage, along with a headphone audio track demonstrating the usage of the super-
hearing system under real life conditions, has been produced and is available in the form of supplementary video
clips appended to this article.
To demonstrate the hearing-based localisation of leaks in pressurised pipes, two different kinds of leaks are
shown in Supplementary Video 1. The first involves a puncture hole, made with a pin, in a relatively rigid PVC
tube filled with approximately 3–4 bar air pressure. The resultant leak is audible and localisable in the video.
To demonstrate the audibility of smaller leaks, a pin hole was made in a bicycle tyre inner tube. The leak is also
audible and localisable to the user of the device; especially when the array is placed a short distance from the
tyre; as demonstrated in the video. Note that in both cases, the sound of the leak is not audible without the use
of the super-hearing device.
The setup for the listening test reported above is also demonstrated; where sources 2 and 7 are emitting sounds
in sequence, and the listener turns their head towards the source. This is demonstrated in Supplementary Video 2.
The authors also listened to natural environments on a number of occasions using the system, and bat sounds
are presented in Supplementary Video 3 from two of these sessions. The super-hearing device makes the loca-
tions and flying directions of the bats audible, and in the case of close-by flight, it is also possible to perceive the
changes in distance.
In principle, the proposed method can be used with any pitch-shifting method, but only the phase-vocoder
approach was implemented for real-time processing. However, a number of other pitch-shifting methods were
also employed based on off-line rendering. Sound examples of different spectral and temporal structures, which
were all recorded with the proposed device, have been rendered to a binaural audio track using four different
pitch-shifting methods in Supplementary Video 4. Note that the pitch-shifting in this demonstration has been
conducted using off-line implementations, which are therefore not necessarily representative of the sound quality
that could be attained with real-time operation. However, even with off-line processing many of the techniques
have difficulties in reproducing the frequency sweeps for listening test, or in reproduction of the dog whistle. In
turn, the phase vocoder approach used in the current study provides meaningful results for all different signal
types. Nevertheless, the renderings do demonstrate that the perceived direction of the sources is similar across
the different pitch-shifting techniques; thus, indicating that the proposed method may also be used with differ-
ent pitch-shifting methods.
Discussion
Although the system represents only the first prototype built for the task, the results are promising; especially
when considering that the microphones were not explicitly designed for ultrasonic frequencies, and param-
eters of the system were not specifically optimised. The microphones were developed for use in audio devices,
such as hearing aids, and their sensitivity to ultrasonic frequencies is largely fortuitous. The microphones did,
however, demonstrate increased background noise near 55 kHz, which negatively affected the analysis results
in that frequency region. However, broad-band stimuli and other frequency regions other than 50–60 kHz are
still correctly localisable using the device, due to the spectral averaging conducted by the system and also physi-
ologically through spatial hearing.
Conclusions
In this article, a technique is proposed for real-time listening of temporally isolated ultrasonic sources; intended
for subjects with normal binaural hearing. The proposed approach not only renders an ultrasonic sound source
audible to humans, but also permits the listener to localise it in the correct direction. The technique relies on
the use of a miniature ultrasonic microphone array for two purposes: (1) to analyse the spatial properties of
an ultrasonic sound-field depending on time and frequency; and (2) to capture a monophonic signal, which is
subsequently transformed into the audible frequency range via pitch-shifting methods. The portion of pitch-
shifted signal analysed to originate from a single source is then spatially synthesised to headphones worn by the
user, where the direction of pitch-shifted sound is perceived based upon the estimated source direction. Since
the spatial synthesis of sound is performed after the pitch-shifting operation occurs, the directional cues are not
distorted by signal processing artefacts that may arise during the pitch-shifting.
A proof-of-concept device was built using an array of six ultrasonic microphones flush mounted on a rigid
sphere. The array was affixed to the collar of a pair of headphones via a probe, which protruded outwards
directly in-front of the listener. This probe placement serves to mitigate acoustical shadowing effects arising
due to ultrasonic sources located in close proximity and in front of the listener. The probe also creates a small
directional bias towards the ipsilateral direction for nearby sources, which aids in finding the head orientation
where the source is directly in front. This so-called “magnifying glass” phenomenon represents a feature of the
device which may assist localisation. A formal listening test was conducted under laboratory conditions using
ultrasonic frequency swept sounds. The results based upon subjects with normal binaural hearing faculties, show
that the directional accuracy for this source identification task, for those sources located in front of the listener,
is within a few degrees.
Scientific Reports | (2021) 11:11608 | https://doi.org/10.1038/s41598-021-90829-9 5
Vol.:(0123456789)www.nature.com/scientificreports/
-40
Average Sensitivity
Average Noise Floor
-50
re 1V / 0.1 Pa @ 1 kHz
-60
Sensitivity [dB]
-70
-80
-90
-100
20 30 40 50 60 70 80 90
Frequency [kHz]
Figure 3. Average sensitivity and noise floor for the 6 sensors that were mounted on the spherical baffle.
The practical usability of the system is also demonstrated via video format and presented with the accompa-
nying first-person viewpoint video footage; which shows the proof-of-concept device being used to capture and
render a variety of laboratory and natural ultrasonic sound-fields. These demonstrations show that the system
allows the in-situ listener to perceive the directions of ultrasonic sound sources in real-time.
Methods
Ultrasonic microphone array. The ultrasonic microphone array comprises 6 sensors flush mounted and
uniformly distributed on the surface of a rigid sphere of radius 5.5 mm as depicted in Fig. 2. The sensors used
were Knowles FG-23629-D65 electret microphones with sound pressure sensitivity higher than the noise floor
up to about 100 kHz. A smooth spherical enclosure was produced using a Digital Light Processing (DLP) 3D
printer with a layer resolution of 50 µm. The sensors in the array were found to have a nominal sensitivity of −63
dB (+/− 4 dB) at 40 kHz (re 1 V / 1 Pa @ 1 kHz) and a noise floor of −85 dB as depicted in Fig. 3. The array was
mounted on Bose QuietComfort II headphones. The analogue processing also involves a first-order high-pass
filter at 12 kHz to reduce the level of audible sounds that are not necessary for the intended processing.
System for on‑line binaural reproduction of ultrasonic spatial sound. The complete system con-
sisted of the ultrasonic array routing its six channels of audio to a RME Fireface UCX interface with a sampling
rate of 192 kHz. The audio was processed through a custom developed audio plug-in hosted by the audio soft-
ware REAPER. The processing signal chain comprised two stages: analysis and synthesis.
In the analysis stage, a complex quadrature-mirror filterbank (QMF) is employed to first divide the input sig-
nals into 512 uniformly spaced frequency bands, which are then analysed independently21. These time-frequency
domain signals x(t, f ) = [x(t, f ), ..., xQ (t, f )] ∈ CQ×1 are denoted with t and f to represent the down-sampled
time and frequency indices, respectively. Given that the intended operating range of the system is above the
spatial aliasing frequency of the array, the direction-of-arrival (DoA) unit vector, r̂DoA (t, f ), is estimated using
the sensor-amplitude driven space-domain approach proposed i n22. This relies on first determining the instan-
taneous DoA estimates as
Q
r̂DoA (t, f ) = |xq (t, f )|n �q , (2)
q=1
where n(�q ) ∈ R3×1 are Cartesian unit vectors describing the direction of each sensor, q. Note that the spherical
array causes prominent acoustical shadowing of sound waves and the amplitude |xq (t, f )| is highest on the side
of arrival, and lowest on the opposite shadowed side. When the direction vectors of the sensors are weighted
with the amplitude values and summed, the resulting vector points to the most prominent direction-of-arrival
of sound. Note that since these estimates do not rely on inter-sensor phase relations, they are unaffected by
spatial-aliasing. The DoA analysis approach is described in more detail in23, where also the accuracy obtained
with it is quantified with a planar array mounted on a rigid cylinder, and compared to standard methods of
DoA analysis without rigid baffle. The shadowing-based analysis method provides the same accuracy with other
methods in a free-field. However, when there are additional sources or diffuse noise, the method produces higher
errors than other methods. The main advantages of the implemented method are that it yields high accuracy for
single-source-dominant plane waves, has low computational requirements, and the method can operate within
short time windows.
For this study, the estimated DoA vectors were averaged over time using a one-pole filter of coefficient
value 0.7, and also over frequencies between 20 kHz and 55 kHz; since the majority of the tested scenarios
and the listening test involved only a single dominant sound source at time. However, it is noted that fully
Scientific Reports | (2021) 11:11608 | https://doi.org/10.1038/s41598-021-90829-9 6
Vol:.(1234567890)www.nature.com/scientificreports/
frequency-dependent operation is also possible, which could allow the method to resolve the directions of
multiple sound sources; provided that they do not overlap substantially in time and frequency. This averaging
frequency range was selected as it is above the human upper frequency limit of hearing, and below the noise
floor tonal aberration depicted in Fig. 3; it is also where the noise floor begins to trend upwards and the mic
sensitivity downwards. This averaged vector of observed DoAs, denoted by ρ̂ , is then employed to determine a
diffuseness measure22 corresponding to the spherical v ariance24 of the estimates
ψ̂ = 1 − ||ρ̂||. (3)
The estimated spatial parameters and the signal corresponding to the sensor located on the top-side of the array
are then passed to the synthesis processing stage. Here, the sensor signal is pitch shifted using the phase-vocoder
approach15,16, by a pitch-shift ratio r of 1:8 (3 octaves). Therefore, for example, the signal energy in the frequency
region between 20 and 80 kHz now appears between 2.5 and 10 kHz. However, it should be noted that certain
aberrations imposed upon the signal during the pitch-shifting operation may, in practice, unintentionally pro-
duce energy in other frequencies. Three octaves also represents a particularly drastic pitch-shifting ratio for any
pitch-shifting algorithm.
The diffuseness estimate is then employed to modulate the amplitude of the pitch-shifted sensor signal, for
the purpose of improving the reproduced signal quality by deactivating it during periods of when the sound-field
is not dominated by a single source
p(t, fˆ ) = (1 − ψ̂)P xp (t, f ) , (4)
where p denotes the pitch-shifted signal, fˆ and f are pitch-shifted and original frequencies, respectively, xp is one
of the Q microphone array sensor signals, and P [.] denotes a pitch-shifting operation on the enclosed signal.
Moreover, fˆ = rf .
Only the frequencies of pitch shifted signal that were originally ultrasonic are then binauralised. This means
that the signal is positioned in the average analysed direction by convolving it with a digital filter corresponding
to the head-related transfer f unction14 (HRTF), h ∈ C2×1
b(t, fˆ ) = h r̂(avg) , t, fˆ p(t, fˆ ), fˆ ∈ {(20 000)r, (80 000)r}, (5)
where r̂(avg) is the source direction estimate averaged over f, and b(t, fˆ ) are the binaural signals sent to the head-
phones of the listener after the appropriate inverse time-frequency transform has been conducted. The HRTF
set used for the binaural synthesis consisted of 836 responses simulated with the geometry of Kemar binaural
mannequin. As commonly applied in practice, triangular interpolation of the loaded HRTF data was employed
to obtain interpolated HRTFs in the estimated direction over time.
This is similar to the parametric spatial audio method known as Directional Audio C oding25, where, although
the sound is not pitch-processed before reproduction; frequency-dependent spatial parameters are also employed
during the synthesis of the output signals. The frequency averaging used in the realised proof-of-concept device
described here is a detail of this implementation that was found to slightly improve sound quality and help
stabilise the spatialisation. The main drawback of the averaging process is that if several source signals with dif-
ferent spectral content and similar amplitude exist at the same time, the resultant analysed direction-of-arrival
parameter will not correctly reflect the direction of any of the sources. However, this was not found to be a major
problem in this study; as such cases were rare in the ultrasound scenarios tested so far, and it would appear that
natural sound environments are typically not crowded in the ultrasonic frequency range. Nevertheless, if the pres-
ence of simultaneous sound sources is found to cause quality defects in a given application, the same processing
principles presented would still apply, except without frequency averaging of the parameters.
The developed system operates within reasonable computational constraints. The system latency includes the
filterbank latency of 24.0 ms (9 hops of overlapping concurrent frames of length 512 samples at 192 kHz), and the
latency incurred with the pitch-shifting of 20.0 ms (3840 samples at 192 kHz), an overall total of 44.0 ms. This
was found to be an acceptable compromise between signal quality and the responsiveness of the system. Note
that more information regarding the software implementation and array construction (including pre-compiled
binaries, source code, and CAD files), can be found on the companion web-page26.
Subjective test. The aim of the subjective listening test was to characterise the performance of the super-
hearing system by ascertaining the perceived localisation accuracy on the frontal horizontal plane.
Setup and stimuli. The subjective test was conducted in a large anechoic chamber. Eight ultrasonic sources
were mounted using fabric tape on a curved piece of metallic tube, with a distance of 152–154 cm from the
subject. A clearly visible numerical tag was attached just below each source, with numbers 1 to 8 from left to
right. The angular separation between adjacent sources was 4◦ from the viewpoint of the subject. The subject was
seated on a stool behind a small table where a laptop computer was placed, which controlled the listening test
procedure; as shown in Fig. 2.
The ultrasonic sources used were PC4WL co-fired piezoelectric actuators from Thorlabs of dimensions 4.5
× 3.5 × 5.0 mm. The signal utilised in the test was a repeated sequence of 50 ms linear frequency chirps from 22
to 44 kHz, synthesised with a GW Instek AFG-2225 function generator. The signal was boosted with an A23
Parasound amplifier and offset to non-negative values through the addition of a DC voltage source. The signal was
then routed to each piezo driver using a custom Arduino-controlled relay circuit, which was further controlled
by a laptop running Max, a graphical programming software.
Scientific Reports | (2021) 11:11608 | https://doi.org/10.1038/s41598-021-90829-9 7
Vol.:(0123456789)www.nature.com/scientificreports/
65
source 1
60 source 3
source 5
55
Pa
source 7
50 bckg noise
SPL [dB] re 20
45
40
35
30
25
20 25 30 35 40 45
Frequency [kHz]
Figure 4. Left: Two piezo drivers of the listening test setup shown in Fig. 2, which were used as ultrasound
sources in the test. Right: Frequency spectra of four ultrasonic sources used in the listening test averaged in
frequency with 200 Hz wide rectangular window.
The spectral content of the sound present when the drivers were active, was measured with a G.R.A.S 46BF
1/4’’ microphone; with four exemplary spectra shown in Fig. 4. The sources produced somewhat different spec-
tra, and all of them reproduced a spectral peak near 22 kHz. The sound was at a 5–30 dB higher level than the
noise floor produced by the cooling fans of the devices, present in the anechoic laboratory, used for the tests.
The presence of the background noise was not seen as being detrimental; as it would mask audible distortion
components that could theoretically be produced by piezo drivers.
Procedure. The study complies with the Declaration of Helsinki and was approved by the Research Ethics
Committee of Aalto University. Subjects entering the listening test, were provided with written instructions
describing the nature of the test and the user interface operation. They also gave written informed consent.
To demonstrate the presence of ultrasonic sounds, one of the sources was turned on and off, and its signal
was captured on a Petterson Elektronik D200 ultrasound detector. The subjects were asked if they could discern
the sound of the source without the detector, and all of them asserted that they could not hear the sound.
The listeners were then given a short 3–5 min period to become familiar with the super-hearing system. They
listened to sources using the device, and were permitted to freely switch between the eight sources. The listeners
were thus exposed to the timbres of the sources, and it can be assumed that they adapted at least partly to the
non-individual HRTFs used for the binauralisation; since the adaptation to non-individual HRTFs has been
found to occur even after a short amount of time in a previous study19.
In the subsequent formal listening test, the sound emanated from a single driver selected randomly and
the subjects indicated which driver they believe was active by pressing the corresponding number key on the
laptop keyboard. The leftmost and rightmost drivers were not used in the test to avoid potential bias effects in
the results. Once the subject had indicated the position, the sound was stopped. A new driver was then initiated
when the subject pressed return on the keyboard. This procedure was conducted 70 times, whereby the first four
trials were for familiarisation purposes. The total duration of the test was between 20–30 min for all listeners.
Results. A total of 12 subjects participated in the formal listening test; not including the author who imple-
mented the listening test. Each indication of an active source produced the result
θij = θ0 − θ1 , (6)
where θ0 and θ1 are the azimuth directions of the true and indicated sources, respectively, i is the index of subject
and j denotes the repetition.
Since the super-hearing device was mounted on headphones, the heads of the listeners are somewhat asym-
metric, and slightly different positioning of the device was possible across participants, an individual bias effect
was expected. The biases of the subjects were removed from the data with
θ̂ij = θij − βi , (7)
where βi is the individual bias term computed as an average from θij values of subject i corresponding to the two
centremost drivers. The absolute error was computed simply as
φij =|θij |, or (8)
φ̂ij =|θ̂ij |. (9)
By monitoring the data, it was clear that the subjects most commonly selected the source in their individually-
biased direction; followed by the next most probable direction being the source immediately adjacent to this. It
was relatively uncommon for a participant to misplace the direction by two or more sources. The individually
perceived direction of a source thus had to be at least 4◦ inward from the side of the array, to give the subject
Scientific Reports | (2021) 11:11608 | https://doi.org/10.1038/s41598-021-90829-9 8
Vol:.(1234567890)www.nature.com/scientificreports/
the possibility to select a source on both sides of it. For this reason, we omitted the data obtained with sources
which were perceived in directions closer than 4◦ from the side of the array. After these omissions, 545 values
for θ̂ij were collected in total.
The histograms of the data with and without compensation of individual bias are plotted in Fig. 2, where it can
be observed that the distributions obtained resemble normal distributions; although the validity of this assump-
tion could not be verified by statistical tests, due to the relatively small data size. Nevertheless, the standard
Matlab function normfit was used to compute the standard deviations of θij and θ̂ij with their 95% confidence
intervals, which were taken as the measure of the certainty of the localisation with and without individual bias,
respectively. The same Matlab function was also used to compute the mean value from absolute error measures
φij and φ̂ij . These values were taken as measures of the directional accuracy of perception obtained in general
with the system.
It could be argued, that the subjects may have memorised the individual sound spectra produced by the
sources, as the piezo drivers produced somewhat different spectra, and the subjects were allowed to listen to
each source separately as part of the familiarisation step. However, the non-compensated distribution of angular
errors in Fig. 2 shows that the frequency of selecting the actual source was 21.7% and the frequency of select-
ing the next-left or next-right sources were 20.4% and 19.4%, respectively, whereas the success rate based upon
guesswork alone, would be 12.5%. Furthermore, if the identification would have been based on comparison to
memorised source spectra, the sources immediately adjacent to the actual source would have no preference in the
test over other potential sources. It can therefore be counter argued, that the perceived direction was indeed the
predominant information processed by the subjects to identify which source was emitting the ultrasonic sound.
Received: 23 February 2021; Accepted: 17 May 2021
References
1. Grothe, B. Sensory systems: New roles for synaptic inhibition in sound localization. Nat. Reviews Neurosci. 4, 540–550 (2003).
2. Blauert, J. Spatial Hearing, revised edn. (MIT, 1997).
3. Rauschecker, J. P. & Tian, B. Mechanisms and streams for processing of “what” and “where” in auditory cortex. Proc. Natl. Acad.
Sci. 97, 11800–11806 (2000).
4. Sales, G. Ultrasonic Communication by Animals (Springer, 2012).
5. Tao, W., Dongying, W., Yu, P. & Wei, F. Gas leak localization and detection method based on a multi-point ultrasonic sensor array
with TDOA algorithm. Meas. Sci. Technol. 26, 095002 (2015).
6. Barataud, M. Acoustic ecology of European bats. In Species, Identification, Study of Their Habitats and Foraging Behaviour. (Biotope,
2015).
7. Pulkki, V. & Karjalainen, M. Communication Acoustics: An Introduction to Speech, Audio and Psychoacoustics (Wiley, 2015).
8. Popelka, G. R., Moore, B. C., Fay, R. R. & Popper, A. N. Hearing Aids (Springer, 2016).
9. Fahy, F. J. Foundations of Engineering Acoustics (Elsevier, 2000).
10. Xiang, N. & Blauert, J. A miniature dummy head for binaural evaluation of tenth-scale acoustic models. Appl. Acoust. 33, 123–140
(1991).
11. Zotter, F. & Frank, M. Ambisonics: A Practical 3D Audio Theory for Recording, Studio Production, Sound Reinforcement, and Virtual
Reality (Springer Nature, 2019).
12. Lee, H. et al. High-frequency soundfield microphone for the analysis of bat biosonar. J. Acoust. Soc. Am. 146, 4525–4533 (2019).
13. Pulkki, V., Delikaris-Manias, S. & Politis, A. Parametric Time-frequency Domain Spatial Audio (Wiley Online Library, 2018).
14. Møller, H., Sørensen, M. F., Hammershøi, D. & Jensen, C. B. Head-related transfer functions of human subjects. J. Audio Eng. Soc.
43, 300–321 (1995).
15. Bernsee, S. M. Pitch shifting using the Fourier transform. In The DSP Dimension. http://blogs.zynaptiq.com/bernsee/pitch-shift
ing-using-the-ft (1999).
16. Zölzer, U. DAFX: Digital Audio Effects (Wiley, 2011).
17. Lindau, A. & Weinzierl, S. Assessing the plausibility of virtual acoustic environments. Acta Acust. United Acust. 98, 804–810 (2012).
18. Hendrickx, E. et al. Influence of head tracking on the externalization of speech stimuli for non-individualized binaural synthesis.
J. Acoust. Soc. Am. 141, 2011–2023 (2017).
19. Mendonça, C. et al. On the improvement of localization accuracy with non-individualized HRTF-based sounds. J. Audio Eng. Soc.
60, 821–830 (2012).
20. Majdak, P., Walder, T. & Laback, B. Effect of long-term training on sound localization performance with spectrally warped and
band-limited head-related transfer functions. J. Acoust. Soc. Am. 134, 2148–2159 (2013).
21. Vilkamo, J. & Bäckström, T. Time-frequency processing: Methods and tools. Param. Time-Freq. Domain Spatial Audio 3 (2017).
22. Politis, A., Delikaris-Manias, S. & Pulkki, V. Direction-of-arrival and diffuseness estimation above spatial aliasing for symmetrical
directional microphone arrays. In 2015 IEEE International Conference on Acoustics, Speech and Signal Processing (ICASSP), 6–10
(IEEE, 2015).
23. Ahonen, J., Del Galdo, G., Kuech, F. & Pulkki, V. Directional analysis with microphone array mounted on rigid cylinder for direc-
tional audio coding. J. Audio Eng. Soc. 60, 311–324 (2012).
24. Mardia, K. V. & Jupp, P. E. Directional Statistics Vol. 494 (Wiley, 2009).
25. Pulkki, V. Spatial sound reproduction with directional audio coding. J. Audio Eng. Soc. 55, 503–516 (2007).
26. McCormack, L. & Gonzalez, R. Source-code and build instructions for the proof-of-concept device. https://github.com/leomc
cormack/Super-Hearing (2021).
Acknowledgements
The research has been supported by the Academy of Finland and Aalto University. Dr. Veronika Laine helped in
locating the bats and identified the species.
Author contributions
V.P. designed the overall system, recorded the demonstrations both in the laboratory and in the field, and
conducted the listening tests. L.M. implemented the digital signal processing system, and R.G.D. built the
Scientific Reports | (2021) 11:11608 | https://doi.org/10.1038/s41598-021-90829-9 9
Vol.:(0123456789)www.nature.com/scientificreports/
microphone array and reproduction system, and performed recordings in nature. All authors reviewed the
manuscript.
Competing interests
The authors declare no competing interests.
Additional information
Supplementary Information The online version contains supplementary material available at https://doi.org/
10.1038/s41598-021-90829-9.
Correspondence and requests for materials should be addressed to V.P.
Reprints and permissions information is available at www.nature.com/reprints.
Publisher’s note Springer Nature remains neutral with regard to jurisdictional claims in published maps and
institutional affiliations.
Open Access This article is licensed under a Creative Commons Attribution 4.0 International
License, which permits use, sharing, adaptation, distribution and reproduction in any medium or
format, as long as you give appropriate credit to the original author(s) and the source, provide a link to the
Creative Commons licence, and indicate if changes were made. The images or other third party material in this
article are included in the article’s Creative Commons licence, unless indicated otherwise in a credit line to the
material. If material is not included in the article’s Creative Commons licence and your intended use is not
permitted by statutory regulation or exceeds the permitted use, you will need to obtain permission directly from
the copyright holder. To view a copy of this licence, visit http://creativecommons.org/licenses/by/4.0/.
© The Author(s) 2021
Scientific Reports | (2021) 11:11608 | https://doi.org/10.1038/s41598-021-90829-9 10
Vol:.(1234567890)You can also read