EMG-Free Monitorization of the Acoustic Startle Reflex with a Mobile Phone: Implications of Sound Parameters with Posture Related Responses
←
→
Page content transcription
If your browser does not render page correctly, please read the page content below
sensors
Article
EMG-Free Monitorization of the Acoustic Startle
Reflex with a Mobile Phone: Implications of Sound
Parameters with Posture Related Responses
Christopher L. Gowen 1 , Prashanna Khwaounjoo 1,2            and Yusuf O. Cakmak 1,2,3,4, *
 1    Department of Anatomy, School of Biomedical Sciences, University Of Otago, Po Box 56,
      Dunedin 9054, New Zealand; chris.gowen@postgrad.otago.ac.nz (C.L.G.);
      prash.khwaounjoo@otago.ac.nz (P.K.)
 2    Medtech Core, Auckland 1010, New Zealand
 3    Brain Health Research Centre, Dunedin 9054, New Zealand
 4    Centre for Health Systems and Technology, Dunedin 9054, New Zealand
 *    Correspondence: yusuf.cakmak@otago.ac.nz; Tel.: +64-03-479-4030

 Received: 4 September 2020; Accepted: 14 October 2020; Published: 22 October 2020

 Abstract: (1) Background: Acute acoustic (sound) stimulus prompts a state of defensive motivation
 in which unconscious muscle responses are markedly enhanced in humans. The orbicularis oculi
 (OO) of the eye is an easily accessed muscle common for acoustic startle reaction/response/reflex
 (ASR) investigations and is the muscle of interest in this study. Although the ASR can provide
 insights about numerous clinical conditions, existing methodologies (Electromyogram, EMG) limit
 the usability of the method in real clinical conditions. (2) Objective: With EMG-free muscle recording
 in mind, our primary aim was to identify and investigate potential correlations in the responses of
 individual and cooperative OO muscles to various acoustic stimuli using a mobile and wire-free
 system. Our secondary aim was to investigate potential altered responses to high and also relatively
 low intensity acoustics at different frequencies in both sitting and standing positions through the use of
 biaural sound induction and video diagnostic techniques and software. (3) Methods: This study used
 a mobile-phone acoustic startle response monitoring system application to collect blink amplitude
 and velocity data on healthy males, aged 18–28 community cohorts during (n = 30) in both sitting and
 standing postures. The iPhone X application delivers specific sound parameters and detects blinking
 responses to acoustic stimulus (in millisecond resolution) to study the responses of the blinking reflex
 to acoustic sounds in standing and sitting positions by using multiple acoustic test sets of different
 frequencies and amplitudes introduced as acute sound stimuli (
Sensors 2020, 20, 5996                                                                             2 of 15

1. Introduction
     Dysfunctional mental health affects nearly 300 million people globally with the World Health
Organization defining mood and cognitive disorders as the largest contributors to human disability [1].
The burden of diseases revolving around mental health conditions is difficult to quantify given the
complexity of standards of care and recording capabilities from 2nd and 3rd world nations as well as
individual reporting/withholding. Information from Europe and the United States describe global
costs comprising medication, physician visits, as well as hospitalization and indirect costs such as
mortality, disability, and production losses accumulate to ~1.7 trillion USD [2]. Aside from these
strains, additional socio-economic impact falls on the effects generated from mental health fraud
and abuse. Condition masking, abuse of prescription medication as well as disability compensation
have influenced patient reporting and very well may continue to without more objective and precise
methods for accurate diagnosis.
     The current means to examine mental health disorders are not as easily identifiable as symptoms,
for example, as physical asymmetry in stroke, but usually rely on the blend of patient history,
mental, and physical status examination, and laboratory and/or neuroimaging methods to detect
impairments [3–6]. However, diagnosis of mood disorders where resources are constrained may
solely rely on patient reporting and invite the feigning of symptoms [1]. Because of these limitations,
many leading authorities on psychiatric diagnosis such as Allen Francis, have cautioned health care
professionals about the diagnostic in-/deflation in both marginally symptomatic or healthy individuals
while using current self-reporting practices [3,7,8].
     While combining structured interviews with patient records, and laboratory and imaging review
appears to produce more accurate primary and secondary diagnoses than routine clinical methods,
there is still significant controversy as to what is considered the gold standard towards psychiatric
diagnosis as well as what is the laboratory or neuroimaging test’s expected utility, or the difference
between benefit and cost [9].
     The two major diagnostic manuals for mood disorders: The Diagnostic and Statistical
Manual of Mental Disorders Fifth Edition (DSM-V) and the International Classification of
Diseases provide classification systems for clinical identification which encourage self-reporting
and questionnaire-literary responses [3,10]. However, these systems are objectively flawed in that
their recommended methods (questionnaires) cannot control reporter/assessor bias. To assist with
authenticity, biologic and physiologic surrogates of neural states have involved anomalous stress
hormones, heart rate variability (HRV), blood pressure, and others have been employed to describe the
nervous, cognitive, and physiologic symptoms of mental health [3,8]. Bearing in mind the development
of more technological methods, the acoustic startle reflex (ASR) has also proved to be a promising
approach in quantifying mental health [11].
     The ASR is an aversive response which is enhanced during a fear state and is diminished in a
pleasant emotional context [12]. The neuronal arcade responsible for the ASR comprises unconsciously
regulated brainstem and cerebral structures where diverse conditions have been found to alter both
response time as well as intensity of muscle reaction to sound [13–34]. To assess anomalous blink
latencies and amplitudes of the ASR, the prominent blinking muscle, the orbicularis oculi (OO), is easily
and commonly accessed using electromyogram (EMG) [34,35]. Using EMG involves specialized
training and equipment (wired sensors) and have not been found to be common psychiatric practice
even though “each psychiatrist has their own personal style” [3]. Although correlations of OO-ASR
responses have been examined between sitting and supine conditions in a post-traumatic stress disorder
population [15,23,36], sitting and standing postures were not found to be examined. Standing may
not always be a possibility for some participants and these conditions may also reflect differential
pathways to sound and reflex pathogenesis [31].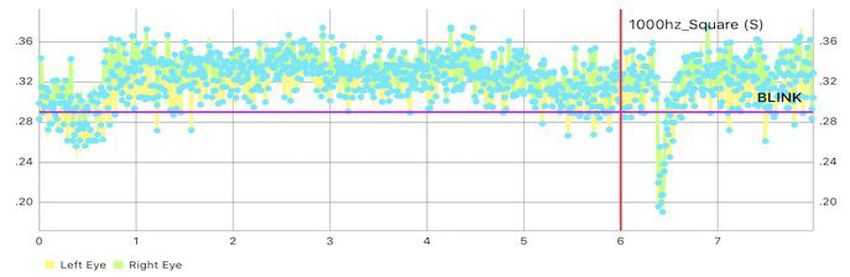
Sensors 2020, 20, 5996                                                                             3 of 15

     With EMG-free muscle recording in mind, our primary aim was to identify and investigate
potential correlations in the responses of individual and cooperative OO muscles to various acoustic
stimuli using a mobile and wire-free system. Our secondary aim was to investigate potential altered
responses to high and also relatively low intensity acoustics at different frequencies in both sitting
and standing positions through the use of biaural sound induction and video diagnostic techniques
and software. Sitting and standing methods provide flexibility for the use of devices for people with
disabilities. These aims may then clarify the use of the ASR to researchers, medical care providers, and
scientists in using sounds and postures to differentiate populations, and/or subpopulate groups into
distinct neurophysiologies. We hypothesize that we may find significant details of sound amplitudes
and frequencies for use in future experimentation.

Purpose and Goals
     The ASR has been investigated to a high degree using a number of tools [35]. However, an
EMG free wireless ASR tool or system has yet to be developed. Additionally, using such a system to
correspond responses of the left and right eye as well as a comparison between standing and sitting
postures to a range of acoustic test sets have yet to be investigated. Within these contexts, the purpose
of this pilot study was to develop acoustically repeatable parameters for use in ASR investigations and
to subsequently develop an acoustic response spectrum. The goals of this study was to develop an
inexpensive, mobile, and clinically relevant biomedical device through the use of an application (app)
to deliver a specific acoustic test set and monitor the ASR responses of the eye muscles responsible
for blinking.
     The outcomes of the present study may provide a detailed profile of the startle reflex which has
various clinical and therapeutic significances.

2. Methods

2.1. Ethics and Environment
     All subjects gave their informed consent for inclusion before they participated in the study.
The study was conducted in accordance with the Declaration of Helsinki, and the protocol was
approved by the Human Ethics Committee of the University of Otago (Project identification code
D18/407, 11.12.2018). ASR investigations were carried out in a testing environment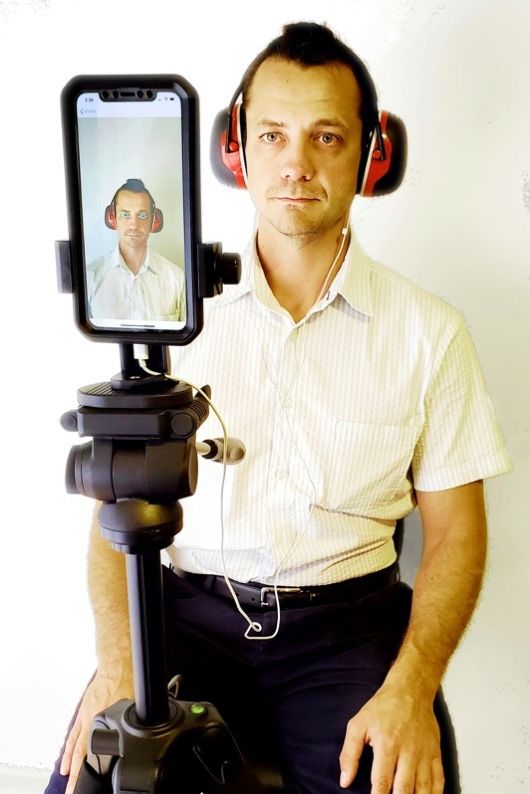
Sensors 2020, 20, 5996                                                                                4 of 15

2.3. Hardware and Software

2.3.1. Mobile Sensing Platform Architecture
      Due to the novelty of this method and testing equipment, we had to design and cooperate
individual equipment and software in order to deliver pure and repeatable sound sets (variable in
frequency and amplitude) as well as collect the blinking responses of the participants. To perform these
tasks, the iPhone X and iPhone X insert earphones (Apple Incorporated, Cupertino, CA, USA) were
used as the hardware platforms to both deliver the acoustic battery and collect the blinking amplitude
(magnitude of the blink) and response time of each blinking reflex.
      The Sound Stimulus App was created (in collaboration with CodeFluegel GmbH., Graz, Austria)
to integrate the acoustic test sets from Table 1 using audio files derived from (https://www.nch.com.au/
tonegen/index.html) into the 2018 iPhone X operating system (iOS11.4.1) and collect the ASR blinking
data. As acoustic outputs may differ between different phones, operation platforms, speakers, and
sound files, we utilized iPhone X insert earphones to limit possible cross compatibility limitations.

                                     Table 1. ASR sound stimulus battery.

         Test Set        Frequency      ~Decibels      Delay to Startle (s)   Volume Scales (Phone)
            1               500             65                  5                       2
            2              1000             90                  6                      10
            3               500            105                  8                      12
            4               500             90                  5                       7
            5              1000             65                  8                       4
            6              2000             65                  7                       3
            7              4000             90                  7                      10
            8              2000             90                  7                       8
            9              4000            105                  5                      14
            10             3000            105                  1                      12
            11             4000             65                  3                       3
            12             1000            105                  7                      14
            13             3000             65                  8                       3
            14             2000            105                  4                      12
            15             3000             90                  9                      12

2.3.2. Application Overview
     In order to collect blinking data, the Sound Stimulus App identified the eyes of an individual
and geometrically designated points along the eyelids to measure the movements between geometric
anchors (P1–6) against others across time. This method enabled the ability to draw parameters
describing the blink completeness as well as the reaction time of both eyes to each test set. The
app uses a data computing Dlib library and the included default face landmarking model file [37].
Dlib is a modern C++ toolkit containing machine learning algorithms and tools for creating complex
software in C++. This model provides 2D facial feature points when applied on a camera stream
containing a human face. In Figure 1, we removed unwanted feature points and maintained only the
eyes (6 points for each eye). The equation in Figure 1 provides an output for the eye size and hence
acts as a blink marker: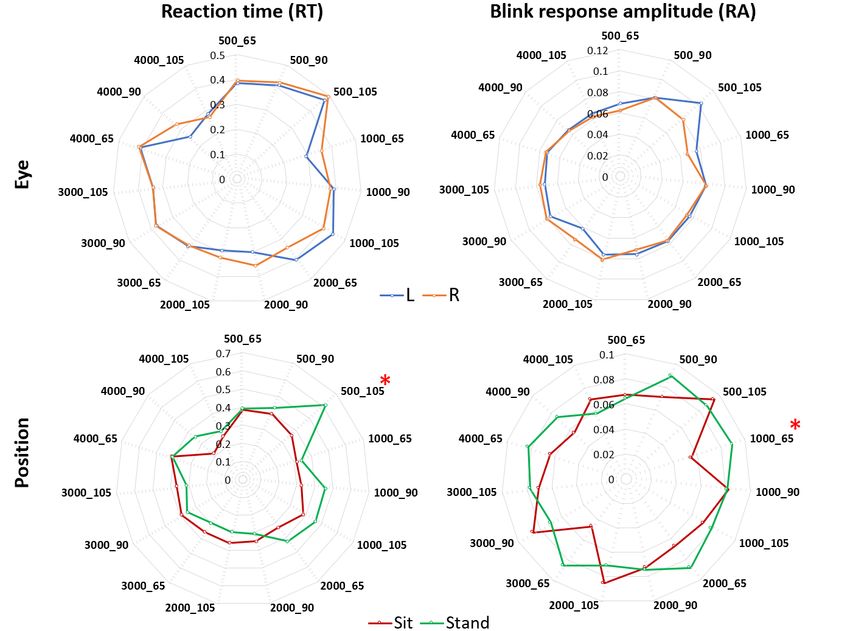
a modern C++ toolkit containing machine learning algorithms and tools for creating complex
software in C++. This model provides 2D facial feature points when applied on a camera stream
containing a human face. In Figure 1, we removed unwanted feature points and maintained only the
eyes (6 points for each eye). The equation in Figure 1 provides an output for the eye size and hence
acts 2020,
Sensors as a blink
20, 5996marker: 5 of 15
P2 P3
P2
P1
P6 P3 P4
P1 P4 P5
P6
P5
1000Hz_Square (S)
0.36 0.36
0.32 0.32
0.28 0.28
0.24 0.24
0.20 0.20
0 1 2 3 4 5 6 7
Left Eye Right Eye
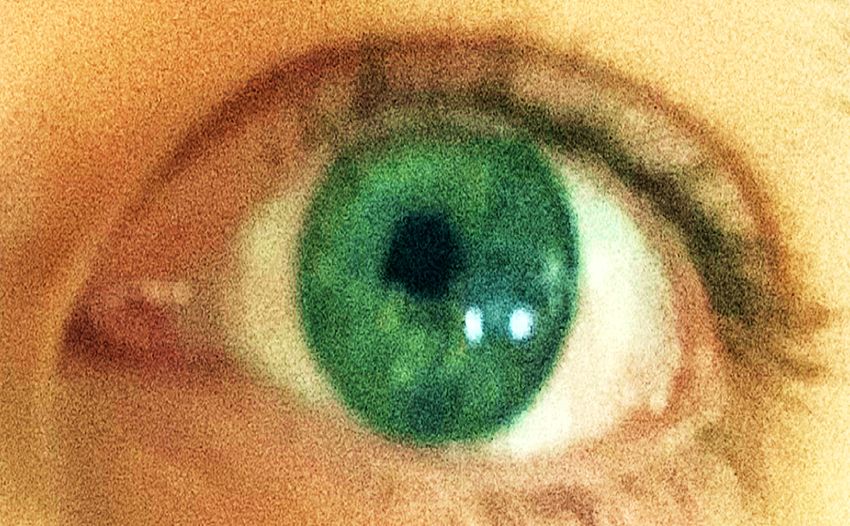
Figure 1. Blink–reflex detection using eye aspect ratio (EAR) across time and the geometric anchors
(P1–6).
FigureThe equation thatdetection
1. Blink–reflex provides using
an output
eye for the eye
aspect ratiosize and across
(EAR) hence acts
timeasand
a blink marker based
the geometric on
anchors
Soukupová
(P1–6). Theand Čech (2016).
equation that provides an output for the eye size and hence acts as a blink marker based
on Soukupová and Čech (2016).
The idea and formula were based on the work by Soukupová and Čech (2016), who developed a
real-time
Thealgorithm
idea and to detect eye
formula were blinks
basedinona video sequence
the work from a standard
by Soukupová and Čechcamera [38].
(2016), whoWedeveloped
adapted
this tracking method and integrated sound stimuli details within the Apple iPhone
a real-time algorithm to detect eye blinks in a video sequence from a standard camera [38]. WeiOS.
This algorithm
adapted calculates
this tracking method andthe distances
integrated between vertical
sound stimuli andwithin
details horizontal eye feature
the Apple iPhone points
iOS.
(one horizontal,
This algorithm calculates the distances between vertical and horizontal eye featureThe
two vertical lines) and computes the aspect ratio of acquired distances. aspect
points (one
ratio is approximately
horizontal, constant
two vertical while
lines) and the eye the
computes is opened and rapidly
aspect ratio falls distances.
of acquired when the The
eye blinks. This is
aspect ratio
change in EAR during
approximately a blink
constant is used
while the eyeas the blink response
is opened amplitude.
and rapidly falls when the eye blinks. This change
in EAR during a blink is used as the blink response amplitude.
2.3.3. ASR Sound Stimulus Battery
The use of this novel mobile ASR monitoring system enabled the introduction of a sound stimulus
battery (Table 1) of 15 pure acoustic sounds at delayed intensities using amplitudes of 65, 90, 105 dB and
frequency variables of 500, 1000, 2000, 3000 and 4000 Hz. Sound sets were relative to normal human
hearing ranges (1–20,000 Hz) introduced high- (4000 Hz) and low- (500 Hz) pitches/frequencies from
parameters adapted from previous studies [31,33,36]. The sound sets we developed included novel use
of the 3000 and 4000 Hz frequencies as well as the 65 dB amplitude to explore more diversified sound
ranges beyond those historically used in literature for ASR elicitation and muscle response monitoring.
To measure the dB output of our mobile ASR monitoring system, 500, 1000, 2000, 3000, and 4000 Hz
sounds were selected at 100% (Sound Stimulus App specific) volume for each test set delivery. The
side buttons on the iPhone X controls the volume of the speaker (volume scales) which we had to
manually select for each test set to deliver either 65, 90, or 105 dB.Sensors 2020, 20, 5996 6 of 15
We used a Digitech professional sound level meter (SLM) and a sound level calibrator (Harman
International Industries, Salt Lake, UT, USA) to monitor the loudness of the testing environment as well
as authenticate the dB output from the insert earphones. To accomplish this, the SLM was configured
to record the highest dB output, set to “C” weighting (for checking the low-frequency content the
sound), and set to “Fast” for normal measurements (fast varying noise) sound recording prior to each
use. We obtained laboratory acoustic background noise using the SLM throughout a workday and
measured the highest dB readings in the laboratory with the door closed to bedata collection. The participant inserted the earphones and placed over the ears further insulating (–
28 dB) noise reduction cups (Work Force Maxi Muffs, Maxisafe, New South Wales, Australia) prior
to the stimulus delivery.
The variables: Hz, dB, delay, and volume scale for each test were manually inputted for each
delivery.
Sensors 2020, Following
20, 5996 input settings and initiation of the application, the camera begins recording. After 7 of 15
establishing these stimulus parameters, the volunteer was instructed to remain still, and look at eye
level with the iPhone X until the stimulus delivery and recordings were concluded.
The sound stimulus battery encompasses a set specific order of acoustic signals which were
The sound stimulus battery encompasses a set specific order of acoustic signals which were
initially randomized to determine delay and sequence (Table 1). Each of the 15 acoustic test sets
initially randomized to determine delay and sequence (Table 1). Each of the 15 acoustic test sets
(delivered
(deliveredas as 100 ms square-wave
100 ms square-wavesounds)
sounds)were
were delivered
delivered biaurally
biaurally to ears
to the the ears
of theofparticipant
the participant
who
who reported as comfortable throughout the ~15 min of stimulus delivery and blink
reported as comfortable throughout the ~15 min of stimulus delivery and blink reflex collection. reflex collection.
The
The blinking
blinking amplitude
amplitude and reaction
and reaction timefrom
time data data the
from the30total
total tests30 tests
were were converted
converted from thefrom the app
app display
display
(Figure(Figure
3) to our 3)data
to our datafor
tables tables for analysis.
analysis.
Figure3.3.Display
Figure Displayof
ofeyelid
eyelidgeodynamics
geodynamics across
across collection
collection time
time (~10
(~10 s).
s). Left
Lefteye
eye(blue)
(blue)and
andright
righteye
eye
(red) response amplitudes and velocities. RT = Reaction time of blink reflex to acoustic stimuli,Green
(red) response amplitudes and velocities. RT = Reaction time of blink reflex to acoustic stimuli, Green
line==ASR
line ASRsound
sound stimulus,
stimulus, Black line =
Black line = Blink
Blink reflex.
reflex.
3.3.Statistical
StatisticalAnalysis
Analysis
To
Todetermine
determinethe the significance
significance of
of these
these data,
data, each recording waswas transferred
transferred from
from the
the Sound
Sound
Stimulus
Stimulus AppApp toto aa laptop
laptop computer
computer (2012
(2012 MacBook
MacBook Pro, Apple Inc., Inc., Cupertino,
Cupertino, CA,
CA, USA)
USA) andand
underwent
underwentstatistical analysis
statistical and and
analysis crosscross
platform data interpretation
platform using MATLAB
data interpretation (The Mathworks
using MATLAB (The
Inc., Natick, MA,
Mathworks Inc.,USA), and MA,
Natick, Microsoft
USA),Office
and365 computing
Microsoft (Microsoft
Office Corp, Washington,
365 computing DC,Corp,
(Microsoft USA).
SPSS (IBM Corp,
Washington, DC,New
USA).York, NY,(IBM
SPSS USA) was utilized
Corp, New York,for data management
NY, USA) as well.
was utilized for Pairwise comparisons
data management as
well. two
using Pairwise
tailedcomparisons
t-tests and a using twomeasures
repeated tailed t-tests and aANOVA
one-way repeated
formeasures one-way
the responses ANOVA
for both for
left/right
eyes and sitting/standing with Bonferroni adjusted and Tukey post-hoc test were conducted.
4. Results
4.1. Eye Synchronization
The use of our mobile acoustic-startle reflex monitoring system (MARS) allowed the collection of
right and left eye responses for the acoustic battery (Table 1). The activity of the eyelid geometry from
the sound-initiation onset or previous blink allowed us the ability to differentiate between open alert
(yellow and green readings markers up to 6 s) and blink response or closed (Figure 1).
4.2. Blink Reaction Time and Response Amplitudes: Left and Right Eye, Sitting and Standing
Blink reaction times (RT) between both eyes showed no significant differences across the ASR
sound stimulus battery. Whereas quickest blink reflexes for the standing and sitting postures occurred
after 4000 Hz_105 dB and 4000 Hz_90 dB respectively (stand mean = 0.29 s, sit mean = 0.26 s;
SD = 0.05, 0.06). The slowest RT between postures were 500 Hz_105 dB for standing (mean = 0.62 s,
SD = 0.04), and 4000 Hz_65 dB for sitting (mean = 0.41 s; SD = 0.02). A comparison between sitting
and standing blink reaction time identified a significant difference (p < 0.05) between these two
postures post 500 Hz_105 dB stimuli (Figure 4). Additionally, left and right eye response amplitudes
showed no significant differences. Averages of blinking amplitude for both eyes to the acoustic
battery were significantly different (p = 0.01) between sitting and standing only with a stimulus
of 1000 Hz_65 dB (Figure 4).occurred after 4000 Hz_105 dB and 4000 Hz_90 dB respectively (stand mean = 0.29 s, sit mean = 0.26
s; SD = 0.05, 0.06). The slowest RT between postures were 500 Hz_105 dB for standing (mean = 0.62 s,
SD = 0.04), and 4000 Hz_65 dB for sitting (mean = 0.41 s; SD = 0.02). A comparison between sitting
and standing blink reaction time identified a significant difference (p < 0.05) between these two
postures post 500 Hz_105 dB stimuli (Figure 4). Additionally, left and right eye response amplitudes
showed no significant differences. Averages of blinking amplitude for both eyes to the acoustic
Sensors 2020, 20, 5996 8 of 15
battery were significantly different (p = 0.01) between sitting and standing only with a stimulus of
1000 Hz_65 dB (Figure 4).
Figure 4. Radar plots showing the average response times (s) and amplitudes for left (L, blue) and
Figure 4. Radar plots showing the average response times (s) and amplitudes for left (L, blue) and
right (R, orange) eyes and sitting (red) and standing (green) position/postures for the multiple stimuli.
right (R, orange) eyes and sitting (red) and standing (green) position/postures for the multiple stimuli.
RT = Reaction time (s), RA = Blink response amplitude (given by change in EAR during blink). *
RT = Reaction Statistically (s),
time RA =pSensors 2020, 20, 5996 9 of 15
Additionally, we concluded the following significant differences (p < 0.05) between frequencies
when analyzing the specific acoustic intensities of 65, 90 and 105 dB. At 65 dB: 500 Hz–1000 Hz and
1000 Hz–4000 Hz. At 90 dB: 500 Hz–4000 Hz and 1000 Hz–4000 Hz. At 105 dB: 500 Hz–2000 Hz,
500 Hz–3000
Sensors
Sensors 2020, 20,Hz,
2020, 20, 500
xx FOR
FOR Hz–4000
PEER
PEER REVIEW
REVIEWHz, 1000 Hz–4000 Hz (Figures 6–8). 99 of
of 15
15
Figure 6. Average
Figure6.6.
Figure Average blink response
blink response times of
response times
times of sitting
of sitting and
sitting and standing
and standingto
standing tovarious
to variousfrequencies
various frequenciesat
frequencies atat65
65dB.
65 dB.
dB.
Significant
Significant differences
differences were
werefound
foundbetween
between 500
500 and
and 1000
1000Hz
Hz and
and 1000
1000 and
and 4000
4000 Hz. R 22 ==fit
fit of
of the
the line
line
Significant differences were found between 500 and 1000 Hz and 1000 and 4000 Hz. R = fit of the line
2
(R2 ==
toto 22
tothe
thedata,
the data,minimal
data, minimaltrend
minimal trendin
trend inRT
in RTthat
RT thatcan
that canbe
can beexplained
be explainedby
explained bythe
by thefrequency
the frequency (R
frequency (R 0.087). ***Statistically
= 0.087).
0.087). Statistically
Statistically
significant
significant p < 0.05.
significant ppSensors 2020, 20, 5996 10 of 15
Sensors 2020, 20, x FOR PEER REVIEW 10 of 15
Figure Average blink
Figure 8.8. Average blink response
response times
times of
of sitting
sitting and
and standing
standingtotovarious
variousfrequencies
frequenciesatat105
105dB.
dB.
Significant differences were found between 500 and 2000, 3000, and 4000 Hz and between
Significant differences were found between 500 and 2000, 3000, and 4000 Hz and between 1000 and 1000 and
4000
4000 Hz. Indicationofofreduction
Hz. Indication reductionininRTRT with
with increasing
increasing frequency,
frequency, moderate
moderate to strong
to strong linear
linear trendtrend
(R2
(R 2 = 0.797). * Statistically significant p < 0.05.
= 0.797). * Statistically significant p < 0.05
5. Discussion
5. Discussion
Using unique and historically used ASR sound sets, we were able to cue the ASR networks
Using unique and historically used ASR sound sets, we were able to cue the ASR networks of
of healthy male participants and track the kinetics of the OO across time with a novel mobile
healthy male participants and track the kinetics of the OO across time with a novel mobile acoustic-
acoustic-startle reflex monitoring system. Individual test set responses between left and right eyes were
startle reflex monitoring system. Individual test set responses between left and right eyes were
compared and showed no statistically significant differences between the reaction times or amplitudes
compared and showed no statistically significant differences between the reaction times or
between the eyes to any of the test sets within the acoustic battery (Figure 3). However, significant
amplitudes between the eyes to any of the test sets within the acoustic battery (Figure 3). However,
differences between the frequency response times and amplitudes after the delivery of specific sound
significant differences between the frequency response times and amplitudes after the delivery of
sets were discovered. Additionally, postural conditions were found to alter the ASR network from
specific sound sets were discovered. Additionally, postural conditions were found to alter the ASR
unique acoustic stimuli.
network from unique acoustic stimuli.
In
Inthe
thestanding
standingand andsitting
sittinganalysis
analysisofofthe
thedata,
data,thethe500
500Hz_105
Hz_105dBdB cued
cueda faster
a fasterblink
blink reflex in in
reflex the
sitting posture yet the 1000 Hz_65 dB sound-set cued a stronger response
the sitting posture yet the 1000 Hz_65 dB sound-set cued a stronger response for amplitude for for amplitude for standing
< 0.05). (p
(pstanding These results
< 0.05). wereresults
These unexpected but may explain
were unexpected but maya sound set specific
explain a soundpostural connectome
set specific posturalin
the ASR network similar to that described by [39,40], where evidence
connectome in the ASR network similar to that described by [39,40], where evidence of fMRI of fMRI anatomical segregation
of auditory segregation
anatomical informationofrelevant
auditorytoinformation
recognitionrelevant
and localization
to recognitionis processed by distinct
and localization neuronal
is processed
populations. However,
by distinct neuronal these postures
populations. have yet
However, these topostures
be evaluatedhave using
yet to any sound stimuli
be evaluated using while using
any sound
fMRI. The combined overall quickest and slowest blink reflexes were identified
stimuli while using fMRI. The combined overall quickest and slowest blink reflexes were identified at 4000 Hz_105 dB, and
500 Hz_105
at 4000 dB respectively
Hz_105 dB, and 500 (Figure
Hz_105 5). dB These were both
respectively high-
(Figure 5).and
Theselow-pitched
were both“loud”
high- andsounds which in
low-pitched
non-human primates describe an evolutionary context with alertness
“loud” sounds which in non-human primates describe an evolutionary context with alertnessand our relations to these sounds
and
to the (potentially dangerous) environment [41,42]. Significant differences
our relations to these sounds to the (potentially dangerous) environment [41,42]. Significant in blink reaction time and
amplitude
differenceswere determined
in blink reactionfrom
timecomparing
and amplitude sittingwere
and standing
determined postures after the delivery
from comparing sitting of the
and
500 Hz_105
standing dB andafter
postures 1000the
Hz_65 dB test
delivery of sets respectively
the 500 Hz_105 dB (Figure
and 10004). Because
Hz_65 dB these
testresults show blink
sets respectively
reaction
(Figure time to be quicker
4). Because at the 500
these results Hz_105
show blinkdB and a lower
reaction time blink
to be reflex
quickeramplitude
at the 500at Hz_105
1000 Hz_65 dB test
dB and a
sets in the
lower sitting
blink reflexcondition,
amplitude these stimuli
at 1000 Hz_65maydBbetestspecified
sets in to
theinvestigations in subjects
sitting condition, unablemay
these stimuli to stand
be
or participants
specified in unique environments
to investigations (zero gravity
in subjects unable to stand or or
underwater
participants environments) to address strength
in unique environments (zero
of response
gravity (over/underreaction)
or underwater and the
environments) speed ofstrength
to address ASR network (hyper-/hypoarousal).
of response (over/underreaction) Furthermore,
and the
these
speedsound
of ASR setsnetwork
may be (hyper-/hypoarousal).
expanded to additionalFurthermore,
frequency-decibel variants.
these sound sets may be expanded to
additional frequency-decibel variants.Sensors 2020, 20, 5996 11 of 15
Between both postures, pairwise comparisons for the different frequencies concluded
significant differences between the following test sets: 500 Hz_65 dB–500 Hz_105 dB (p = 0.01),
4000 Hz_65 dB–4000 Hz_105 dB (p = 0.02) and 500 Hz_105 dB-4000 Hz_105 dB (p = 0.000022).
These unique sound sets may shift attitudes towards testing toward the higher and lower frequency
(±4000 and 500 Hz) with different decibel ranges for future investigations, contrary to previous ASR
literature using 1000 and 2000 Hz frequencies for induction. The differences in reactions to these sounds
may be significant in terms of cueing the unconscious regions of reactive “survival” limbic, reticular,
and autonomic systems for investigating neuronal operating bands in both healthy and disordered
(hypo/hyperactive) states. Additionally, these unique sounds may establish further population-specific
common ranges of activity such as those identified in children with autism spectrum disorders where
hyperreactivity to weak acoustic stimuli and prolonged acoustic startle latency were found in a specific
age and condition (autism) cohort [32]. Using varying frequencies and sound intensities i.e., low
(500 Hz,65 dB) and high (4000 Hz, 105 dB) to test the ASR, may alter the level of pleasantness/arousal
of the sound, which in the past has been associated with emotional and affectional contexts and in
turn responses [43–46]. Due to these parameters causing either a very quick or slow blink reflex,
investigators may utilize these tones in populations associated with neurotone hyper-/hypoarousal
such as anxiety and depression [30,44], or may look at specific dysfunction (brain injury) in autonomic,
reticular, limbic, or other networks intrinsic to sound processing and reflex outputs [47,48].
We found additional significant differences (p < 0.05) at 65 dB: 500 Hz–1000 Hz and 1000 Hz–4000 Hz.
At 90 dB: 500 Hz–4000 Hz and 1000 Hz–4000 Hz. At 105 dB: 500 Hz–2000 Hz, 500 Hz–3000 Hz,
500 Hz–4000 Hz, and 1000 Hz–4000 Hz for our sound sets. These correlations are not yet understood
but may represent connectome-specific tonotopy thresholds or transitions between specific frequency
groups of stereocilia or ASR processes of deeper brain centers [48–50]. Nevertheless, using the ASR
to describe more neurophysiologic spectrums of arousing and depressing activity within a reflex
latency scale has applicability in defining neurological tone in patients/participants suffering from
central nervous system trauma (traumatic brain injury, stroke) and neurological degenerative disorders
(Alzheimer’s and Parkinson’s). For example, we know that we should see a normal range of blink,
amplitude, and eye synchronicity responses from a young healthy male, but, if he were to suffer a
concussion or brain injury, the ASR networks may display anomalous responses [51]. The ASR may be
delayed, accelerated, or show no reflex at all during the peri/post recovery period and, during this
time, the blink reflex and acoustic-processing networks may be conveniently monitored with a mobile
phone before/during/after clinical examination for functional abnormalities. Further investigations
incorporating the subject’s emotional state, arousal or attention, and comfort level may better correlate
more specific outputs within a psychiatric context. From our analyses, there is an indication that both
higher and lower frequencies with high sound amplitudes may be suitable for future studies in fields
of psychiatry, specifically, anxiety, depression, and post-traumatic stress disorder (PTSD).
In this study, we created a mobile acoustic startle response monitoring app and showed that the
app produced certain frequency-decibel sound sets in order to record the ASR for blink amplitude and
latency in healthy adults for sitting and standing postures. We were able to identify and investigate
potential correlations in the responses of individual and cooperative OO muscles to various acoustic
stimuli using a mobile and wire-free system. Additionally, we found that certain sound sets induced
contrasting reaction times in and between both postures and identified specific pure sounds for
future startle response investigations as well as established a baseline ASR spectrum of responses for
healthy adults. These healthy parameters may further be contrasted against future ASR spectrums for
disordered mood and/or neurological condition monitoring.
Additionally, our findings may also lend to the classification of and recording of neurodegenerative
and abnormal neurosystem conditions (such as paraplegia, cerebral palsy, or multiple sclerosis), using
unique sound sets where sitting or standing postures are altered or not always possible. The ability to
remotely and conveniently monitor for ASR-spectrum deviations and establish individual normative
ASR reaction time and intensity ambits may also amplify performance training/conditioning schemesSensors 2020, 20, 5996 12 of 15
or establish neurosystem measurement parameters for elite programs (Astronaut/Cosmonaut/Military
special operations/forces). The means of wire-free monitoring the state of the nervous system using
long established and rugged hardware (smart phone with protective case) opens horizons to remote
monitoring in extreme environments.
The results from this investigation indicate the potential significance of using specific frequency,
amplitude, and postural conditions in ASR studies in addition to diversifying the remote monitoring
capabilities of biometric devices from smart devices (iPhone). Utilizing sound parameters with posture
related responses while monitoring the acoustic startle reflex with a mobile phone may open new
horizons in ASR monitoring across a multitude of populations in order to identify biometric parameters
of healthy responses.
5.1. Limitations
This was a pilot study, hence the sample size (N) was relatively small; nevertheless, our
investigations were able to show usability and effectiveness in determining differences in responses to
acoustic battery and posture. Future studies will utilize a larger N. Although the acoustic batteries
used to induce the ASR were more diverse than those used in previous literature, time and resources
limited the use of additional frequency and amplitude investigational acoustic sets, notably the use of
more numerous higher or lower frequency sounds (>500 Hz andSensors 2020, 20, 5996 13 of 15
This opens new horizons for the ASR to be used for diagnosis and monitoring in numerous clinical
conditions (e.g., stroke, traumatic brain injury, and mood disorders). The findings in the present study
suggest that MARS is a simple and mobile methodology used to study the links between acute acoustic
variables and their subsequent effects on the human blink response.
Author Contributions: Y.O.C. and C.L.G.: Designed the study protocol, Y.O.C., P.K., and C.L.G.: Designed and
contributed to the development of the mobile app, C.L.G.: Collected the data, P.K.: Analyzed the data, C.L.G.,
P.K., and Y.O.C.: Interpreted the results, C.L.G., P.K., and Y.O.C.: Wrote the manuscript. All authors have read and
agreed to the published version of the manuscript.
Funding: The sound stimulus application development in this research was funded by Inventram (Istanbul,
Turkey).
Conflicts of Interest: YOC has pending and granted patents involving/related to mobile monitorization of ASR.
Abbreviations
ASR Acoustic startle reflex
OO Orbicularis oculi
EAR Eye Aspect Ratio
EMG Electromyogram
SD Standard Deviation
DSM-V Diagnostic and Statistical Manual of Mental Disorders Fifth Edition
Hz Hertz
dB Decibels
N Sample size
SLM Sound level meter
MARS Mobile acoustic-startle reflex monitoring system
RT Reaction time
P Probability value
References
1. World Health Organization. Depression and Other Common Mental Disorders. In Global Health Estimates;
World Health Organization: Geneva, Switzerland, 2017.
2. Trautmann, S.; Rehm, J.; Wittchen, H. The economic costs of mental disorders: Do our societies react
appropriately to the burden of mental disorders? EMBO Rep. 2016, 17, 1245–1249. [CrossRef] [PubMed]
3. Hackett, P.T.; Cassem, H.N. Handbook of General Hospital Psychiatry, 2nd ed.; PSG Publishing Company, INC.:
Littleton, MA, USA, 1987.
4. Rauch, S.L.; Whalen, P.J.; McInerney, S.C.; Macklin, M.L.; Lasko, N.B.; Orr, S.P.; Pitmman, R.K. Exagerated
amygdala response to masked facial stimuli in posttraumatic stress disorder: A functional MRI study. Biol.
Psychiatry 2000, 47, 769–776. [CrossRef]
5. Koutsouleris, N.; Meisenzahl, E.M.; Borgwardt, S.; Rieher-Rossler, A.; Frodi, T.; Kambeitz, J.; Kohler, Y.;
Falkai, P.; Moller, H.J.; Reiser, M.; et al. Individualized differential diagnosis of schizophrenia and mood
disorders using neuroanatomical biomarkers. Brain J. Neurol. 2015, 7, 2059–2073. [CrossRef] [PubMed]
6. Le-Niculescu, H.; Kurian, S.M.; Yehyawi, N.; Dike, C.; Patel, S.D.; Edenberg, H.J.; Tsuang, M.T.; Salomon, D.R.;
Nurnberger, J.I., Jr.; Niculescu, A.B. Identifying blood biomarkers for mood disorders using convergent
functional genomics. Mol. Psychiatry 2009, 14, 1143. [CrossRef]
7. Francis, A. The past, present, and future of psychiatric diagnosis. World Psychiatry 2013, 12, 111–112. [CrossRef]
8. American Psychiatric Association. Trauma- and Stressor-Related Disorders. In Diagnostic and Statistical
Manual of Mental Disorders, 5th ed.; American Psychiatric Association: Washington, DC, USA, 2013.
9. Phillips, K.A.; First, M.B.; Pincus, H.A. (Eds.) Advancing DSM: Dilemmas in Psychiatric Diagnosis; American
Psychiatric Association: Washington, DC, USA, 2003.
10. International Classification of Diseases. 6B40 Post Traumatic Stress Disorder, ICD-11 for Mortality and
Morbidity Statistics (Version 04). Available online: https://icd.who.int/browse11/l-m/en#/http://id.who.int/
icd/entity/2070699808 (accessed on 1 June 2019).Sensors 2020, 20, 5996 14 of 15
11. Kaviani, H.; Gray, J.A.; Checkley, S.A.; Raven, P.W.; Wilson, G.D.; Kumari, V. Affective modulation of the
startle response in depression: Influence of the severity of depression, anhedonia, and anxiety. J. Affect. Dis.
2004, 15, 21–31. [CrossRef]
12. Lang, P.J.; Bradley, M.M.; Cuthbert, B.N. Emotion, attention, and the startle reflex. Psychol. Rev. 1990, 3,
377–395. [CrossRef]
13. Bakker, M.J.; Boer, F.; Benninga, M.A.; Koelman, J.H.T.M.; Tijssen, M.A.J. Increased Auditory Startle Reflex in
Children with Functional Abdominal Pain. J. Pediatrics 2010, 156, 285–291. [CrossRef]
14. Benning, S.D. Postauricular and superior auricular reflex modulation during emotional pictures and sounds.
Psychophysiology 2011, 48, 410–414. [CrossRef]
15. Benvenuti, S.M.; Bianchin, M.; Angrilli, A. Effects of simulated microgravity on brain plasticity: A startle
reflex habituation study. Physiol. Behav. 2011, 104, 503–506. [CrossRef]
16. Blanch, A.; Balada, F.; Aluja, A. Habituation in acoustic startle reflex: Individual differences in personality.
Int. J. Psychophysiol. 2014, 91, 232–239. [CrossRef] [PubMed]
17. Delwaide, P.J.; Shepens, B. Auditory startle (audio-spinal) reaction in normal man: EMG responses and
H reflex changes in antagonistic lower limb muscles. Electroencephalogr. Clin. Neurophysiol. 1995, 97,
416–423. [CrossRef]
18. Grillon, C.; Morgan, C.A.; Southwich, S.M.; Davis, M.; Charney, D.S. Baseline startle amplitude and prepulse
inhibition in Vietnam veterans with posttraumatic stress disorder. Psychiatry Res. 1995, 64, 169–178. [CrossRef]
19. Grillon, C.; Pellowski, M.; Merikangas, K.R.; Davis, M. Darkness facilitates the acoustic startle reflex in
humans. Biol. Psychiatry 1997, 42, 453–460. [CrossRef]
20. Kiziltan, M.E.; Gunduz, A.; Apaydin, H.; Ertan, S.; Kiziltan, G. Auditory startle reflex and startle reflex to
somatosensory inputs in generalized dystonia. Clin. Neurophysiol. 2015, 126, 1740–1745. [CrossRef]
21. Korn, C.W.; Staib, M.; Tzovara, A.; Castegnetti, G.; Bach, D.R. A pupil size response model to assess fear
learning. Psychophysiology 2017, 54, 330–343. [CrossRef]
22. Kumari, V.; Gray, J.A. Smoking withdrawal, Nicotine dependence and prepulse inhibition of the acoustic
startle reflex. Psychopharmacology 1999, 141, 11–15. [CrossRef]
23. Morgan, C.A.; Grillon, C.; Lubin, H.; Southwick, S.M. Startle Reflex Abnormalities in Women with Sexual
Assault-Related Posttraumatic Stress Disorder. Am. J. Psychiatry 1997, 154, 1076–1080.
24. Muller, J.; Kofler, M.; Wenning, G.K.; Seppi, K.; Valls-Sole, S.; Poewe, W. Auditory startle response in cervical
dystonia. Mov. Disord. 2003, 18, 1522–1526. [CrossRef]
25. Nonnekes, J.; Geel, K.V.; Oude Nijhuis, L.B.; Bloem, B.R.; Geurts, A.C.; Weerdesteyn, V. Loading enhances
the occurrence of startle responses in leg muscles. Neuroscience 2013, 240, 186–190. [CrossRef]
26. Nonnekes, J.; Geurts, A.C.H.; Oude Nijhuis, L.B.; Geel, K.V.; Snijders, A.H.; Bloem, B.R.; Weerdesteyn, V.
Reduced StartReact effect and freezing of gait in Parkinson’s disease: Two of a kind? J. Neurol. 2014, 261,
943–950. [CrossRef]
27. O’beirne, G.A.; Patuzzi, R.B. Basic properties of the sound-evoked post-auricular muscle response (PAMR).
Hear. Res. 1999, 138, 115–132. [CrossRef]
28. Oude Jijhuis, L.B.; Allum, J.H.J.; Valls-Sole, J.; Overeem, S.; Bloem, B.R. First Trial Postural Reactions to
Unexpected Balance Disturbances: A comparison With the Acoustic Startle Reaction. J. Neurophysiol. 2010,
104, 2704–2712. [CrossRef] [PubMed]
29. Rigato, S.; Rieger, G.; Romei, V. Multisensory signaling enhances pupil dilation. Sci. Rep. 2015, 6, 26188.
[CrossRef] [PubMed]
30. Samuels, E.R.; Hou, R.H.; Langley, R.W.; Szabadi, E.; Bradshaw, C.M. Modulation of the Acoustic Startle
Response by the Level of Arousal: Comparison of Clonidine and Modafinil in Healthy Volunteers.
Neuropsychopharmacology 2007, 32, 2405–2421. [CrossRef]
31. Siegelaar, S.E.; Olff, M.; Bour, L.J.; Veelo, D.; Zwinderman, A.H.; Bruggen, G.V.; Vries, G.J.D.; Raabe, S.;
Cupido, C.; Koelman, J.H.T.M.; et al. The auditory startle response in post-traumatic stress disorder.
Exp. Brain Res. 2006, 174, 1–6. [CrossRef]
32. Takahashi, H.; Nakahachi, T.; Komatsu, S.; Ogino, K.; Iida, Y.; Kamio, Y. Hyperreactivity to weak acoustic
stimuli and prolonged acoustic startle latency in children with autism spectrum disorders. Mol. Autism 2014,
5, 23. [CrossRef]
33. Talaat, H.S.; Kabel, A.H.; Khalil, L.H.; Said, N.M. Post Auricular Muscle Response in Auditory Neuropathy.
J. Int. Adv. Otol. 2010, 6, 360–364.Sensors 2020, 20, 5996 15 of 15
34. Blumenthal, T.D.; Cuthbert, B.N.; Filion, D.L.; Hackley, S.; Lipp, O.V.; van Boxtel, A. Committee report:
Guidelines for human startle eyeblink electromyographic studies. Psychophysiology 2005, 42, 1–15. [CrossRef]
35. Yeomans, J.S.; Liang, L.; Scott, B.W.; Frankland, P.W. Tactile, acoustic and vestibular systems sum to elicit the
startle reflex. Neurosci. Biobehav. Rev. 2001, 26, 1–11. [CrossRef]
36. Koch, J.; Flemming, J.; Zeffiro, T.; Rufer, M.; Orr, S.P.; Mueller-Pfeiffer, C. Effects of Posture and Stimulus
Spectral Composition on Peripheral Physiological Responses to Loud Sounds. PLoS ONE 2016, 11, e0161237.
[CrossRef] [PubMed]
37. Dlib C++ Library, Algorithm. Available online: http://dlib.net/algorithms.html#murmur_hash3 (accessed on
1 June 2019).
38. Soukupova, T.; Cech, J. Real-Time Eye Blink Detection using Facial Landmarks. In Proceedings of the 1st
Computer Vision Winter Workshop, Rimske Toplice, Slovenia, 3–5 February 2016.
39. Maeder, P.P.; Meuli, R.A.; Bellmann, A.; Fornari, E.; Thiran, J.-P.; Pittet, A.; Clarke, S. Distinct Pathways
Involved in Sound Recognition and Localization: A Human fMRI Study. Neuroimage 2001, 14, 802–816.
[CrossRef] [PubMed]
40. Lewis, J.W.; Wightman, F.L.; Brefczynski, J.A.; Phinney, R.E.; Binder, J.R.; DeYoe, E.A. Human brain regions
involved in recognizing environmental sounds. Cereb. Cortex. 2004, 14, 1008–1021. [CrossRef]
41. Aboitiz, F. A Brain for Speech. Evolutionary Continuity in Primate and Human Auditory-Vocal Processing.
Front. Neurosci. 2018, 12, 174. [CrossRef]
42. Bocchi, C.; Severi, F.M.; Bruni, L.; Filardi, G.; Delia, A.; Boni, C.; Altomare, A.; Bellieni, C.V.; Petraglia, F.
Ultrasound and Fetal Stress: Study of the Fetal Blink-Startle Reflex Evoked by Acoustic Stimuli. Neonatal Pain
2008, 4, 31–33. [CrossRef]
43. Quam, R.; Martinez, I.; Lorenzo, C.; Bonmati, A.; Rosa-Zurera, M.; Jarabo, P.; Arsuaga, J.L. Studying audition
in fossil hominins: A new approach to the evolution of language? In Psychology of Language; Nova Science
Publishers, Inc.: New York, NY, USA, 2012; pp. 1–37.
44. Fujisawa, T.; Cook, N.D. Identifying emotion in speech prosody using acoustical cues of harmony.
In Proceedings of the Eighth International Conference on Spoken Language Processin INTERSPEECH, Jeju
Island, Korea, 4–8 October 2004; pp. 1333–1336.
45. Russel, J.A. A circumplex model of affect. J. Personal. Soc. Psychol. 1980, 39, 1161–1178. [CrossRef]
46. Hagman, F. Emotional Response to Sound. Master’s Thesis, Chalmers University of Technology, Goteborg,
Sweden, 2010.
47. Wu, M.-F.; Suzuki, S.S.; Siegel, J.M. Anatomical distribution and response patterns of reticular neurons active
in relation to acoustic startle. Brain Res. 1988, 2, 399–406.
48. Hall, D.A.; Plack, C.J. Pitch Processing Sites in the Human Auditory Brain. Cereb. Cortex 2008, 19,
576–585. [CrossRef]
49. Hackett, T.A. The Human Auditory System; Fundamental Organization and Clinical Disorders Chapter 2,
Anatomic organization of the auditory cortex. Handb. Clin. Neurol. 2015, 129, 27–53.
50. Smith, S.W. Chapter 22—Audio Processing/Human Hearing. In The Scientist and Engineer’s Guide to Digital
Signal Processing; California Technical Publishing: San Diego, CA, USA, 1998.
51. Zivi, I.; Bertelli, E.; Bilotti, G.; Clemente, A.; Saltuari, L.; Frazzitta, G. Blink-associated contralateral eccentric
saccades as a rare sign of unilateral brain injury. Neurology 2017, 88, 2. [CrossRef]
Publisher’s Note: MDPI stays neutral with regard to jurisdictional claims in published maps and institutional
affiliations.
© 2020 by the authors. Licensee MDPI, Basel, Switzerland. This article is an open access
article distributed under the terms and conditions of the Creative Commons Attribution
(CC BY) license (http://creativecommons.org/licenses/by/4.0/).You can also read