The Munich Bikeability Index: A Practical Approach for Measuring Urban Bikeability - MDPI
←
→
Page content transcription
If your browser does not render page correctly, please read the page content below
sustainability

Article
The Munich Bikeability Index: A Practical Approach for
Measuring Urban Bikeability
Jonas Schmid-Querg, Andreas Keler *                        and Georgios Grigoropoulos

                                             Chair of Traffic Engineering and Control, Technical University of Munich (TUM), 80333 Munich, Germany;
                                             jonas.schmid-querg@tum.de (J.S.-Q.); george.grigoropoulos@tum.de (G.G.)
                                             * Correspondence: andreas.keler@tum.de

                                             Abstract: This research addresses the phenomenon of varying bicycle friendliness in urban areas and
                                             considers which elements are necessary to design a city in a bike-friendly manner. It aims to provide
                                             a deeper understanding of the term bikeability, in relation to the established term walkability, and
                                             methods to create models that measure the degree of bikeability in urban areas. We explain different
                                             established models and compare their computational bases. The focus of this paper is to define a
                                             computational methodology built within a Geographic Information System (GIS) and a subsequent
                                             evaluation based on an investigation area in Munich, Germany. We introduce a bikeability index for
                                             specific investigation areas and geovisualize four selected factors of this index. The resulting map
                                             views show the road segments of the traffic network where the conditions for biking are adequate,
                                             but also those segments which need to be improved.

                                             Keywords: urban transportation; spatial analysis; bicycle infrastructure; vulnerable road users;
                                             bikeability; bicycle friendliness

                                   1. Introduction

                                                   An increasing number of people are using bicycles daily, to explore their advantages
Citation: Schmid-Querg, J.; Keler, A.;
                                             for commuting between various locations, to conduct shopping activities, or as a means
Grigoropoulos, G. The Munich
                                             for leisure time including tourist activities [1]. As opposed to motorized private transport,
Bikeability Index: A Practical
Approach for Measuring Urban
                                             bicycles are more environmentally friendly, cheaper, and health enhancing, and may also
Bikeability. Sustainability 2021, 13, 428.
                                             be more time efficient for short to medium long routes in urban areas [2].
https://doi.org/10.3390/su13010428                 Nowadays, bicycles are not only a means for reaching a destination but rather a trend
                                             for expressing a certain way of life, representing an environmentally and health-oriented
Received: 16 November 2020                   conscience [3]. This socio-cultural phenomenon becomes evident through a rising share
Accepted: 30 December 2020                   of bicycles in the modal split [4]. Both, the global climate and the local environment are
Published: 5 January 2021                    profiting from this change through reduced carbon dioxide (CO2) emissions (global) and,
                                             respectively, nitrogen oxides (NOx) emissions (local), and thus an improved air quality [5].
Publisher’s Note: MDPI stays neu-            Bicycle infrastructure needs significantly less space and is cheaper as compared with
tral with regard to jurisdictional clai-     other means of transport [6], which is especially beneficial in metropolises with their
ms in published maps and institutio-         characteristic problems of scarce spaces. Current developments have included introducing
nal affiliations.                            user-adaptive systems for human-electric bikes to increase ridership, such as by Lee and
                                             Jiang [7], which might benefit the comfort of urban cycling with novel technologies usually
                                             experienced in motorized individual transport.
Copyright: © 2021 by the authors. Li-
                                                   Over the years, many studies have explored all types of traffic-related aspects with
censee MDPI, Basel, Switzerland.
                                             regard to the motorized individual transport, much less with regard to bicycles and their
This article is an open access article
                                             role in traffic [8,9].
distributed under the terms and con-               The goal of this work is to provide an overview of the possibilities for measuring the
ditions of the Creative Commons At-          degree of how suitable urban regions are for biking. We identify the contributing factors
tribution (CC BY) license (https://          and explain existing methods with indices for measuring bikeability. The focus of this
creativecommons.org/licenses/by/             approach, however, is on the creation of our own experimental bikeability index for a
4.0/).                                       specific part of the city of Munich based on applying GIS methodologies. We conclude with

Sustainability 2021, 13, 428. https://doi.org/10.3390/su13010428                                         https://www.mdpi.com/journal/sustainability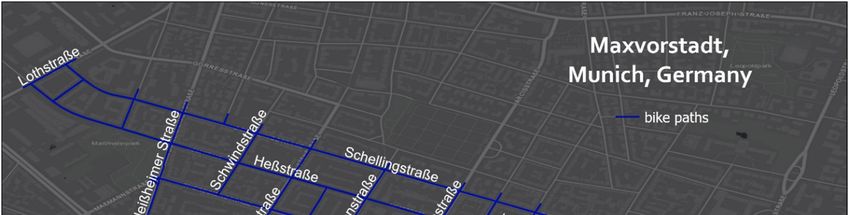
Sustainability 2021, 13, 428                                                                                             2 of 14

                               result visualizations and a discussion on the strengths and weaknesses of the approach for
                               the case studies conducted in Munich, Germany.
                                     The main contribution of this work consists of introducing a novel bikeability index
                               with specific benefits in selected applications. One advantage of this index consists of its
                               efficient and simple computation and the ability to adapt to the specific static components
                               of various investigation areas. The index is useful for detecting spots of low bikeability on
                               road networks with different spatial extents.

                               2. State-of-the-Art Bikeability
                                     The word “bikeability” is a relatively novel term, used in various scientific arti-
                               cles [10–12] but not yet implemented in reputed dictionaries. The Merriam-Webster and
                               Oxford Dictionary only include the term “bikeable” and define it as “suitable or fit for
                               biking” [13] and, respectively, “suitable or safe for cyclists” [14].
                                     Different definitions from various authors exist, however, many do not work concisely,
                               and thus vague understandings of the term emerge. The most precise definition appears
                               to be one by Lowry et al. [15]. Bikeability is “an assessment of an entire bikeway network
                               for perceived comfort and convenience and access to important destinations” [15]. They
                               differentiate bikeability, bicycle suitability, and bicycle friendliness. Bicycle suitability is
                               “an assessment of the perceived comfort and safety of a linear section of a bikeway”. Hence,
                               bikeability is a superordinate concept, spatially and content related. Bicycle friendliness
                               embodies aspects of bikeability, and it refers to an evaluation by a community [16] regarding
                               different aspects of biking such as laws and policies, education efforts, and the acceptance
                               of cycling [17,18].
                                     According to Nielsen et al. [19], bikeability is an indexation of the environment in
                               which cycling is taking place and how the examined area supports choosing the bicycle as
                               a mode of transport. The elements of the indexation are of an infrastructural (including
                               proximity to access to other modes of transport) and topological manner [19]. In general,
                               planning and implementing bicycle infrastructure in urban environments is challenging [20]
                               and may make use of complex optimization techniques [21]. Other approaches have
                               focused on evaluating a present bicycle infrastructure by observing cyclists [22] and relating
                               extracted patterns [23,24], such as route preferences [25], to the underlying road network
                               structure [26].
                                     Other research has focused on the level of stress experienced by cyclists in selected
                               environments, which has been extracted via surveys concerning the level of stress along
                               routes [27]. This is described as a user-centered approach as personal views on traversed
                               bicycle infrastructures are being evaluated [28]. Because data on perceived safety can
                               be assessed [29], various views on bicycle traffic safety [30] may be incorporated into
                               bikeability estimations [31]. This is of paramount importance when observing mode
                               choices of daily commuters [32].
                                     On a broader level, the presence of bike sharing services [33] are incorporated into
                               a selection of environmental factors [34], which may become more important in future
                               studies on estimating bikeablity indices of various urban environments [35]. Additionally,
                               present and future bicycle courier services may benefit from calculating bikeability indices
                               for improving their service qualities [36].

                               2.1. Measuring and Modeling Bikeability
                                    The bikeability of a city or district can be analyzed with certain methods. Various
                               models or indices exist, which try to classify the bikeability using selected criteria. As the
                               indices do not always encompass the same criteria, there can be different weighting or
                               usage approaches, and results may not be consistent for the same city.
                                    In the following subsections, we briefly explain four existent indices, and derive a
                               clustering of these approaches.
Sustainability 2021, 13, 428                                                                                           3 of 14

                               2.1.1. The Copenhagenize Index
                                     Initiated by the Copenhagenize Design Company, in 2011, this index ranks the 136
                               most bicycle-friendly cities in the world. It encompasses 14 categories in which cities can
                               obtain zero to four points, as well as bonus points for special effort. This index refers
                               to cities as a whole and does not differentiate between different districts in the publicly
                               available results. The entire analysis likely represents the business case by selling the
                               information to the cities. The components are as follows [37]:
                               1.    Lobbying of non-governmental organizations (NGOs);
                               2.    Bicycle culture (how well are bicycles established among citizens);
                               3.    Bike facilities (availability of parking spaces, ramps, designated spaces in trains;
                               4.    Bicycle infrastructure;
                               5.    Bike-sharing programs;
                               6.    Gender split (percentage of men and women that use bicycles);
                               7.    Modal split;
                               8.    Modal split increase of bikes since 2006;
                               9.    Safety perception (the perception that cycling is safe);
                               10.   Politics (political involvement in promoting bikeability);
                               11.   Social acceptance (feelings of car drivers towards cyclists);
                               12.   Urban planning;
                               13.   Traffic abatement (efforts that have been made to implement slow traffic zones);
                               14.   Freight bicycles and logistics.

                               2.1.2. Bicycle Level of Service
                                    Another possibility is the approach via the “bicycle level-of-service” (BLOS) [38],
                               developed by Lowry et al. [15]. This rather recent method calculated the bicycle suitability
                               using the bicycle level-of-service of the Highway Capacity Manual (HCM) which delivered
                               a BLOS value for linear and linked street segments by certain criteria such as width of bike
                               lane, vehicle traffic volume, vehicle speed, and pavement condition. Then, this BLOS value
                               was enhanced by the concept of accessibility for calculating bikeability.
                                    This variable is modeled by the well-known equation:

                                                                       Ai = Ej × f rij                                  (1)

                               where Airepresents the accessibility of a location I; Ej the importance of a destination j;
                               and f rij an impedance function for travel time, distance, or costs rij from i to j.
                                    The result is a spatial feature (grid cell) that is a decimal number between zero and
                               one, those with close destinations as well as those with good BLOS routes have a high
                               bikeability. The analysis is GIS-based and the result is a grid-based map representation of
                               bikeability [15].
                                    This is the only index that contains the concept of accessibility. It is solely based on
                               spatial data, and thus is reliant on its quality. The authors remark that sufficient data is
                               not available for all streets, which is why, in this case study, our own field assessment and
                               estimations have been carried out for some criteria. This implicates a rather high effort for
                               bigger cities should this method be used elsewhere.

                               2.1.3. The “ADFC Fahrradklimatest” in Germany
                                     Every two years the ADFC (Allgemeiner Deutscher Fahrradclub, General German
                               Bicycle Association) gathers data to assess the bicycle friendliness in many cities. According
                               to its own statement, the survey is the largest in the world and, in 2016, more than 120,000
                               people from 539 cities took part [39]. The approach is not based on quantitative but rather
                               on qualitative information obtained from individual valuations of the test subjects as
                               everyone is able to take part in an online questionnaire regarding the following topics:
                               1.    Cycling and traffic climate;
                               2.    Safety for cyclists;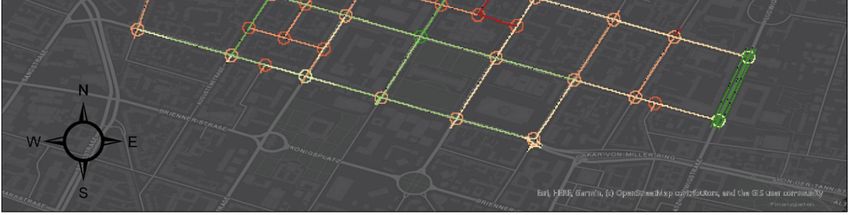
Sustainability 2021, 13, 428                                                                                             4 of 14

                               3.   Family friendliness;
                               4.   Comfort for cyclists;
                               5.   Infrastructure and network of designated bike paths;
                               6.   Status of bicycle traffic.
                                    Every question is rated from good to bad and a number from one to six is generated.
                               Thus, the perceptions of many people form the public opinion of bicycle friendliness. Per-
                               ceptions are subjective, hence, the accuracy of a data-based analysis of traffic infrastructure
                               cannot be met by this approach. Furthermore, it is only possible to create an image of the
                               whole city, and not of different districts where improvement might be critical. Specific
                               demand for action cannot be evaluated locally.

                               2.1.4. Bikeability Index Dresden
                                    This index visualizes the bikeability with regular spatial grid cells with the dimensions
                               of 100 × 100 m. This is the only available resolution for bikeable zones. It is an additive
                               index, which calculates a number via adding values for different criteria for each grid cell.
                               This number is the bikeablity of the respective cell. The grid cell information for every
                               criterion is addressed via weighted overlay analysis, which originates from McHarg [40]
                               and is related to map algebra [41]. The following components are solely hard factors and
                               do not entail supplementary measures such as political agendas [42]:
                               1.   Bicycle infrastructure (bike paths and lanes);
                               2.   Existence of structurally-separated bike paths;
                               3.   Green area and water surface;
                               4.   Topography;
                               5.   Land use;
                               6.   Bicycle facilities;
                               7.   Traffic load.
                                     Within the criterion topography, steep terrain slopes reduce the number of people
                               willing to use bicycles, as the effort to reach destinations is regarded as uncomfortable.
                               In this case study, all criteria have been weighted equally, thus, the importance of certain
                               aspects may not be valued sufficiently. This index does not include accessibility. Neverthe-
                               less, the included aspect of land use analysis is taken into account via densities of potential
                               destinations within grid cells.

                               2.2. Theoretical Approaches of Bikeablity Indices and Literature Classification
                                     Firstly, models that include solely hard factors of bikeability (infrastructure and bicycle
                               facilities) can be differentiated from those that consider soft factors, such as organizational
                               and supplementary, but not constructional measures such as events and political agendas
                               of cities. This is the underlying difference between bikeability and bicycle friendliness.
                               Secondly, there are two different methods of information gathering, i.e., technical analysis
                               of infrastructure (own assessments or external procurement of data stored in geodatabases)
                               and public surveys. The former is factual, and the latter represents the perception of traffic
                               participants. The third stage would be the resolution of the model, whether it is city-level-
                               or grid-based model (e.g., based on 100 × 100 m cells). The grid-based or choropleth
                               map-based model gives an opportunity to visualize bikeability in certain districts of a
                               city. Models working with geodatabases mostly have higher spatial resolutions, although
                               supplementary factors often cannot be incorporated at this level. The fourth and last stage
                               would be the consideration of accessibility as it is considered in Lowry et al. [15]. It is not
                               especially a hard nor a soft factor and surpasses the connectivity, as certain places may be
                               linked to attractive destinations by a very good bike path, although this path is several
                               kilometers long.
                                     If a municipality aims to locally analyze its strengths and weaknesses regarding
                               bikeability, available literature reveals that often available data sources related to the built
                               infrastructure or population are formed into grid-based data aggregations with manually
                               assigned resolutions [43], whereas both data models, raster-based and vector-based, can be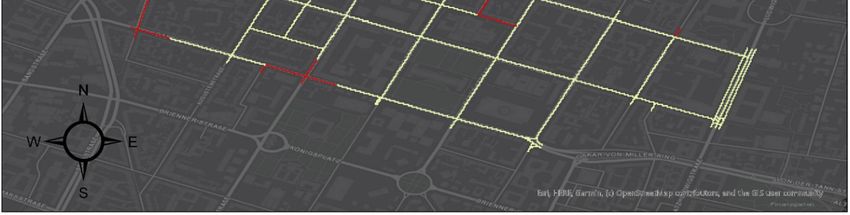
Sustainability2021,
Sustainability 13,428
2021,13, x FOR PEER REVIEW 55ofof14
14
used to achieve the same end product. In the case of GIS-based visualization of bikeability,
used to achieve the same end product. In the case of GIS-based visualization of bikeability,
there is the possibility of targeting selected locations within an investigation area where
there is the possibility of targeting selected locations within an investigation area where
changes in bikeablity might be expected. This can be introduced by extracting local
changes in bikeablity might be expected. This can be introduced by extracting local
knowledge or via spatial analysis results when selected bikeability-related measures are be-
knowledge or via spatial analysis results when selected bikeability-related measures are
ing compared with their spatial distributions. In the case that information regarding bicycle
being compared with their spatial distributions. In the case that information regarding
friendliness
bicycle for a spatially
friendliness defineddefined
for a spatially administrative area is area
administrative available, a potential
is available, data analyst
a potential data
analyst might introduce specific measures or weightings for all spatial units ofThis
might introduce specific measures or weightings for all spatial units of this area. thismeans
area.
that means
This the input thatinformation
the input for estimatingfor
information bikeability
estimating willbikeability
be introduced
will in
begreat detail, not
introduced in
on a local level but on a contentual level. Taking this into account,
great detail, not on a local level but on a contentual level. Taking this into account, it is important to focus
it is
on the road
important to segment
focus on therepresentations
road segmentofrepresentations
available transport networks,
of available as additional
transport networks,public
as
survey data may be associated with road elements with longer polyline
additional public survey data may be associated with road elements with longer polyline segments that, then,
may result
segments in altering
that, then, may information representation.
result in altering informationA common case of A
representation. generating
common falsified
case of
information attached to road segments could occur from the analysts
generating falsified information attached to road segments could occur from the analysts by by unreasonably
matching additional
unreasonably matching information
additionalonto road segments.
information Thissegments.
onto road possibilityThis
could be an important
possibility could
bikeablity index estimation design factor, as available literature
be an important bikeablity index estimation design factor, as available literature reveals the more frequent
reveals the
appearance
more frequent ofappearance
city-based of and grid-based
city-based andbikebility
grid-based indices over indices
bikebility those with
over athose
networked-
with a
based bikeablity indices.
networked-based bikeablityAn indices.
overview Anofoverview
four methodologies found within
of four methodologies a literature
found withinre-a
view is shown
literature reviewinisFigure
shown1,inwhereFigurethe generalthe
1, where types of factors
general types are divided
of factors are(red and green
divided (red
arrows),
and greenand whether
arrows), andthe index isthe
whether a city-
indexorisgrid-based index is also
a city- or grid-based indicated.
index is also indicated.
Factors
Hard Hard & Soft
Technical Gathering of Public Gathering of
Technical Public
Analysis information Survey information
Analysis Survey
Resolution Resolution Resolution Resolution
Grid- City- City- City- Grid- City-
based based based based based based
Accessibility Copenhagenize ADAC
Index Fahrradklimatest
Yes No
Bikeability Index
Lowry et al. (2012)
Dresden
.
Figure 1. Classification of selected bikeability indices (own depiction).
Figure 1. Classification of selected bikeability indices (own depiction).
The purpose of Figure 1 is to validate a pattern of the bikeability index literature
The purpose of Figure 1 is to validate a pattern of the bikeability index literature clas-
classification. Therefore, the presented bikeability and bicycle friendliness indices are
categorizedTherefore,
sification. followingthe presented
their bikeability
theoretical approachand bicycle
in the friendliness
diagram in Figure indices
1. are catego-
rizedThe
following their theoretical approach in the diagram in Figure 1.
resolution of a grid-based index is scalable if the underlying data is sufficient,
thus, it canresolution
The of aaverage
also deliver grid-based index
values forisdistricts
scalableofifthe
thewhole
underlying data
city, not is the
just sufficient, thus,
single grid
it canAn
cells. also deliver
index thataverage values for
only evaluates districts
hard factors ofsuch
the whole city, not justand
as infrastructure thebicycle
single grid cells.
facilities
An index that only evaluates
via public survey could not be found. hard factors such as infrastructure and bicycle facilities via
public survey could not be found.
In addition to the above-mentioned approaches, there are approaches for calculating a
cyclingIn comfort
additionindex
to the using
above-mentioned
data gatheredapproaches,
from tracked therebicycles
are approaches
equipped forwith
calculating
variousa
sensors, such as by Zhu and Zhu [44]. This shows the numerous possibilities of howsen-
cycling comfort index using data gathered from tracked bicycles equipped with various to
sors, suchon
elaborate as by Zhu and
different Zhu [44]. This
influencing shows
factors the numerous
coming from staticpossibilities
and dynamic of howdatato elaborate
sources.
on different
For example,influencing
Gholamialam factors coming from
and Matisziw [45]static
used and dynamic data sources.
origin-destination For example,
pairs of cycling trips
Gholamialam and Matisziw [45] used origin-destination
for assigning zones and paths of varying bikeability. pairs of cycling trips for assigning
zones and paths of varying bikeability.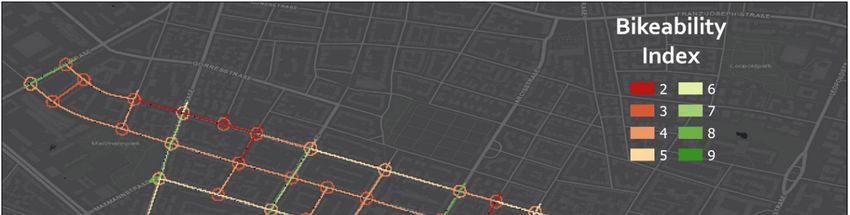
Sustainability 2021, 13, 428 6 of 14
Sustainability 2021, 13, x FOR PEER REVIEW 6 of 14
3. Case Study in Munich, Germany
3. In this
Case section,
Study a part of
in Munich, a district in the inner city of Munich, Germany, is analyzed
Germany
regardingIn this section, a part of a on
its bikeability based the following
district in the innerfour
city factors:
of Munich, Germany, is analyzed
1. Existence
regarding and type of
its bikeability bikeon
based path;
the following four factors:
2. 1. Speed limit;and type of bike path;
Existence
3. 2. Parking facilities for bicycles;
Speed limit;
4. 3. Quality
Parkingoffacilities
intersection infrastructure for bicycles.
for bicycles;
4. The
Quality of intersection infrastructure
creation of this index is solely based for bicycles.
on our own field assessment and mapping
The creation
of the testing of this
ground. Weindex
used isa solely based onor
GIS software our own field methodologies
GIS-based assessment and mapping
to process the
of the testing
available ground.
data and We useda amap
developed GIS software
product orofGIS-based
visualizedmethodologies
bikeability. to process the
available data and developed a map product of visualized bikeability.
3.1. The Investigation Area for Testing Bikeability Estimation
3.1. The Investigation Area for Testing Bikeability Estimation
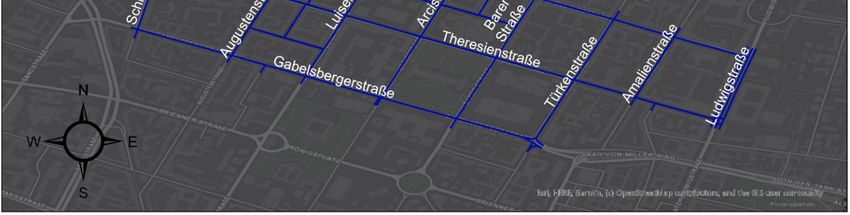
The investigation area is pictured in Figure 2 and is part of the densely structured
The investigation area is pictured in Figure 2 and is part of the densely structured
road network of the Munich city district Maxvorstadt with three major roads in west-east
road network of the Munich city district Maxvorstadt with three major roads in west-east
directions. Additionally,
directions. Additionally,these roadsegments
these road segmentsinin thethe center
center of Munich,
of Munich, Germany,
Germany, connect
connect
three
three universities, i.e., Schelling-, Theresien-, and Gabelsbergerstraße. It can be stated that that
universities, i.e., Schelling-, Theresien-, and Gabelsbergerstraße. It can be stated
these locations
these locationsare
arecharacterized
characterized by bycommuting
commuting cyclists,
cyclists, especially
especially during
during the daytime
the daytime in in
summer
summer seasons.
seasons.
Figure
Figure 2. Investigationarea
2. Investigation area in
in Maxvorstadt,
Maxvorstadt, Munich,
Munich,Germany.
Germany.
TheThe reason
reason forselecting
for selecting this
this particular
particulararea
areainin
Munich is based
Munich on the
is based onassessed local local
the assessed
knowledge, the available geodata, and our own field assessment that we have a low con-
knowledge, the available geodata, and our own field assessment that we have a low
centration of implemented bicycle infrastructure in this area as compared with most other
concentration of implemented bicycle infrastructure in this area as compared with most
parts of Munich. Numerous bike lanes are only present at parts of the selected roads in
other parts of Munich. Numerous bike lanes are only present at parts of the selected roads
the map view in Figure 2. Additionally, bike paths are only available at a few of these
in the map
roads. In view in Figure only
our expectation, 2. Additionally,
a few roads inbike paths
Munich areaonly
have available at
low bikeability a few
index, as of
in these
roads. In our expectation, only a few roads in Munich have a low bikeability
this area pictured in Figure 2. There are numerous segments indicating mixed traffic index, as
in this area
modes, pictured
whereas the in
restFigure 2. There
of Munich are additional
has often numerousbicycle
segments indicating mixed traffic
infrastructure.
modes, whereas the rest of Munich has often additional bicycle infrastructure.
3.2. Methodological Approach
3.2. Methodological Approach
The above street grid was procured from maps based on Open Street Map (OSM)
data
The[46]. Although
above streetthe OSM
grid data
was extracts contained
procured from mapsdatabased
layerson
that categorized
Open Street streets,
Map (OSM)
databike paths,
[46]. and bicycle
Although parking,
the OSM dataafter first visual
extracts analyses,
contained datathose
layerswere
thatnot complete or
categorized streets,
bikecategorized
paths, and consistently. Therefore,
bicycle parking, as previously
after first visualmentioned,
analyses, we reviewed
those the complete
were not testing or
categorized consistently. Therefore, as previously mentioned, we reviewed the testing
ground, categorized the existing infrastructure, and created evaluation scales for the
criteria.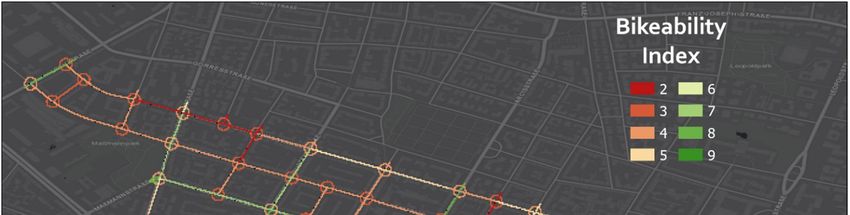
Sustainability 2021, 13, 428                                                                                            7 of 14

                                     The basis for the categorization and how the scores were determined came mainly
                               from field observations and interviews or questionnaires from commuters at selected study
                               areas. Because, in our approach, statistically significant outcomes from the conducted
                               interviews are difficult to infer, we focus on obtaining qualitative data from persons with
                               an extensive local knowledge of the investigation area. This guarantees that our method
                               is applicable within other investigation areas by interviewing commuting cyclists with
                               a local knowledge of the respective investigation area. Dependent on this, we assumed
                               representative abilities of this group of interviewees for evaluating and classifying attributes
                               of the perceived bikeability.
                                     Within the conducted interviews, several aspects of bikeability were defined as prese-
                               lected with the purpose of performing an attribute weighting by interviewees experienced
                               in cycling at the inspected investigation area (interviewees with extensive local knowledge).
                               This is a qualitative data acquisition procedure that aims at focusing on the needs of local
                               cyclists only. The last question for every interviewee was to complete missing aspects of the
                               factors influencing local bikeability, referring to missing and not listed attributes. It should
                               be stated that the procedure of conducting the interviews could be altered or improved,
                               which would significantly impact the actual defined scores.
                                     As attributes are only weighted by the answers of interviewees who are very familiar
                               with the investigation area, we expected a broad knowledge of the influencing factors
                               during cycling and the experienced traffic situations related to these factors. Therefore, the
                               weighting of the attributes by active cyclists was considered to be the most detailed from
                               the view of a cycling road user. However, individual experience could be influenced by the
                               qualitative comparison to the surrounding areas. Therefore, we conducted interviews with
                               commuters who had their trip origins or destinations in the selected investigation areas.
                                     Depending on the factors being associated by most commuters, we define four basic
                               layers (bike paths, speed limit, bicycle parking, and intersections) and enrich road network
                               representations with information on the respective criterion. The street segments of the
                               first three layers receive attributes with an integer value between 1 and 10, the fourth
                               layer (intersections) is a point-by-point assessment, as it is not referring to the whole street
                               network. The evaluation scales for the different criteria are listed in the appendix.
                                     Bicycle infrastructure, such as constructional separated bike paths, appears to be the
                               most fundamental criteria in most indexes for both safety and safety perception. A speed
                               limit is elemental as well for bikeability, as safety is increased because of the breaking dis-
                               tance. In addition, noise exposure decreases with lower speeds, which can be fundamental
                               for the perceived safety of cyclists [47]. Bicycle parking is crucial in order to safely store
                               bikes from theft and weather if possible. Depending on the number of parking spots, the
                               sphere of influence was sized accordingly. Evaluations of intersections are rarely found
                               in bikeability indices, nonetheless it is highly important as, especially, turning maneuvers
                               pose a greater risk for accidents (especially left turns), and thus designated infrastructure
                               that prioritizes cyclists increases their safety [48].
                                     Subsequently, we transferred separate layers to raster data with a conversion function
                               of converting polylines into raster cells with a resolution of 1 m. This step originated from
                               the aim to address different spatial scales via aggregation methodologies for raster data.
                               Additionally, we introduced this disaggregation step for future attempts to incorporate
                               additional bikebility factors on a higher spatial resolution scale, where we could incorporate
                               locations of static and partially dynamic objects, for example, those related to construction
                               sites as delineator posts. This means that we disaggregate due to incorporating surface areas
                               with a 1 m cell resolution that might be classified as potential obstacles for cyclists. These
                               could also be related to partially dynamic phenomena such as parked cars on infrastructure
                               assigned for cyclists. As a result of this conversion step, then, the quality of every street
                               segment could be visualized for each criterion independent of the shape of a certain road
                               segment. For the actual bikeability index, we conducted a weighted overlay analysis
                               comparable to the implementation of Mayfield et al. [49] and left it open as to how this
                               weighted overlay could be adjusted. As we focused on evaluating the weighting schemes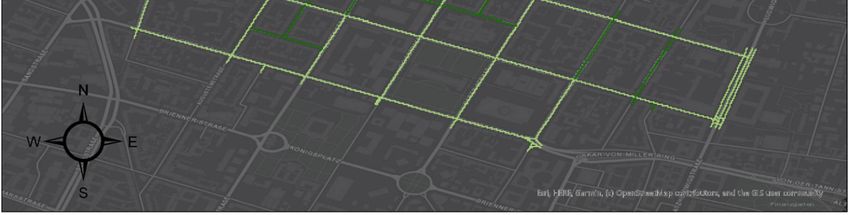
Sustainability 2021, 13, x FOR PEER REVIEW 8 of 14
Sustainability 2021, 13, 428 8 of 14
shape of a certain road segment. For the actual bikeability index, we conducted a weighted
overlay analysis comparable to the implementation of Mayfield et al. [49] and left it open
as to how this weighted overlay could be adjusted. As we focused on evaluating the
weighting schemes based on short interviews or questionnaires with the views of com-
based on short interviews or questionnaires with the views of commuters and predefined
muters and predefined map views with varying weighting schemes, we left this part of
map views with varying weighting schemes, we left this part of the methodology open for
the methodology open for multiple possible weighting options depending on the availa-
multiple
ble data.possible weighting options depending on the available data.
TheThedistributions
distributions of
of the finalscores
the final scoresandandthe
the score
score differences
differences of each
of each attribute
attribute are a are a
result
result of the conducted interviews with experienced cyclists with local knowledge. The The
of the conducted interviews with experienced cyclists with local knowledge.
interviewees
intervieweesranked
rankedeach
each attribute usingnumerical
attribute using numerical values
values fromfrom
1 to 110,
toand
10, this
andranking
this ranking
mostly
mostly resulted
resultedfrom
froman
anaverage receivedanswers.
average of received answers.AsAs a result,
a result, a speed
a speed limitlimit
of 50of 50 km/h
km/h
(7) (7)
hashas a higherrank
a higher rankthan
than the
the presence
presenceofofboth-sided
both-sidedbike lanes
bike (6). (6).
lanes It should be state
It should be that
state that
thisthis is investigation-areaspecific
is investigation-area specificand
andcould
couldvary
varywith
with every
every built
built environment,
environment, the these-
selected
lected interviewees,
interviewees, and theirand their present
present local knowledge.
local knowledge.
AsAs anan outcome,we
outcome, we represented
represented the theraster
rasterdata with
data varying
with significances
varying in different
significances in different
map views, which are explained in the following subsection.
map views, which are explained in the following subsection.
3.3.3.3. Inspected Parameters and Resulting Map Views
Inspected Parameters and Resulting Map Views
The visually inspected parameters for the Munich bikeability index within resulting
The visually inspected parameters for the Munich bikeability index within resulting
map views are shown in Figures 3–6. The evaluation scales are explained in Appendix
map views
Tables are shown in Figures 3–6. The evaluation scales are explained in Tables A1–A4.
A1–A4.
Sustainability 2021, 13, x FOR PEER REVIEW 9 of 14
Figure
Figure 3.3.Evaluation
Evaluation of
of bicycle
bicycleinfrastructure.
infrastructure.
Figure4.4.Evaluation
Figure Evaluation of
ofspeed
speedlimits.
limits.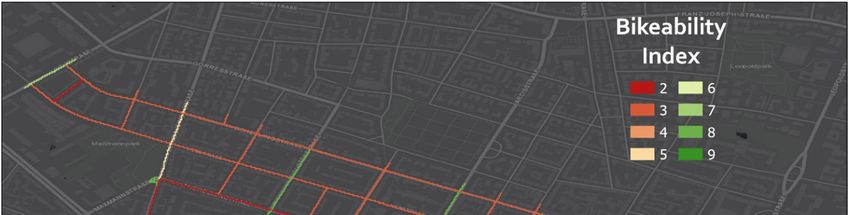
Sustainability 2021, 13, 428                                                                                            9 of 14

                                                 Figure 4. Evaluation of speed limits.

Sustainability 2021, 13, x FOR PEER REVIEW
                                                                                                                    . 10 of 14
                                               Figure 5. Evaluation
                                               Figure 5. Evaluation of
                                                                    of bicycle
                                                                       bicycle parking.
                                                                               parking.

                                        As we focused only on the intersections in Figure 6, we incorporated the value zero,
                                   which is shown in black for all excluded road segments (segments not belonging to inter-
                                   sections).
                                        The weighted overlay of linear criteria was done with 50% bicycle infrastructure, 25%
                                   speed limit, and 25% bicycle parking. We selected these weighting schemes based on in-
                                   terviews conducted with commuting students who were familiar with the investigation
                                   area. The basis of the main evaluation were variations of bikeablity index choropleth
                                   maps, similar to the ones in Figures 3–6. The street network mostly reached a medium
                                   score (visualized in orange and yellow) and only a few segments were rated as good (e.g.,
                                   Ludwig-, Arcis-, and Lothstraße). This outcome was also welcomed by most of the inter-
                                   viewed commuters. Although the number of persons who participated in this question-
                                   naire was comparably low (fewer than 10), we argue that adjusting the weighted overlay
                                   could be part of the proposed methodology. Figure 7 shows the emerging visual pattern
                                   after adding the raster information of intersections.

                                                Figure 6.
                                                Figure 6. Evaluation
                                                          Evaluation of
                                                                     of intersections.
                                                                        intersections.

                                         As we focused only on the intersections in Figure 6, we incorporated the value
                                   zero, which is shown in black for all excluded road segments (segments not belonging to
                                   intersections).
                                         The weighted overlay of linear criteria was done with 50% bicycle infrastructure, 25%
                                   speed limit, and 25% bicycle parking. We selected these weighting schemes based on
                                   interviews conducted with commuting students who were familiar with the investigation
                                   area. The basis of the main evaluation were variations of bikeablity index choropleth
                                   maps, similar to the ones in Figures 3–6. The street network mostly reached a medium
                                   score (visualized in orange and yellow) and only a few segments were rated as good
                                   (e.g., Ludwig-, Arcis-, and Lothstraße). This outcome was also welcomed by most of
                                   the interviewed commuters. Although the number of persons who participated in this
                                   questionnaire was comparably low (fewer than 10), we argue that adjusting the weighted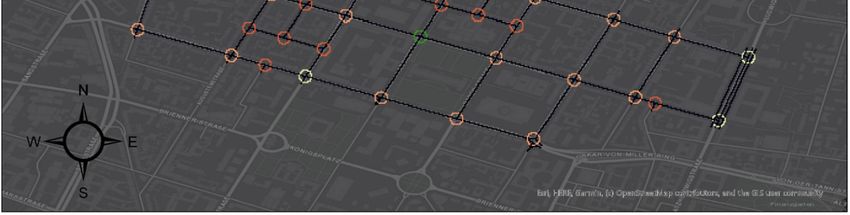
Sustainability 2021, 13, 428                                                                                                  10 of 14

                               overlay could be part of the proposed methodology. Figure 7 shows the emerging visual
                               pattern after Figure
                                             adding6.the raster information
                                                      Evaluation               of intersections.
                                                                 of intersections.

                               Figure
                               Figure 7.
                                      7. Weighted
                                         Weighted overlay
                                                  overlay of
                                                          of linear
                                                             linear segments
                                                                    segments and
                                                                             and intersections.
                                                                                 intersections.

                               4. Discussion
                               4. Discussion
                                     The only segment that scores well in all categories is the Ludwigstraße; the major
                                     The only
                               connection         segment
                                              streets         that scores
                                                      of universities      well in all
                                                                        (Schelling-    categories
                                                                                     and            is the Ludwigstraße;
                                                                                          Theresienstraße)                  the major
                                                                                                              are rated mediocre   ac-
                               connection
                               cording         streets
                                         to this       of The
                                                  index.    universities  (Schelling- isand
                                                                average bikeability      5.1 Theresienstraße)    are rated
                                                                                             and the intersections          mediocre
                                                                                                                      are rated as 3.8
                               according
                               which         to thispoor.
                                       is rather     index. TheThe  average
                                                                 zones  withbikeability   is 5.1infrastructure
                                                                               a good bicycle    and the intersections
                                                                                                                 seem toare   rated
                                                                                                                           have     as
                                                                                                                                 good
                               3.8 which    is rather  poor.   The  zones  with  a good  bicycle
                               bikeability overall, i.e., a weighting of 50% becomes apparent.    infrastructure  seem  to have  good
                               bikeability    overall,
                                     This index    has i.e., a weighting
                                                       its strengths       of 50%
                                                                      as well      becomes apparent.
                                                                               as weaknesses.   Intersections are scarcely regarded
                                     This  index   has  its strengths as  well  as weaknesses.
                               in other indices, yet they are crucial for safety. Furthermore,   Intersections  are scarcely
                                                                                                       the independent       regarded
                                                                                                                         gathering  of
                               in other  indices,   yet  they  are crucial for safety. Furthermore,    the independent
                               data is very accurate and done by only one person, and therefore with the same standard.  gathering  of
                               data is very accurate and done by only one person, and therefore with the same standard.
                               In particular, the bicycle parking spots in the original data source (OSM) were fragmen-
                               In particular, the bicycle parking spots in the original data source (OSM) were fragmentarily
                               tarily recorded. The division of the street network is very detailed, and therefore attribute
                               recorded. The division of the street network is very detailed, and therefore attribute values
                               values do not change within one segment. Another benefit is the simplicity of the calcula-
                               do not change within one segment. Another benefit is the simplicity of the calculations.
                               tions. With only three weighted factors, the calculation can be quickly done as soon as the
                               With only three weighted factors, the calculation can be quickly done as soon as the data is
                               data is available.
                               available.
                                     A disadvantage, however, is that the traffic load is not part of the index. In the case
                               that it is weak, a missing bike path or lane would be less important. Especially shorter
                               streets in living areas would achieve a better overall rating and the contrary would account
                               for longer streets. Another downside is that the field analysis methodology is independent
                               from currentness and quality of geodata, however, it requires significant effort to generate
                               the data. For larger areas, the time investment would increase exponentially.
                                     The map serves as a quick overview of bikeability in part of Munich and shows
                               clearly that the connecting streets between the universities have insufficient bikeability,
                               considering that especially students show great bike affinity. One measure might be to
                               increase the number of junctions with traffic lights and biking boxes or, for example, extend
                               the bike lane in the Gabelsbergerstraße, which abruptly ends, when this one-way street
                               changes from two to three lanes.

                               5. Conclusions and Outlook
                                    Indices for bikeability can normally be divided into four groups, key feature is the
                               differentiation in models with hard infrastructure factors and those with hard and sup-
considering that especially students show great bike affinity. One measure might be to
increase the number of junctions with traffic lights and biking boxes or, for example, ex-
tend the bike lane in the Gabelsbergerstraße, which abruptly ends, when this one-way
street changes from two to three lanes.
Sustainability 2021, 13, 428 11 of 14
5. Conclusions and Outlook
Indices for bikeability can normally be divided into four groups, key feature is the
differentiation in models with hard infrastructure factors and those with hard and sup-
plementary factors
plementary factors and
and whether
whether itit is
is aa technical
technical analysis
analysis oror public
public survey
survey toto gather
gather data.
data.
Authors select
select criteria
criteria according
accordingtotothe therespective
respectivetopography
topographyofof the
thetesting ground,
testing ground,aim of
aim
thethe
of study,
study,and personal
and personalperception
perception of the criteria’s
of the importance.
criteria’s importance.
The assessment
The assessmentof ofthe
thetesting
testingarea
areaininMunich
Munichshowed
showeda serious
a serious lack
lack ofof suitable
suitable bicy-
bicycle
cle infrastructure. The fact that some one-way streets are not open to
infrastructure. The fact that some one-way streets are not open to cyclist encourages car cyclist encourages
car drivers
drivers to drive
to drive fast fast
and and
also also
means means detours
detours for cyclists,
for cyclists, reducing
reducing the accessibility
the accessibility of
of des-
destinations.
tinations. On theOnupside,
the upside, thecouncil
the city city council has approved
has approved the removal
the removal of the of the one-way
one-way street
street regulation
regulation in the in the Theresien
Theresien and Gabelsbergerstraße
and Gabelsbergerstraße andbuilding
and the the building of bicycle
of bicycle infras-
infrastruc-
tructure in the Gabelsbergerstraße [50]. This would increase the bikeability
ture in the Gabelsbergerstraße [50]. This would increase the bikeability significantly from significantly
fromto5.08
5.08 to in
5.43, 5.43,
theincase
the that
case all
thatone-way
all one-way segments
segments werewere revoked,
revoked, andand bikebike lanes
lanes were were
in-
installed. A resulting map view would look like that
stalled. A resulting map view would look like that shown in Figure 8.shown in Figure 8.
Figure 8. Weighted
Figure overlay
8. Weighted of linear
overlay components
of linear incorporating
components measures
incorporating in Theresien
measures and Gabelsbergerstraße.
in Theresien and Gabelsbergerstraße.
Regarding bicycle
Regarding bicycle parking,
parking,there
thereisisroom
roomfor
forimprovement
improvementthat should
that shouldbebe
exploited.
exploited.A
general lack of cycle racks is apparent, and roofed or sheltered racks are nonexistent.
A general lack of cycle racks is apparent, and roofed or sheltered racks are nonexistent. In
particular, people who own new or expensive bikes would not use them during inclement
weather. InInorder
ordertoto ease
ease traffic
traffic situations
situations with
with frequent
frequent congestions
congestions and and to motivate
to motivate peo-
people
ple to resort
to resort to bicycles
to bicycles for everyday
for everyday routes,routes, incentives
incentives must bemust be created.
created. This canThis can
be done
be done by increasing safety through implementing physical separation of bike paths
and motorized transport paths, opening one-way streets for cyclists to reduce detours,
and actively promoting cycling on a political level. Consequently, people would tend to
prioritize using bicycles rather than cars and everyone would benefit from better air quality
and individual health-related advantages of cycling.
Author Contributions: Conceptualization, J.S.-Q., A.K. and G.G.; methodology, J.S.-Q. and A.K.;
formal analysis, J.S.-Q.; resources, J.S.-Q. and A.K.; data curation, J.S.-Q.; writing—original draft
preparation, J.S.-Q.; writing—review and editing, J.S.-Q., A.K. and G.G.; visualization, J.S.-Q. and
A.K.; supervision, A.K. and G.G. All authors have read and agreed to the published version of the
manuscript.
Funding: This work is a result of the research project @CITY Automated Cars and Intelligent Traffic
in the City. The project is supported by the Federal Ministry for Economic Affairs and Energy (BMWi),
based on a decision taken by the German Bundestag, grant number 19A17015B. The author is solely
responsible for the content of this publication.
Institutional Review Board Statement: Not applicable for this study.Sustainability 2021, 13, 428 12 of 14
Informed Consent Statement: Not applicable for this study.
Data Availability Statement: The input data in this research can be accessed freely from online
sources.
Acknowledgments: The authors gratefully acknowledge the comments and suggestions of the
anonymous reviewers, which helped to improve the manuscript.
Conflicts of Interest: The authors declare no conflict of interest. The funders had no role in the design
of the study; in the collection, analyses, or interpretation of data; in the writing of the manuscript, or
in the decision to publish the results.
Appendix A Evaluation Scales (Cursive Combination Not Present in the Testing Area)
Table A1. Bicycle infrastructure.
Type of Street or Cycling Abbreviation in
Value (1–10)
Infrastructure Attribute Table
Broad bike path, both-sided RWb 10
Broad and narrow bike path RWb_RWs 9
Narrow bike path, both-sided RWs 8
Cycling street FS 7
Narrow bike path and bike lane RWs_RS 7
Bike lane, both-sided RS 6
Advisory bike lane, both-sided SSt 5
Regular street None 3
One-way street, open EBo 3
One-way street with advisory bike lane EB_RS 3
Table A2. Speed limit.
Maximum Speed Value (1–10)
30 km/h 10
50 km/h 7
Table A3. Bicycle parking.
Type of Parking Facility Value (1–10)
Bike Locker 10
Roofed bike rack 8
Regular bike rack 6
No bike rack 2
Table A4. Intersections.
Abbreviation in Attribute
Type of Intersection Value (1–10)
Table
Traffic light width biking box BB 9
Designated cycling traffic
FA 6
light
Traffic light with visual
LSA_M 6
markers on the ground
Regular traffic light LSA 3
Regular intersection without
none 3
traffic lightsSustainability 2021, 13, 428 13 of 14
References
1. Karanikola, P.; Panagopoulos, T.; Tampakis, S.; Tsantopoulos, G. Cycling as a smart and green mode of transport in small touristic
cities. Sustainability 2018, 10, 268. [CrossRef]
2. Faghih-Imani, A.; Anowar, S.; Miller, E.J.; Eluru, N. Hail a cab or ride a bike? A travel time comparison of taxi and bicycle-sharing
systems in New York City. Transp. Res. Part A Policy Pract. 2017, 101, 11–21. [CrossRef]
3. Horton, D. Environmentalism and the bicycle. Environ. Politics 2006, 15, 41–58. [CrossRef]
4. Christensen, H.R. Is the Kingdom of bicycles rising again? Cycling, gender, and class in postsocialist China. Transfers 2017, 7,
1–20. [CrossRef]
5. De Nazelle, A.; Nieuwenhuijsen, M.J.; Antó, J.M.; Brauer, M.; Briggs, D.; Braun-Fahrlander, C.; Cavill, N.; Cooper, A.R.;
Desqueyroux, H.; Fruin, S. Improving health through policies that promote active travel: A review of evidence to support
integrated health impact assessment. Environ. Int. 2011, 37, 766–777. [CrossRef] [PubMed]
6. Pucher, J.; Buehler, R. Making cycling irresistible: Lessons from the Netherlands, Denmark and Germany. Transp. Rev. 2008, 28,
495–528. [CrossRef]
7. Lee, J.-S.; Jiang, J.-W. Enhanced fuzzy-logic-based power-assisted control with user-adaptive systems for human-electric bikes.
IET Intell. Transp. Syst. 2019, 13, 1492–1498. [CrossRef]
8. Gössling, S. Urban transport justice. J. Transp. Geogr. 2016, 54, 1–9. [CrossRef]
9. Rietveld, P. Biking and Walking: The Position of Non-Motorized Transport Modes in Transport Systems. In Handbook of Transport
Systems and Traffic Control; Button, K.J., Hensher, D.A., Eds.; Emerald Group Publishing Limited: Bingley, UK, 2001.
10. Hoedl, S.; Titze, S.; Oja, P. The bikeability and walkability evaluation table: Reliability and application. Am. J. Prev. Med. 2010, 39,
457–459. [CrossRef]
11. Winters, M.; Teschke, K.; Brauer, M.; Fuller, D. Bike Score® : Associations between urban bikeability and cycling behavior in 24
cities. Int. J. Behav. Nutr. Phys. Act. 2016, 13, 18. [CrossRef]
12. Krenn, P.J.; Oja, P.; Titze, S. Development of a bikeability index to assess the bicycle-friendliness of urban environments. Open J.
Civ. Eng. 2015, 5, 451. [CrossRef]
13. Merriam-Webster.com. Available online: https://www.merriam-webster.com/dictionary/bikeability (accessed on 31 March
2019).
14. Oxforddictionaries.com. Available online: https://en.oxforddictionaries.com/definition/bikeable (accessed on 31 March 2019).
15. Lowry, M.B.; Callister, D.; Gresham, M.; Moore, B. Assessment of communitywide bikeability with bicycle level of service. Transp.
Res. Rec. 2012, 2314, 41–48. [CrossRef]
16. Festa, D.C.; Forciniti, C. Attitude towards bike use in Rende, a small town in south Italy. Sustainability 2019, 11, 2703. [CrossRef]
17. Mora, R.; Moran, P. Public Bike Sharing Programs under the Prism of Urban Planning Officials: The Case of Santiago de Chile.
Sustainability 2020, 12, 5720. [CrossRef]
18. Shaaban, K. Why Don’t People Ride Bicycles in High-Income Developing Countries, and Can Bike-Sharing Be the Solution? The
Case of Qatar. Sustainability 2020, 12, 1693. [CrossRef]
19. Nielsen, T.A.S.; Skov-Petersen, H. Bikeability—Urban structures supporting cycling. Effects of local, urban and regional scale
urban form factors on cycling from home and workplace locations in Denmark. J. Transp. Geogr. 2018, 69, 36–44. [CrossRef]
20. Di Mascio, P.; Fusco, G.; Grappasonni, G.; Moretti, L.; Ragnoli, A. Geometrical and functional criteria as a methodological
approach to implement a new cycle path in an existing urban road network: A case study in Rome. Sustainability 2018, 10, 2951.
[CrossRef]
21. Shui, C.; Chan, W. Optimization of a bikeway network with selective nodes. Sustainability 2019, 11, 6531. [CrossRef]
22. Keler, A.; Schmiedlau, F.; Grigoropoulos, G. Evaluating bicycle traffic efficiency using bicycle traffic counts at sparse locations in
cities-comparing NYC with Munich. In Proceedings of the GISRUK 2020-28th GIS Research UK Conference, London, UK, 21–23
June 2020.
23. Lin, S.-J.; Shyu, G.-S.; Fang, W.-T.; Cheng, B.-Y. Using multivariate statistical methods to analyze high-quality bicycle path service
systems: A case study of popular bicycle paths in Taiwan. Sustainability 2020, 12, 7185. [CrossRef]
24. Ryu, S. A Bicycle Origin–Destination Matrix Estimation Based on a Two-Stage Procedure. Sustainability 2020, 12, 2951. [CrossRef]
25. Hardinghaus, M.; Papantoniou, P. Evaluating Cyclists’ Route Preferences with Respect to Infrastructure. Sustainability 2020, 12,
3375. [CrossRef]
26. Yao, Y.; Zhang, Y.; Tian, L.; Zhou, N.; Li, Z.; Wang, M. Analysis of Network Structure of Urban Bike-Sharing System: A Case
Study Based on Real-Time Data of a Public Bicycle System. Sustainability 2019, 11, 5425. [CrossRef]
27. Boettge, B.; Hall, D.M.; Crawford, T. Assessing the Bicycle Network in St. Louis: A PlaceBased User-Centered Approach.
Sustainability 2017, 9, 241. [CrossRef]
28. Furth, P.G.; Mekuria, M.C.; Nixon, H. Network Connectivity for Low-Stress Bicycling. Transp. Res. Rec. 2016, 2587, 41–49.
[CrossRef]
29. Useche, S.; Montoro, L.; Alonso, F.; Oviedo-Trespalacios, O. Infrastructural and human factors affecting safety outcomes of
cyclists. Sustainability 2018, 10, 299. [CrossRef]
30. Ul-Abdin, Z.; De Winne, P.; De Backer, H. Risk-perception formation considering tangible and non-tangible aspects of cycling: A
flemish case study. Sustainability 2019, 11, 6474. [CrossRef]
31. Shaaban, K.; Abdur-Rouf, K. Assessing Walking and Cycling around Schools. Sustainability 2020, 12, 10607. [CrossRef]Sustainability 2021, 13, 428 14 of 14
32. Vasilev, M.; Pritchard, R.; Jonsson, T. Trialing a Road Lane to Bicycle Path Redesign—Changes in Travel Behavior with a Focus on
Users’ Route and Mode Choice. Sustainability 2018, 10, 4768. [CrossRef]
33. Nikitas, A. How to save bike-sharing: An evidence-based survival toolkit for policy-makers and mobility providers. Sustainability
2019, 11, 3206. [CrossRef]
34. Sun, Y.; Mobasheri, A.; Hu, X.; Wang, W. Investigating impacts of environmental factors on the cycling behavior of bicycle-sharing
users. Sustainability 2017, 9, 1060. [CrossRef]
35. Macioszek, E.; Świerk, P.; Kurek, A. The Bike-Sharing System as an Element of Enhancing Sustainable Mobility—A Case Study
based on a City in Poland. Sustainability 2020, 12, 3285. [CrossRef]
36. Lee, K.; Chae, J.; Kim, J. A courier service with electric bicycles in an Urban Area: The case in Seoul. Sustainability 2019, 11, 1255.
[CrossRef]
37. Copenhagenize_Design_Company. The Copenhagenize Bicycle Friendly Cities Index. 2017. Available online: http:
//copenhagenizeindex.eu/about.html (accessed on 31 March 2019).
38. Kazemzadeh, K.; Laureshyn, A.; Winslott Hiselius, L.; Ronchi, E. Expanding the Scope of the Bicycle Level-of-Service Concept: A
Review of the Literature. Sustainability 2020, 12, 2944. [CrossRef]
39. Adfc.de. ADFC-Fahrradklima-Test. 2018. Available online: https://www.fahrradklima-test.de/ (accessed on 31 March 2019).
40. McHarg, I.L.; History, A.M.O.N. Design with Nature; American Museum of Natural History: New York, NY, USA, 1969.
41. Tomlin, C.D. Map algebra: One perspective. Landsc. Urban Plan. 1994, 30, 3–12. [CrossRef]
42. Gehring, M.S.D.B. Bikeability—Index für Dresden—Wie Fahrradfreundlich ist Dresden? Available online: https://tud.qucosa.
de/api/qucosa%3A30317/attachment/ATT-0/ (accessed on 31 March 2019).
43. Jonietz, D.; Timpf, S. Entwicklung eines GIS-basierten Bikeablity-Index am Beispiel der Stadt Augsburg. In Geoinformatik; Shaker:
Aachen, Germany, 2012; pp. 83–90.
44. Zhu, S.; Zhu, F. Cycling comfort evaluation with instrumented probe bicycle. Transp. Res. Part A Policy Pract. 2019, 129, 217–231.
[CrossRef]
45. Gholamialam, A.; Matisziw, T.C. Modeling bikeability of urban systems. Geogr. Anal. 2019, 51, 73–89. [CrossRef]
46. Geofabrik.de. Available online: https://download.geofabrik.de/europe/germany/bayern/oberbayern.html (accessed on 31
March 2019).
47. Wahlgren, L.; Schantz, P. Bikeability and methodological issues using the active commuting route environment scale (ACRES) in
a metropolitan setting. BMC Med. Res. Methodol. 2011, 11, 6. [CrossRef]
48. Fraser, A. An Empirical Study of Bicyclists’ Turning Behaviour at Signalized Intersections. Master’s Thesis, University of Waterloo,
Waterloo, ON, Canada, 23 August 2018.
49. Mayfield, C.J.; Kumler, M.; Afzalan, N. Automating the Classification of Thematic Rasters for Weighted Overlay Analysis in
GeoPlanner for ArcGIS. Master’s Thesis, University of Redlands, Redlands, CA, USA, February 2016.
50. Kunstareal—Modifizierte Alternative 5 Im 3. Stadtbezirk Maxvorstadt. Available online: https://www.muenchen-transparent.
de/dokumente/3651443 (accessed on 31 March 2019).You can also read