HyperTRIBE uncovers increased MUSASHI-2 RNA binding activity and differential regulation in leukemic stem cells - Nature
←
→
Page content transcription
If your browser does not render page correctly, please read the page content below
ARTICLE
                  https://doi.org/10.1038/s41467-020-15814-8                 OPEN

                  HyperTRIBE uncovers increased MUSASHI-2 RNA
                  binding activity and differential regulation
                  in leukemic stem cells
                  Diu T. T. Nguyen1, Yuheng Lu2,3,7, Karen L. Chu1,4,7, Xuejing Yang1, Sun-Mi Park1, Zi-Ning Choo4,
                  Christopher R. Chin 4, Camila Prieto1, Alexandra Schurer1, Ersilia Barin1, Angela M. Savino1, Saroj Gourkanti1,
                  Payal Patel4, Ly P. Vu5,6, Christina S. Leslie 2 & Michael G. Kharas 1 ✉
1234567890():,;

                  The cell-context dependency for RNA binding proteins (RBPs) mediated control of stem cell
                  fate remains to be defined. Here we adapt the HyperTRIBE method using an RBP fused to a
                  Drosophila RNA editing enzyme (ADAR) to globally map the mRNA targets of the RBP MSI2
                  in mammalian adult normal and malignant stem cells. We reveal a unique MUSASHI-2
                  (MSI2) mRNA binding network in hematopoietic stem cells that changes during transition to
                  multipotent progenitors. Additionally, we discover a significant increase in RNA binding
                  activity of MSI2 in leukemic stem cells compared with normal hematopoietic stem and
                  progenitor cells, resulting in selective regulation of MSI2’s oncogenic targets. This provides a
                  basis for MSI2 increased dependency in leukemia cells compared to normal cells. Moreover,
                  our study provides a way to measure RBP function in rare cells and suggests that RBPs can
                  achieve differential binding activity during cell state transition independent of gene
                  expression.

                  1 MolecularPharmacology Program, Center for Cell Engineering, Center for Stem Cell Biology, Center for Experimental Therapeutics, Center for Hematologic
                  Malignancies, Memorial Sloan Kettering Cancer Center, New York, NY 10065, USA. 2 Computational Biology Program, Memorial Sloan Kettering Cancer
                  Center, New York, NY, USA. 3 Blavatnik Institute of System Biology, Harvard Medical School, Boston, MA 02115, USA. 4 Weill Cornell School of Medical
                  Sciences, New York, NY 10065, USA. 5 Terry Fox Laboratory, British Columbia Cancer Research Centre, Vancouver, BC V5Z 1L3, Canada. 6 Molecular Biology
                  and Biochemistry, Simon Fraser University, Vancouver, BC V5A 1S6, Canada. 7These authors contributed equally: Yuheng Lu, Karen L. Chu.
                  ✉email: kharasm@mskcc.org

                  NATURE COMMUNICATIONS | (2020)11:2026 | https://doi.org/10.1038/s41467-020-15814-8 | www.nature.com/naturecommunications                              1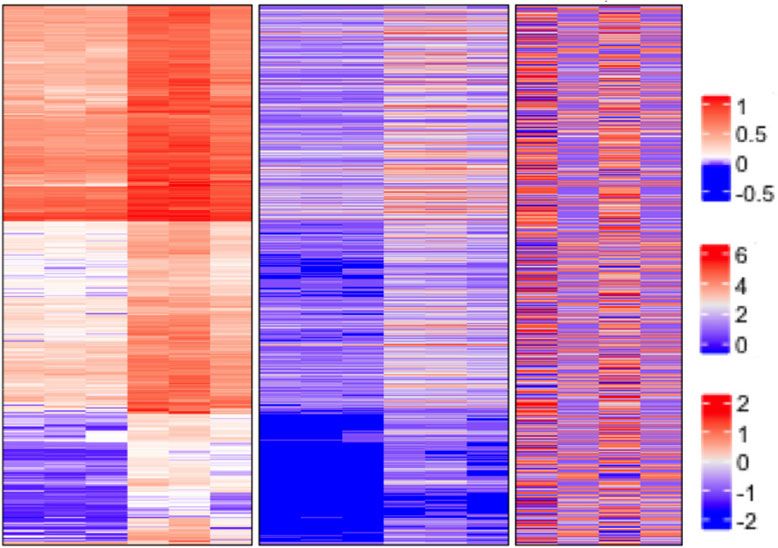
ARTICLE                                                                 NATURE COMMUNICATIONS | https://doi.org/10.1038/s41467-020-15814-8

W
             hile extensive research has revealed the crucial                activity, and demonstrates a strategy to study RBP functions in
             importance of transcriptional regulation, the role for          rare cells.
             post-transcriptional processes in the function of nor-
mal and cancer stem cells remains poorly defined. RNA binding
proteins (RBPs) provide control of mRNA metabolism and                       Results
translation of key regulators that mediate stem cells’ self-renewal          MSI2-HyperTRIBE identifies MSI2 RNA targets in human
and cell fate decisions1,2. Moreover, mutations and aberrant                 cells. HyperTRIBE was originally developed to map RBP targets
expression of RBPs have recently been implicated in multiple                 in Drosophila cells15–17. In order to measure RBP targets in
types of cancer, demonstrating the crucial role for RBPs in                  mammalian cells, we fused the human MSI2 with the catalytic
tumorigenesis3–9. However, whether RBPs may have cell-type                   domain of Drosophila ADAR (MSI2-ADA) carrying the hyper-
specific activity between different cellular states of normal stem            active mutant E488Q previously described to increase editing27.
cell differentiation or between normal and transformed contexts              Codon optimization was performed to maximize the expression
is not known. Understanding cell-specific targets provides a                  of the fusion protein in human cells. To control for the back-
strategy for identifying unique cancer stem cell dependencies                ground editing, we introduced an E367A catalytic dead
compared with normal cells, which is the key to developing new               mutation28,29 in the ADAR domain (MSI2-DCD, Fig. 1a, Sup-
therapies.                                                                   plementary Fig. 1a). Overexpression of MSI2-ADA in the human
   Studying the molecular function of RBPs, as well as their cell-           AML cell line MOLM-13 resulted in a significant increase (over
context dependency, requires the identification of their direct               sixfold) in the number of A->G editing events and edit frequency
RNA targets in each cell type and in specific conditions. Standard            on RNAs compared with the empty vector control (MIG)
approaches have relied heavily on native or cross-link-                      (Fig. 1b, c). Overexpressing the catalytic dead fusion MSI2-DCD
ing immunoprecipitation of RBPs followed by RNA-sequencing.                  did not lead to any increase in edit sites or frequency (Supple-
They have been successfully employed to study RBP targets in                 mentary Fig. 1a, Fig. 1b, c), indicating that MSI2-ADA’s increase
embryonic stem cells, neural stem cells, and iPSCs, which can be             in editing events is specifically due to its deaminase activity. These
obtained in a large number10–14. However, these techniques                   data suggest that we successfully adapted Drosophila Hyper-
remain technically challenging for rare cells with limited input             TRIBE to mammalian RBPs. Importantly, to take into account
material such as adult stem cells. Here, we address a critical gap in        the background editing by these controls, when calculating the
our understanding of RBP targeting in stem cells. We adapted a               actual edit frequency at each site (now referred to as differential
recently developed method, HyperTRIBE15–17 to identify direct                edit frequency or diff.frequency) we subtracted the mean edit
RBP targets in normal hematopoietic stem cells (HSCs) and                    frequency of MSI2-DCD and MIG from the mean edit frequency
leukemia stem cells (LSCs).                                                  of MSI2-ADA.
   In HyperTRIBE, the catalytic domain of the Drosophila ADAR                   We next assessed the reproducibility and the effect of
(Adenosine Deaminase Acting on RNA enzyme) is fused with an                  overexpressing the MSI2-HyperTRIBE fusions on global gene
RBP. This fusion protein leaves a “fingerprint” on the RBP RNA                expression (GE). Pair-wise correlation analysis of three indepen-
targets by marking the binding sites with a nearby A-to-G editing            dent experiments suggests that the edit frequency is highly
event. HyperTRIBE was originally developed in Drosophila15,16                reproducible (Pearson correlation coefficient r > 0.8, Supplemen-
and was not yet proven to work in mammalian systems. We                      tary Fig. 1b–d).
selected MSI2, an RBP previously found to be essential for                      In contrast to CLIP based strategies, we found that the edit
maintaining self-renewal in LSCs and to contribute to normal                 frequency is largely independent of the expression level of the
HSC engraftment and cell fate decisions18–20, to demonstrate the             target mRNAs (Supplementary Fig. 1e). Moreover, MSI2 and the
feasibility and application of HyperTRIBE in mammalian                       fusion overexpression for 48 h did not lead to any major changes
stem cells.                                                                  in the transcriptome of the cells suggesting that forced expression
   In previous studies, MSI2 targets were identified in two inde-             did not alter mRNA target abundance (Supplementary Fig. 1f–h).
pendent AML cell lines (NB4 and K562) using CLIP methods19,21.               Overall these data indicate that the editing activity reflects MSI2
Although these strategies characterized a handful of validated               binding and that it can be used to reliably assess RBP binding.
direct MSI2 mRNA targets, they did not provide a comprehensive                  To assess the accuracy of RNA target identification by the
map of endogenous targets in stem cells nor address cell-type                mammalian HyperTRIBE, we first mapped the binding sites
specific binding activity of MSI2. Furthermore, while Msi2                    to specific genes and compared with CLIP strategies. MSI2-
knockout mice exhibit a modest reduction in blood cells and about            HyperTRIBE identified 2056 target genes marked by 5244 sig-
50% reduction in hematopoietic stem and progenitor cells                     nificant edit sites in the human AML cell line MOLM-13. The
(HSPCs), depletion of MSI2 severely reduced the frequency and                majority of sites (~94%) were located in the 3′UTR region (Fig. 1d,
activity of LSCs in both mouse and human systems. This indicates             Supplementary Data 1), which is consistent with previous
a significantly higher dependency and requirement for MSI2 in                 studies21,30. To determine if MSI2-HyperTRIBE identifies a
LSCs and development of leukemia20,22–26. The cause for this                 preferred binding sequence, we performed a de novo motif search
differential requirement for MSI2 function in LSCs and HSCs is               using 200 bp sequences centered at the edit sites. We identified the
not known.                                                                   known MSI2 binding motif (Fig. 1e) and confirmed that it was
   In this study, we employ our adapted HyperTRIBE approach to               enriched within 250 bp of edit sites (Fig. 1f, Supplementary
investigate the cell-type specific requirement of the RBP MSI2 in             Data 2)31,32. In addition, the editing occurred either on or near
LSCs and normal HSPCs. We first demonstrate that HyperTRIBE                   sites that were directly bound by MSI2 as previously identified by
method efficiently identifies MSI2 mRNA targets in mammalian                   CLIP (Fig. 1f)21. The top 255 genes with the highest differ-
cells. We then globally map MSI2 mRNA binding network in                     ential frequency of at least 0.4 are positively correlated with genes
HSCs and reveal MSI2 targeting program changes during dif-                   upregulated upon MSI2 depletion in four human AML cell lines18
ferentiation into multipotent progenitors (MPPs). Furthermore,               (Fig. 1g). These targets also correspond to the top hits with highest
we find that RNA binding activity of MSI2 significantly increases              number of peaks in our previous MSI2 HITS-CLIP analysis in the
in LSCs compared with normal HSPCs, which results in selective               K562 cell line19, (Supplementary Fig. 1i). Our results demonstrate
regulation of MSI2’s oncogenic targets. Overall, this work sug-              that MSI2-HyperTRIBE efficiently identified direct MSI2 binding
gests that RBPs can achieve cell-context dependent binding                   targets in mammalian cells.

2                NATURE COMMUNICATIONS | (2020)11:2026 | https://doi.org/10.1038/s41467-020-15814-8 | www.nature.com/naturecommunications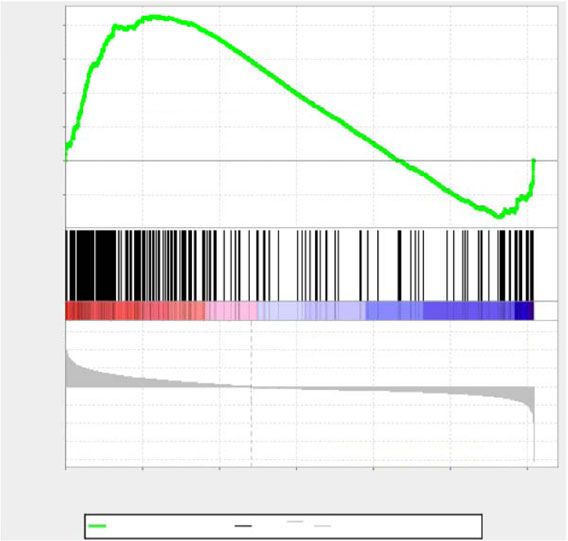
NATURE COMMUNICATIONS | https://doi.org/10.1038/s41467-020-15814-8 ARTICLE
a b c Edit Frequency
MSI2-HyperTRIBE fusions
Edit sites
****
MSI2 ADAR * ****
15,000
1.0
MSI2-ADA *
A I (G) ns
Edit frequency
10,000
Edit sites
MSI2 RNA target
0.5
5000
MSI2 ADAR
MSI2-DCD 0 0.0
A I (G)
IG
D
A
IG
D
A
MSI2 RNA target
C
AD
AD
C
M
M
D
D
2-
2-
2-
2-
SI
SI
SI
SI
M
M
M
M
e MSI2 motif
d Total = 5244 sites in 2056 genes Reference A
HyperTRIBE G
94.03% 3'UTR Edit site
0.61% 5'UTR 100 bp 100 bp
5.36% CDS
De novo Motif Search
p value: 1e-17
Homer motif rank: 2nd
Score: 0.82
f g Top 255 genes found by MSI2-HyperTRIBE
Distance to nearest MOLM-13 motif/NB4 iCLIP peak 0.4
0.015 0.3
Enrichment score (ES)
0.2
0.1
NES 1.84
0.0
0.010
MOLM-13 HyperTRIBE motif FDR < 0.0001
Density
–0.1
NB4 iCLIP peak
0.005
Ranked list metric (PreRanked)
1.5 ‘na_pos’ (positively correlated)
1.0
Ctrl MSI2 knock-down
0.5
0 0.0
Zero cross at 12045
–0.5
–1000 –500 –250 0 250 500 1000 –1.0
–1.5
Distance from edit site (bp) –2.0 ‘na_neg’ (negatively correlated)
0 5000 10,000 15,000 20,000 25,000 30,000
Rank in Ordered Dataset
Enrichment profile Hits Ranking metric scores
Fig. 1 MSI2-HyperTRIBE identifies MSI2’s direct mRNA targets in a human leukemia cell line. a Schematic illustration showing the MSI2 protein fusion
with the catalytic domain of hyperactive ADAR (MSI2-ADA) and the control fusion of MSI2 with the ADAR dead catalytic domain (MSI2-DCD). b Number
of edit sites on mRNAs in MOLM-13 cells overexpressing MSI2-ADA or controls MSI2-DCD and empty vector (MIG). Data as means ± SEM of all the data
points in three independent experiments. Two-tailed unpaired Student t test; *p < 0.05. c Edit frequency on mRNAs in MOLM-13 cells overexpressing
MSI2-ADA or controls MSI2-DCD and empty vector MIG. Only significant edit frequency (adjusted p < 0.05) are plotted. Data as means ± SEM of all the
data points in three independent experiments. Unpaired Mann–Whitney test; ****p < 0.0001. d Total number of MSI2-HyperTRIBE significant edit sites,
target genes, and distribution of sites on the genes in MOLM-13 cells from three HyperTRIBE experiments. e Illustration of selected window size
surrounding edit sites for de novo motif analysis and the results showing enrichment of a consensus sequence that matches previously identified MSI2
motif. f Probability density function (pdf) plot showing the spatial distribution of distance from edit sites to the nearest MSI2 motifs found in d (light blue)
and from edit sites to nearest NB4 iCLIP peak (dark yellow). g GSEA analysis shows that top targets found by MSI2-HyperTRIBE (255 genes with diff.
frequency ≥ 0.4) are enriched among genes that are differentially expressed in MSI2-depleted human AML cell lines compared with controls (data in
Kharas et al.18). y-axis shows enrichment score of the 255 geneset. The black bars on the x-axis show the genes in the MSI2-depleted RNA-seq ranked list,
with log2fc(control/knockdown) value high to low running from left to right. NES normalized enrichment score.
Since multiple sites were found on the same RNA target, we To further rule out the potential of non-specific binding by
looked to see if there was a pattern of clustered binding. To decide MSI2-HyperTRIBE, we performed additional controls using a
on a suitable window size for clustering edit sites, we compared fusion of ADAR with MSI2 lacking RNA binding activity, as well
the enrichment of MSI2 motifs in windows of fixed size around as HyperTRIBE with ADAR domain alone without MSI2. To this
significantly edited sites (true sites) with windows of the same size end, we overexpressed the catalytic domain ADAR alone (ADA
around non-significantly edited sites (background). Using a only) and ADAR fused with MSI2 lacking both RRMs (RNA
Fisher’s test, we determined that ±17 bp is the largest window Recognition Motifs), RRM(del)MSI2-ADA, or with MSI2
such that the motif enrichment was significantly greater around mutated at five amino acids in both RRM domains that are
true sites compared with background. We therefore clustered crucial for RNA binding activity, RRM(mut)MSI2-ADA (Supple-
nearby edit sites falling within this window size and found that mentary Fig. 3a)33. Our analysis found that ADAR alone and the
the majority of clusters (87%) contain only single sites, suggesting mutant fusions have low editing frequency and produce only a
that MSI2 binds RNA and then ADAR edits mainly at these few significant edit sites (52 sites for ADA only, 18 for RRM(del)
discrete sites (Supplementary Fig. 2a, b). Therefore, the majority MSI2-ADA and 20 for RRM(mut)MSI2-ADA) compared with
of MSI2-HyperTRIBE’s edit sites represent MSI2 binding. MSI2-ADA fusion (5244 significant sites) (Supplementary
NATURE COMMUNICATIONS | (2020)11:2026 | https://doi.org/10.1038/s41467-020-15814-8 | www.nature.com/naturecommunications 3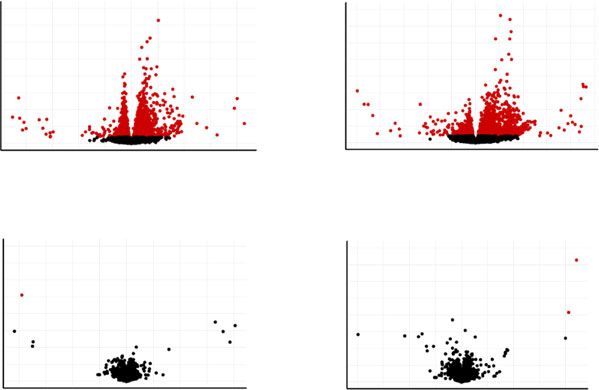
ARTICLE NATURE COMMUNICATIONS | https://doi.org/10.1038/s41467-020-15814-8
a b c
1500 1000
800
1000 600
400
500
200
0 0
d e
Reference A
HyperTRIBE G
MSI2 Motif
Edit site
LT-HSC p value 1e-36, Rank: 1st
100 bp 100 bp
ST-HSC p value 1e-36, Rank: 1st 0.2
p value 1e-27, Rank: 1st
0.1
0
p value 1e-23, Rank: 1st
Homer Motif Search –0.1
f 2
1
0
–1
–2
2
1
0
–1
–2
g h i LT-HSC ST-HSC, MPPs
j
150 LT-HSC WT
0.25
40 40 LT-HSC Msi2 K/O
-log10(p-value)
0.20 ST-HSC, MPPs WT
-log10(p-value)
100
30 30 Msi2 WT ST-HSC, MPPs Msi2 K/O
0.15
20 20 50
0.10
10 10 0.05 Msi2 K/O
0
0 0 0.00
–20 –10 0 10 20 –20 –10 0 10 20 SMAD3 DAPI SMAD3 DAPI LT-HSC ST-HSC, MPPs
10.0 10.0 k l m
LT-HSC ST-HSC, MPPs
0.25
-log10(p-value)
-log10(p-value)
7.5 7.5 100,000 LT-HSC WT
0.20 LT-HSC Msi2 K/O
5.0 5.0
80,000 ST-HSC, MPPs WT
0.15 Msi2 WT
2.5 2.5 ST-HSC, MPPs Msi2 K/O
0.10 60,000
0.0 0.0
–20 –10 0 10 20 –20 –10 0 10 20 0.05 Msi2 K/O 40,000
0.00
20,000
BRCC3 DAPI BRCC3 DAPI
0
LT-HSC ST-HSC, MPPs
Fig. 2 Cell context MSI2 binding during hematopoietic stem cell differentiation. a Schematic illustration of MSI2-HyperTRIBE in HSPCs in vivo. n = 2
independent experiments. b Number of MSI2-HyperTRIBE significant edit sites and their genic distribution in four compartments of HSPCs. c Number of
target genes with sites (described in b) in HSPCs. d De novo motif search showing enrichment of MSI2 motif in all four populations of HSPCs. e Clustering
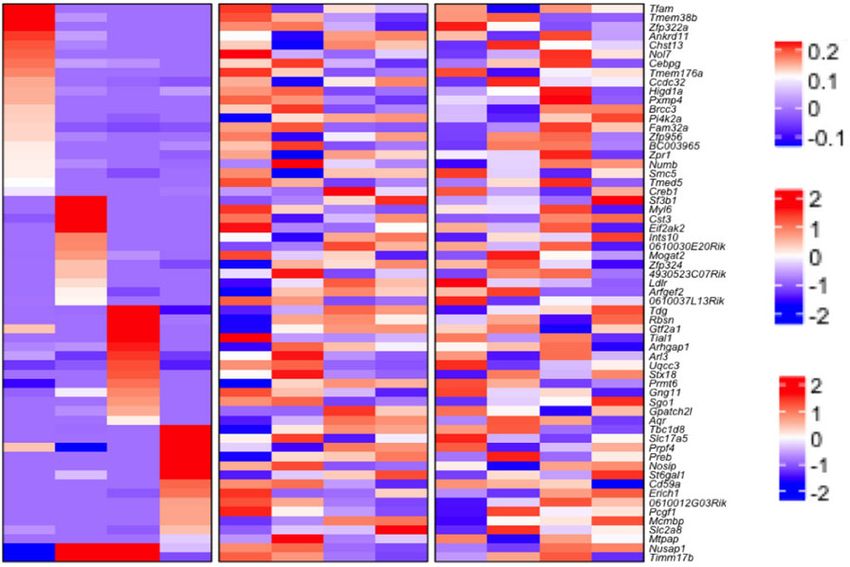
of diff.frequency for target genes across cell types (left panel). Only genes more significantly edited (beta-binomial test) in one cell type versus all others
are plotted. Relative gene expression of each target, in same row order as diff.frequency heatmap, in control cells MIG (middle panel) and for MSI2-ADA
overexpressing cells (right panel). LT:LT-HSC; ST:ST-HSC. f RNA-seq Gene and Drug Signature analysis for MSI2 targets in LT and ST HSCs (LT-unique,
ST-unique and Shared LT-ST) compared with targets in MPPs (MPP2-unique, MPP4 unique and Shared MPP2-MPP4). Asterisks indicate FDR < 0.05.
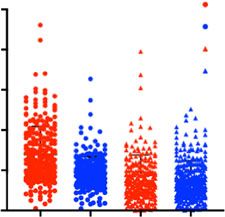
g Differential expression (DEseq2) analysis of MSI2 overexpression in four HSPCs populations. Red dots represent genes with significant differential
expression in MSI2-DCD versus MIG control. h Editing occurs on Smad3 mRNAs at three sites in LT-HSC, 0 sites in ST-HSC and MPP2 and one site in
MPP4. Each bar represents one site. i Representative images of immunofluorescence analysis (IF) showing SMAD3 signal in LT versus ST, MPPs. Scale bar
5 μm. j Quantitation of SMAD3 IF signal from i. n = 125; 45; 130, and 203 cells for LT Msi2 WT; KO; ST, MPPs Msi2 WT and KO, respectively. Data as
mean ± SEM. Unpaired Student t test, ****p < 0.0001. k Editing occurs on Brcc3 mRNAs only in LT-HSC and not in other populations. Each bar represents
one site. l Representative IF images showing BRCC3 signal in LT versus ST and MPPs. Scale bar 5 μm. m Quantitation of BRCC3 IF signal from l in Msi2 WT
and Msi2 K/O. n = 258; 263; 216 and 295 cells for LT Msi2 WT; KO; ST, MPPs Msi2 WT and KO, respectively. Data as mean ± SEM. Unpaired Student
t test, ****p < 0.0001.
Fig. 3b–d). These data indicate that MSI2 and its RRMs provide transplanted these cells into lethally irradiated mice and after they
the cellular binding specificity for ADAR editing. were engrafted, long-term HSCs (LT-HSCs), short-term HSCs
(ST-HSCs), multipotent progenitors MPP2 and MPP4 were iso-
lated, followed by RNA-seq (Fig. 2a, Supplementary Fig. 4a). We
Cell-context dependent RNA binding activity of MSI2 in were able to detect 1273 edit sites in LT-HSCs, 1126 sites in ST-
HSPCs. Given that MSI2 is highly expressed in both HSCs and HSCs, 879 and 862 sites in MPP2s and MPP4s, respectively
MPPs and that loss of MSI2 results in a loss of quiescence and (Fig. 2b). These edit sites represented 856 gene targets in LT-
reduced self-renewal18,19,21, we hypothesized that there could be HSCs, 782 genes in ST-HSCs, 658 genes in MPP2, and 661 in
differential targets in HSCs compared with MPPs. Thus, we tested MPP4 (Fig. 2c, Supplementary Data 1). Furthermore, despite
if HyperTRIBE can be applied to HSCs and MPPs by transducing equivalent expression of the MSI2-HyperTRIBE fusions, we
MSI2-ADA, MSI2-DCD, or empty vector controls into Lin-, observed more edit sites (~1.4–1.5 fold), gene targets (~1.2–1.3
Sca1+, c-Kit+ cells (LSKs) isolated from C57/BJ6 mice. We then fold), and more targets marked with at least two sites in HSCs
4 NATURE COMMUNICATIONS | (2020)11:2026 | https://doi.org/10.1038/s41467-020-15814-8 | www.nature.com/naturecommunications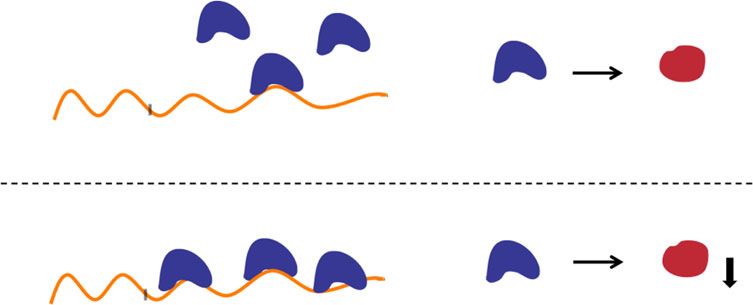
NATURE COMMUNICATIONS | https://doi.org/10.1038/s41467-020-15814-8                                                                 ARTICLE

compared with MPPs (Fig. 2b, c, Supplementary Fig. 4b–d).                       and has reduced protein abundance in HSCs upon Msi2
These data suggest that MSI2 binding activity is modestly                       depletion19. HyperTRIBE identified that MSI2 bound more
increased in HSCs compared with MPPs.                                           efficiently to Smad3 transcripts in LT-HSCs than in ST-HSCs,
   To determine if MSI2’s binding sites were conserved in HSPCs                 MPP2, and MPP4 (Fig. 2h). This corresponded to a decrease in
and if they changed during differentiation, we performed de novo                total SMAD3 and phosphorylated SMAD3 protein in LT-HSCs
motif analysis. Similar to the MOLM-13 cells, the same MSI2                     but not in ST-HSCs and MPPs upon Msi2 knockout (Fig. 2i, j and
motif was found to be the most enriched in all populations                      Supplementary Fig. 5f, g). In addition, among 21 targets that are
(Fig. 2d, Supplementary Data 2). These data confirm that the edit                more significantly edited (shown in the heatmap, Fig. 2e) in LT-
sites marked MSI2 binding sites and demonstrate that Hyper-                     HSCs versus all other populations, Brcc3 or BRCA1/BRCA2
TRIBE can identify an RBP’s RNA targets in limited cell numbers.                containing complex 3, has been reported to be mutated in
   We then investigated if and how the MSI2 binding changed                     myelodysplasia syndrome (MDS) and in de novo AML36,37.
when HSCs differentiated into more committed progenitors.                       These mutations are associated with clonal hematopoiesis, which
Clustering of gene targets by differential edit frequency (diff.                suggests that Brcc3 plays a key functional role in HSCs. Brcc3 is
frequency) across cell types revealed a group of mRNA targets                   uniquely targeted by MSI2 in LT-HSCs but not in more
bound by MSI2 in all four states of HSPCs with no significant                    committed progenitors (Fig. 2k). We therefore chose this
difference in diff.frequency (vs controls) between populations                  candidate for validation as a novel HSC target. Similar to
(beta-binomial test, FDR ≥ 0.1) (Supplementary Fig. 4e). In                     SMAD3, MSI2 depletion led to significant reduction of BRCC3
addition, there are subsets of transcripts that are bound only in               abundance in LT-HSCs but not in ST-HSCs, MPP2s and MPP4s
a specific state (unique groups, Fig. 2e) with diff.frequency (vs                (Fig. 2l, m). Of note, the mRNA level of Smad319 or Brcc3
controls) significantly different in one state compared with all                 (Supplementary Fig. 5h) was unaffected by MSI2 depletion
other states (beta-binomial test, FDR < 0.1; p value < 0.05).                   suggesting that SMAD3 and BRCC3 translation was being
Importantly, we did not observe a similar pattern of mRNA                       controlled specifically in LT-HSCs compared with ST-HSCs and
expression of the targets (middle and right panel, Fig. 2e),                    MPPs. Moreover, LT-HSC have increased BRCC3 protein
suggesting that the majority of differential binding activity at                abundance without a significant difference in expression Brcc3
different states of HSPCs is not simply a consequence of the                    transcript compared with ST-HSCs and MPPs (Fig. 2m and
differential abundance of mRNA transcripts. These data support                  Supplementary Fig. 5i). The equivalent transcript abundance of
the concept that RBP activity and target engagement depends on                  Smad3 was also observed between these two populations
cell states.                                                                    (Supplementary Fig. 5i). Overall, our data indicate that despite
   We then hypothesized that the abundance and target spectrum                  similar abundance of MSI2 and its RNA targets, MSI2 can
could also result in altered biological functions of the shared and             differentially control its targets’ protein abundance during
specific targets in HSCs versus those in MPPs. Thus, we                          hematopoietic differentiation.
performed gene pathway enrichment analysis using the
ENRICHR program34 for targets specific and shared in LT and
ST-HSC versus targets in MPPs (489 vs 298, Supplementary                        Increased MSI2 RNA binding activity in LSCs versus HSPCs.
Figs. 4f, 5a, Supplementary Data 3). We found that HSC targets                  Although MSI2 has been demonstrated to play an important role
are highly enriched for stem cell programs, such as HSCs, MDS                   in both HSPCs and LSCs, it remains unclear why LSCs are more
and LSCs; whereas MPP targets are enriched for lineage-specific                  dependent on MSI2 compared with normal cells. Thus, we
programs, such as macrophages, T cells and B cells (Fig. 2f,                    expressed the MSI2-ADA fusion and controls in LSCs (c-Kithi
Supplementary Fig. 5b, Supplementary Data 3). In addition, gene                 cells) isolated from quaternary MLL-AF9-dsRed mice and normal
ontology (GO molecular functions) analysis indicates that HSC                   HSPCs (LSKs). Our analysis detected over 12,000 sites located in
targets enriches for RNA binding, kinase binding and ubiquitin                  2865 genes in LSKs. Strikingly, we observed 2.5 times more edit
ligase activity whereas MPP targets are involved in RNA polII                   sites (30,701 vs 12,071 sites) and 1.4 times more target genes
coactivator binding (Supplementary Fig. 5c, d, Supplementary                    (4162 vs 2865 genes) in LSCs despite a lower expression of MSI2-
Data 4). These data indicate that MSI2 switches its binding targets             ADA fusion and endogenous MSI2 in LSCs compared with LSKs
away from HSC-related pathways toward differentiation-                          (Fig. 3a, Supplementary Fig. 6a, b). In addition, over 60% of MSI2
associated pathways as the cells differentiate to MPPs.                         targets identified by HyperTRIBE in human leukemia cells are
   Previous studies, using normal and MDS mouse models, found                   conserved in murine leukemia (Supplementary Fig. 6c, Supple-
that inducible overexpression of MSI2 results in the expansion of               mentary Data 1). These data suggest that MSI2 has increased
HSPC populations18,21,23,24,35, but the overexpression impact on                target engagement in leukemia versus normal cells.
specific subsets within the HSPC compartments remains unclear.                      To assess the differences in MSI2 binding in LSCs versus
Thus, we compared the GE profile of MSI2 overexpression                          normal cells, we examined the location of editing, the shared
(MSI2-DCD) to control (MIG) in HSCs and in MPPs. MSI2                           and cell-specific sites. Consistent with our previous results,
overexpression resulted in significant changes in the transcrip-                 almost all the edit sites (~93%) were located in 3′UTR and the
tome in LT and ST HSCs but not in MPPs, suggesting that MSI2                    MSI2 binding motif was the most enriched consensus sequence
impacts HSCs differentially compared with MPPs (Fig. 2g).                       around the edit sites in both LSKs and LSCs (Fig. 3a,
Notably, most of these genes with expression changes were not                   Supplementary Fig. 6d–f, Supplementary Data 1 and 2). The
direct MSI2 targets (~6% 195 out of 2972 differentially expressed               vast majority of sites (nearly 80%) and genes (over 87%)
genes in LT; 113 out of 2047 in ST HSCs) (Supplementary                         marked by MSI2-ADA in LSKs were also found in LSCs, and
Fig. 5e). These results suggest that although HSCs have a modest                the number of targets bound by MSI2 only in LSCs (1656 LSC
increase in MSI2 binding compared with MPPs, it results in a                    unique targets) was approximately five times higher than those
large transcriptional effect. However, this effect is indirect and              bound only in LSKs (359 LSK unique targets) (Fig. 3b,
likely through its small subset of direct binding targets in HSCs.              Supplementary Fig. 6g, Supplementary Data 1). Moreover,
   Our previous study found that MSI2 directly controls TGFB                    there are more edit sites per MSI2 target in LSCs compared
signaling output19. Based on our MSI2 differential binding                      with LSKs (Supplementary Fig. 6h, i) and at the shared sites, we
activity, we examined Smad3, a direct target in the TGFB                        found that they were edited at higher frequency in LSCs than in
signaling pathway that was found by HITS-CLIP in K562 cells                     LSKs (Fig. 3c). These data suggest that despite similar

NATURE COMMUNICATIONS | (2020)11:2026 | https://doi.org/10.1038/s41467-020-15814-8 | www.nature.com/naturecommunications                        5
ARTICLE                                                                               NATURE COMMUNICATIONS | https://doi.org/10.1038/s41467-020-15814-8

     a                               b                      c                                     d                       e
          40,000             5′UTR                              750                                    10

                             CDS                                                                        5
          30,000                                                500
                             3′UTR
                                                                                                        0
          20,000
                                                                250
                                                                                                       –5
          10,000
                                                                    0                                 –10
                                                                        –2   –1   0   1   2
              0

      f
                                                                                                 h                            i

                                                                Z

                   g                               j                                                        k

Fig. 3 Increased MSI2 RNA binding activity in LSCs. a Number of MSI2-HyperTRIBE significant edit sites and their distribution on genes in LSKs and LSCs.
Number of target genes in each cell type is shown on top of the bars. n = 3. b Overlapping of target genes in LSKs and LSCs: 2506 shared, 1656 LSC unique
targets, and 359 LSK unique targets. c Differential editing of shared sites, represented by Log2 fold change of diff.frequency in LSCs and in LSKs. d Violin
plot presenting log2 fold change of gene expression in LSCs and LSKs (overexpressing MIG) of shared targets, LSC unique targets (n = 1651) and LSK
unique targets (n = 359). One-sided Wilcoxon test. ****p < 0.0001. Plot center lines show the median, box limits denote upper and lower quartiles,
whiskers represent 1.5× interquartile range and individual points show outliers. e Percentage of gene expression (GE) independent targets in shared, LSC
unique and LSK unique target groups from b. f Clustering of diff.frequency for top gene targets with diff.frequency of at least 0.6 in LSKs and LSCs (left
panel). Only genes with diff.frequency significantly different (LSC vs LSK, beta-binomial test), are plotted. Matched number of edit sites for each target (per
row) (the middle panel) and corresponding expression level in LSKs versus LSCs (right panel). g Total number of significant RNA-seq Gene and Drug
signatures (FDR < 0.05) enriched in LSK and LSC unique targets. h Top significant RNA-seq Gene and Drug signatures enriched in LSK unique targets (359
genes) using ENRICHR analysis. FDR < 0.05 for all indicated pathways. i Top significant RNA-seq Gene and Drug signatures enriched in LSC unique targets
(1656 genes) using ENRICHR analysis. FDR < 0.05 for all indicated pathways. j Gene expression (GE) independent RNA-seq Gene and Drug signatures of
shared targets in LSKs and LSCs. Full list of shared target genes in b is filtered with log2fc (LSC-MIG/LSK-MIG) ≤ 1.2. k GE independent signature of RNA-
seq Gene and Drug signatures of LSC unique and LSK unique targets. *FDR < 0.05.

expression between normal cells and leukemia cells the activity                               LSKs even in the most highly edited targets (≥0.6 diff.frequency)
of MSI2 is increased in LSCs compared with normal cells.                                      as shown by an increase in both diff.frequency and number of
   To assess whether the elevated RNA binding activity of MSI2                                edit sites (Fig. 3f). Importantly, for the majority of targets the
in LSCs is due to higher abundancy of the targets, we carried out                             mRNA expression could not simply explain this increased editing
differential expression analysis comparing expression of mRNAs                                in leukemia compared with normal cells (right panel, Fig. 3f).
between LSCs and LSKs. We observed that almost all shared                                     Nevertheless, to further eliminate expression bias, we restricted
(~94%) and the majority (~69%) of LSC unique targets have                                     the clustering to targets with comparable or lower expression in
comparable expression in both cell types or lower expression in                               LSCs (vs LSKs) and still observed the same pattern of increased
LSKs (log2fc LSC/LSK ≤ 0.26 or FDR ≥ 0.05 no significant                                       RNA binding in LSCs compared with LSKs (Supplementary
difference) whereas the majority (~66%) of LSK-specific targets                                Fig. 6j). Of note, the overexpression of MSI2-ADA and MSI2-
were expressed more highly in LSKs (log2fc LSC/LSK ≤ −0.26)                                   DCD fusions for this short time course (48 h) did not result in
(Fig. 3d, e). Thus, RNA transcript abundance could explain a                                  significant changes in the transcriptome of both cell types
proportion but not the majority of the differential binding activity                          (Supplementary Fig. 6k–p). These data suggest that MSI2 binding
in LSCs.                                                                                      activity is elevated in LSCs versus LSKs through mechanisms
   To determine the significant differences in MSI2 binding in                                 independent of mRNA expression.
LSCs, we clustered the differential edit frequency of targets in                                 Next, we wanted to understand how differential RNA binding
both cell types. We observed the elevated editing in LSCs versus                              activity of MSI2 in LSCs compared with LSKs influences MSI2’s

6                      NATURE COMMUNICATIONS | (2020)11:2026 | https://doi.org/10.1038/s41467-020-15814-8 | www.nature.com/naturecommunications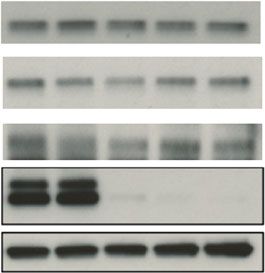
NATURE COMMUNICATIONS | https://doi.org/10.1038/s41467-020-15814-8                                                                  ARTICLE

known functional pathways. Gene pathway analysis by ENRICHR                     increases interaction with its mRNA targets in LSCs, and
revealed nearly 9 times more significant pathways enriched in the                therefore MSI2 ablation selectively affects the protein abundance
LSC unique targets versus the LSK unique targets (900 vs 113,                   of these targets in LSCs compared with normal LSKs. These data
FDR < 0.05) (Fig. 3g). Top LSK-specific signatures include normal                suggest that the increased RNA binding activity may explain the
embryonic stem cell related programs, hematopoietic stem cells                  enhanced requirement of MSI2 in LSCs compared with LSKs.
and progenitors programs, while MSI2 controlled pathways and
MLL-AF9 AML leukemia are amongst the most enriched
signatures in LSC-specific targets (Fig. 3h, i, Supplementary                    Discussion
Data 3). This is in accordance with our previous study, which                   Although multiple studies have identified RBP mRNA targets in
demonstrates that MSI2 maintains the mixed-lineage leukemia                     embryonic stem cells, pluripotent stem cells and neural stem cells
(MLL) self-renewal program by controlling the translation of                    isolated from embryos, which exist in large quantity10–14,46,
critical MLL regulated transcription factors such as Hoxa9, Ikzf2               global mapping of RBP targets in rare cells such as adult normal
and Myc in myeloid leukemia20. In addition, gene ontology (GO                   and cancer stem cells has been hampered due to limited input
Biological Processes) identified pathways related to RNA                         material. The standard methods (RNA-IP and CLIPs including
metabolism and protein transport and processing as well as                      HITS-CLIP, iCLIP, eCLIP and sCLIP) require typically 5–20
translational regulation in LSC-specific targets while it did not                millions of cells47–50. The irCLIP method for low input material
find any significant biological processes in the LSK-specific targets              requires 20,000–100,000 cells51. However, all of these CLIP
(Supplementary Fig. 6q and Supplementary Data 4).                               methods require cross-linking and RBP immunoprecipitation
   To investigate whether this is due to background cell-type                   (IP) which could result in either lost targets or the capture of
specific expression of the targets, we performed gene enrichment                 nonspecific targets. In this study, we have successfully adapted the
analysis with only gene-expression (GE) independent targets                     HyperTRIBE method, originally developed in Drosophila15–17, for
(log2fc ≤ 0.26 or FDR ≥ 0.05 no significant difference, shown in                 identification of RBP targets in mammalian cells. Utilizing our
Fig. 3e) for Shared, LSK unique and LSC unique groups. We                       adapted HyperTRIBE method, we have obtained direct mRNA
found that the GE independent shared targets, the majority of                   targets of an RBP in a human AML cell line and in mouse normal
which have higher binding to MSI2 in LSCs versus LSKs, are                      and transformed hematopoietic stem and progenitor cells. This
enriched for both normal HSPC-related as well as MLL-AF9                        method uses between 0.5 million cells (for MOLM13) to 360 cells
leukemia programs (Fig. 3j). Remarkably, MSI2 controlled                        (for LT-HSC) and does not need any cross-linking, IP, or labeling
pathways in LSCs and MLL1-HOXA9-MEIS1 leukemia programs                         steps. We show in all of the cell types used in our study that this
were selectively enriched in GE independent LSC unique targets,                 approach accurately captures the known binding motif of MSI2 in
which are expressed at the same or lower level in LSKs (Fig. 3k,                stem cells, an RBP that has been studied in various systems.
Supplementary Data 3). Our results reveal that MSI2 not only                    Moreover, our data correlate well with previous studies that
enhances its RNA binding activity in LSCs versus LSKs overall,                  mapped MSI2 binding sites using immunoprecipitation techni-
but also interacts more with genes regulated by the MLL leukemia                ques and we further validate the targets by genetic studies.
programs in LSCs.                                                                  A-to-I editing by endogenous adenosine deaminase ADAR
                                                                                enzymes exists in cells to regulate RNA life cycle. This prompts
                                                                                the question whether the high expression of exogenous ADAR in
Differential regulation of MSI2 targets in LSCs. We then                        the RBP-ADAR fusion artificially affects the expression and
hypothesized that MSI2 differential binding to targets in the MLL               processing of target RNAs. We address this question by analyzing
program results in a specific effect on the abundance of the tar-                differential expression (DESeq2) for cells expressing MSI2-ADA
gets upon MSI2 perturbation in LSCs, compared with LSKs. To                     compared with those with empty vector (MIG). Our analysis
test our hypothesis, we looked at Hoxa9, Ikzf2, and Myc, our                    shows that there is little change in the transcriptome of
previously established MLL and MSI2 downstream targets as well                  MOLM13, LSKs, and LSCs expressing MSI2-ADA after 48 h of
as key transcription factors in hematopoiesis and leukemogenesis.               transduction. For in vivo HyperTRIBE in HSPCs, which took
We found that Hoxa9 and Ikzf2 3′UTRs was substantially marked                   7 weeks for transplantation and engraftment of cells expressing
by MSI2-ADA (Fig. 4a, b). Although Myc was previously detected                  MSI2-ADA, we observed dramatic changes in transcriptome of
by CLIP and RIP approaches, we did not find any editing in Myc                   LT-HSC and ST-HSC but not MPP2 and MPP4. Of the genes
transcripts in all cell types in this study. This might be due to the           significantly changed upon MSI2-ADA expression, the majority is
rapid turnover of Myc mRNAs9,38,39 and the stable interaction                   due to MSI2 overexpression, which is consistent with previous
required for editing or because MSI2 does not actually bind Myc                 studies demonstrating a role of MSI2 in HSCs18,21,23.
directly. However, we detected MSI2’s interaction at Myb, a well-                  Although MSI2 binding sites have previously been identified in
known upstream regulator of Myc and a key transcription factor                  cell lines using alternative approaches, MSI2 binding in HSPCs
in hematopoiesis as well as a driver of MLL related and non-                    and LSCs has never been characterized. Using HyperTRIBE, we
related leukemia40–45 (Fig. 3c).                                                are now able to assess the cell context specific MSI2 binding
   We then confirmed the edit sites are indeed regulatory binding                program for rare cell types including hematopoietic stem cells,
sites of MSI2 by a reporter assay with Hoxa9 and Myb, which                     MPPs, and leukemic stem cells. Importantly, our results
have relatively short 3′UTRs (Supplementary Fig. 7a, b).                        demonstrate that RBP–RNA interactions are highly cell-context
Interestingly, Hoxa9, Ikzf2, and Myb are less edited in LSKs as                 dependent even in closely related cell types. Although previous
demonstrated by the fewer number of sites and lower differential                work has started addressing this question using in vitro differ-
edit frequency (Fig. 4a, c). Importantly, depletion of Msi2 resulted            entiation culture46,52, extensive and systematic studies are needed
in a significant reduction in protein, without changes in mRNA,                  to assess RBP activity in rare cells during fate switches. Using our
of Hoxa9, Ikzf2, and Myb, in LSCs but not in LSKs (Fig. 4d, e,                  optimized HyperTRIBE method, we revealed that MSI2 has dif-
Supplementary Fig. 7c–e). Notably, HOXA9, IKZF2, and MYB                        ferential binding activity at different states of HSPCs and in LSCs
abundance is modestly higher in LSCs compared with LSKs                         in a target GE independent manner. Moreover, we found that the
(Supplementary Fig. 7f). These data indicate that MSI2 is more                  enhanced RNA binding activity of MSI2 leads to differential
required in LSCs to maintain the expression of these targets.                   regulation, e.g., at Hoxa9, Ikzf2, and Myb targets, in LSCs versus
Based on our results, we propose a model in which MSI2                          LSKs, which provides a possible explanation for the differential

NATURE COMMUNICATIONS | (2020)11:2026 | https://doi.org/10.1038/s41467-020-15814-8 | www.nature.com/naturecommunications                          7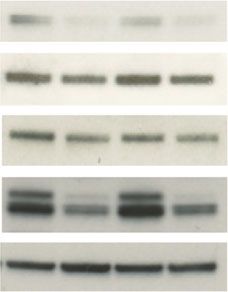
ARTICLE NATURE COMMUNICATIONS | https://doi.org/10.1038/s41467-020-15814-8
a Hoxa9 3′UTR
b lkzf2 3′UTR
0.7
0.5 0.6
0.4 0.5
0.3 0.4
0.3
0.2
0.2
0.1
0.1
0 0
0.1 0.1
0.2 0.2
0.3
52223100 52224243
69531213 69538767
c Myb 3′UTR
0.7 d
0.5 Msi2 f/f Cre(–) Msi2 f/f Cre(+)
2.0
37 HOXA9
0.3
1.5
75
0.1 IKZF2
50
0 1.0
0.1 75 MYB
37 0.5
MSI2
0.3
50 ACTIN
0.5 0.0
37
21124935 21126172
e f
hi
MLL-AF9 Kit Msi2f/f Cre-ER(+)
LSKs
– + – + (TAM)
1.5
37 HOXA9 AAA
3′UTR Protein
75
IKZF2 1.0 mRNA (Hoxa9, Ikzf2, Myb) (HOXA9, IKZF2, MYB)
50
75 MYB LSCs
0.5
37 MSI2 AAA
3′UTR Protein
50 ACTIN mRNA (Hoxa9, Ikzf2, Myb) (HOXA9, IKZF2, MYB)
37 0.0
Fig. 4 Differential control of MSI2 targets in LSCs compared with normal LSKs. Diff.frequency at various sites identified by MSI2-HyperTRIBE in Hoxa9 3′
UTR (a), Ikzf2 3′UTR (b) and Myb 3′UTR (c) in LSKs and LSCs. Numbers on the X-axis is the start and end of 3′UTR. Data presented as the mean values
from three independent HyperTRIBE experiments. Significant difference is determined by beta-binomial test. * adjusted p < 0.1 d Representative
immunoblot images and quantitation showing no significant change in HOXA9, IKZF2 and MYB protein expression upon Msi2 knockout in LSKs after
3 weeks of pIpC treatment in Msi2 f/f Cre(–) and Cre(+) mice. Each data point is an independent treated mouse. Data are presented as mean ± SEM. Two-
sided unpaired Student t test. ***p < 0.005. (p = 0.002 for MSI2). e Representative Immunoblot images and quantitation showing significant decrease in
HOXA9, IKZF2 and MYB protein expression upon Msi2 knockout at 68 h after TAM treatment in MLL-AF9 Msi2 CreER(+) LSCs. Each data point is an
independent treated mouse. Data are presented as mean ± SEM. N = 6 independent experiments for HOXA9 and IKZF2, n = 3 independent experiments
for MYB. Two-sided paired Student t test. **p < 0.01, ***p < 0.001; ****p < 0.0001. (p = 0.000002 for MSI2, p = 0.00015 for HOXA9, p = 0.019 for IKZF2,
p = 0.000019 for MYB). f Schematic depiction of MSI2 elevated RNA binding and reduction of target protein expression upon MSI2 ablation in LSCs, but
not in LSKs.
requirement of MSI2 in leukemia compared with normal support a leukemia-specific role for MSI2 and provide further
hematopoiesis. rationale for targeting MSI2 in leukemia cells in patients that have
Furthermore, it remains to be elucidated (1) how MSI2 equivalent expression of MSI2 as compared with normal cells.
achieves more binding to mRNA targets in LSCs even without Our data provide a key resource for further studies on the
upregulating MSI2 expression; and (2) why MSI2 controls protein mechanisms of RBP regulation in rare cells such as stem cell
abundance of its mRNA targets (e.g., Hoxa9, Ikzf2, and Myb) in populations.
LSCs but not in normal HSPCs. One possibility is that other RBPs
that share a similar binding motif might compete for the same
Methods
binding sites with MSI2 in LSKs. Alternatively, post-translational Animal research ethical regulation statement. All animal studies were per-
modifications on MSI2 or other RBPs could result in the formed on animal protocols approved by the Institutional Animal Care and Use
increased binding. Moreover, multiple RBP-driven regulation Committee (IACUC) at Memorial Sloan Kettering Cancer Center.
pathways, including MSI2’s, may coordinate to control transla-
tion process of their shared targets. Cancer cells often alter or lose Plasmid constructs. MSI2-ADA fusion was constructed by fusing the human
multiple pathways and thus might become uniquely dependent MSI2 CDS to the A-I deaminase domain of the Drosophila enzyme ADAR con-
on MSI2 regulation. Therefore, LSCs recruit more MSI2 to its taining a hyperactive mutant E488Q15, with a linker (the region from Y268 to the
targets rather than different RBPs as in normal LSKs. As a con- deaminase domain). The inactive ADAR catalytic mutant control MSI2-DCD was
generated by mutating Glutamic acid E367 to Alanine in the deaminase
sequence, the regulation of the target expression is now more domain28,29, using site-directed mutagenesis (Agilent #200523). Both constructs
dependent on MSI2. Regardless of the exact mechanism, our data were codon-optimized for expression in human cells before gene synthesis and
8 NATURE COMMUNICATIONS | (2020)11:2026 | https://doi.org/10.1038/s41467-020-15814-8 | www.nature.com/naturecommunications
NATURE COMMUNICATIONS | https://doi.org/10.1038/s41467-020-15814-8                                                                                             ARTICLE

cloning into MSCV-IRES-GFP (MIG) vector. The sequence of these constructs are           the SMART-Seq v4 Ultra Low Input RNA Kit (Clonetech catalog # 63488), with 12
provided in the supplementary information (Supplementary Methods). After                cycles of amplification. Subsequently, 10 ng of amplified cDNA was used to prepare
Sanger sequencing, we found that there was additional unexpected mutation,              libraries with the KAPA Hyper Prep Kit (Kapa Biosystems KK8504) using eight
N495S, in the ADAR catalytic domain of the MSI2-DCD. However, this does not             cycles of PCR. Samples were barcoded and run on a HiSeq 4000 or HiSeq 2500 in
affect the fusion expression and we confirmed by the data in MOLM13 that the             High Output mode in a 50 bp/50 bp paired end run, using the HiSeq 3000/4000
MSI2-DCD containing both E367 and N495S is catalytically inactive of A-to-I             SBS Kit or TruSeq SBS Kit v4 (Illumina). An average of 36 million paired reads
editing. RRM(del)MSI2-ADA was generated by removing both RRM1 and RRM2                  were generated per sample and the percent of mRNA bases per sample ranged from
of MSI2. To create RRM(mut)MSI2-ADA, we synthesized the fusion with RRM1                64 to 77%.
containing mutations F24A, R62A, F66A and F223A, F155A mutations on RRM2.
To create ADA only construct, we removed MSI2 from the fusion MSI2-ADA. All
                                                                                        Identification of RNA editing events in RNA-Seq data. We aligned the paired-
of the contructs were fused with 2xFlag tags.
                                                                                        end RNA-seq reads to human (hg19) or mouse (mm10) genome using STAR
                                                                                        aligner55. Next we followed the GATK56 workflow for calling variants in RNA-seq
Retroviral production and transductions. Retroviral packaging of all expression         (https://software.broadinstitute.org/gatk/documentation/article?id=3891) to iden-
constructs was performed in 293T cells as previously prescribed53. Retrovirus was       tify all the mutations in each RNA-seq library. We then restricted to the mutations
kept at 4 °C and used within 2 weeks of production.                                     within annotated mRNA transcripts, as well as restricting to A-to-G mutations in
                                                                                        transcripts encoded by the forward strand and T-to-C mutations in transcripts
                                                                                        encoded by the reverse strand. We also filtered out mutations found in the dbSNP
MSI2-HyperTRIBE in MOLM-13 cell line. MOLM-13 cells (obtained from ATCC)
                                                                                        database since they are most likely DNA-level mutations. We then combined the
were cultured in RPMI 10% FBS 1%L-Glutamine PenStrep. Cells were infected with
                                                                                        filtered sets of RNA editing events from all RNA-seq libraries of the same
virus expressing MSI2-ADA, MSI2-DCD, or MIG controls at 1:1 ratio (v/v) cell: virus
                                                                                        experiment and counted the number of reads containing reference (A/T) and
at 0.5 million cells per mL (final density). Spinoculation was done with 10 μg/mL
                                                                                        alternative (G/C) alleles from each library at each site.
polybrene (Millipore #TR-1003-G) at 768 g for 1 h at 32 °C. Cells were incubated for
48 h and then sorted by flow cytometry for GFP positive. At least 0.5 million GFP
positive cells were used for RNA extraction and sequencing.                             Statistical test for difference in edit frequencies. We used beta-binomial dis-
                                                                                        tribution to model the RNA edit frequencies, which has also previously been
                                                                                        applied to modeling allele frequencies in RNA-seq reads57,58. The beta-binomial
MSI2-HyperTRIBE in HSPCs. Bone marrow cells from 6 to 8-week-old C57BL/
                                                                                        distribution is the binomial distribution where the probability of success at each
6 strain were processed for c-Kit enrichment by incubation with 50 μl of MACS
                                                                                        trial is not fixed, but instead is drawn from the beta distribution. The probability
CD117/c-Kit beads per mouse and then run on an AutoMACs (Miltenyi Biotec)
                                                                                        functions of the binomial distribution and beta distribution are:
following the manufacturer’s instructions. Cells were stained with Lineage antibody

cocktail including CD3 (Fisher #15-0031-83), B220 (ebioscience #15-0452-83),                                                     n k
CD4 (Fisher #5013997), CD8 (ebioscience #15-0081-83), Gr-1 (ebioscience #15-                                       Pðkjn; pÞ ¼      p ð1  pÞnk ;                      ð1Þ
                                                                                                                                 k
5931-82), Ter119 (ebioscience #15-5921-83) (all conjugated with PE-Cy5), CD117-
APC-Cy7 (Biolegend #105826), Sca-1-Pacific Blue (Biolegend #122520), CD150-
APC (Biolegend #115910), and CD48−PE (Fisher #557485). Lin-Sca+Kit+ cells                                                      pα1 ð1  pÞβ1
                                                                                                                        π ðpjα; βÞ ¼           :                     ð2Þ
(LSKs) were sorted using a BD FACS Aria II cell sorter instrument (November                                                        Bðα; βÞ
2008 edition) and BD FACSDiva software (version 8.0.1 2014). Sorted LSKs were              Thus the probability density function of the compound distribution, the beta-
grown overnight in SFEM medium containing 10 ng/ml murine IL-3, 10 ng/ml IL-            binomial distribution, can be represented as
6, 50 ng/ml SCF, 10 ng/ml thrombopoietin, and 20 ng/ml FLT3l. Cells were spi-                               Z 1
noculated with retrovirus expressing MSI2-ADA, MSI2-DCD, or MIG controls and              f ðkjn; α; βÞ ¼    Pðkjn; pÞπ ðpjα; βÞdp
4 μg/mL polybrene on retronectin-coated plates. After 48 h of transduction, all cells                         0
                                                                                                        Z 1 n

were collected and transplanted into lethally irradiated C57BL/6 mice (15,000 cells                                             pα1 ð1  pÞβ1
per mouse). Engraftment was checked after 6 weeks. After 7 weeks of transplan-                        ¼           pk ð1  pÞnk                 dp
                                                                                                          0   k                     Bðα; βÞ
tation, mice were sacrificed and c-Kit enriched bone marrow cells were stained with
                                                                                                           n
LSK markers as described above plus CD48-PE and CD150-APC. Cells were sorted
into four populations GFP positive CD150+ CD48−(LT-HSC), CD150− CD48–                                       k Z 1 kþα1                            n Bðk þ α; n þ β  kÞ
                                                                                                      ¼              p      ð1  pÞnþβk1 dp ¼                          :
(ST-HSC or MPP1), CD150+ CD48+ (MPP2), and CD150– CD48+ (MPP4).                                         Bðα; βÞ 0                                  k       Bðα; βÞ
360–20,000 sorted cells were used for RNA extraction and sequencing.                                                                                                          ð3Þ
                                                                                           For convenience, it is common to reparametrize it as:
MSI2-HyperTRIBE in LSKs and LSCs. LSK cells were obtained and transduced
                                                                                                                                       α
with MSI2-HyperTRIBE constructs as described above. After 48 h of incubation,                                                     μ ¼ αþβ ;                                   ð4Þ
cells were sorted for GFP positive and RNA was extracted for SMARTer library
preparation and RNA-seq.                                                                                                         ρ ¼ αþβþ1
                                                                                                                                       1
                                                                                                                                           ;                                  ð5Þ
    Quaternary MLL-AF9 leukemia model on Actin-dsRed background mice were
generated as described before54. Bone marrow cells were infected with MSI2-             so that the expectation and variance of the beta-binomial distribution are:
HyperTRIBE expressing virus in BMT medium (RPMI 10%FBS 1%L-Glutamine
                                                                                                                             Eðkjn; μ; ρÞ ¼ nμ ;                              ð6Þ
PenStrep supplemented with 10 ng/mL murine IL-3, 10 ng/mL murine IL-6, 10 ng/mL
murine SCF, and 10 ng/mL murine GM-CSF) for 48 h. LSC-enriched population was
isolated by sorting dsRed+, GFP+, and c-Kit-APC-Cy7 high (top 10–12%) for library                                 Varðkjn; μ; ρÞ ¼ nμð1  μÞ½1 þ ðn  1Þρ :                  ð7Þ
preparation and RNA-seq.                                                                In this form, µ corresponds to the estimate of p, and ρ corresponds to the extent of
                                                                                        over-dispersion. Both µ and ρ values are between 0 and 1.
RNA extraction and sequencing. RNA from cells suspended in Trizol was                       When we use beta-binomial distribution to model the RNA editing events in
extracted with chloroform. Isopropanol and linear acrylamide were added, and the        RNA-seq, n corresponds to the total number of reads overlapping with an RNA
RNA was precipitated with 75% ethanol. Samples were resuspended in RNase-free           edit site and k to the number of reads with A-to-G mutations. In this scenario, the
water. For HyperTRIBE in MOLM-13, after PicoGreen quantification and quality             beta-binomial distribution is a better model for read counts than the binomial
control by Agilent BioAnalyzer, 1 μg RNA input was used for library preparation         distribution since it takes the variability in mutation frequencies between biological
(TrueSeq Stranded mRNA LT Sample Prep Kit. Libraries were run on a HiSeq 4000           samples into account. Under the null hypothesis, all samples have equal RNA
in a 50 bp/50 bp paired end run, using the HiSeq 3000/4000 SBS Kit (Illumina).          editing level, and the edit frequencies are drawn from the same beta distribution
The average number of read pairs per sample was 34 million. For HyperTRIBE in           πðμ0 ; ρÞ. Under the alternative hypothesis, the samples expressing the MSI2-ADA
HSPCs, after RiboGreen quantification and quality control by Agilent BioAnalyzer,        fusion protein have a different RNA edit frequency than the control samples, and
0.5 ng total RNA (for eight samples with
ARTICLE                                                                             NATURE COMMUNICATIONS | https://doi.org/10.1038/s41467-020-15814-8

in mean edit frequency by MSI2-ADA and mean edit frequency by MSI2-DCD                   Gene pathway enrichment analysis. Target genes in four populations of HSPCs
and MIG).                                                                                were overlapped to identify the common and unique targets between the popu-
                                                                                         lations. Target genes specific for LT and ST HSCs or specific for MPP2 and MPP4
                                                                                         were analyzed for RNA-seq Gene and Drug signatures and Gene Ontology
Statistical test for differential editing between cell types. For differential           (molecular functions and biological processes) using ENRICHR program34,61. The
editing between HSPC populations, we first identified all significantly edited genes        same analysis was also done for targets unique to each population. The ENRICHR
with a maximum diff.frequency ≥ 0.1. A gene with a maximum diff.frequency ≥ 0.1          combined score was extracted for significantly enriched pathways and compared
that is significantly edited in one cell type (ADAR vs controls), but not significantly    between different sets of targets. For pathway enrichment of GE independent
edited in the other cell types (ADAR vs controls), is considered a potential cell-type   targets, we first are defined GE independent targets as following. For shared and
specific gene target. Next, we obtained the read counts from all samples (LT, ST,         LSC unique groups, these are genes that have no significant expression difference
MPP2, MPP4) supporting every A to G and T to C edit site and tested the sig-             between cell types (FDR ≥ 0.05) or comparable or lower expression in LSCs versus
nificance for cell-type specific edit sites using the beta-binomial test. Under the null   LSKs (log2FC LSC/LSK ≤ 0.26, equivalent to fold change LSC/LSK ≤ 1.2, and FDR
hypothesis, all cell types have equal RNA editing level, and the edit frequencies are    < 0.05). For LSK unique group, GE independent targets are genes with no sig-
drawn from the same beta distribution. Under the alternative hypothesis, the cell        nificant expression difference between cell types (FDR ≥ 0.05) or comparable or
type of interest has a different RNA edit frequency than the other cell types. The       lower expression in LSKs versus LSCs (log2FC LSC/LSK ≤ −0.26, equivalent to fold
difference in edit frequency between cell types is significant if the FDR-adjusted p <    change LSK/LSC ≤ 1.2, and FDR < 0.05).
0.1. For the difference in editing between LSC and LSK-specific gene targets, we
selected genes with a diff.frequency ≥ 0.6 and fpkm ≥ 5. These gene targets were run
through the beta-binomial test as described above.                                       Immunofluorescence. HSCs and MPPs were sorted from primary Msi2 f/f Cre-
                                                                                         and Cre+ 6 weeks after pIpC. Cells were fixed with 1.5% paraformaldehyde,
                                                                                         permeabilized with cold methanol and cytospun onto glass slides. Cells were then
Clustering of target genes by edit frequency patterns. After identifying HSPC            stained on slides with anti-SMAD3 (Cell Signaling Technology, 9523S, dilution
cell-type specific gene targets using the beta-binomial test, we filtered for adjusted     1:1000), anti-phosphorylated SMAD2/3 (Cell Signaling Technology, 8685S, dilu-
p < 0.1 and plotted the maximum diff.frequency value for each gene. The diff.            tion 1:1000), or anti-BRCC3 (Novus Biologicals, NBP1-76831, dilution 1:1000) first
frequencies were then stacked from lowest to highest diff.frequency in each              and then with secondary antibody conjugated with rabbit Alexa Fluor 488
cell type.                                                                               (Molecular Probes). Quantification of the signal intensity of each cells (divided by
    After identifying genes significantly edited between LSCs and LSKs through the        surface area) normalized for background staining was done with AxioVision
beta-binomial test, genes were filtered by an adjusted p < 0.05 and fpkm ≥ 5. We          Rel.4.8.2 (06-2010) software and Zeiss Imager Z2 (Zen 2 Blue Edition).
obtained the maximum diff.frequency (ADAR vs MIG/DCD) for each gene that
passed the filter and plotted them in a heatmap with Mcquitty clustering method.
GE heatmaps for both HSPCs and for LSKs and LSCs were created by using                   Luciferase reporter assay. Original or mutated 3′UTR of murine Hoxa9 and
DESeq2 to obtain variance stabilized transformation (VST) of read counts. Then,          murine c-Myb was cloned downstream of Renilla luciferase reporter gene in pRL-
we calculated the mean of the VST counts of sample duplicates/triplicates for each       CMV. MSI2 motifs in proximity of identified edit sites on Hoxa9 and Myb 3′UTRs
gene, and then performed z-transformation for each gene. Genes in the expression         were located by “distance to nearest motif” R script, as described above, in LSKs
heatmap match the order of row in the edit frequency heatmaps.                           and LSCs. All the motifs in Hoxa9 and Myb 3′UTR were mutated. In the knock-
                                                                                         down experiment, pRL-CMV 3′UTR constructs were co-transfected with firefly
                                                                                         luciferase control and MSI2 shRNA or nonspecific shRNA control (shRNA scr). In
Motif analysis. For de novo motif discovery, we first extracted sequences                 the overexpression experiment, pRL-CMV 3′UTR constructs were co-transfected
extending 100 bp from both sides of each edit site in the 3′UTR and considered all       with firefly luciferase control and MIB empty vector or vector overexpressing
these windows as the target sequence pool for the HOMER program. Overlapping             human MSI2. After 48 h of transfection, expression of renilla and firefly luciferase
sequences were merged into a single sequence. Background sequences with length           was determined by Dual luciferase assay (Promega) following the manufacturer
201 bp were randomly selected from 3′UTRs in the genome that did not overlap             instructions.
with the target sequence pool. We used the HOMER software to search for enri-
ched motifs of length 6, 7, or 8, and regional oligomer autonormalization of up to       qRT-PCR. Total RNA from sorted cKit-hi MLL-AF9 Msi2 RosaCre ER ± Tamox-
length 3.                                                                                ifen cells was isolated using TRIzol (Sigma-Aldrich) and RNAeasy RNA extraction
    To calculate the distance between the MSI2-HyperTRIBE edited site to the             kit (Qiagen). RNA was reversed transcribed into cDNA with iScript (BioRad).
nearest MSI2 motif, we first obtained the genomic coordinates of exons that               Quantitative PCR was performed with primers for Msi2 (forward ACGACTCCCA
contain the HyperTRIBE site. Then we calculated the position weight matrix               GCACGACC; reverse GCCAGCTCAGTCCACCGATA), Ikzf2 (forward: CATCAC
(PWM) of HOMER motif results to identify motif sites within exon sequences. A            TCTGCATTTCCAGC; reverse: TGACCTCACCTCAAGCACAC), Myb (forward:
site was designated as a motif occurrence if its score was at least 90% of the           AGATGAAGACAATGTCCTCAAAGCC; reverse: CATGACCAGAGTTCGAGC
maximum score; this score was calculated as the log of the probability of observing      TGAGAA), and Hoxa9 (forward: GTAAGGGCATCGCTTCTTCC; reverse: ACA
the nucleotide sequence given the motif PWM, divided by the probability of               ATGCCGAGAATGAGAGC).
observing the given sequence at random given the background distribution of
nucleotides, with a sampling correction applied to avoid null values59. We then
calculated the distance of each edited site to the nearest motif match.                  Immunoblot analysis. To check the expression of Hoxa9, Ikzf2, and Myb in LSCs,
    To find the distance to the nearest iCLIP peak, we then identified the genomic         c-Kithi (top 10–12%) bone marrow cells (LSCs) from Msi2 f/f Cre-ER- and Msi2 f/f
coordinate of the iCLIP peak nearest to each MSI2-HyperTRIBE edit site in                Cre-ER+ mice were sorted and were left untreated or treated with 600 nM 4-OH
MOLM-13 cells. NB4 iCLIP data from21.                                                    Tamoxifen (Sigma-Aldrich) for 68 h in BMT medium. One hundred thousand cells
                                                                                         were collected, washed once with PBS, and then lysed in 1× Laemmli sample buffer
                                                                                         (BioRad). LSCs were also sorted from quaternary MLL-AF9 DsRed leukemia mice,
MSI2 edit site clustering analysis. To determine a suitable window size for              then were transduced with lentiviral shRNAs against murine Msi2 (sh331 and
clustering edit sites, we compared the enrichment of MSI2 motifs in windows of           sh332) or shRNA against Luciferase. Transduced cells were selected with 2 μg/mL
fixed size around significantly edited sites (“true sites”) compared with windows of       puromycin. After 72 h of transduction, cells were collected, washed in PBS and
the same size around non-significantly edited sites (“background”). We performed          lysed in 1× Laemmli sample buffer. For analysis in LSKs, one hundred thousand
a Fisher’s test and determined that ±17 bp is the largest window such that the motif     LSK cells from 3 week pIpC treated Msi2 f/f Cre- and Msi2 f/f Cre+ mice were
enrichment was significantly greater around true sites compared with background           sorted, washed with PBS and lysed in 1× Laemmli sample buffer. Cell lysate was
(p < 0.01).                                                                              run on 4–15% SDS-PAGE gels, transferred onto nitrocellulose membrane and then
                                                                                         probed with antibodies against MSI2 (Abcam, ab76148, dilution 1:1000), HOXA9
                                                                                         (Abcam, ab140631; dilution 1:1000), IKZF2 (Santa Cruz, sc-9864, dilution 1:1000),
Differential expression analysis (DESeq2). Paired-end RNA-seq reads were first
                                                                                         MYB (Millipore, 05-175, dilution 1:1000), and ACTB (beta-actin-HRP, dilution
processed with Trimmomatic60 to remove TruSeq adapter sequences and bases
                                                                                         1:30,000) (Sigma-Aldrich, A3854).
with quality scores below 20, and reads with
You can also read