Review-Electrochemical CO 2 Reduction for CO Production: Comparison of Low- and High-Temperature Electrolysis Technologies - IOPscience
←
→
Page content transcription
If your browser does not render page correctly, please read the page content below
Journal of The Electrochemical
Society

OPEN ACCESS

Review—Electrochemical CO2 Reduction for CO Production:
Comparison of Low- and High-Temperature Electrolysis Technologies
To cite this article: Rainer Küngas 2020 J. Electrochem. Soc. 167 044508

View the article online for updates and enhancements.

                               This content was downloaded from IP address 176.9.8.24 on 08/06/2020 at 16:50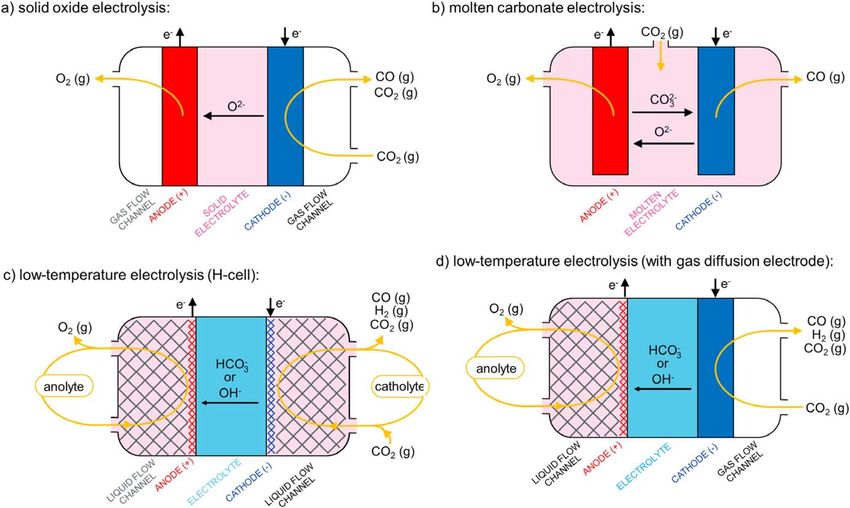
Journal of The Electrochemical Society, 2020 167 044508

                           Review—Electrochemical CO2 Reduction for CO Production:
                           Comparison of Low- and High-Temperature Electrolysis
                           Technologies
                           Rainer Küngas*,z
                           Haldor Topsoe A/S, Haldor Topsøes Allé 1, Kgs. Lyngby, Denmark

              Recently, the field of CO2 electrolysis has experienced rapid scientific and technological progress. This review focuses specifically
              on the electrochemical conversion of CO2 into carbon monoxide (CO), an important “building block” for the chemicals industry.
              CO2 electrolysis technologies offer potentially carbon-neutral routes for the production of specialty and commodity chemicals.
              Many different technologies are actively being pursued. Electrochemical CO2 reduction from aqueous solutions stems from the
              success of alkaline and polymer electrolyte membrane electrolyzers for water electrolysis and uses performance metrics established
              within the field of aqueous electrochemistry. High-temperature CO2 electrolysis systems rely heavily on experience gained from
              developing molten carbonate and solid oxide fuel cells, where device performance is evaluated using very different parameters,
              commonly employed in solid-state electrochemistry. In this review, state-of-the-art low-temperature, molten carbonate, and solid
              oxide electrolyzers for the production of CO are reviewed, followed by a direct comparison of the three technologies using some of
              the most common figures of merit from each field. Based on the comparison, high-temperature electrolysis of CO2 in solid oxide
              electrolysis cells seems to be a particularly attractive method for electrochemical CO production, owing to its high efficiency and
              proven durability, even at commercially relevant current densities.
              © 2020 The Author(s). Published on behalf of The Electrochemical Society by IOP Publishing Limited. This is an open access
              article distributed under the terms of the Creative Commons Attribution Non-Commercial No Derivatives 4.0 License (CC BY-
              NC-ND, http://creativecommons.org/licenses/by-nc-nd/4.0/), which permits non-commercial reuse, distribution, and reproduction
              in any medium, provided the original work is not changed in any way and is properly cited. For permission for commercial reuse,
              please email: oa@electrochem.org. [DOI: 10.1149/1945-7111/ab7099]

              Manuscript submitted January 6, 2020; revised manuscript received January 17, 2020. Published February 14, 2020.

    The chemical industry of today is largely dependent on fossil                     If successfully deployed at scale, CO2 electrolysis technologies
fuels. Oil, gas and coal are used both as feedstock and as fuel to                have the potential to radically change the way specialty and
power the conversion and separation processes. Consequently, the                  commodity chemicals are produced. This review focuses narrowly
industry is a major emitter of CO2 and other greenhouse gases.                    on technologies for converting CO2 into carbon monoxide (CO). The
Direct emissions from the global chemical industry reached 1.5                    importance of CO as a chemical feedstock is presented in the first
gigatonnes of CO2-equivalent in 2010, accounting for approximately                part of this review. Subsequently, a general introduction into the
5% of man-made CO2 emissions1 Since the world is attempting to                    thermodynamic aspects of CO2 electrolysis is provided. Many
curb its CO2 footprint, emissions from the chemical industry are                  electrochemical methods for the production of CO have been
under increasing scrutiny. There is a growing interest both from                  proposed and are actively being developed. The working principle
policymakers and from the industry to adopt new, less CO2-intensive               and materials choice for three (arguably the most mature) electro-
processes for the production of chemicals.                                        lysis technologies—solid oxide electrolysis, molten carbonate elec-
    Electrolysis is an enabling technology for decoupling the                     trolysis, and low-temperature electrolysis—are introduced in section
production of industrial chemicals from fossil fuels and CO2                      "Technologies for CO2 electrolysis". Although these technologies
emissions. By combining electrolysis with low-carbon energy                       have existed for some time, direct performance comparisons
sources, water and CO2 can be converted into chemical feedstock                   between the technologies have been difficult due to different
with a minimal or even negative carbon footprint. Electrolysis can                conventions and the lack of commonly accepted figures or merit.
help alleviate the imbalance between the supply of electricity from               This review attempts to fill this gap by comparing the performance
intermittent sources (wind, solar, etc) via various power-to-fuels                of a number of state-of-the-art solid oxide, molten carbonate, and
scenarios, i.e. using electricity to produce fuels during periods of              low-temperature electrolyzers using a range of performance metrics.
overproduction. The produced fuels can be used for power genera-                  Finally, an industrial perspective for each of the considered
tion during periods of high power demand or as low-carbon fuels for               technologies is provided in the last part of the review.
sectors that are inherently difficult to decarbonize (e.g. heavy
transport, shipping, aviation).2–4                                                         Carbon Monoxide: Applications and Production
    Electrochemical processes are already being used at industrial
                                                                                      Carbon monoxide is an industrial gas with a wide range of
scale for the production of some commodities. Notably, the
                                                                                  applications. CO is used, either as a pure compound or as a
production of aluminum via the Hall-Héroult process consumes
                                                                                  constituent in synthesis gas (mixture of CO and H2), on a very
approximately 870 TWh electricity per year, accounting for 4% of
                                                                                  large scale for the production of commodity and specialty chemicals.
the global electricity consumption.5,6 Chlorine production via the
                                                                                  The major uses of carbon monoxide include the preparation of acetic
chlor-alkali process is another example of an electrolysis process
                                                                                  acid by catalytic carbonylation of methanol and the production of
implemented at scale, with a global production capacity of 75
                                                                                  formic acid by hydrolysis of methyl formate, which alone consume
million tonnes per year.7 Assuming an overall electricity input of
                                                                                  more than 500 000 and 450 000 tonnes of pure CO per year,
10.3 GJ/tonne Cl2,8 the electric power required to operate the
                                                                                  respectively.9,10 Other applications of pure CO include the prepara-
world’s chlor-alkali plants amounts to 215 TWh (0.8% of the global
                                                                                  tion of acrylic acid, propanoic acid, acetic anhydride, and
electricity supply). Electrification of the production of commodity
                                                                                  dimethylformamide.9 Carbonylation (reactions with carbon mon-
chemicals, while challenging due to the required scale, is therefore
                                                                                  oxide) processes are also common in the fine chemicals industry.11
not unprecedented and has been demonstrated to be technically
                                                                                  In metallurgy, CO is used to reduce oxides to metals in blast
feasible.
                                                                                  furnaces as well as to produce high-purity Ni, Fe, Co, Cr, W and Mo
                                                                                  via the metal carbonyl route.9 The reaction of CO with chlorine
  *Electrochemical Society Member.
                                                                                  yields phosgene, an intermediate in the synthesis polyurethane and
  z
    E-mail: raik@topsoe.com                                                       polycarbonate plastics.9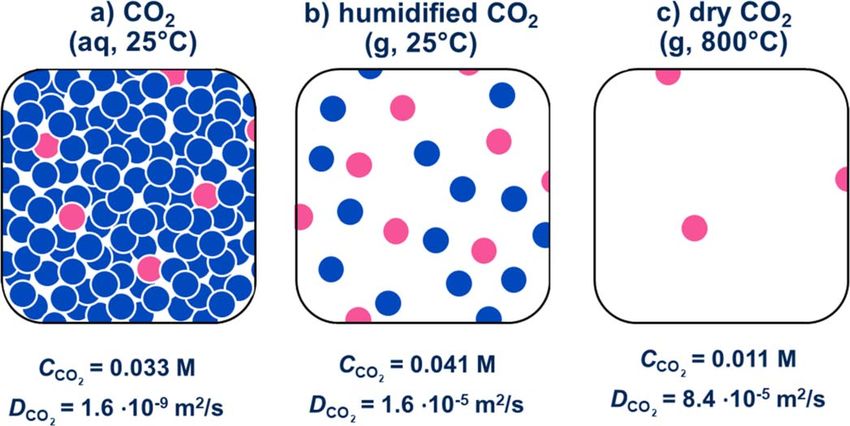
Journal of The Electrochemical Society, 2020 167 044508
Traditionally, CO is produced in large centralized plants in order to
take advantage of the economies-of-scale and better heat integration.
Plants with CO production capacities of 50 000 Nm3 per hour (31 000
scfm) are not uncommon. Typical processes used for industrial CO
production include gasification of coal, steam reforming of natural gas
or light hydrocarbons, and partial oxidation of hydrocarbons.9,12 The
produced gas is purified (e.g. cryogenically or by reversible com-
plexation) and transported to the end-users in gas pipelines, tube
trailers, or gas cylinders.13 Due to toxicity and flammability concerns,
the transportation of pressurized CO gas cylinders or tube trailers over
long distances is hazardous and expensive.
Electrochemical pathways for the preparation of CO have the
potential to significantly alter the structure of the carbon monoxide
market by making CO production less centralized. Small, decen-
tralized plants can produce CO at a customer’s site, thereby
substituting the need for expensive long-haul transportation of CO
cylinders with cheap transport of CO2. Furthermore, decentralized
electrolysis plants would be able to operate on-demand, i.e. only
when needed, hence reducing the need for large on-site CO storage
tanks and improving plant safety.14 Figure 1. Thermodynamics of CO2 electrolysis as a function of temperature
under standard conditions (CO/CO2 = 1 and an oxygen partial pressure of 1
Thermodynamics of CO2 Electrolysis atmosphere). Adapted with permission from S. D. Ebbesen et al., Chem. Rev.
114, 10697 (2014). Copyright 2014 American Chemical Society.
The minimum energy required for sustaining the conversion of
CO2 to CO is determined by thermodynamics. Figure 1 presents the
total energy demand (ΔHf, enthalpy of formation) for the reaction Technologies for CO2 Electrolysis
A large number of methods for the electrochemical production of
CO 2 (g) CO (g) + ½ O 2 (g) [1] CO from CO2 have been proposed.17 Unfortunately, most of these
as a function of temperature. The energy for reaction 1 can be methods are at a very early stage of development, corresponding to
provided either in the form of electrical energy (ΔGf, Gibbs free technology readiness levels (TRL) between 1 (Basic principles
energy of formation) or in the form of heat (TΔSf, entropy term). observed) and 4 (Technology validated in lab).18 At the time of
Since entropy term ΔSf is positive for reaction 1, the Gibbs free writing, high-temperature electrolysis in solid oxide cells is the only
energy decreases with temperature.15,16 At 25 °C, ΔGf is 90% of CO2 electrolysis technology that is approaching commercialization
ΔHf, whereas at 800 °C it amounts to only 67%. Hence, at elevated (TRL 8) and for which long-term durability exceeding a year on
temperatures, an increasing fraction of the total energy demand can be stream has been demonstrated. A subjective and non-exhaustive
provided in the form of heat. Notably, Joule heat, i.e. the heat that is review of two alternative electrochemical technologies for CO
inevitably produced when current is passed through a cell with a non- production, low-temperature and molten carbonate electrolysis, is
zero internal resistance, can be utilized in high-temperature electro- given below.
lysis cells, thereby allowing higher efficiencies to be achieved. Regardless of the choice of technology, an electrolysis cell
Figure 1 also plots the reaction energy demand in terms of always has at least three components: two electrodes in contact
voltage, calculated from with an electrolyte. The electrolyte is either a liquid or a solid
material that can conduct ions (e.g. protons, hydroxide ions, oxide
DGf = -nFE 0 [2] ions, carbonate or bicarbonate ions), but that is impermeable to
where n is the number of electrons involved in the reaction (n = 2 electrons. The ionic conductivity of the electrolyte depends strongly
for direct reduction of CO2 to CO), F is Faraday’s constant and E0 is on temperature and the choice of the electrolyte material thereby
the reversible cell voltage, i.e. minimum required cell potential for determines the operating temperature of the cell. When an external
sustaining CO2 splitting. At 25 °C, ΔGf is 257 kJ mol−1, which voltage is applied between the two electrodes, electrochemical
corresponds to a reversible voltage of 1.33 V. At 800 °C, ΔGf is reactions start to occur. The electrode where the reduction of
only 189 kJ mol−1 or 0.97 V. It should be noted that the values listed reactants (e.g. CO2 to CO) takes place is called the cathode. The
above have been calculated assuming a CO2/CO ratio of unity on the electrode where the oxidation of reactants (e.g. OH− to O2 and H2O
cathode side of the cell, and an oxygen partial pressure of 1 or O2− to O2) occurs is referred to as the anode.15
atmosphere on the anode side. The reversible cell voltage depends
on reactant partial pressures, as expressed by Nernst equation: Solid oxide electrolysis.—In solid oxide electrolysis cells
(SOECs), the electrolyte is a solid ceramic material. At temperatures
DG f RT pCO 2 above around 600 °C, electrolyte materials start to conduct oxide
E0 = - ln [ 3] ions, but remain impermeable to gaseous oxygen and to electrons.
nF nF pCO pO 2
As the ionic conductivity of electrolyte materials increases exponen-
where R is universal gas constant, T is absolute temperature, and tially with temperature, the operating temperature of SOECs is
pCO2 is the partial pressure of CO2 on the cathode, pCO is the partial typically chosen to be between 700 °C and 900 °C. Commonly used
pressure of CO on the cathode, and pO2 is the partial pressure of materials include stabilized zirconias, such as yttria-stabilized
oxygen on the anode side of the electrolysis cell. According to Eq. 3, zirconia (YSZ, a solid solution of Y2O3 and ZrO2) and scandia-
when the CO2 reduction reaction is carried out at a pressure of 20 bar stabilized zirconia (ScSZ), as well as doped cerias, such as
(i.e. pCO2 = pCO = 10 bar, pO2 = 20 bar), the reversible cell voltage gadolinia-doped ceria (abbreviated either as GDC or CGO) or
increases slightly to 1.34 V at 25 °C and to 1.04 V at 800 °C. In low- samaria-doped ceria (SDC or CSO). A comprehensive review of
temperature electrolysis cells, operation at elevated pressures leads electrolyte materials is provided in Ref. 19
to a decrease in the volume of gas bubbles and reduces the internal Schematic representation of a solid oxide electrolysis cell
resistance of the cell.15 In practice, the local value of listed operating in dry CO2 electrolysis is provided in Fig. 2a. CO2 is
thermodynamic parameters (ΔHf, ΔGf, TΔSf) varies across the fed to the cathode side of the cell via gas channels, which help to
cell and depends on local temperatures and partial pressures. distribute the gas across the cell. In the porous cathode (also referred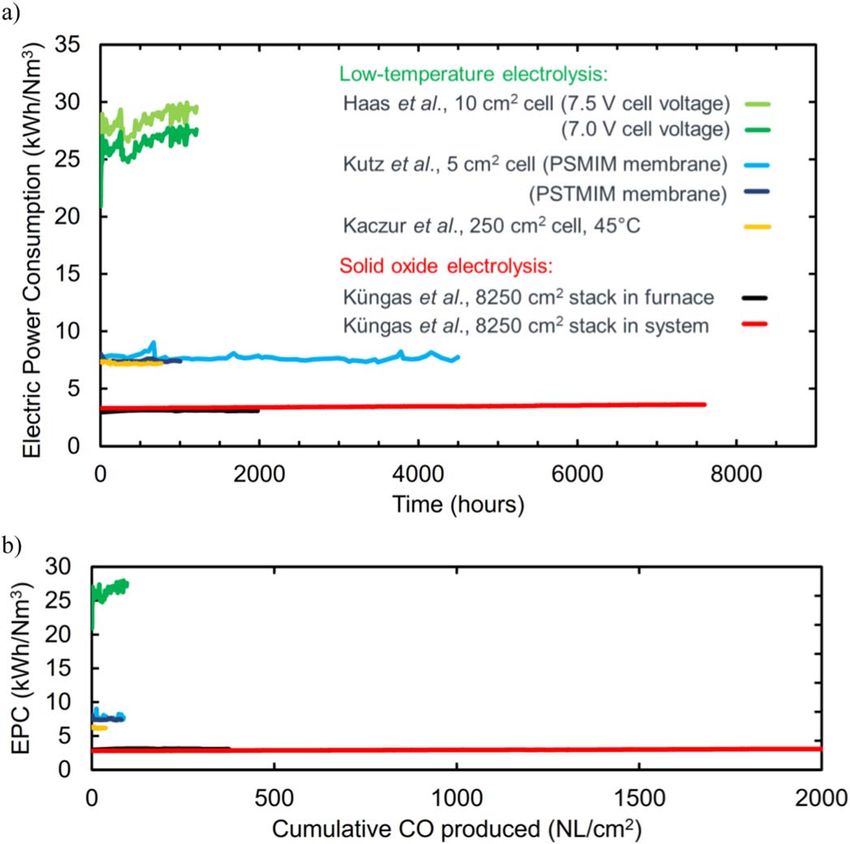
Journal of The Electrochemical Society, 2020 167 044508
to as the fuel electrode), carbon dioxide is reduced to carbon reversible operation (regular switching between the two modes)
monoxide, following the reaction substantially lowers degradation rates on cell level.36 Dynamic
operation, i.e. operation mode where the electrolysis current is
CO 2 + 2e- CO + O 2 -. [4] constantly changing in response to changes in electricity supply (due
The electrons for the reaction are provided by an external power to e.g. fluctuations in the availability of wind or solar energy in the
supply. The oxide ions (O2−) formed in the reaction are incorporated grid), has also been demonstrated and seems not to affect cell and
into the electrolyte and traverse through the electrode into the anode stack degradation rates.37 A small CO2 electrolysis system based on
(also called the oxygen electrode), where the ions are oxidized into SOECs will soon be tested on Mars as part of NASA’s Mars Oxygen
molecular oxygen according to the reaction ISRU Experiment (MOXIE).38
O 2 - ½ O 2 + 2 e-. [5] Molten carbonate electrolysis.—In molten carbonate electrolysis
The formed oxygen gas is led out of the cell via gas channels. It is cells (MCECs), the electrolyte is a carbonate melt. Similarly to solid
important to note that as long as pure CO2 (or a mixture of CO and oxide cells, first attempts to carry out CO2 electrolysis in carbonate
CO2) is fed to the fuel electrode, the formed product will be free of melts relied on cell chemistries used in molten carbonate fuel cells
H2 and H2O—a feat that is non-trivial for some alternative CO2 (MCFCs).20,39,40 However, it soon became apparent that neither the
electrolysis technologies. Ni electrodes or Li-Na-K carbonate eutectic electrolytes, both
Composites of metallic Ni and either CGO or YSZ are the most commonly used in MCFCs, are suitable for use in MCECs. Under
commonly used materials in SOEC fuel electrodes. In these required operating conditions (500 °C–800 °C, applied cathodic
electrodes, Ni acts as an electronic conductor and catalyst, while potential), Ni cathodes coke almost instantaneously and a mixture of
the electrolyte material provides ionic conductivity and helps to alkali metals subsequently intercalates the resulting surface graphite
stabilize the electrode microstructure. Alternative electrode mate- layer, leading to complete deactivation of the electrode.20 These
rials, which address the inherent weaknesses of nickel, such as challenges can be overcome by changing the cell chemistry: a
sensitivity to sulfur poisoning, its tendency to coke and instability combination of molten Li2O/Li2CO3 electrolyte, a titanium cathode
towards redox cycling, have successfully been demonstrated on cell and a graphite anode has been shown to give promising
and short stack level.24–29 Typical oxygen electrode materials for results.20,41,42 In this material system, carbonate ions are reduced
SOECs include doped perovskites of lanthanides and transition to CO and oxide ions at the cathode according to reaction
metals, such as Sr-doped LaMnO3 (LSM), Sr-doped La(Fe,Co)O3
CO3 2 - + 2 e- CO + 2 O 2 -, [ 6]
(LSCF), Sr-doped SmCoO3 (SSC) and many others.30–35
SOEC technology relies heavily on decades-long research and while oxide ions are oxidized to gaseous oxygen at the anode:
development effort that has gone into commercializing solid oxide
fuel cells (SOFCs), i.e. ceramic devices that produce electricity via O 2 - ½ O 2 + 2 e-. [7]
electrochemical oxidation of fuel, such as methane. The same In other words, Li2CO3 is electrochemically converted into Li2O on
materials, cells and stacks can often be used interchangeably in the cathode, thereby increasing the Li2O/Li2CO3 ratio in the melt.
fuel cell or electrolysis mode. In fact, it has recently been shown that As the oxide content in the electrolyte increases, new CO2 can
Figure 2. Schematic illustrations of some electrolysis cell designs used for electrochemical CO production: (a) solid oxide electrolysis cell, (b) molten carbonate
electrolysis cell (based on20), (c) low-temperature electrolysis cell in H-cell configuration, (d) low-temperature electrolysis cell with gas-diffusion electrode as
cathode.21,22,23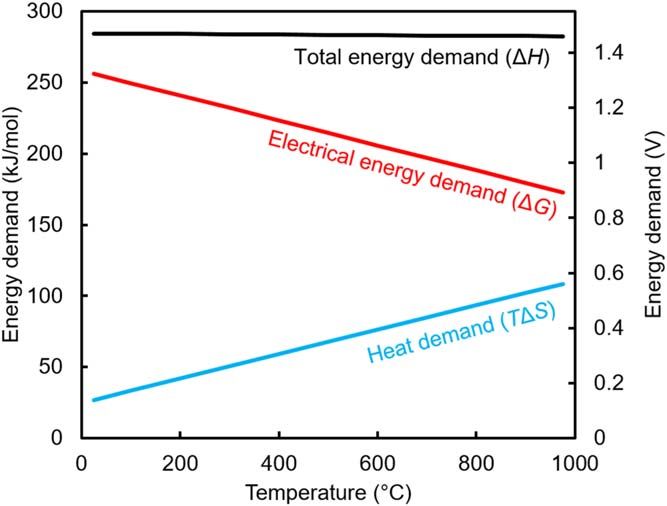
Journal of The Electrochemical Society, 2020 167 044508
Figure 3. Cartoon illustrating the relative saturated concentrations, CCO2, and diffusion coefficients, DCO2, for (a) CO2 in aqueous solution at 25 °C, (b)
humidified gaseous CO2 at 25 °C, (c) dry CO2 at 800 °C. Adapted with permission from Weekes et al., Acc. Chem. Res., 51, 910 (2018). Copyright 2018
American Chemical Society.
chemically be incorporated into the mixture: On the cathode, CO2 is electrochemically reduced to CO:
Li2 O + CO 2 Li2 CO3. [8] CO 2 + H2 O + 2 e- CO + 2 OH-. [11]
The ratio of Li2O/Li2CO3 in the electrolyte is thereby a function of
In contrast to the high-temperature systems, ensuring high
both by the applied current density and the concentration of CO2 above
selectivity towards reaction 11 is often non-trivial in aqueous
the melt. A schematic of such an electrolysis cell is shown in Fig. 2b.
systems. Commonly, CO production is accompanied by hydrogen
A key advantage of MCECs is that the CO2 feed and the CO and
evolution, which in alkaline media proceeds via reaction
O2 products do not mix, allowing pure gases to be extracted from the
cell. Additionally, the method is only mildly affected by SO2-content 2 H2 O + 2 e- 2 OH- + H2. [12]
in the feed gas, and can potentially use dilute and humid CO2
streams, suggesting that industrial flue gases may be used as feed.41 At high current densities, some of the CO2 on the cathode may be
The main challenge remains corrosion: Li2O/Li2CO3 melts dissolve converted into bicarbonate or carbonate ions, which can diffuse
alumina, zirconia, Pt and Au. The longest reported test in the through the solid electrolyte membrane (or the liquid electrolyte),
described MCEC system spanned 100–120 h.20,42 and reach to the anode side.44 In such a case, O2 evolution is
accompanied by the evolution of CO2 on the anode, which proceeds
Low-temperature electrolysis.—In low-temperature electrolysis via either of the two reactions:
cells, CO2 reduction is carried out in aqueous solutions. The
electrolytes can either be solid ion-selective membranes (e.g. HCO3- + H+ CO 2 + H2 O [13]
Nafion, Sustainion), aqueous solutions (e.g. KHCO3), or combina-
tions thereof.21 As with solid oxide and molten carbonate electrolysis CO3 2 - + 2 H+ CO 2 + H2 O. [14]
cells, early electrolyzer designs (see e.g. in Ref. 21) were derived
The H-cell configuration suffers from two serious shortcomings.
from polymer electrolyte membrane fuel cells (PEMFCs) and made
Firstly, the cathodic current becomes rate-limiting at current
use of membrane-electrode assemblies (MEAs) suited for operation
densities above 30 mA cm−2 23 due to the low solubility and slow
in acidic conditions. Unfortunately, the acidic environment severely
diffusion of CO2 in water at ambient conditions (Fig. 3). The
reduces the selectivity of cathode materials towards CO2 reduction,
delivery of gas-phase CO2 to the cathode and the use of gas-diffusion
resulting in almost all the current being used for the competing
electrodes (Fig. 2d) present means of overcoming mass transport
hydrogen evolution reaction.21,43,22 Consequently, most of the low-
limitations in low-temperature electrolysis systems. In some designs,
temperature electrolysis cells today operate in alkaline or pH-neutral
gas-diffusion electrodes are employed in both electrodes.22,23,45,46
conditions. It should be noted at industrially relevant current
Despite its scarcity and high cost, IrO2 (at loadings of e.g.
densities (>200 mA cm−2), the local pH near the cathode will
4.25 mg cm−2 45) is used almost exclusively as the catalyst material
inevitably be very alkaline, even if neutral electrolytes are used.22
on the anode side of aqueous electrolysis cells.47 Cathode materials
Most of the electrode development work on electrochemical CO2
for the production of CO typically include Ag and Au, with catalyst
reduction has been carried out using a cell configuration where both
supports shown to play an important role for activity, selectivity, and
electrolyzer electrodes are immersed in electrolyte solutions (the
stability. Best results have been obtained using Ag nanoparticles
anolyte and catholyte, respectively).22 Such an electrode configura-
dispersed on multi-walled carbon nanotubes,46 Au nanoparticles on
tion is referred to as the H-cell.22,23,44 A schematic of an electrolyzer
polymer (poly(2,2′-(2,6-pyridine)−5,5′-bibenzimidazole), PyPBI)
employing the H-cell configuration with an anion-conducting
wrapped multi-walled carbon nanotubes,45 and Ag on Teflon48,49
electrolyte membrane is shown in Fig. 2c.
at loadings ranging from 1 mg cm−2 45,46 to 250 mg cm−2.48
On the anode of such a cell, oxygen evolution proceeds according
Much of the aqueous CO2 electrolysis work has been carried out
to either of the two reactions:
on small electrodes (typically ⩽1 cm2), for short times and in
2 OH- ½ O 2 + H2 O + 2 e- [9] idealized (e.g. microfluidic) settings, with a few notable exceptions:
Haas et al. have demonstrated the testing of 10 cm2 electrodes for
H2 O ½ O 2 + 2 H+ +2 e-. [10] 1200 h,49 Kutz et al. have studied the durability of 5 cm2 MEAsJournal of The Electrochemical Society, 2020 167 044508
based on anion-conductive membranes for 4380 h,50 Kaczur et al. case is provided by Haas et al.: a cell operating at a total current
have performed a stability test of a 250 cm2 single cell,51 and density of 175 mA cm−2 at 5.3 V and FE of 35.5% translates into a
Endrődi et al. reported an 8-hour test for a first-of-its-kind 3-cell CO-specific current density of only 62 mA cm−2.49 Polarization
stack with a total active area of 183 cm2.52 curves in Fig. 4b illustrate the general performance differences
between the three different types of electrolysis technologies. Due to
the high operating temperature, the overpotentials associated with
Figures of Merit
CO2 reduction and oxygen evolution are low in molten carbonate
Technologies introduced in the previous section originate from and solid oxide systems: at a CO current density of 200 mA cm−2,
three distinct scientific fields, each with their own technical language the selected SOECs operate in a voltage range of 1.0 V (cell level56)
and longstanding conventions. For example, while the process of to 1.13 V (stack level57) and the MCEC reported by Kaplan et al.
converting CO2 to chemicals is commonly referred to as electro- operates at 1.15 V.20 At the same CO production rate, cell voltages
chemical CO2 reduction reaction (abbreviated as CO2RR) by the for low-temperature CO2 electrolyzers range from 2.5 V to 4.4 V
aqueous electrolysis community,23,53,54 groups working on solid (Table I). On stack level, jCO of 183 mA cm−2 has been demon-
oxide systems prefer the term CO2 electrolysis.15,27 Perhaps this strated at an average cell voltage of 3 V.52
difference in terminology can help explain why many of the recent The higher the CO-specific current density, the higher the
review papers on the topic seem to completely ignore the existence production rate of the electrolyzer per unit area. Systems operating
of high-temperature CO2 electrolysis technologies.43,54,55 at high CO production rates are thereby generally more compact.
Furthermore, the high- and low-temperature electrolysis fields use More importantly, high CO production rates help reduce the capital
very different figures of merit, which makes comparisons between the expenditure of a CO production plant, as less catalyst and active area
technologies difficult. Metrics, such as Faradaic efficiency and is needed for producing a fixed amount of gas. Compared to low-
energetic efficiency are widely used by the low-temperature CO2 temperature CO2 electrolyzers, MCECs and SOECs can operate at
electrolysis community, but almost never mentioned in publications significantly higher current densities: none of the low-temperature
on high-temperature CO2 electrolysis. Instead, the high-temperature systems shown in Fig. 4b can sustain jCO values above 400 mA cm−2,
community often employ area-specific resistance as a performance while SOECs routinely operate at current densities exceeding
parameter, a metric very rarely used in publications on CO2RR. 750 mA cm−2.27,56,57 Comparable or even higher current densities
Below, the performance of state-of-the-art solid oxide, molten can be achieved in MCECs: the MCEC data plotted in Fig. 4 originate
carbonate and low-temperature CO2 electrolyzers is compared using from Li2CO3 decomposition measurements, but current densities up
some of the most common figures of merit from each field. to 3 A cm−2 have been demonstrated in transient polarization
measurements (cyclic voltammetry at 50 mV s−1) at 900 °C.20
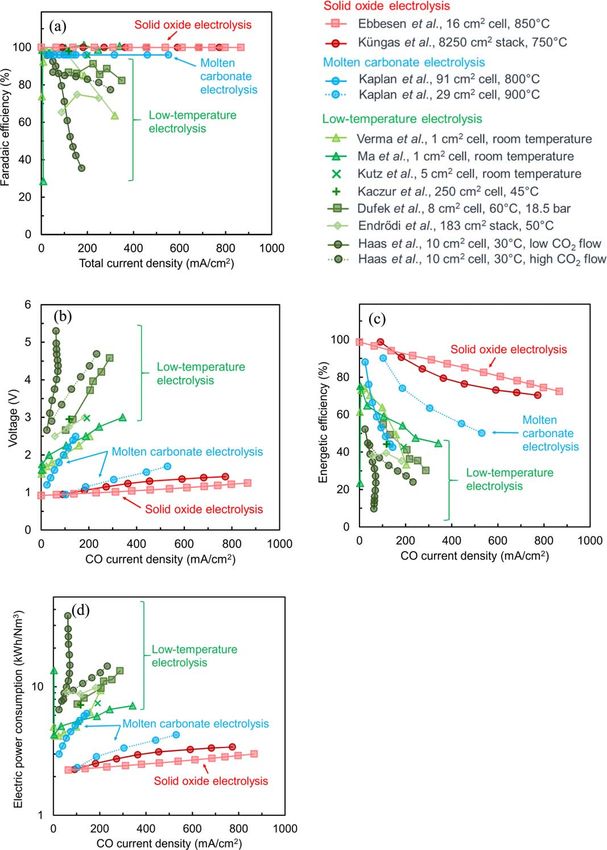
Faradaic efficiency.—Faradaic efficiency (FE) is a measure of Area-specific resistance (ASR) is the slope of the polarization
selectivity for the electrochemical process. In the context of CO2 curve at a given current density. ASR is commonly used to
electrolysis for CO production, FE is defined as the fraction of total characterize the performance of SOECs59 but is rarely used for
electrolysis current that is used towards reducing CO2 to CO.55 low-temperature cells. For direct comparison, the ASR was estimated
Obtaining FE efficiencies close to unity is non-trivial in aqueous at jCO = 200 ± 30 mA cm−2 for each of the electrolyzers shown in
systems, where the CO2RR competes with the hydrogen evolution Fig. 4. The resulting ASR values are summarized in Table I. The solid
reaction (Eq. 12) and with other side-reactions, such as the oxide cell by Ebbesen et al. had the lowest ASR (0.3 Ω cm2 56). On
production of hydrocarbons or oxygenates.21,43,49,55 There are two the stack level, Küngas et al. have reported an ASR of 1.1 Ω cm2.57
main reasons why low FE values are problematic: 1) because some The ASR for the MCEC developed by Kaplan et al. was 1.9 Ω cm2 at
of the applied current is wasted on making undesirable side- 900 °C,20 while the resistances of low-temperature systems were
products, 2) because the desired product needs to be separated significantly higher, ranging from 3.2 to 13.5 Ω cm2. At higher current
from the formed side-products, and any separation processes densities, the ASR tends to decrease. For example, the ASR of the
inevitably require additional energy input. SOEC stack was only 0.34 Ω cm2 at 680 mA cm−2,57 while that of the
In molten carbonate and solid oxide electrolysis systems, the FE MCEC cell was 1.6 Ω cm2 at 440 mA cm−2.20
towards CO production is very close to 100%, and deviations from this
value tend to indicate that the cells have been operated outside the safe
Energetic efficiency.—Energetic efficiency (EE) is a commonly
operating window, e.g. under conditions where coking occurs.20,56
used performance metric for low-temperature electrolyzers. For the
Figure 4a plots FE for a number of tests reported in the literature for
electrochemical conversion of CO2 to CO, EE is defined as
low-temperature, molten carbonate and solid oxide CO2 electrolyzers
as a function of total current density. The selectivity towards CO E 0 · (FE ) E 0 · (FE )
production typically decreases rapidly for low-temperature systems at EE = = , [15]
higher current densities, even in ideal conditions in small or micro- E +h
0 E
fluidic cells.21,43,46 A notable exception is the cell reported by Verma where E0 is the reversible cell voltage (Eqs. 2 and 3), FE is Faradaic
et al., which retained FE values very close to 100% at current densities efficiency, η is the cell overpotential, and E = E0 + η is the cell
up to 340 mA cm−2.45 More typical FE values for low-temperature potential at the desired current density. In other words, EE
systems at these current densities range from 60% to 90%. Endrődi characterizes the efficiency of converting applied electric potential
et al. have demonstrated an FE of 73% at 250 mA cm−2 in a short into the desired product (CO), combining the effect of losses due to
stack with a total active area of 183 cm2.52 State-of-the-art solid oxide non-ideal selectivity (FE) and polarization losses (η). An electro-
electrolyzer stacks with an active area of 8250 cm2 operate at 100% chemical process with 100% FE and negligible cell overpotential
Faradaic efficiencies at current densities exceeding 750 mA cm−2.57 would thus have an EE of 100%. It is evident from Eq. 15 that only
the electrochemical processes in the electrolysis cell are considered,
Polarization curves and area-specific resistance.—Plotting the and efficiency losses due to e.g. blowers or electrolyte recirculation
operating voltage of a cell as a function of current density is perhaps pumps (Figs. 2c, 2d) are not taken into account, although such losses
the simplest way to characterize an electrolyzer. Here, it is important may be substantial. EE values for selected electrolyzers are shown in
to note that for a direct comparison of cell performance at a fixed CO Fig. 4c as a function of jCO. At a CO-specific current density of 200
production rate, the CO-specific current density, jCO (i.e. total ± 30 mA cm−2, EE is >90% for the two solid oxide electrolyzers,
current density multiplied by the FE towards CO production) should 74% for the MCEC by Kaplan et al. at 900 °C,20 and between 27%
be used as the horizontal axis for polarization curves. An extreme and 54% for the considered low-temperature electrolyzers (Table I).Journal of The Electrochemical Society, 2020 167 044508
Figure 4. Comparison of state-of-the-art low-tempera-
ture, molten carbonate and solid oxide electrolyzers:
(a) Faradaic efficiency towards CO production as a
function of total current density, and (b) cell voltage,
(c) energy efficiency (EE), and (d) electric power
consumption (EPC) as a function of CO-specific current
density. The data originate from Ebbesen et al.,56
Küngas et al.,57 Kaplan et al.,20 Verma et al.,45 Ma et
al.,46 Kutz et al.,50 Kaczur et al.,51 Dufek et al.,58
Endrődi et al.,52 Haas et al.49 The Faradaic efficiencies
for Ref. 20 were estimated based on chromatographic
measurements done at a single operating point (900 °C,
132 mA cm−2). The Faradaic efficiency of the cell by
Ebbesen et al. was estimated to be 100%, since no
coking was observed.56 The Faradaic efficiency of 100%
reported by Küngas et al. on stack level has been verified
by chromatographic measurements.57
EE of solid oxide cells remains above 70% even at current densities electric energy (typically expressed in kWh) that is required for
of 700–800 mA cm−2, while the selected MCEC can achieve 50% producing 1 Nm3 of product gas, i.e. CO. The formula for
EE at 530 mA cm−2. The superior performance of SOECs can be calculating EPC is given as
explained by the combination of the high FE as well as low cell
overpotentials. E·n·F
EPC = , [16]
(FE ) · Vm
Electric power consumption.—Electric power consumption
(EPC) is another measure of electrolyzer efficiency often used to where E is the cell voltage, n is the number of transferred electrons
describe the performance of alkaline, PEM, and solid oxide (n = 2 for electroreduction of CO2 to CO), F is Faraday’s constant,
electrolyzers for H2 production.60 EPC characterizes the amount of FE is Faradaic efficiency and Vm is the molar volume of ideal gasJournal of The Electrochemical Society, 2020 167 044508
Table I. Composition and performance metrics of low-temperature, molten carbonate and solid oxide electrolysis cells for electrochemical
conversion of CO2 into CO, evaluated at a CO-specific current density of 200 ± 30 mA cm−2. All abbreviations are explained in the main text, except
for PTFE, which stands for poly(tetrafluoroethylene), and MMO, which stands for mixed metal oxide. For most studies, the reported ASR was
calculated from current-voltage curves, but for Ref. 50 and Ref. 51, ASR had to be estimated from a single operating point.
References Cell composition FE Voltage (V) ASR (Ω cm2) EE EPC (kWh/Nm3)
Ebbesen et al.56 LSM-YSZ ∣ YSZ ∣ Ni-YSZ 100% 1.0 0.3 92% 2.4
Küngas et al.57 LSCF-CGO ∣ CGO ∣ YSZ ∣ Ni-YSZ 100% 1.1 1.1 91% 2.5
Kaplan et al.20 Graphite ∣ Li2O-Li2CO3 ∣ Ti >96% 1.1 1.9 74% 2.9
Verma et al.45 IrO2/C-Nafion ∣ KOH ∣ Au-MWCNT-PyPBI-Nafion/C 64% 2.5 4.8 33% 9.4
Ma et al.46 IrO2/C-Nafion ∣ KOH ∣ Ag/MWCNT-Nafion 101% 2.5 3.6 54% 5.9
Kutz et al.50 IrO2/C-PTFE ∣ Sustanion ∣ Ag/C 96% 3.0 8.3 43% 7.4
Kaczur et al.51 IrO2/C ∣ KHCO3 ∣ Sustanion-PTFE ∣ Ag/C 98% 3.0 13.5 44% 7.2
Dufek et al.58 IrO2/Ni ∣ KOH ∣ Nafion ∣ K2SO4 ∣ Ag/C 91% 3.7 11.5 41% 9.8
Endrődi et al.52 Ir/Ti ∣ KHCO3 ∣ Sustanion-PTFE ∣ Ag/C 73% 3 3.8 35% 9.8
Haas et al.49 IrO2/MMO ∣ K2SO4-KHCO3 ∣ ZrO2 ∣ K2SO4-KHCO3 ∣ Ag 81% 4.4 9.1 27% 12.9
under normal conditions. EPC is therefore inversely proportional to Surprisingly, comparing long-term performance data of low- and
EE. The usefulness of EPC lies in the fact that it can be used for the high-temperature CO2 electrolysis cells is non-trivial. This is firstly
dimensioning of power supplies and for estimating heating/cooling due to the relative lack of long-term performance data on low-
needs. Theoretically, an electrochemical CO2 reduction process with temperature CO2 electrolyzers: tests lasting for just a few hours may
100% FE operating at the reversible cell voltage of 1.33 V at 25 °C be referred to as “durability tests” in aqueous CO2RR literature.
has a EPC of 3.2 kWh Nm−3, while the corresponding theoretical Secondly, it is rather common practice in low-temperature electro-
minimal EPC at 800 °C is 2.3 kWh Nm−3 (these values are lysis studies to report durability in terms of FE as a function of time
dependent on gas composition, as discussed in section 2). An without providing the corresponding current or voltage data, when
electrolyzer operating at 5 kWh Nm−3 and 100% FE at 25 °C would the cell is operated either potentiostatically or galvanostatically,
thereby generate 1.8 kWh waste heat for every Nm3 of CO produced. respectively. Thirdly, sometimes the stability of a single polarized
EPC values for state-of-the-art electrolyzers for CO production electrode, and not that of a full cell is reported.
are plotted on a logarithmic scale in Fig. 4d as a function of CO- Long-term performance data for selected electrolyzers are shown
specific current density (jCO). The EPC for solid oxide electrolyzers, in Fig. 5. The electrolyzer performance is evaluated in terms of EPC,
even on stack level, remains below 3.4 kWh Nm−3, even at very since it allows tests performed under potentiostatic and galvanostatic
high current densities. At a current density of around 200 mA cm−2, conditions to be directly compared, and combines efficiency losses
EPC of 2.5 kWh Nm−3 can be achieved, but the gains in efficiency due to resistance increase and FE drop in a single performance
(and therefore operating expenditure) at these low currents need to metric. In Fig. 5a, the EPC of tested cells or stacks is plotted as a
be weighed against the higher capital costs for the system. Generally, function of operating time. Two SOEC stack tests are included: a
waste heat from the high-temperature process can be used to provide 2000-hour test at a current density of 450 mA cm−2 using the same
part of the heat demand (TΔS) for the process (see Fig. 1), thereby stack as reported in Fig. 4,57,61 and a 7600-hour test at a current
decreasing the amount of heat that needs to be provided by other density of 640 mA cm−2 for a different stack operated in a system
means. When a high-temperature electrolysis cell is operated at consisting of two stacks, heaters and heat exchangers.62 The EPC for
thermoneutral voltage, the heat demand for the electrolysis process the first stack was 2.96 kWh Nm−3 at the beginning of the test and
matches exactly the heat produced via Joule heating.15 3.06 kWh Nm−3 at the end of the test, corresponding to an average
The EPC for low-temperature electrolyzers is considerably cell voltage of 1.24 V and 1.28 V, respectively. Voltage degradation
higher: the best of the aqueous cells in Fig. 4d operate at 7.1 kWh rate was 2.2%V/1000 h, which is comparable to the degradation rate
Nm−3 at jCO of 340 mA cm−2,46 while the EPC of another cell of state-of-the-art SOEC stacks operating in steam electrolysis.16,59
ranges from 11.1 to 35.7 kWh Nm−3 at a jCO of around The performance of the stack operated in a system was similar, with
60 mA cm−2.49 Operating a cell under conditions reported in a degradation rate of 1.2%–1.3%V/1000 h. The SOEC stacks
Haas et al.,49 i.e. an EPC of 35.7 kWh Nm−3 CO, an FE towards thereby significantly outperformed the low-temperature electrolysis
CO production of 35.5% and FE towards H2 of 64.5% implies that cells, which operated at EPCs above 7.5 kWh Nm−3. A 4380-hour
for every Nm3 of CO, 1.8 Nm3 of H2 and 27 kWh of low-quality performance test reported by Kutz et al. for a cell based on an
waste heat are produced. The 3-cell stack by Endrődi et al. operates imidazolium-functionalized polymer (PSMIM) as electrolyte is the
at an EPC between 8.8 and 9.8 kWh Nm−3 CO.52 Even at an EPC longest published test of a low-temperature electrolysis cell for CO
of 8.8 kWh Nm−3 CO, the amount of cooling water to retain a production.49 The EPC for the cell was between 7.5 and 9.0 kWh
constant cell temperature is considerable. Nm−3 throughout the test. The voltage required to operate at
50 mA cm−2 decreased (i.e. performance improved) slightly during
Degradation rate.—Due to the high capital cost of electrolysis operation, and FE remained above 90% for 4000 h, dropping to
units, it is important that the cells or stacks produce as much CO gas below 85% only by the end of the test due to flooding.49 A cell made
during their lifetime as possible. It can be argued that some level of with a different polymer (PSTMIM) operated at similar EPC, but a
voltage degradation (resistance increase) is acceptable, as long as the higher current density (200 mA cm−2). The low-temperature cell
electrolysis unit is producing gas that satisfies some pre-determined jointly developed by Covestro, Siemens, and Evonik demonstrated
system output requirements (typically related to gas purity and good durability in a 1200-hour test performed at 30 °C at a total
production rate). Similarly, some loss of FE may be acceptable, if current density of 300 mA cm−2.48 Unfortunately, the FE of the cell
the downstream separation system is able to handle the increasing towards CO production dropped from 80% to around 60% during the
amounts of hydrogen or other undesired side-products originating test, and the cell voltage required to run the test (between 7.0 V and
from the electrolysis unit. Steady cell performance with a low 7.5 V) translates into EPC values above 25 kWh Nm−3.
degradation rate, both in terms of voltage and FE, is nevertheless The tests shown in Fig. 5a were all performed at different current
desired in order to maintain the efficiency of the electrolyzer. densities and hence at different CO production rates. Since the mainJournal of The Electrochemical Society, 2020 167 044508
Figure 5. Long-term performance data for Haas et al.,49 Kutz et al.,50 Kaczur et al.,51 and Küngas et al.57,61,62: (a) electric power consumption (EPC), plotted as
a function of operating time, (b) EPC plotted as a function of cumulative CO produced (in normal liters per cell active area). The dark and light green lines mark
the minimum and maximum range for the EPC for Haas et al.,49 since only a cell voltage range (between 7 and 7.5 V) was reported in the original paper. PSMIM
stands for polystyrene methyl methylimidazolium chloride, PSTMIM for polystyrene tetramethyl methylimidazolium chloride. Data from tests lasting less than 8
h45,58 were excluded. The MCEC by Kaplan et al. has been tested for 100–120 h, but the data are not public.20,42
task of an electrolysis unit is to produce as much of the desired comparisons with the vast heterogeneous catalysis literature. Some
product during its lifetime as possible (a metric sometimes referred TOF values have been reported for CO2RR catalysts, albeit not for
to as lifetime capacity63), it is insightful to plot EPC of electrolyzers CO production.64 TON values have been reported for Ag-based
as a function of the cumulative amount of CO produced. In order to catalysts for alkaline low-temperature electrolysis.50 Unfortunately,
make the systems with different electrode active areas (stacks vs not enough data on the specific surface area of the used catalysts are
single-cells) more directly comparable, performance can be plotted available to warrant estimating TOF and TON for electrolyzers
as a function of the cumulative CO produced (in units of volume) per reported in Fig. 4.
unit of cell active area, as has been done in Fig. 5b. The usefulness
of the above metric becomes apparent when considering the
Industrial Perspective
following examples. An alkaline electrolysis cell with PSMIM
polymer was operated at 50 mA cm−2 for almost 4400 h.50 The direct comparison of different electrolysis technologies for
Another alkaline cell with a modified (PSTMIM) membrane was CO production, presented in the previous section, can be used as
operated at a current density that was four times higher for a period input for technoeconomic comparisons of the technologies. Some
that was roughly four times shorter.50 However, both cells produced insights may be obtained by comparing state-of-the-art performance
almost the same amount of desired product during the respective of different electrolyzers to the list of “base case” performance
tests, 174 and 161 NL of CO per cm2 cell area, respectively. It is metrics assumed by recently published technoeconomic
further clear that the productivity of SOEC electrolyzers is sig- studies.54,65,66 A list of assumptions from two such studies is
nificantly higher than that of low-temperature electrolyzers. This is a provided in Table II, along with a qualitative estimate on to which
direct consequence of the generally lower current densities and extent the electrolysis technologies considered in this paper are
lower Faradaic efficiencies attainable in low-temperature cells. satisfying the listed requirements.
Some of the assumptions in Table II, specifically these describing
Other performance metrics.—It would be interesting to compare the scale of the electrolysis processes and the lifetime of the system,
the activity and stability of CO2RR catalysts in terms of turnover remain at present challenging for all electrolysis technologies. Jouny
frequencies (TOF) and turnover numbers (TON) to allow for direct et al. assumed a plant producing 100 tonnes of CO per day with aJournal of The Electrochemical Society, 2020 167 044508
Table II. A selected list of assumptions for “base case” scenarios from two recent technoeconomic analyses, and estimates on how well low-
temperature, molten carbonate, and solid oxide electrolysis cells are fulfilling the requirements. EPC values have been calculated based on assumed
cell voltage and FE values. Green symbols denote requirements that are considered to be easily achievable, yellow symbols requirements that have
been demonstrated in some cells or systems, red symbols requirements which have not been satisfied by any cells tested to date. Question marks
denote requirements which are presently difficult to evaluate.
Jouny De Luna Low-temperature Molten carbonate Solid oxide
Parameter et al.65 et al.54 electrolysis electrolysis electrolysis
Production rate (tonne day−1) 100 115 — — —
Current density (mA cm−2) 200 600 ? + +
Electric power consumption (kWh Nm−3) 6.1 5.05 ? ? +
System lifetime (years) 20 30 — — —
Operating time (days/year) 350 292 ? ? ?
Electrolyzer cost (USD m.2) 1840 3420 ? ? ?
system lifetime of 20 years,65 while De Luna et al. assumed a being lower for SOEC. Secondly, the CO production rate of an
production rate of 115 tonnes of CO per day with a system lifetime SOEC stack operating at 800 mA cm−2 and an equally priced low-
of 30 years.54 To date, no electrolysis plants been designed or temperature electrolysis stack operating at 200 mA cm−2 (at 100%
operated at the assumed scale, nor are any of the considered FE) differs by a factor of four. This implies that four times as many
electrolysis technologies currently living up to the system lifetime low-temperature stacks would have to be installed in order to
requirements. This is either because no systems tests exceeding a achieve similar CO production capacity.
few years have been performed (SOEC) or because systems are yet Based on the current state-of-the-art, it is clear that several
to be designed at built (MCEC, low-temperature electrolysis). scientific and technological breakthroughs are needed before low-
Assumed current densities seem at present to be out of reach for temperature CO2 electrolysis can become industrially feasible. A
most state-of-the-art low-temperature cells, especially when com- roadmap for CO2RR has recently been developed within EU’s
bined with the efficiency requirement (an EPC below 5–6 kWh EnergyX program and is reproduced in Table III. Based on the table,
Nm−3). In contrast, molten carbonate and solid oxide systems have current densities of 1000 mA cm−2 have to be achieved for industrial
demonstrated substantially lower EPC values at similar or higher relevance, while simultaneously decreasing the cell voltage to
current densities. At the time of writing, no plant-level data are around 2.0–2.2 V. Significant increases in Faradaic efficiency and
available for any of the technologies to assess the attainability of single-pass efficiency need to be demonstrated and cell durability
plant availability estimates (292–350 days/year). has to increase to beyond 10000 h. While not specifically mentioned
In order to satisfy the “base case” assumptions for electrolyzer in the roadmap, it is further apparent that upscaling some of the best-
cost, the price of CO2 electrolysis units needs to reach levels similar performing low-temperature cells (e.g. Refs. 45 and 46) requires
to today’s alkaline or PEM electrolysis systems for H2 production. A significant advancements in the production and purification of
recent manufacturing cost analysis by Pacific Northwest National carbon nanotubes, as well as finding alternatives to IrO2, currently
Laboratory compared the production cost of equal-sized PEM and the catalyst of choice for oxygen evolution in low-temperature cells.
solid oxide fuel cell stacks as a function of stack power and The issue of K2CO3 precipitation on the cathode side remains an
production volume.67 At a production rate of 50 000 stacks per issue preventing stable stationary operation in CO2 electrolyzers
year, the expected production cost of stacks rated to 25-kW in fuel using anion exchange membranes and alkaline solutions.52 None of
cell mode was slightly above 6000 USD (570–590 USD/m2). The the challenges mentioned above have obvious and easily available
material costs accounted for 44% of total stack manufacturing costs solutions. The low-temperature CO2 electrolysis technology is
for the solid oxide stack, but 62% for the PEM fuel cell stack.67 presently estimated to be at a TRL of 4 (Technology validated in
While the catalyst used in PEM fuel cell stacks (analysis assumed lab).18
0.4 mg Pt per cm2 for both electrodes) differs from catalysts used in Molten carbonate electrolysis has currently only been demon-
low-temperature electrolysis cells (IrO2 on anode at loadings strated on cell level, although using relatively large electrodes
>1 mg cm−2, and gold or silver on the cathode), the cost for low- (>90 cm2).20 The technology has several interesting features, such
temperature electrolysis stacks is expected to be comparable to PEM as the promise of very high current densities, FE and conversion
fuel cell stacks. This has two important implications. Firstly, the values approaching 100%,20 as well as the ability to use flue gas
future stack production costs for solid oxide and low-temperature streams with low CO2 and high sulfur content.41 The corrosivity of
electrolysis technologies are likely to be similar, with material costs molten carbonates severely limits the choice of materials that can be
53
Table III. Roadmap for CO2RR. Reproduced with permission from Ref.
State-of-the-art 5 years 10 years
Catalysts Ag, Cu, Fe- and Co-based Metallic, non-metallic,
molecular catalysts molecular, bio and hybrid
Current density 100–300 mA cm−2 500 mA cm−2 1000 mA cm−2
Stable cell voltage 3.0 V 2.5 V 2.0–2.2 V
Faradaic efficiency 95% for CO and HCOOH 100% for CO and HCOOH Other products with reasonable FE
60%–70% C2H4
Single-pass efficiency 10%–30% 40% 60%
Stability > 100 h > 1000 h > 10000 h
Practical Deliverables EU test beds with realistic Pilot plant industrial electrolyzers for CO,
feedstocks, EU labs for testing and HCOOH and C2H4 (10 000 t/year) Pilot scale
benchmarking 1 kW electrolyzers plants for value-added products (halides, H2O2,
organics) and intermittent electricity supplyJournal of The Electrochemical Society, 2020 167 044508
used in MCECs, but a promising set of materials (Ti as cathode, References
graphite as anode) has been identified. The technology is not easily
1. M. M. Fischedick et al., in Climate Change 2014: Mitigation of Climate Change.
“stackable,” but scale-up can be achieved in other ways, as has been Contribution of Working Group III to the Fifth Assessment Report of the
demonstrated by the Hall-Héroult process for aluminum production. intergovernmental panel on Climate Change (Cambridge University Press,
Based on the tests which report using sulfur-containing CO2 as Cambridge, United Kingdom and New York, NY, USA) p. 739 (2014).
feed,41 the molten carbonate CO2 electrolysis technology is pre- 2. Energinet.dk: System Perspective 2035, Long-term Perspectives for Efficient Use
of Renewable Energy in the Danish Energy System, http://en.energinet.dk/system-
sently estimated to be at a TRL of 5 (Technology validated in perspective2035 (2018).
industrially relevant environment).18 No plants using low-tempera- 3. I. Ridjan, K. Hansen, P. Sorknæs, J. Xu, D. Connolly, and B. V. Mathiesen, in The
ture or molten carbonate technology for electrochemical production Role of Electrolysers in Energy System: Energy Markets, Grid Stabilisation and
of CO from CO2 are currently in operation. Transport Fuels. (Aalborg University, Aalborg)https://forskningsdatabasen.dk/en/
catalog/2341980937 (2016).
Solid oxide electrolysis is presently the most effective and mature 4. L. Wang, M. Chen, R. Küngas, T.-E. Lin, S. Diethelm, F. Maréchal, and J. V. Herle,
electrolysis technology for CO production from CO2. A demo-unit Renew. Sust. Energy Rev., 110, 174 (2019).
with a CO production capacity of 12 Nm3 CO per hour was 5. International Aluminium Institute, http://world-aluminium.org/statistics/primary-
commissioned in 2016 by Haldor Topsoe.68 Contracts for the aluminium-smelting-power-consumption/.
6. International Energy Agency (IEA), “Global Energy and CO2 Status Report 2018.”
production of two full-size commercial plants, each with a capacity https://webstore.iea.org/global-energy-co2-status-report-2018 (2019).
of 96 Nm3 CO per hour have been signed, and the plants are to begin 7. World Chlorine Council (WCC), “Sustainable progress report.” https://world-
operations in 2020.69 The contracts have been signed on a chlorine.org/wp-content/uploads/2018/10/WCC_Sustainable-Progress_Version-3-
commercial basis without the need for subsidies. The technology 2017.pdf (2017).
8. D.-Y. Lee, A. A. Elgowainy, and Q. Dai, Lifecycle Greenhouse Gas Emissions of
has thereby been demonstrated in operational environment (corre- By-Product Hydrogen from Chlor-Alkali Plants (ANL/ESD-17/27)., https://greet.
sponding to TRL 7) and TRL 8 (System complete and qualified) is es.anl.gov/files/chlor_alkali_h2 (2017).
likely to be reached in 2020. According to one roadmap, demon- 9. J. Bierhals, in Carbon Monoxide in Ullmann’s Encyclopedia of Industrial
strating a modular electrolysis unit that is scalable to 2000 Nm3/h Chemistry 6th ed.(Wiley-WCH, Weinheim) p. 679 (2002).
10. J. Hietala, A. Vuori, P. Johnsson, I. Pollari, W. Reutemann, and H. Kieczka, in
(approximately 22 kt CO/year) and successfully integrating the unit Formic Acid in Ullmann’s Encyclopedia of Industrial Chemistry (Wiley-WCH,
with downstream chemical conversion technologies is a realistic Weinheim) (2016).
goal for 2024. By 2029, plants at the scale 2000 Nm3/h are 11. W. Bertleff, in Carbonylation in Ullmann’s Encyclopedia of Industrial Chemistry
envisioned to be fully industrial.70 (Wiley-WCH, Weinheim) (2000).
12. J. B. Hansen and P. E. Højlund Nielsen, in Handbook of Heterogeneous Catalysis
2nd ed., Vol. 6, ed. G. Ertl, H. Knözinger, F. Schüth, and J. Weitkamp (Wiley-
Conclusions VCH, Weinheim) p. 2920 (2008).
13. Carbon Monoxide Safetygram, https://airproducts.com/∼/media/Files/PDF/com-
Electrochemical pathways for the preparation of CO have the pany/safetygram-19.pdf.
14. R. Küngas, P. Blennow, T. Heiredal-Clausen, T. Holt, J. Rass-Hansen, S. Primdahl,
potential to change the market landscape by making CO production and J. B. Hansen, ECS Trans., 78, 2879 (2017).
more climate-friendly and decentralized. In this review paper, a 15. S. B. Ebbesen, S. H. Jensen, A. Hauch, and M. B. Mogensen, Chem. Rev., 114,
back-to-back comparison of three competing methods for electro- 10697 (2014).
chemical CO2 reduction into CO, namely low-temperature electro- 16. J. B. Hansen, Faraday Discuss., 182, 9 (2015).
17. R. J. Lim, M. Xie, M. A. Sk, J.-M. Lee, A. Fisher, X. Wang, and K. H. Lim, Catal.
lysis, molten carbonate electrolysis and solid oxide electrolysis is Today, 233, 169 (2014).
reported. Based on the general technological readiness level of the 18. Horizon, - Technology Readiness Levels https://ec.europa.eu/research/participants/
three electrolysis technologies, solid oxide electrolysis stands out as data/ref/h2020/wp/2014_2015/annexes/h2020-wp1415-annex-g-trl_en.pdf (2020).
particularly attractive for wider adoption. In contrast to other 19. V. V. Kharton, F. M. B. Marques, and A. Atkinson, Solid State Ionics, 174, 135
(2004).
considered technologies, CO2 electrolysis using SOEC has been 20. V. Kaplan, E. Wachtel, K. Gartsman, Y. Feldman, and I. J. Lubomirsky,
demonstrated both on stack and system level. Furthermore, the J. Electrochem. Soc., 157, B552 (2010).
SOEC technology offers markedly higher performance, regardless of 21. C. Delacourt, P. L. Ridgway, J. B. Kerr, and J. Newman, J. Electrochem. Soc., 155,
the chosen performance metric (Faradaic efficiency, cell voltage, B42 (2008).
22. T. Burdyny and W. A. Smith, Energy Environ. Sci., 12, 1442 (2019).
area-specific resistance, energetic efficiency or electric power 23. D. M. Weekes, D. A. Salvatore, A. Reyes, A. Huang, and C. P. Berlinguette, Acc.
consumption) and high conversion efficiencies have been verified Chem. Res., 51, 910 (2018).
in stacks with industrially relevant sizes (active area > 8000 cm2). 24. D. Neagu, T.-S. Oh, D. N. Miller, H. Ménard, S. M. Bukhari, S. R. Gamble, R.
The very low efficiency of low-temperature electrolysis cells, J. Gorte, J. M. Vohs, and J. T. S. Irvine, Nature Comm., 6, 8120 (2015).
25. R. J. Gorte and J. M. Vohs, Annu. Rev. Biomol. Eng., 2, 9 (2011).
especially at current densities required for commercialization, raise 26. H. Kim, S. Park, J. M. Vohs, and R. J. Gorte, J. Electrochem. Soc., 148, A639
concerns about the viability of large-scale CO production from CO (2001).
based on low-temperature electrolysis cells. However, low-tempera- 27. F. Bidrawn, G. Kim, G. Corre, J. T. S. Irvine, J. M. Vohs, and R. J. Gorte,
ture electrolysis cells may offer interesting opportunities for the Electrochem. Solid State Lett., 11, B167 (2008).
28. P. Holtappels et al., ECS Trans., 57, 1175 (2013).
direct production of other chemicals, such as formic acid, ethanol, or 29. M. C. Verbraeken, B. Iwanschitz, E. Stefan, M. Cassidy, U. Weissen, A. Mai, and J.
ethylene, none of which can be synthesized directly in molten T. S. Irvine, Fuel Cells, 15, 682 (2015).
carbonate or solid oxide electrolysis systems. Alternatively, low- 30. Y. Zheng, J. Wang, B. Yu, W. Zhang, J. Chen, J. Qiao, and J. Zhang, Chem. Soc.
temperature systems may be advantageously used for the production Rev., 46, 1427 (2017).
31. J. Nielsen and J. Hjelm, Electrochim. Acta, 115, 31 (2014).
of chemicals from CO.71 32. J. M. Serra, V. B. Vert, M. Betz, V. A. C. Haanappel, W. A. Meulenberg, and
F. Tietz, J. Electrochem. Soc., 155, B207 (2008).
33. H. Ullmann, N. Trofimenko, F. Tietz, D. Stöver, and A. Ahmad-Khanlou, Solid
Acknowledgments State Ionics, 138, 79 (2000).
The author would like to thank Poul Georg Moses, Anna 34. J. M. Vohs and R. J. Gorte, Adv. Mater., 21, 943 (2009).
35. S. J. Skinner, Int. J. Inorg. Mater., 3, 113 (2001).
Winiwarter, Thomas Heiredal-Clausen, Peter Blennow, and Tobias 36. C. Graves, S. D. Ebbesen, S. H. Jensen, S. B. Simonsen, and M. B. Mogensen,
Holt Nørby from Haldor Topsøe A/S and Mogens B. Mogensen Nature Mater., 14, 239 (2014).
from DTU Energy for fruitful technical discussions and critical 37. Towards Solid Oxide Electrolysis Plants in 2020, final report https://energi-
comments that helped to significantly improve this paper. The forskning.dk/sites/energiteknologi.dk/files/slutrapporter/forskel_12276_final_re-
port.pdf (2017).
financial support of SYNFUEL (grant number 4106–00006B, 38. J. Hartvigsen, S. Elangovan, J. Elwell, and D. Larsen, ECS Trans., 78, 2953 (2017).
Innovation Fund Denmark) is gratefully acknowledged. 39. M. Halmann and K. Zuckerman, J. Electroanal. Chem., 235, 369 (1987).
40. P. K. Lorenz and G. J. Janz, Electrochim. Acta, 15, 1025 (1970).
ORCID 41. V. Kaplan, E. Wachtel, and I. Lubomirsky, J. Electrochem. Soc., 161, F54 (2014).
42. I. Lubomirsky and V. Kaplan, WO 2010/052714, EP2364381 B1.
Rainer Küngas https://orcid.org/0000-0002-6863-2667 43. Q. Lu and F. Jiao, Nano Energy, 29, 439 (2016).You can also read