On the distributions of fuel droplets and in situ vapor in rotating detonation combustion with prevaporized n-heptane sprays
←
→
Page content transcription
If your browser does not render page correctly, please read the page content below
On the distributions of fuel droplets and in
situ vapor in rotating detonation combustion
with prevaporized n-heptane sprays
Cite as: Phys. Fluids 33, 043307 (2021); https://doi.org/10.1063/5.0045222
Submitted: 24 January 2021 . Accepted: 19 March 2021 . Published Online: 07 April 2021

Qingyang Meng (孟庆洋 ), Ningbo Zhao (赵宁波 ), and              Huangwei Zhang (张黄伟 )

Phys. Fluids 33, 043307 (2021); https://doi.org/10.1063/5.0045222                        33, 043307

© 2021 Author(s).
Physics of Fluids                                                                               ARTICLE           scitation.org/journal/phf

    On the distributions of fuel droplets and in situ
    vapor in rotating detonation combustion
    with prevaporized n-heptane sprays
    Cite as: Phys. Fluids 33, 043307 (2021); doi: 10.1063/5.0045222
    Submitted: 24 January 2021 . Accepted: 19 March 2021 .
    Published Online: 7 April 2021

    Qingyang Meng (孟庆洋),1,2 Ningbo Zhao (赵宁波),1 and Huangwei Zhang (张黄伟)2,a)

    AFFILIATIONS
    1
        College of Power and Energy Engineering, Harbin Engineering University, Harbin 150001, China
    2
        Department of Mechanical Engineering, National University of Singapore, 9 Engineering Drive 1, Singapore 117576,
        Republic of Singapore

    a)
         Author to whom correspondence should be addressed: huangwei.zhang@nus.edu.sg. Tel.: +65 6516 2557. Fax: +65 6779 1459

    ABSTRACT
    Rotating detonation combustion fueled with partially prevaporized n-heptane sprays is studied with the Eulerian–Lagrangian method. A
    flattened two-dimensional domain with periodic boundaries is considered to mimic the annular rotating detonation combustor. This work
    focuses on the effects of prevaporized gas temperature and equivalence ratio on two-phase rotating detonation wave propagation and n-
    heptane droplet vaporization characteristics in the refill zone. The results show that gas temperature has a great impact on n-heptane sprays
    vaporization in the refill zone. The droplet evaporation rate increases with the gas temperature, especially when they are close to the deflagra-
    tion surface. High evaporation rate can be observed for those droplets that are freshly injected into the chamber because they closely interact
    with the hot product gas from the previous cycle of the rotating detonation. A vapor layer between the droplet-laden area and deflagration
    surface exists and high concentrations of n-heptane can be found along the deflagration surface. A conceptual model for the droplet and
    vapor distribution in the refill zone is proposed. The results also show that the blast waves can encroach the refill zone and therefore influ-
    ence the droplet thermodynamic properties inside the refill zone. The blast waves influence the droplet evaporation rate but have limited
    effects on droplet temperature, diameter, and spatial distributions. Also, the detonation propagation speed increases with increased prevapor-
    ized gas temperature and/or equivalence ratio. The detonation cell size decreases and becomes more uniform as the reactant temperature
    increases. Moreover, the size and irregularity of rotating detonation cells increase when the prevaporized gas equivalence ratio decreases.
    Published under license by AIP Publishing. https://doi.org/10.1063/5.0045222

    I. INTRODUCTION                                                                  Liquid-fuel RDE experiments have been conducted in
           Detonation engine is one of the most promising propulsive devi-     1960s–1970s for the development of rocket-type propulsion technolo-
    ces due to the high thermodynamic cycle efficiency and pressure-gain       gies.14 Recently, interests in liquid-fuel RDE are resparked and several
    performance.1,2 Typical detonation engines can be classified by their      ground tests have been successfully conducted. For instance, Bykovskii
    individual operational features, such as rotating detonation engine        et al. used liquid kerosene in their RDE experiments.15–17 They first
    (RDE),3,4 pulsed detonation engine (PDE),5,6 and oblique detonation        chose a small combustor with a diameter being 306 mm and selected
    engine (ODE).7,8 As one of the realizable and scalable detonation          oxygen-enriched air as the oxidant to achieve a stable rotating detona-
    engines, RDE confines the detonation wave within a narrow annular          tion wave (RDW). In their recent experiments, hydrogen or syngas is
    channel, where the propellant is continuously injected from the inlet      used and the diameter of the RDE combustor is increased to
    and detonation product exits from the outlet to generate the thrust.9–13   503 mm.17,18 Their results show that the RDW cannot be achieved
    Continuous propagation of detonation waves makes RDE produce sta-          without additives (i.e., hydrogen or syngas) when standard air is used
    ble propulsive output and also simplifies the ignition implementations.    as the oxidant.
    Considering the limited storage space in practical propulsion systems,           Kindracki19 studied kerosene atomization quality in different gas
    e.g., rocket engines, propellants with high energy density are desirable   velocities and kerosene injection patterns by injecting liquid kerosene
    and utilization of liquid fuels is a key step for RDE commercialization.   into cold nitrogen stream. Their results show that the diameters of the

Phys. Fluids 33, 043307 (2021); doi: 10.1063/5.0045222                                                                                       33, 043307-1
Published under license by AIP Publishing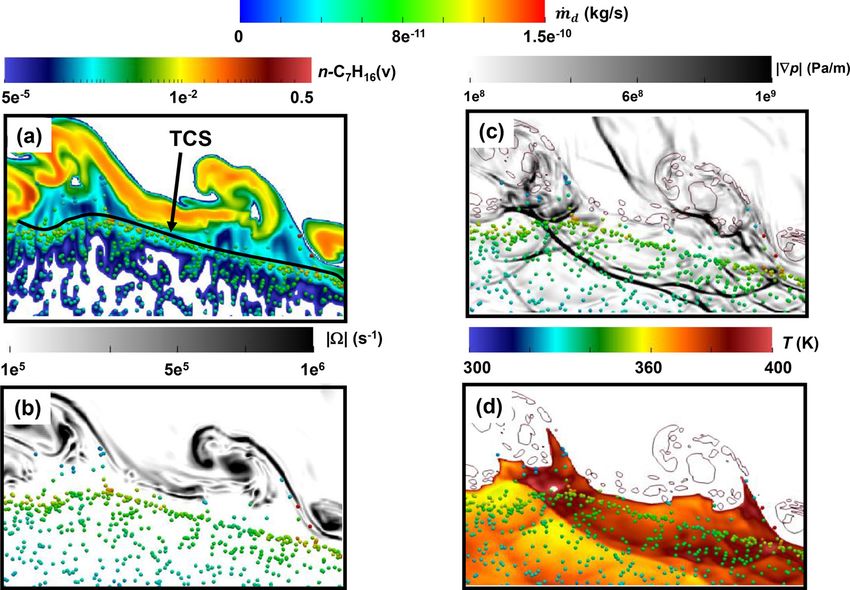
Physics of Fluids                                                                                 ARTICLE             scitation.org/journal/phf

    sprayed kerosene droplets range from 20 to 40 lm. He also investi-          volume fraction effects of the dispersed phase on the gas phase proper-
    gated the initiation and propagation characteristics of RDW with liq-       ties are not considered, since dilute sprays are studied in this work.24
    uid kerosene and air and successfully achieved the self-sustained           The equations of mass, momentum, energy, and species mass fraction,
    detonation wave using liquid kerosene and air mixture with the addi-        respectively, read
    tion of hydrogen.20
                                                                                                         @q
          The foregoing experimental investigations have demonstrated                                       þ r  ½qu ¼ Smass ;                         (1)
    the feasibility of rotating detonation combustion with liquid fuel                                   @t
    sprays, but one may need to resort to high-fidelity numerical simula-                    @ ðquÞ
                                                                                                    þ r  ½uðquÞ þ $p þ r  T ¼ Smom ;                  (2)
    tions to gain deeper scientific insight into two-phase RDEs, such as                        @t
    droplet vaporization and movement in the RDE chamber, as well as             @ ðqEÞ
    fuel vapor distributions. There have already been some computational                  þ r  ½uðqE þ pÞ þ r  ½T  u þ r  j ¼ x_ T þ Senergy ; (3)
                                                                                    @t
    efforts. For example, Sun and Ma21 investigated the effect of air total            @ ðqYm Þ
    temperature and octane injection width on RDW propagation. They                             þ r  ½uðqYm Þ þ r  sm ¼ x_ m þ Sspecies;m ;
                                                                                          @t
    pointed out that the detonation wave speed decreases with increased
                                                                                                                           ðm ¼ 1; …M  1Þ; (4)
    octane injection width. They also found that there was a critical fuel
    injection width for a fixed air temperature. Moreover, Hayashi et al.22                                     p ¼ qRT:                                 (5)
    numerically studied the RDW behaviors under different droplet sizes
                                                                                Here t is time, q is the density, u is the velocity vector, T is the temper-
    and prevaporization degrees using JP-10/air as the reactant. They
                                                                                ature, p is the pressure, Ym is the mass fraction of mth species, M is the
    found that the unburned fuel pockets exist in postshock region and
                                                                                total species number, and E is the total energy. R in Eq. (5) is the spe-
    the interactions between the fuel droplets and detonation wave may
                                                                                cific gas constant. Only (M  1) species equations are P      solved, and the
    cause the RDW extinction. However, since Eulerian–Eulerian method
                                                                                inert species (such as nitrogen) can be calculated from M        m¼1 Ym ¼ 1.
    is used in their work, the individual behaviors of liquid fuel droplets
                                                                                The source terms, Smass , Smom , Senergy ; and Sspecies;m , denote the inter-
    cannot be captured.
                                                                                phase exchange of mass, momentum, energy, and species, respectively,
          We numerically studied partially prevaporized n-heptane sprays
                                                                                and given in Eqs. (13)–(16). T is the viscous stress tensor, while j is the
    with Eulerian–Lagrangian method and analyzed the effects of droplet
                                                                                diffusive heat flux and follows Fourier's law. Furthermore, sm is the
    sizes on the RDW behaviors.23 It is found that the RDW propagation
                                                                                species mass flux, x_ m is the net production rate of m-th species, and
    speed is jointly affected by droplet size and gaseous premixture equiva-
                                                                                x_ T is the heat release from chemical reactions.
    lence ratio. Furthermore, the detonated fuel fraction first decreases,
    reaches the minimum values when the droplet diameter is around
    20 lm, and then increases when the diameter increases toward 50 lm.         B. Governing equation for liquid phase
    This indicates the strong correlation between the droplet sizes and liq-           The liquid fuel sprays are modeled as a large number of spherical
    uid fuel detonative combustion efficiency. Nevertheless, the interac-       droplets. The droplet volume fraction is low (less than 1%), and there-
    tions of the droplets and gas phase inside the fuel refill zone and how     fore, the inter-droplet collision is neglected.24 Also, the droplet
    their distributions affect the RDC are not discussed.23                     breakup process is not considered due to the small diameter studied
          In this work, we will study the distributions of n-heptane droplets   (i.e., 5 lm). The evolutions of mass, velocity, and temperature of indi-
    and vapor in the fuel refill zone of rotating detonation combustion, as     vidual fuel droplets are updated based on the Lagrangian method.25
    well as their interactions with the key aerodynamic features and reac-      The corresponding equations, respectively, are
    tive flow structures (e.g., shock wave and deflagration surface). Hybrid
                                                                                                               dmd
    Eulerian–Lagrangian method is used to simulate the compressible                                                  ¼ m_ d;                            (6)
    reactive flows laden with dispersed fuel droplets and two-way gas                                           dt
    liquid coupling is considered. A two-dimensional flatten domain is                                           dud    Fd
                                                                                                                      ¼    ;                             (7)
    employed to mimic an annular RDE combustor. In particular, differ-                                            dt    md
    ent from our previous studies,23 the influences of preheated propellant                                    dTd Q_ c þ Q_ lat
    properties (e.g., prevaporized gas temperature and equivalence ratio)                                 cp;d       ¼           :                       (8)
                                                                                                                dt       md
    on the RDW behaviors and droplet evaporation are studied, which is
    of great high relevance to practical implementations of RDEs with fuel      Here md is the droplet mass, ud is the droplet velocity vector, and Td
    sprays.15–17,20 The rest of the manuscript is organized as below.           is the droplet temperature. The droplet evaporation rate m _ d is calcu-
    Governing equations and numerical methods are specified in Sec. II.         lated from
    Physical model and simulated operating conditions are introduced in                              _ d ¼ pdd ShDab qS lnð1 þ Xr Þ;
                                                                                                     m                                                   (9)
    Sec. III. Numerical results and discussions are presented in Sec. IV,
    with the main findings being summarized in Sec. V.                          where dd is the droplet diameter, Dab is the vapor diffusivity in the
                                                                                gaseous mixture, and qS is the density on the droplet surface.
    II. GOVERNING EQUATION AND NUMERICAL                                                          1=2
                                                                                Sh ¼ 2:0 þ 0:6Red Sc1=3 is the Sherwood number, and Sc is the
    IMPLEMENTATION
                                                                                Schmidt number of the gas phase. The droplet Reynolds number, Red,
    A. Governing equation for gas phase                                         is defined based on the velocity difference between two phases, i.e.,
          The gas phase is solved by the transport equations for compress-      Red  qd dd ju@d ud j=l. Here qd is the droplet material density, l is
    ible, two-phase, reacting flows with ideal gas equation of state. The       the dynamic viscosity of the gaseous mixture, and u@d is the gas phase

Phys. Fluids 33, 043307 (2021); doi: 10.1063/5.0045222                                                                                            33, 043307-2
Published under license by AIP Publishing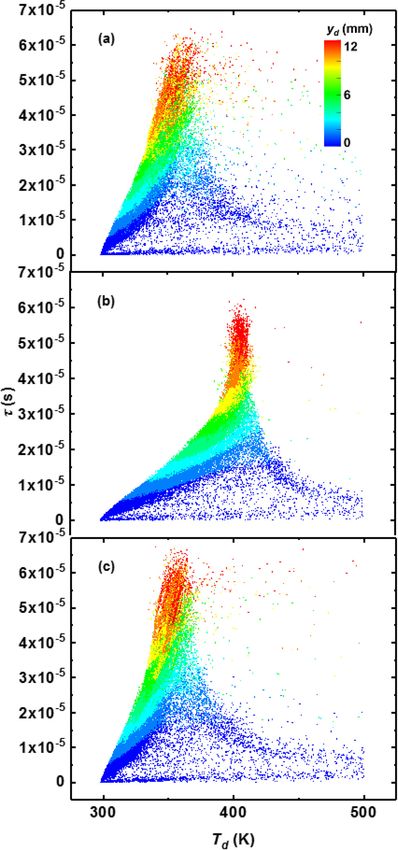
Physics of Fluids                                                                                                      ARTICLE               scitation.org/journal/phf

    velocity at the Lagrangian droplet location. In Eq. (9), Xr                                      developed based on a compressible flow solver rhoCentralFoam in
    ¼ ðXS  XC Þ=ð1  XS Þ is the concentration difference between the                               OpenFOAM.28 The accuracies of RYrhoCentralFoam have been con-
    ambient gas and droplet surface, scaled by that between the droplet                              firmed through extensive benchmark tests, in terms of predicting
    surface and interior. Here XC is the fuel species molar fraction in the                          shock waves, species diffusion, shock-chemistry interaction, detona-
    surrounding gas, while XS is the fuel species molar fraction at the                              tion cell size, and frontal structure.26,29–31 Droplet models (e.g., evapo-
    droplet surface.                                                                                 ration) and two-phase interactions are also validated and verified, and
         In Eq. (7), Fd is the force acting on the droplet, including the                            it is shown that the RYrhoCentralFoam solver can accurately capture
    Stokes drag force [I in Eq. (10)] and pressure gradient force (II)24                             the individual droplet response to a flow with shock waves and chemi-
                                                                                                     cal reactions.26 The foregoing validation and verifications of
                          18l Cd Red                                     1
                   Fd ¼                         md ðu@d  ud Þ  pdd3 $p :                   (10)    RYrhoCentralFoam have been collectively shown in Ref. 27. Recently,
                          qd dd2 24                                      6
                          |fflfflfflfflfflfflfflfflfflfflfflfflfflfflfflfflfflfflfflfflffl{zfflfflfflfflfflfflfflfflfflfflfflfflfflfflfflfflfflfflfflfflffl} |fflfflfflffl{zfflfflfflffl}                this solver has been successfully used for modeling RDE with gaseous
                                             I                              II                       and liquid fuels.23,30,32
                                                                                                            The gas phase equations [i.e., Eqs. (1)–(4)] are discretized with cell-
    Here Cd is the drag coefficient, and Red is the droplet Reynolds num-
                                                                                                     centred finite volume method. Second-order implicit backward scheme
    ber, based on the slip velocity between gas and droplet phases.
                                                                                                     is applied for time discretization, and the time step is about 10−9 s (CFL
          The convective heat transfer rate Q_ c is calculated from
                                                                                                     number is around 0.1). Second-order Godunov-type upwind-central
                                 Q_ c ¼ hc Ad ðT@d  Td Þ;                                   (11)    scheme developed by Kurganov et al.33 is used for calculating the con-
                                                                                                     vection term in the momentum equation, while the TVD (total variation
    where Ad is the surface area of a single droplet, hc is the convective heat                      diminishing) scheme is used for the convection term in the energy and
    transfer coefficient, T@d is the gas temperature at the droplet location.                        species mass fraction equations. Second-order central differencing
    Moreover, evaporation-induced heat transfer, Q_ lat , is estimated as                            scheme is applied for the diffusion terms in Eqs. (1)–(4).
                                                                                                            The chemical terms in Eqs. (3) and (4), x_ m and x_ T , are inte-
                                  Q_ lat ¼ hg;boil  hl;boil ;                               (12)    grated with the Euler implicit method. Two-step reactions of n-C7H16
    where hg;boil and hl;boil are, respectively, the enthalpies of carrier gas                       oxidization are employed in this work, which is listed in Table I with
    phase and liquid phase under the droplet boiling temperature.                                    their respective parameters for Arrhenius kinetics.34,35 In Table I, A is
         The source terms in Eqs. (1)–(4) account for the effects of dis-                            the pre-exponential factor, n is the temperature exponent, Ea is the
    persed liquid fuel droplets on the gas phase and are calculated based                            activation energy, a and b are the fuel and oxidizer reaction orders,
    on the properties of the droplets in individual CFD cells, i.e.,                                 respectively. It should be noted that to differentiate the n-heptane spe-
                                                                                                     cies from prevaporization and in situ droplet evaporation in the RDE
                                        1 XNd                                                        chamber, we respectively use “n-C7H16” and “n-C7H16(v)” to denote
                                  Smass ¼           m_ d;                                    (13)
                                        Vc      1                                                    them. Accordingly, they have separate reactions I and II, with identical
                                    1 XNd                                                            kinetic parameters. The current reaction model is validated against a
                        Smom ¼              ðm  _ d ud þ Fd Þ;                             (14)    skeletal mechanism36 through calculations of n-C7H16/air ZND
                                   Vc      1

                                   1 XNd  _                                                        (Zeldovich–von Newmann–Doring) structures with SD Toolbox37
                     Senergy ¼               Qc  m   _ d hg;boil ;                         (15)    (see the Appendix A), and it is shown that it can correctly reproduce
                                  Vc     1
                                                                                                    the detonation propagation speed, pressure, and temperature at both
                                   Smass for condensed species
                    Sspecies;m ¼                                                             (16)    von Neumann and Chapman–Jouguet conditions in the ZND
                                   0       for other species:                                        structures.
    Here Vc is the CFD cell volume and Nd is the droplet number in a cell.                                  Moreover, the governing equations of the liquid phase, i.e.,
    Note that m   _ d ud in Eq. (14) represents the evaporation-induced                             Eqs. (6)–(8), are solved with the first-order implicit Euler method and
    momentum exchange between the gas and liquid phases. More detailed                               the gas properties at the droplet locations (e.g., u@d and T@d ) are cal-
    information about the gas phase and liquid phase equations and submo-                            culated by linear interpolation. Two-way coupling between the gas
    dels used in Sec. II A and this section can be found in Refs. 23 and 26.                         and liquid phases about species, mass, momentum, and energy
                                                                                                     exchanges is performed for each time step.
                                                                                                            It should be acknowledged that our understanding of turbulence–
    C. Computational implementation                                                                  detonation interactions is still limited, although turbulence is ubiqui-
        The governing equations for gas and droplet phases are solved by                             tous in real RDE combustors. This is associated with the extreme
    a hybrid Eulerian–Lagrangian solver, RYrhoCentralFoam,27 which is                                nature of the detonative flow field, which is characterized by extremely

    TABLE I. Chemical reactions for n-C7H16 oxidization (units in cm s mole cal K).

                                      Reaction                                              A             n               Ea                a             b           References

    I                2n-C7H16+15O2 ) 14CO+16H2O                                         6.3  1011       0.0          30 000.0            0.25           1.5                34
    II            2n-C7H16 (v)+15O2 ) 14CO+16H2O                                        6.3  1011       0.0          30 000.0            0.25           1.5                34
    III                         2CO+O2 () 2CO2                                          4.5  1010       0.0          20 000.0            1.0            0.5                35

Phys. Fluids 33, 043307 (2021); doi: 10.1063/5.0045222                                                                                                                  33, 043307-3
Published under license by AIP Publishing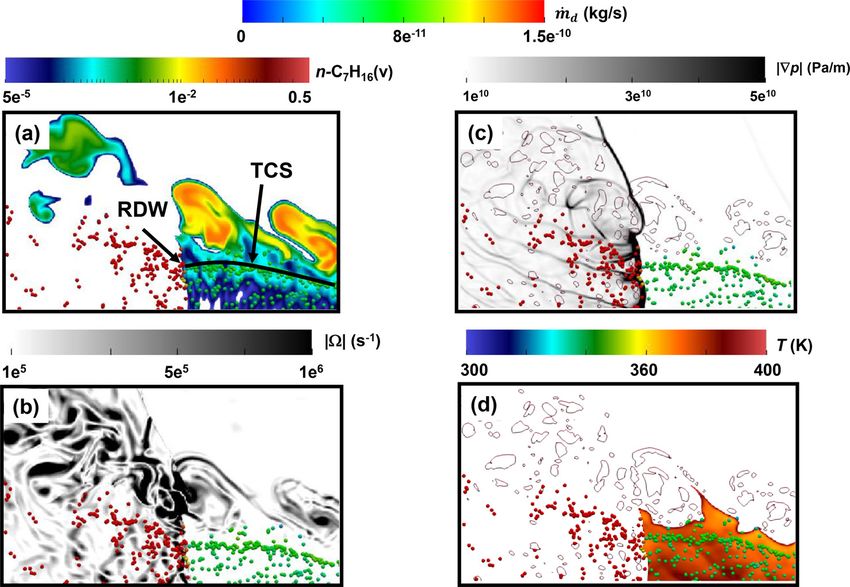
Physics of Fluids                                                                                          ARTICLE            scitation.org/journal/phf

    high pressure, temperature, and strong isochoric chemical heat release.                    The liquid fuel droplets are monodispersed with an initial diame-
    These make them probably different from the classical Kolmogorov-                    ter being 5 lm. Also, different degrees of n-heptane prevaporization
    type turbulence.38 Direct numerical simulation of rotating detonation                are considered, which are parameterized by prevaporized gas equiva-
    combustion is still not affordable so far. Moreover, it may be question-             lence ratio /g (calculated based on prevaporized n-heptane and air).
    able to use a classical turbulence model, originally developed for low-              To examine how the reactant preheating temperature affects the spray
    Mach-number flows, in RDE modeling. The development of turbu-                        RDC, various total temperatures Tg of the injected prevaporized gas
    lence models for detonations is an important area of detonation stud-                are considered. They will be detailed in Sec. III B. Moreover, the total
    ies and still needs considerable future efforts.                                     injection pressure of the premixed gas is fixed to be 20 atm in all our
                                                                                         simulations. Variations of the total pressure may lead to different
    III. PHYSICAL MODEL
                                                                                         rotating detonation behaviors,29 but their effects will not be studied in
    A. Two-phase rotating detonation model                                               this work.
          Figure 1 shows the schematic of rotating detonation in a two-                        The inlet mass flow rates of n-heptane vapor and air are deter-
    dimensional unrolled model RDE chamber. For simplicity, the                          mined by injection total pressure and local pressure near the inlet
    upstream plenum is not considered, since only the detonation in the                  based on the isentropic expansion relations.39–42 For n-heptane drop-
    chamber is relevant in this work. The sizes of the domain are 153 mm                 lets, kinematic equilibrium between the gas and liquid phases is
    and 50 mm in x- and y-directions, respectively. This extent ensures                  assumed, such that the droplets have the same injection velocity as
    that the rotating detonation wave and accompanied flow features (e.g.,               that of the n-heptane vapor. This is practically possible, particularly
    oblique shock, slip line, and deflagration surface) can be correctly cap-            when the injection plenum connected with the RDE facility is suffi-
    tured. The effects of the model chamber length are analyzed (see the                 ciently long and hence the interphase momentum relaxation can be
    Appendix B) by doubling it to 306 mm (x direction), and it is demon-                 completed.43 More detailed information about injection conditions
    strated that the two-phase RDC features would not be changed quali-                  can be found in our previous work.23
    tatively with increased combustor length.                                                  Initially (at t ¼ 0), the domain in Fig. 1 is filled with standard air
          The boundary conditions are marked in Fig. 1. Specifically, the                (1 atm and 300 K). To initiate the detonation wave, a fresh reactant
    outlet is nonreflective, to avoid the backpropagation of the pressure                layer (153 mm  12 mm) with stoichiometric gaseous n-heptane/air
    wave or other perturbations from the outlet toward the upstream near                 premixture is patched near the inlet for detonation initiation. One
    the head end, where the RDW and deflagration surface reside. The                     rectangular ignition spot (20 atm and 2000 K, 1 mm  12 mm) is
    boundary conditions for the left and right sides are periodic, such that             applied near the left boundary. Within the first cycle, the left and right
    the rotating detonation wave can continuously propagate through the                  boundaries are assumed to be solid walls, to avoid two detonation
    flattened domain.                                                                    waves propagating oppositely in the combustor. When the right prop-
          Partially prevaporized n-heptane sprays are injected into the                  agating detonation wave is close to the right boundary, both left and
    domain via the continuous inlet at the head end (as shown in Fig. 1),                right boundaries are changed to periodic condition. Therefore, in the
    and the fuel is hybrid, composed of n-C7H16 vapor and liquid n-C7H16                 subsequent cycles, the RDW can continuously propagate across the
    droplets. The fuel injection condition will be detailed in Sec. III B.               domain.
    Also, the prevaporized n-C7H16 is assumed to be well mixed with the                        The computational domain in Fig. 1 is discretized with
    carrier gas, air, before they are injected into the chamber. Hereafter,              Cartesian cells. Uniform cells are distributed along x direction and
    the prevaporized n-C7H16 and air premixture is termed as prevapor-                   the spacing is Dx ¼ 50 lm. Moreover, the cells are stretched along y
    ized gas for brevity. Also, to be readily distinguished, the gaseous                 direction. Specifically, the grid size gradually increases toward the
    n-C7H16 from prevaporization is termed as “prevaporized n-C7H16,”                    outlet and the ratio of maximum (downstream) to minimum cell
    whereas that from the in situ droplet evaporation in the RDE chamber                 sizes (upstream) is 10, which leads to an averaged cell size of
    is “n-C6H17 vapor” Their formulas, respectively, correspond to                       Dy ¼ 50 lm near the head end of the model RDE chamber. Since the
    n-C7H16 and “n-C7H16(v).”                                                            Lagrangian tracking in our work is based on point-force assumption,
                                                                                         the droplet diameter is supposed to be smaller than the cell size, to
                                                                                         ensure that the interpolated gas phase quantities at the droplet loca-
                                                                                         tion (e.g., u@d and T @d ) can well approximate those along the drop-
                                                                                         let surface.24 This essentially leads to the fact that the Lagrangian fuel
                                                                                         droplets are not resolved by the Eulerian mesh in our modeling strat-
                                                                                         egy and therefore are at a subgrid scale. With this rationale, the
                                                                                         Eulerian mesh resolution Dx and Dy (50 lm) are larger than the
                                                                                         Lagrangian droplet diameter (i.e., 5 lm in this work). Mesh sensitiv-
                                                                                         ity analysis is performed with three grid sizes, and their total grid
                                                                                         numbers are 12  106 (25 lm), 3  106 (50 lm), and 0.75  106
                                                                                         (100 lm). The results (Appendix C) show that the resolution of
                                                                                         50 lm can accurately capture the RDW and droplet dynamics.
                                                                                         Further increased mesh resolution does not change the main flow
                                                                                         and combustion features of the liquid fuel rotating detonations.
     FIG. 1. Schematic of rotating detonation with liquid fuel sprays in a 2D unrolled   Therefore, the mesh with 3  106 (50 lm) cells will be selected for
     chamber.                                                                            our following simulations of two-phase rotating detonations.

Phys. Fluids 33, 043307 (2021); doi: 10.1063/5.0045222                                                                                                    33, 043307-4
Published under license by AIP Publishing
Physics of Fluids ARTICLE scitation.org/journal/phf
TABLE II. Simulated liquid fuel RDC cases.
Gas phase Liquid phase
Case Tg (K) /g _ C7H16;g (kg/s)
m /l _ C7H16;d (kg/s)
m a dd0 (lm)
1 300 0.8 0.263 0.066 0.025 2.5 10-4 5
2 400 0.8 0.246 0.095 0.029
3 0.7 0.265 0.094 0.033
4 0.65 0.3 0.09 0.036
5 500 0.8 0.365 0.128 0.042
B. Simulation case the DS and droplet-laden area in the refill zone. Additionally, a portion
Table II shows five cases characterized by different prevaporized of the fuel droplets survive in the postdetonation region (indicated by
gas temperatures (Tg ) and equivalence ratios (/l and /g ). Liquid drop- the white arrow) and the droplet diameters are quickly reduced after
let (/l ) and prevaporized gas (/g ) equivalence ratios are calculated they travel through the detonation front due to the strong evaporation
based on the mass of n-heptane sprays and gasified n-heptane, respec- rate caused by the high local gas temperature (over 3000 K), as shown
tively, as well as the oxidizer from the prevaporized gas. Moreover, the in Fig. 2(a).
global equivalence ratio (/t ) can be obtained through /t ¼ /g þ /l . It can be seen in Fig. 2(b) that a high concentration of n-C7H16
The liquid phase volume fraction (a) and initial diameter (dd0 ) of vapor due to the droplet in situ evaporation in the RDE chamber can
the injected fuel droplets are fixed to be 2.5 10−4 and 5 lm in our be observed in the vapor layer. This is because the injected droplets
simulations, respectively. To account for the influence of propellant move dominantly along the y-direction in the refill zone, as unveiled
preheating and liquid fuel prevaporization, various values of Tg and by our recent work based on the droplet trajectory analysis.23 Hence,
/g will be investigated in this work. As shown in Table II, cases 1, 2, those at the top of the droplet-laden area generally have a relatively
and 5 have the same prevaporized gas equivalence ratio (/g ¼ 0.8), but longer residence time in the RDE chamber, and they interact with the
the temperature Tg increases from 300 K to 500 K. As for cases 2, 3, hot DS immediately after they are injected. Ahead of the RDW, the
and 4, they have the same prevaporized gas temperature (Tg ¼ 400 K), thickness of the vapor layer is increased to about 25% of the local
but the prevaporized gas equivalence ratio /g gradually decreases height of the fuel refill zone. Also, the morphology and stability of the
from 0.8 to 0.65. DS are strongly affected by the blast waves [(BW) in Fig. 2(d)].29 Note
Moreover, the mass flow rates of prevaporized and liquid n-hep- that these blast waves are emanated from the shock triple point, caused
tane are also detailed in Table II. They are, respectively, estimated by the local acoustic impedance of the fresh and burned gas demar-
based on the mass flow rate m _ total;g of the total injected gas and the liq- cated by the DS to the RDW.44 One can see from Fig. 2(d) that some
uid phase volume fraction a. Apparently, the prevaporized n-heptane
mass flow rate m _ C7H16;g is calculated by m _ total;g and the mass fraction
of prevaporized n-heptane. That for liquid n-heptane, m _ C7H16;d , is cal-
culated according to the total injected gas volume flow rate Vtotal;g
multiplied by the droplet volume fraction a and liquid n-heptane
material density qd .
IV. RESULTS AND DISCUSSION
A. General characteristics
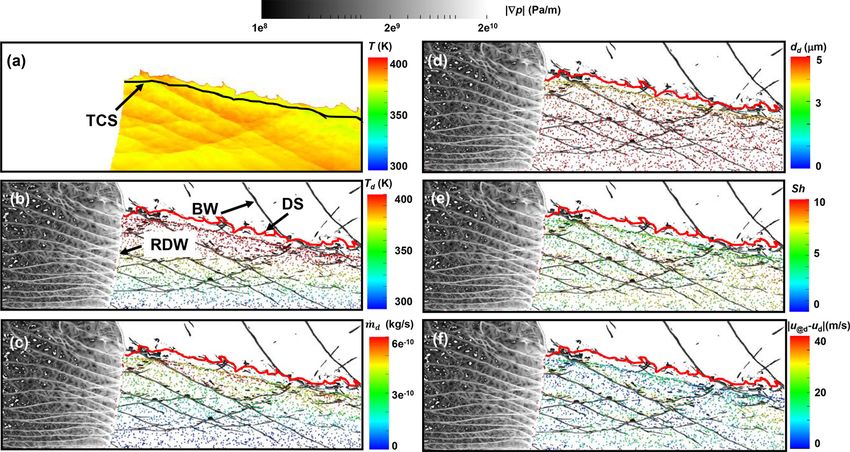
Figure 2 shows the contours of gas temperature overlaid by n-
C7H16 Lagrangian droplets, n-C7H16 vapor mass fraction, pressure,
and its gradient magnitude, respectively. The results in this subsection
correspond to 1000 lm after the ignition, approximately, and the deto-
nation wave has traveled in the computational domain over 10 cycles.
The droplets in Fig. 2(a) are colored by droplet diameter. The results
are from case 2 (Tg ¼ 400 K and /g ¼ 0.8). It is seen from Fig. 2(a)
that the droplets are mainly distributed in the triangular fuel refill
zone, and their diameters show limited changes due to weak evapora-
tion therein. It should be mentioned that although the reactants are
preheated, the static temperatures in the refill zone are still low, rang-
ing from 320 K to 380 K, and the fuel droplets fail to pronouncedly ini-
FIG. 2. Contours of (a) gas temperature with n-C7H16 droplets, (b) n-C7H16 vapor
tiate the evaporation process. However, close to the deflagration mass fraction, (c) pressure, and (d) magnitude of pressure gradient. Results from
surface [(DS) in Fig. 2(a)], evaporation of n-heptane droplets apprecia- case 2: Tg ¼ 400 K and /g ¼ 0.8. VL: vapor layer, DS: deflagration surface, BW:
bly increases. This results in a vapor layer [(VL) in Fig. 2(a)] between blast wave.
Phys. Fluids 33, 043307 (2021); doi: 10.1063/5.0045222 33, 043307-5
Published under license by AIP Publishing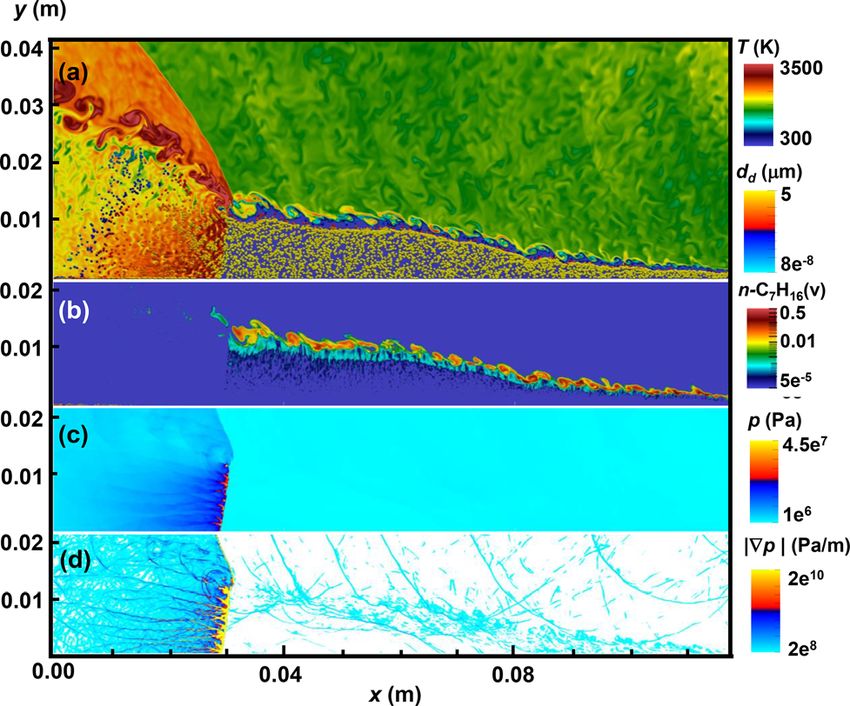
Physics of Fluids                                                                                          ARTICLE              scitation.org/journal/phf

     FIG. 3. Contours of (a) gas temperature with n-C7H16 droplets, (b) n-C7H16 vapor   FIG. 4. Contours of (a) gas temperature with n-C7H16 droplets, (b) n-C7H16 vapor
     mass fraction, (c) pressure, and (d) magnitude of the pressure gradient. Results   mass fraction, (c) pressure, and (d) magnitude of pressure gradient. Results from
     from case 5: Tg ¼ 500 K and /g ¼ 0.8.                                              case 3:Tg ¼ 400 K and /g ¼ 0.7.

    of the blast waves are transmitted through the DS and continuously
                                                                                        residual fuel droplets exist in the postdetonation region. In our simula-
    propagating in the refill zone, inclined with respect to the RDW.
                                                                                        tions, stable RDW cannot be achieved if the prevaporized gas equiva-
    These blast waves may further influence the evaporating droplets
    inside the fuel refill zone and this will be further discussed in Figs. 5–7.        lence ratio is reduced to less than 0.65. Therefore, this indicates that
          Likewise, the counterpart results from case 5 are shown in Fig. 3,            without sufficient prevaporization of the liquid fuel, it is difficult to
    with /g ¼ 0.8 and increased prevaporized gas temperature                            maintain the RDW with liquid n-heptane sprays. For liquid fuel
    Tg ¼ 500 K. Stronger evaporation occurs in the refill zone, which leads             RDEs, how much liquid fuels should be gasified before being injected
    to more distributed gaseous n-C7H16 therein compared to that in Fig.                into the combustor and whether an optimal percentage envelope exists
    2(b). For droplets from the same injection location, when they cross                are still open questions and should be further studied.
    the refill zone, their evaporation starts spatially earlier than in Fig. 2                In Figs. 2(b), 3(b), and 4(b), one can see the mass fractions of n-
    (b), corresponding to half height of the refill zone. Also, more leakage            C7H16 vapor are high along the convoluted deflagration surface, and
    of unburned n-C7H16 vapor from the shock triple point can be found.                 the peak values range from 0.4 to 0.5 in these cases. The reader should
    For higher reactant temperature (500 K) in Fig. 3, the peak pressures               be reminded that these fuel vapors are visualized fully based on the in
    at the RDW are lower than those in Fig. 2(c) with Tg ¼ 400 K, because               situ droplet evaporation [i.e., n-C7H16(v)] in the RDE chamber,
    of the reduced volumetric energy density of the detonable gas when                  excluding the prevaporized ones. This phenomenon is also observed
    the gas temperature is elevated.45                                                  by Hayashi et al. in their Eulerian–Eulerian modeling of JP-10/air
          Figure 4 shows the results from case 3 (Tg ¼ 400 K and                        RDE,22 but they did not explain the underlying mechanisms and the
    /g ¼ 0.7), which is introduced to be compared with Fig. 2 (/g ¼ 0.8)                individual droplet distributions cannot be captured due to the
    about the influence of prevaporized gas equivalence ratio on rotating               Eulerian–Eulerian approach. Based on our studies, the accumulation
    detonation combustion. The flow structure, detonation wave, droplet,                of the n-heptane vapor is mainly from two possible sources. First, at
    and vapor distributions are qualitatively similar to those in Fig. 2. This          the right end of the fuel refill zone where the reactant injection is just
    indicates that further reduction of prevaporized gas equivalence ratio              recovered after the RDW passes, the droplets are injected into the
    from 0.8 to 0.7 does not show remarkable effects on the foregoing fea-              RDE chamber where the denoted products from the last RDW cycle
    tures. Nevertheless, compared to Fig. 2(a), there are more escaping                 are still close to the inlet. Such intimate interactions with the hot envi-
    fuel droplets in the postdetonation region when /g is reduced, as                   ronment lead to fast evaporation of these newly injected droplets.
    shown in Fig. 4(a). This implies that low prevaporization (lower /g )               These fuel vapors cannot be deflagrated due to the locally rich compo-
    would lead to less in situ evaporation within the refill zone and hence             sition and instead are transported along the sheared contact surface
    insufficient utilization of the liquid fuel. This is because that lower pre-        toward the triple point and oncoming detonation wave. Second, as
    vaporization degree generally results in a relatively weaker detonation             shown in Figs. 2(b), 3(b), and 4(b), the droplets at the top of the
    wave, and therefore the droplets are heated more slowly near the deto-              droplet-laden area in the refill zone strongly vaporize, which also con-
    nation wave and are more difficult to be fully vaporized.23                         tributes toward the vapor accumulation along the deflagration surface.
          When the prevaporized gas equivalence ratio is further reduced                As such, essentially, formation of the high concentration of n-C7H16
    to /g ¼ 0.65 (case 4), the main detonation features have limited differ-            along the contact surface is associated with the early batch of fuel
    ences from those in case 3 (hence not presented here). However, more                droplets when the fuel inlets are activated. This would affect the

Phys. Fluids 33, 043307 (2021); doi: 10.1063/5.0045222                                                                                                        33, 043307-6
Published under license by AIP Publishing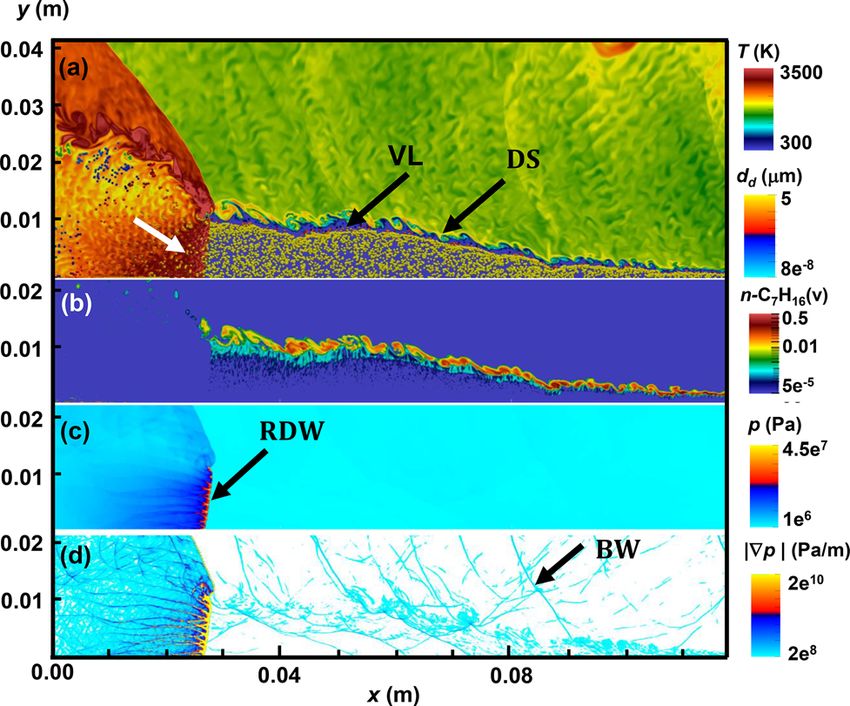
Physics of Fluids                                                                                   ARTICLE             scitation.org/journal/phf

    combustion characteristics along the contact surface and therefore            the finite slip velocity behind the blast waves in Fig. 5(f). This leads to
    may modulate the fraction of the detonated fuels.23,32 Ultimately, the        increased droplet Reynolds number Red (results not shown here) and
    RDW consumes part of the vapor near the triple point, while the rest          Sherwood number Sh [Fig. 5(e)] of the corresponding droplets. As
    escapes from the refill zone [see Fig. 3(b)]. In implementations of prac-     shown in Fig. 5(c), droplet evaporation rate m   _ d increases behind the
    tical liquid fuel RDE's, high concentration of n-heptane from droplet         blast waves. Based on the results in Figs. 2(a) and 2(e), one can see that
    evaporation along the DS is supposed to be avoided, since this may            this enhancement from the blast waves is associated with the kine-
    deteriorate the overall detonation combustion efficiency and local fuel-      matic, instead of thermal, effects. This is also observed by Zhuang
    rich burning may also lead to generation of the pollutants (e.g., soot,       et al.47 in their simulations of detonations in water mists and termed
    carbon monoxide, or oxides of nitrogen).46 A possible solution, but           as the Sherwood number effect. Meanwhile, this enhancement only
    needed to be deliberately designed, is to adjust the timing of liquid fuel    occurs at the upper part of the droplet-laden area, where the fuel drop-
    injection, to ensure the early batch of the liquid fuel sprays is directly    lets have already been heated. Near the fuel injector, limited variations
    injected into the refill zone, instead of the hot detonated gas.              of m _ d can be seen from Fig. 5(c) due to low droplet temperatures
                                                                                  (around 300 K). Although we can observe that the evaporation rate is
    B. Detailed structure in refill zone                                          affected by propagating blast waves, however, the limited fuel sprays
           Detailed structure of the flow field and droplet properties in         are fully vaporized within the droplet-laden area, with less pronounced
    the fuel refill zone will be further discussed in this section. Plotted in    diameter reduction, as indicated in Fig. 5(b).
    Fig. 5(a) is the gas temperature, and the upper limit of the temperature             Figure 6 shows the close-up view on the vapor layer, deflagration
    range is clipped to 400 K for a clear demonstration of the refill zone        surface, and n-C7H16 droplets (colored by the evaporation rate m       _ d ).
    temperature. The black solid line in Fig. 5(a) is the two-phase contact       Figure 6(a) shows the contour of n-heptane vapor, n-C7H16(v), near
    surface (TCS), which is the top layer of the droplet-laden area. The          the deflagration surface. When the droplets are closer to the DS, drop-
    upper boundary of gas temperature contours loosely corresponds to             let evaporation starts, which leads to isolated or connected high con-
    the deflagration surface [i.e., DS in Fig. 5(b)]. Furthermore, we can         centration of n-heptane vapor around the droplets. Therefore, the
    obviously see the wavy temperature distributions caused by the com-           concentration of n-heptane vapor near the two-phase contact surface
    pression of the blast waves and this can be further confirmed by visual-      is high, and the vapor layer is filled with the nonuniform n-heptane.
    izing the instantaneous blast wave locations with pressure gradient           This is also demonstrated in Fig. 2(b). All these vapors contribute
    magnitude in Figs. 5(b)–5(f). The low temperature rise behind the             toward the high concentration of n-heptane along the DS, as discussed
    blast waves indicates that their intensities are generally weak.              in Sec. IV A. One can see from Fig. 6(b) that some residual evaporating
           Figures 5(b)–5(f) show the contours of the pressure gradient           droplets are engulfed by the eddies along the DS, visualized by the iso-
    magnitude overlaid by the Lagrangian droplets with various parame-            lines of k2 [the second largest eigenvalue of S2 + W2, S ¼ 0.5(ru
    ters, including droplet temperature Td , evaporation rate m  _ d , diameter   + ruT) and W ¼ 0.5(ru ruT)] in Fig. 6(b).48
    dd , Sherwood number Sh, and slip velocity ju@d  ud j. The blast                    The interactions between the blast waves, compressed gas phase,
    waves have no apparent effects on droplet temperature variations,             and liquid droplets are also further demonstrated in Figs. 6(c) and
    even if the gas temperature has already increased because of the blast        6(d). Although the traveling blast wave encroaches the fuel refill zone,
    wave as shown in Fig. 5(a). This is reasonable, because there exists a        however, the fuel spray droplets do not appreciably move with and
    finitely long thermal relaxation time for the droplets to be heated           therefore follow the blast waves, thereby not resulting in droplet pref-
    caused by heat exchange with the gas phase. Similar droplet momen-            erential accumulation immediately behind the shock front and shock-
    tum relaxation duration is also observed, which can be confirmed by           driven multiphase instability.49–51 This may be because the blast waves

                                                                                                                       FIG. 5. Interactions between blast waves
                                                                                                                       and fuel droplets in the refill zone: (a) gas
                                                                                                                       temperature, (b) droplet temperature, (c)
                                                                                                                       droplet evaporation rate, (d) droplet diam-
                                                                                                                       eter, (e) Sherwood number, and (f) veloc-
                                                                                                                       ity difference between droplet and gas
                                                                                                                       phases. Results from case 2. Background
                                                                                                                       contours in Figs. 5(b)–5(f) is pressure gra-
                                                                                                                       dient magnitude. The black line in Fig. 5(a)
                                                                                                                       is the two-phase contact surface, while the
                                                                                                                       red lines in Figs. 5(b)–5(f) denote the def-
                                                                                                                       lagration surface.

Phys. Fluids 33, 043307 (2021); doi: 10.1063/5.0045222                                                                                                  33, 043307-7
Published under license by AIP Publishing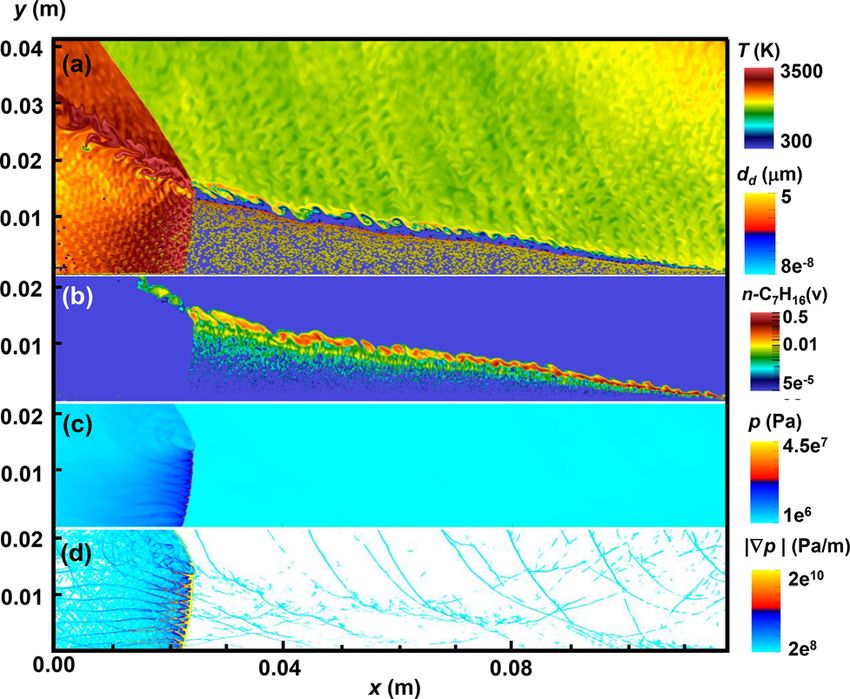
Physics of Fluids                                                                                ARTICLE            scitation.org/journal/phf

                                                                                                                   FIG. 6. Close-up view of the vapor layer
                                                                                                                   and deflagration surface: (a) n-heptane
                                                                                                                   vapor mass fraction, (b) vorticity magni-
                                                                                                                   tude, (c) pressure gradient magnitude,
                                                                                                                   and (d) gas temperature. The Lagrangian
                                                                                                                   droplets are colored by the evaporation
                                                                                                                   rate. Results from case 2. Red isolines in
                                                                                                                   (c) and (d): k2 ¼ 1  1010 s−2.

    are relatively weak and/or the droplet inertial is large. This feature is         Likewise, Fig. 7 shows the close-up view on the shock triple point
    practically important to attain organized, continuous, and self-            of the same case in Fig. 6. Obviously, the droplet evaporation rate con-
    sustained rotating detonation combustion with liquid fuel sprays. Any       siderably increases when they cross the detonation front. No accumu-
    aerodynamic perturbation on the liquid fuel droplets inside the refill      lated n-heptane vapor around these escaping droplets is observed, due
    zone would affect the nonuniform and/or nonsteady fuel supply for           to the local chemical reactions in the denoted gas environment. One
    the rotating detonation waves. This may induce adverse outcomes,            can find that part of n-heptane vapor near the deflagration surface is
    such as RDW destabilization and even failure, and therefore deterio-        consumed near the shock triple point. Nonetheless, some of them leak
    rate the overall performance of an RDE.                                     and are transported downstream along the slip line. The transverse

                                                                                                                   FIG. 7. Close-up view of the shock triple
                                                                                                                   point: (a) n-heptane vapor mass fraction, (b)
                                                                                                                   vorticity magnitude, (c) pressure gradient
                                                                                                                   magnitude, and (d) gas temperature. The
                                                                                                                   Lagrangian droplets are colored by the evap-
                                                                                                                   oration rate. Results from case 2. Isolines in
                                                                                                                   (c) and (d) are k2 ¼ 1  1010 s−2.

Phys. Fluids 33, 043307 (2021); doi: 10.1063/5.0045222                                                                                               33, 043307-8
Published under license by AIP Publishing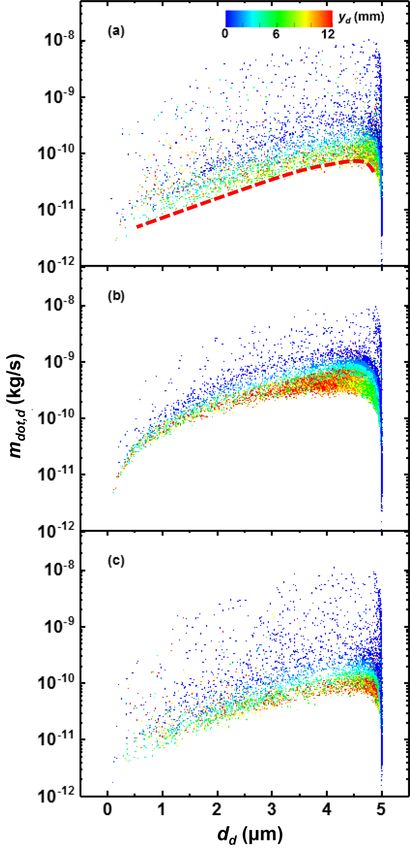
Physics of Fluids ARTICLE scitation.org/journal/phf
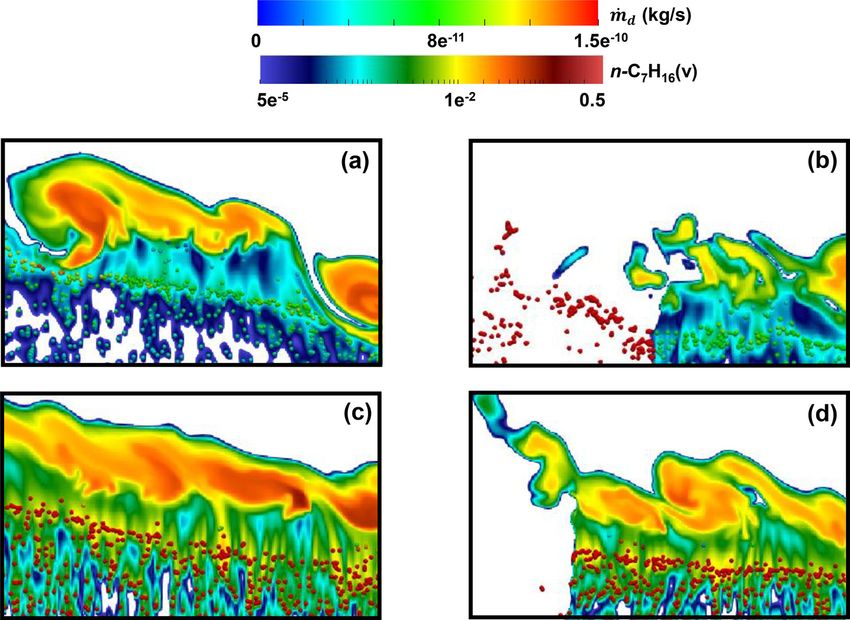
FIG. 8. Close-up view of n-C7H16 vapor
mass fraction and fuel droplets along (a)
and (c) deflagration surface and (b) and
(d) shock triple point in case 3 (a) and (b)
and case 5 (c) and (d).
and detonation waves are obviously observed, and the transverse wave One can see from Secs. IV A and IV B that the kinetic contribu-
has limited effects on the droplets in postshock region. tions of liquid fuels toward the rotating detonations can be categorized
In Figs. 5–7, only case 2 is discussed, and Fig. 8 shows the coun- as (1) evaporation in the refill zone before the RDW arrives and (2)
terpart structures near the deflagration surface and shock triple point evaporation around the RDW front. For the former, finitely long time
in case 3 (/g ¼ 0.7, Tg ¼ 400 K) and case 5 (/g ¼ 0.8, Tg ¼ 500 K). is required for the liquid fuels to be converted into detonable gas, while
Comparing Figs. 6(a) and 8(a), as well as Figs. 7(a) and 8(b), one can for the latter, it is more instant and only occurs when the propagating
find that the distributions of n-heptane vapor and droplet distributions RDW sweeps the droplets, through direct two-phase interactions (e.g.,
are generally similar. This indicates that the variations of the prevapor- drag, pressure gradient, and strong convective heat transfer). Based on
ized gas equivalence ratio from 0.8 to 0.7 do not significantly affect the the droplet size in this study, when the droplets cross the RDW, strong
above aspects. However, the changes of gas temperature, from 400 K droplet evaporation proceeds. However, whether there is a critical
to 500 K, considerably influence the droplet evaporation in the refill droplet diameter with which they can be effectively consumed by the
zone, as shown in Figs. 8(c) and 8(d). These observations are consis- RDW and how the vapor inhomogeneity (imperfectly reactant mixing
tent with those in Sec. IV A, based on Figs. 2–4. around the detonation wave) affects the instantaneous detonation
dynamics need future investigations.
Moreover, in the first category, if the distance between the indi-
C. Further interpretations of layered characteristics
vidual droplets and the RDW is Ld , then the duration for the latter to
of fuel sprays approach the droplets is about sdet ¼ Ld =Ddet (Ddet is the averaged
Based on the results in Secs. IV A and IV B, in Fig. 9, we further
sketch the conceptual model of layered distributions of liquid droplets
and gaseous vapor in the fuel refill zone of rotating detonation.
Specifically, they include cold sprays from the liquid fuel injectors
(marked with I in Fig. 9), heated and evaporating sprays (II), and
vapor layer (III). Above the vapor layer, there is the deflagration sur-
face (or contact surface) where considerable vapor accumulation can
be found. The properties of the carrier gas and liquid fuel droplets
would affect the distributions of the above zones I, II, and III. For cold
sprays, it takes finitely long time (corresponding to zones I and II) for
them to be heated and then vaporize. Ideally, zone III is supposed to
be maximized in the refill zone, which means the high fuel vapor con-
centration therein. These vapors can be consumed by the RDW and FIG. 9. Conceptual model of distributions of liquid fuel sprays and vapor in the refill
therefore is beneficial for the detonative combustion. zone of rotating detonation.
Phys. Fluids 33, 043307 (2021); doi: 10.1063/5.0045222 33, 043307-9
Published under license by AIP PublishingPhysics of Fluids ARTICLE scitation.org/journal/phf
RDW propagation speed).23 To have sufficiently detonable gas in the further discussed in Sec. IV D. Unfortunately, for the droplets injected
refill zone, within this period, there is a sequence of processes to be close to the RDW, limited time is available for them to be fully heated,
completed, including droplet heating, evaporation, and reactant mix- let alone evaporation. Their kinetic contributions toward the detona-
ing. The droplet heating and evaporation in the refill zone will be tion wave depend on whether they can be quickly consumed by the
RDW; otherwise, deflagrative combustion can proceed in the deto-
nated gas or the residue droplets exit from the RDE chamber.
FIG. 10. Scatters of droplet temperature vs droplet residence time in the refill zone: FIG. 11. Scatters of droplet evaporation rate vs droplet diameter in the refill zone:
(a) Td ¼ 400 K and /g ¼ 0.8 (case 2); (b) Td ¼ 500 K and /g ¼ 0.8 (case 5); (c) (a) Td ¼ 400 K and /g ¼ 0.8 (case 2); (b) Td ¼ 500 K and /g ¼ 0.8 (case 5); (c)
Td ¼ 400 K and /g ¼ 0.7 (case 3). Td ¼ 400 K and /g ¼ 0.7 (case 3).
Phys. Fluids 33, 043307 (2021); doi: 10.1063/5.0045222 33, 043307-10
Published under license by AIP PublishingPhysics of Fluids ARTICLE scitation.org/journal/phf
Although more complicated factors exist in practical liquid fuel temperature and hence reached interphase thermal equilibrium.
RDEs, such as turbulence, three-dimensionality, and liquid fuel atomi- However, their temperatures are still lower than the boiling point
zation/breakup, however, the conceptual model in Fig. 9 provides a (about 540 K) under the local conditions.
physical guidance and insight into implement rotating detonations Furthermore, in Figs. 10(a) and 10(c), we can find that the
with liquid fuels. temperatures of some droplets are higher than the prevaporized gas
temperature, i.e., 400 K, and can be up to Td ¼ 500 K. Their temper-
D. Droplet heating and evaporation in the refill zone atures are close to the boiling point and therefore strong evapora-
Figure 10 shows the scatters of droplet temperature (Td ) vs drop- tion proceeds. These droplets generally have shorter residence
let residence time (s) in the refill zone. The results in Figs. 10(a)–10(c) times (s 20 ls). This indicates that they are freshly injected from
are, respectively, from cases 2, 5, and 3. The scatters are colored by the inlet and have been quickly heated by the detonated gas. They
their y-direction coordinates yd . The droplet temperature increases correspond to the first batch of the fuel spray injection and lie near
when the droplet residence time increases. This indicates that the the two-phase contact surface (denoted with TCS in Figs. 5–7).
droplets are continuously heated by the preheating gas when they They make significant contributions toward the formation of high
move downstream from the inlet. The scatters near the top (red color) vapor concentration along the deflagration surface, as discussed in
have the longest residence time in the refill zone and the largest height Sec. IV B. For those droplets with the intermediate location yd , the
(around 12 mm). This approximately corresponds to the detonation droplet temperature increases with yd , because of the heating by the
wave height and those droplets are close to the shock triple point con- hot gas. It should be clarified that the same scatter color generally
necting the RDW, DS, and the oblique shock (see Fig. 1). However, represents the droplets in a range of y location (3 mm for each
the temperatures of the droplets with the longest residence time are color), so the scatters with the same color are distributed when they
different. Specifically, when the prevaporized gas temperature is 400 K are plotted vs the droplet temperature. The droplet temperature
in Figs. 10(a) and 10(c), the droplet temperature can be up to 350 K, increases with droplet residence time and hence the scatters in the
while for the gas temperature is 500 K, it is around 400 K [see Fig. 10(b)]. same color are strip-shaped in Fig. 10.
Note that the averaged gas temperature in the refill zone is about 380 K Figures 11(a)–11(c) show the scatters of the droplet evaporation
(in cases 2 and 3) and 470 K (in case 5) in the refill zone, which means rate (m_ d ) vs the droplet diameter (dd ) in the refill zone in cases 2, 5,
that the droplets near the shock triple point have been close to the gas and 3. They are also colored by the y-direction location yd . We can
FIG. 12. (a) Detonation propagation speed and (b) deficit as functions of prevapor- FIG. 13. (a) Detonation propagation speed and (b) deficit as functions of prevapor-
ized gas temperature. ized gas equivalence ratio.
Phys. Fluids 33, 043307 (2021); doi: 10.1063/5.0045222 33, 043307-11
Published under license by AIP PublishingPhysics of Fluids ARTICLE scitation.org/journal/phf
observe that the droplets with a high evaporation rate m _ d have rela- are estimated by assuming that all the n-C7H16 sprays are vaporized in
tively low yd and meanwhile their corresponding diameters dd are the mixture.
more distributed, from the initial droplet diameters to very small ones. As shown in Fig. 12, detonation propagation speed Ddet in two-
Those droplets with an initial diameter (about 5 lm) correspond to phase RDC lies between the theoretical results (with SD Toolbox)
those initially injected from the inlet and interact closely with the hot from pure gas and full vaporization cases. This is because all the cur-
product gas. In general, for high prevaporized gas temperature [e.g., rent cases are under fuel-lean conditions (see Table II) and evapora-
500 K in Fig. 11(b)], the whole scatters lie at higher locations than tion of liquid n-C7H16 sprays makes the total equivalence ratio of the
those with low reactant temperature [e.g., 300 K in Fig. 11(a)], which detonable mixture closer to stoichiometric condition. Therefore, the
means that the droplet evaporation rates are generally higher. The theoretical cases with fully vaporized n-heptane have the highest deto-
upper, but sparser, scatters in Figs. 11(a)–11(c) correspond to those nation speed. Due to the existence of the n-C7H16 droplets, the com-
near the deflagration surface. The lower scatters show obvious differ- puted detonation propagation speeds from two-phase RDC are
ences and m _ d is the highest for these scatters in Fig. 11(b), because of slightly lower than the results in the full vaporization cases but higher
the high preheating temperature, which means that the concentration than those in pure gas cases from SD Toolbox. Also, due to increased
of scatters near the dashed line is high than that in Figs. 11(a) and reactant temperatures from 300 K to 500 K, the two-phase detonation
11(b) when the total scatters are close. Moreover, there are limited speed increases. The greater sensitivity of the detonation wave propa-
differences between Figs. 11(a) and 11(c) because their prevaporized gation in two-phase RDC to the reactant temperature can be found in
gas temperatures are the same. Fig. 12(a), characterized by the larger slope in the Ddet T diagram.
The rotating detonations with only prevaporized n-heptane are also
E. Detonation speed simulated with the same configuration in Fig. 1. With increased /g ,
The effects of the prevaporized gas temperature and equivalence the detonation propagation speed increases. Also, the detonation speed
ratio on rotating detonations will be discussed in this section. Figure 12 in pure gas (CFD results, /g ¼ 0.8) case is very close to the corre-
shows the average detonation speed and deficit as functions of different sponding theoretical results because of the homogeneous (purely gas)
prevaporized gas temperatures. The two-phase cases correspond to the reactants ahead of the RDW. Moreover, velocity deficit Df of the two-
numerical simulations in the current study. Pure gas cases (theoretical phase RDW propagation speed Ddet in Fig. 12(b) is estimated based
results) are the calculations based on the SD Toolbox37 and only preva- on the full vaporization cases in Fig. 12(a). Apparently, Df decreases as
porized gaseous n-C7H16 (no liquid droplets) are considered. Pure gas the reactant temperature increases from 300 K to 500 K. This is rea-
cases (CFD results) are from numerical simulations with only preva- sonable since higher reactant temperature generally results in more
porized gaseous n-C7H16 (no liquid droplets). The full vaporization droplet evaporation inside the refill zone, as shown in the results of
cases are also calculated with the SD toolbox, but the gas compositions Secs. IV A and IV B.
FIG. 14. Trajectories of peak pressure:
(a) T ¼ 300 K and /g ¼ 0.8; (b)
T ¼ 400 K and /g ¼ 0.8; (c) T ¼ 500 K
and /g ¼ 0.8; (d) T ¼ 400 K and
/g ¼ 0.7; (e) T ¼ 400 K and /g ¼ 0.65.
Image size is 0.0132 m 0.0136 m.
Phys. Fluids 33, 043307 (2021); doi: 10.1063/5.0045222 33, 043307-12
Published under license by AIP PublishingPhysics of Fluids ARTICLE scitation.org/journal/phf
Figure 13 shows the variations of the detonation propagation speed boundaries is considered to mimic the annular rotating detonation
with different prevaporized gas equivalence ratios (/g ). The computed combustor. Emphasis is laid on the effects of prevaporized gas temper-
speeds in the two-phase RDC are between the full vaporization and pure ature and equivalence ratio on fuel droplets and vapor distributions in
gas results. Moreover, they have the largest slope, indicating the favorable the fuel refill zone. Also, their effects on detonation propagation speed
effects of higher /g on two-phase RDW propagation. Higher prevapor- and cell sizes are also discussed. The main conclusions are summa-
ized gas equivalence ratio /g can support stronger RDW, and when the rized as below.
n-C7H16 droplets cross the detonation fronts more droplets can be gasi- Increasing the prevaporized gas temperature significantly pro-
fied and consumed by the detonation wave.23 Therefore, the detonation motes the droplets vaporization in the refill zone and their evaporation
speed deficit decreases with the prevaporized gas equivalence ratio. The
detonation speeds from the pure gas cases from SD Toolbox and CFD
results have a similar trend and they are close because of the homoge-
neous gaseous reactant ahead of RDW in the CFD calculations.
F. Detonation cell size
Figure 14 shows the numerical soot foils of rotating detonations
with different prevaporized gas temperatures and equivalence ratios. The
cells in Fig. 14 are recorded from the trajectories of peak pressure, corre-
sponding to the triple points connecting the Mach stem, incident wave,
and transverse shock wave along the detonation front. Note that the
lower boundary of each figure corresponds to the reactant inlet. It is sup-
pressed immediately behind the detonation waves (since the local pres-
sure near the inlet is lower than the total pressure) and assumed to be
nonpenetrating walls in our simulations.23 Therefore, the transverse
waves (hence triple points) are reflected when they reach the inlet.
Nevertheless, when the moving transverse waves arrive at the shock tri-
ple point (connection of detonation, oblique shock, and deflagration sur-
face, see the notation in Fig. 1), the transmission of the transverse waves
occurs, which can be shown by the light gray trajectories near the upper
boundaries of the numerical soot foils. They, therefore, escape from the
detonation front and imping the oblique shock wave. Nevertheless, part
of the transverse wave is reflected from the deflagration surface, which
can be observed by the downward movement of the triple points along
the detonation wave. It has been shown that the continuous reflection of
the transverse wave from the triple point at the top of the RDW front is
critical for sustaining stable detonation propagation.22
We first focus on Figs. 14(a)–14(c), which have the same preva-
porized gas equivalence ratio (0.8) but different reactant temperatures
(300, 400, and 500 K, respectively). It is seen that generally the detona-
tion cell size decreases and becomes more uniform as reactant temper-
ature increases from 300 K to 500 K. This means that the detonable
gaseous mixture is more reactive due to higher temperature and also
n-C7H16 vapor addition, and hence there are more triple points along
the detonation front. For Figs. 14(b), 14(d), and 14(e), they have the
same gas temperature (400 K) but different prevaporized gas equiva-
lence ratios (0.8, 0.7, and 0.65, respectively). Obviously, the cell size
and irregularity increase when /g decreases, which implies that the
rotating detonations are more unstable when the prevaporization
degree is lowered. This may be also affected by the in situ droplet evap-
oration, since the lower /g also reduces the droplet evaporation near
the detonation wave.23 The influences of the droplet addition on deto-
nation cell sizes are also shown through the comparisons with the cell
sizes of the droplet-free mixtures (see the Appendix D).
V. CONCLUSIONS
Two-dimensional rotating detonations fueled by partially
prevaporized n-heptane sprays are simulated with the hybrid FIG. 15. Comparisons of the two-step34,35 and detailed36 chemical mechanisms:
Eulerian–Lagrangian method. A flattened domain with periodic (a) pressure, (b) temperature, and (c) propagation speed.
Phys. Fluids 33, 043307 (2021); doi: 10.1063/5.0045222 33, 043307-13
Published under license by AIP PublishingYou can also read


