A signaling loop of REST, TSC2 and b-catenin governs proliferation and function of PC12 neural cells
←
→
Page content transcription
If your browser does not render page correctly, please read the page content below
JCS ePress online publication date 24 August 2011

                          Research Article                                                                                                                                               1

                          A signaling loop of REST, TSC2 and b-catenin governs
                          proliferation and function of PC12 neural cells
                          Romana Tomasoni1,2,*, Sara Negrini3,4,*, Stefania Fiordaliso3,4, Andrijana Klajn5, Tatiana Tkatch6,
                          Anna Mondino1,`, Jacopo Meldolesi2,3,4,` and Rosalba D’Alessandro3,4,§
                          1
                           Division of Immunology, Transplantation/Infectious Diseases, San Raffaele Scientific Institute, Via Olgettina 60, 20132 Milan, Italy
                          2
                           Vita-Salute San Raffaele University, Via Olgettina 58, 20132 Milan, Italy
                          3
                           Division of Neuroscience, San Raffaele Scientific Institute, Via Olgettina 58, 20132 Milan, Italy
                          4
                           IIT Network, Research Unit of Molecular Neuroscience, Via Olgettina 58, 20132 Milan, Italy
                          5
                           Institute of Molecular Genetics and Genetic Engineering, University of Belgrade, 444a Vojvode Stepe Str., PO Box 23, 11010 Belgrade, Serbia
                          6
                           Department of Neuroscience and Brain Technologies, Italian Institute of Technology, Via Morego 30, 16163 Genova, Italy
                          *These authors contributed equally to this work
                          `
                           Authors for correspondence (mondino.anna@hsr.it; meldolesi.jacopo@hsr.it)
                          §
                            Present address: S. De Bellis Scientific Institute, 70013 Castellana Grotte, Bari, Italy

                          Accepted 1 June 2011
                          Journal of Cell Science 124, 1–13
                           2011. Published by The Company of Biologists Ltd
                          doi: 10.1242/jcs.087551

                          Summary
                          The RE-1-specific silencing transcription factor (REST or NRSF) is a transcription repressor that orchestrates differentiation and also
                          operates in differentiated neurons and neurosecretory cells (neural cells). Its role in proliferation has been investigated so far only in
Journal of Cell Science

                          rapidly growing tumors, with conflicting results: suppression in non-neural tumors, stimulation in medulloblastomas. Working with two
                          clones of chromaffin–neuronal PC12 cells, which express different levels of REST, and using genetic complementation and knockdown
                          approaches, we show that REST also promotes proliferation in differentiated neural cells. Mechanistically, this occurs by a signaling
                          pathway involving REST, the GTPase-activating protein tuberin (TSC2) and the transcription co-factor b-catenin. In PC12 cells, raised
                          expression of REST correlates with reduced TSC2 levels, nuclear accumulation and co-transcriptional activation of b-catenin, and
                          increased expression of its target oncogenes Myc and Ccnd1, which might account for the proliferation advantage and the distinct
                          morphology. Rest transcription is also increased, unveiling the existence of a self-sustaining, feed-forward REST–TSC2–b-catenin
                          signaling loop that is also operative in another neural cell model, NT2/D1 cells. Transfection of REST, knockdown of TSC2 or forced
                          expression of active b-catenin recapitulated the biochemical, functional and morphological properties of the high-expressing REST
                          clone in wild-type PC12 cells. Upregulation of REST promoted proliferation and phenotypic changes, thus hindering neurosecretion.
                          The new REST–TSC2–b-catenin signaling paradigm might have an important role in various aspects of neural cell physiology and
                          pathology, including the regulation of proliferation and neurosecretion.

                          Key words: PC12 cells, NT2/D1 cells, Neural cell differentiation, Neurosecretion, Gene expression

                          Introduction                                                                                 levels including RNA processing, editing and trafficking (Conaco
                          The RE-1-specific silencing transcription factor (REST, also                                 et al., 2006; Wu and Xie, 2006; Johnson et al., 2009; Quareshi and
                          referred to as NRSF) is a well-known repressor of hundreds of                                Mehler, 2009). The role of REST is important not only during
                          genes that contain the specific binding sequence RE-1 in their                               development but also in mature neural cells, where its levels
                          promoter (or other regulatory) region (Bruce et al., 2004; Wu and                            remain low, but are modulated in various physiological and
                          Xie, 2006; Otto et al., 2007). Many such genes are specific for                              pathological conditions. REST, therefore, is not only a master
                          neurons and neurosecretory cells (together known as neural cells).                           regulator of cell differentiation, but is also instrumental in the
                          High levels of REST are typical of pluripotent stem cells and also                           regulation of mature neural cell homeostasis and plasticity.
                          of mature non-neural cells where REST precludes the expression                                  In addition to single genes, REST also governs the expression of
                          of its target genes. In neural progenitor cells, a rapid                                     comprehensive processes. Neurosecretion, a process typical of
                          downregulation of REST orchestrates the expression of a variety                              mature neural cells, takes place only in low-expressing (‘low’)
                          of neural-specific genes, including those encoding channels,                                 REST cells inasmuch as most genes encoding for the proteins
                          receptors, enzymes and intracellular regulatory proteins (Ballas                             involved are targets of the repressor (Bruce et al., 2006;
                          and Mandel, 2005; Johnson et al., 2007; Ooi and Wood, 2007).                                 D’Alessandro et al., 2008). Moreover, the plasma membrane
                          Additional genes, which are not direct targets of REST, are                                  expansion necessary for neurite outgrowth can be sustained by the
                          regulated indirectly, for example by the repression of transcription                         exocytosis of vesicles, the enlargeosomes, expressed under the
                          factors such as Isl1, Phox2a and Myt1 (Bruce et al., 2004; Otto et                           control of REST (Racchetti et al., 2010; Schulte et al., 2010).
                          al., 2007; Quareshi and Mehler, 2009). Finally, REST has been                                Whether REST also has a role in the proliferation of competent
                          found to repress the expression of non-coding RNAs such as                                   neural cells remains unclear. In a rapidly growing, undifferentiated
                          miRNAs and maRNAs, acting at various post-transcriptional                                    neural cell tumor, the medulloblastoma, high levels of the
2 Journal of Cell Science 124 (0)
repressor were reported to maintain the stemness of the cells (Su et GTPase-activating protein tuberin (also known as tuberous
al., 2006; Kagalwala et al., 2008). This mechanism, however, sclerosis complex 2, TSC2) and the multifunctional protein b-
should not work in proliferating neural cells characterized by a catenin, which acts as a co-transcription factor. Gain of REST
more differentiated phenotype. expression lowers TSC2 levels, which favors nuclear
In the present study, carried out in PC12 cell accumulation of b-catenin, ultimately enabling slowly
pheochromocytoma line, a differentiated neural cell model that proliferating cells with a higher rate of cell division. Of note,
acquires a neuron-like phenotype upon treatment with NGF, we downregulation of TSC2 and b-catenin co-transcription not only
show in contrast that upregulation of REST promotes promote PC12 cell proliferation, but also reinforces the
proliferation. This regulatory role of REST occurs through its expression of REST, which in turn induces the coordinated
functional interaction, never reported before, with two key repression of neurosecretion. These results were duplicated in
ubiquitous signaling proteins known to promote proliferation: the another type of neural cell, NT2/D1 cells (Andrews, 1984),
investigated before and after differentiation by treatment with
retinoic acid and transfection with REST. The self-sustaining,
feed-forward signaling loop of REST, TSC2 and b-catenin
appears therefore to be a signaling paradigm that participates in
the regulation of functions that were until now believed to be
controlled independently. It might therefore have a major role in
the cell biology and physiology of neural cells.
Results
High-REST PC12-27 cells reveal a proliferation advantage
when compared with low-REST wtPC12 cells
To investigate the role of REST in proliferation we took
Journal of Cell Science
advantage of two PC12 clones extensively characterized in our
laboratory: wild-type PC12 (wtPC12) and PC12-27 (Malosio et
al., 1999; Grundschober et al., 2002). Whereas the first expresses
the very low levels of REST typical of mature neural cells, the
second spontaneously expresses levels of REST ,50-fold higher
(D’Alessandro et al., 2008). The low and high REST levels
accounted for full or defective competence for neurosecretion,
respectively (D’Alessandro et al., 2008). In addition to their
distinct neurosecretory competence, the two clones revealed clear
differences in shape, size and cytoskeletal organization (Fig. 1A).
wtPC12 cells exhibited the quasi-spherical phenotype typical of
the cell line during growth (Greene and Tischler, 1976), whereas
PC12-27 cells appeared larger, spread out and strictly adherent to
the culture surface (Fig. 1A). The distribution of actin, which was
ordered and concentrated in the cortical cytoplasm of wtPC12,
was by contrast, mostly spread in thick fibers running through the
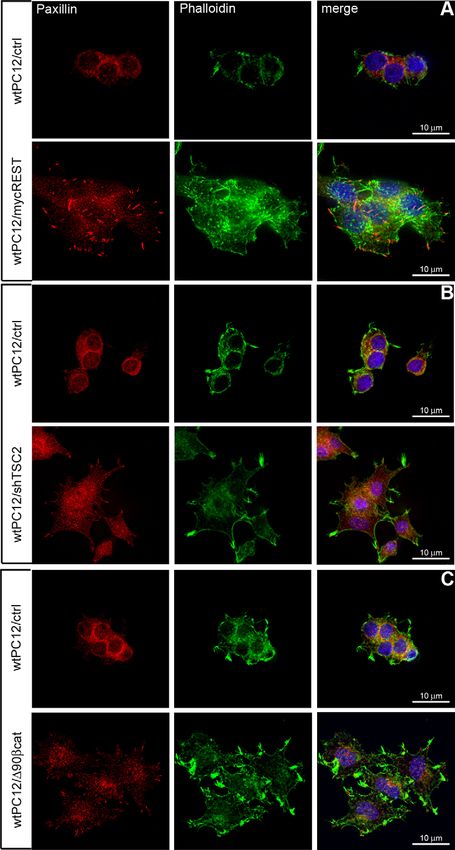
Fig. 1. PC12-27 cells reveal larger size and surface and proliferative
advantage when compared with wtPC12 cells. (A) wtPC12 and PC12-27
cells, fixed and dually stained with antibodies against paxillin (left) and
phalloidin–FITC conjugate (middle), were analyzed by confocal microscopy
and image deconvolution. Nuclei were stained with DAPI. Images on the right
were obtained by merging the three individual channels. (B) The surface area
of attached wtPC12 and PC12-27 cells was evaluated by whole-cell patch-
clamp capacitance (Cm) assays. Data shown, expressed in pF, are means ¡
s.e.m. of the results in 13 wtPC12 and 6 PC12-27 cells. (C) The volume of
wtPC12 and PC12-27 cells was evaluated by cytofluorimetry. Representative
histograms of the forward scatter (FSC) (left) and means ¡ s.e.m. of
quantified results of four independent experiments (right) are shown. MFI,
mean fluorescence intensity. (D) wtPC12 and PC12-27 cell proliferation was
measured daily by viable Trypan-Blue-assisted counting of triplicate wells.
The data shown are means ¡ s.e.m. of nine independent experiments
expressed as fold increases in cell number versus day 3. Proliferation was
revealed also by two additional techniques. (E) Flow cytometry of wtPC12
and PC12-27 cells labeled with the CFSE fluorescent dye: a representative
day 5 histogram (left) and means ¡ s.e.m. of quantified results in three
experiments with replicate wells (right) are shown. (F) Immunofluorescence
confocal microscopy of the same cells dually stained in the nucleus with anti-
Ki67 pAb and DAPI. ***P,0.001; **P,0.01; *P,0.05. Scale bars: 10 mm.Signaling and proliferation of neural cells 3
whole cytoplasm in PC12-27 cells. Paxillin, an adaptor protein of To establish whether the proliferative advantage of PC12-27
the complex linking the actin cytoskeleton to plasma membrane cells was dependent on the increased activity of mTORC1, we
integrins, was also differently distributed in the clones, being investigated the effect of the inhibitory drug rapamycin. In spite
concentrated in many discrete, small and closely adjacent puncta of the marked inhibition of the mTORC1 phosphorylation (see
over the basal plasmalemma in wtPC12 cells, and in fewer, much supplementary material Fig. S1B), the proliferation of high-
larger structures, prominent especially in finger-like protrusions REST PC12-27 cells was largely insensitive to the drug
surrounding the cell profile of PC12-27 cells (Fig. 1A). The (supplementary material Fig. S1C). Because of the well-known
differences in surface area of attached wtPC12 and PC12-27 cells inhibitory action of rapamycin on mTORC1, and in spite of the
were quantified by patch-clamp cell capacitance assay (Racchetti caveats associated with the use of pharmacological tools, these
et al., 2010). When compared with wtPC12, PC12-27 cells results strongly suggest that the faster proliferation of PC12-27
showed almost double capacitance values (22.7¡3.7 versus cells depends only to a minor extent on the kinase. Because of
11.4¡2.0 pF, corresponding to 1634 versus 892 mm2) (Fig. 1B). this, mTORC1 was not investigated any further.
Likewise, when the cells were analyzed by flow cytometry, We therefore turned our attention to the regulatory steps
PC12-27 cells reproducibly showed a significantly larger forward upstream of mTORC1. A main controller of the latter kinase is
scatter (FSC), which is proportional to cell size (Fig. 1C). We the tuberous sclerosis (TSC) complex, which is composed of two
also noticed that PC12-27 cells reproducibly reached confluence proteins, TSC1 and TSC2. Although the complex, by its binding
faster than wtPC12 cells. To investigate the possibility that high to the small GTPase Rheb, inhibits mTORC1, it promotes
levels of REST confer a proliferative advantage, we analyzed the mTORC2 signaling (Huang et al., 2008; Huang and Manning,
two clones by daily, viable Trypan-Blue-assisted counting and 2009; Laplante and Sabatini, 2009). In addition, the TSC1–TSC2
established their single cell division rates by the 5-(6)- complex can have an impact on cell proliferation through its
carboxyfluorescein succinimidylester (CFSE) dilution assay. positive control of the turnover of b-catenin (Mak et al., 2003;
Compared with wtPC12 cells, we found that, starting by day 4 Jozwiak and Wlodarski, 2006; Barnes et al., 2010). We thus
after seeding, PC12-27 cells accumulated to higher numbers investigated the expression of the TSC complex and b-catenin in
(Fig. 1D), and this was due to a faster rate of cell division on a wtPC12 and PC12-27 cells. Although TSC1 levels did not differ
Journal of Cell Science
per cell basis (Fig. 1D,E). To exclude the possibility that PC12 to a significant extent (supplementary material Fig. S2A), TSC2
cells entering senescence might contribute to the observed levels were consistently and significantly lower (–45%) in PC12-
differences, expression of Ki67, a indicator of active 27 compared with wtPC12 cells (Fig. 2A). This was due to post-
proliferation, was investigated. Fig. 1F shows that Ki67 transcriptional event(s), because Tsc2 mRNA levels were similar
immunolabeling was intense and followed the distribution of in wtPC12 and PC12-27 cells (supplementary material Fig. S2B).
chromatin in the nuclei of both wtPC12 and PC12-27 cells, In line with reduced TSC2 levels, expression of b-catenin was
characterized by small and large areas, respectively. This result higher in PC12-27 cells when compared with wtPC12 cells, with
supports the notion that the growth advantage of PC12-27 over significantly higher representation in the nucleus (Fig. 2B). This
PC12 cells (depicted in Fig. 1D) is caused by increased correlated with a higher b-catenin-dependent transcriptional
proliferation of the former, rather than premature senescence of activity (revealed by a luciferase reporter assay, Fig. 2C) and
the latter. Thus, low and high REST-expressing PC12 cells show with the higher expression of known b-catenin–TCF-LEF target
differences not only in neurosecretion (D’Alessandro et al., genes Myc, Rest (Willert et al., 2002; Nishihara et al., 2003) and
2008), but also in cell size, shape and proliferation rate. (to a lower extent) also Ccnd1 (Fig. 2D).
To investigate whether b-catenin transcription activity was
Faster proliferation rate of high-REST PC12-27 cells indeed responsible for the higher target gene expression and the
reflects downregulation of TSC2 and increased b-catenin proliferation advantage of PC12-27 cells, we adopted a
co-transcriptional activity pharmacological approach using two drugs known to operate by
The general phenotype of PC12-27 cells, combined with their different mechanisms. We took advantage of quercetin, a blocker
faster rate of proliferation, was reminiscent of the phenotype of the b-catenin–TCF-LEF transcription (Park et al., 2005) and of
previously reported for HeLa cells defective of rictor (Sarbassov endo-IWR1, which favors b-catenin degradation (Chen et al.,
et al., 2004). Rictor is a member of the mammalian target of 2009). In PC12-27 cells, both drugs inhibited to a significant extent
rapamycin protein kinase complex 2 (mTORC2). Knockdown of the b-catenin-dependent reporter gene expression (Fig. 2E) and the
rictor results in a defect of mTORC2 accompanied by expression of Myc and Rest (Fig. 2F), whereas in wtPC12, these
overstimulation of mTORC1 with ensuing inhibition and effects were smaller and non-significant (not shown). Moreover,
activation, respectively, of the signaling cascades governed by the two drugs abrogated the proliferation advantage of high-REST
the two mTOR complexes (Sarbassov et al., 2004). To investigate PC12-27 cells (Fig. 2G). Taken together, results obtained by the
whether mTORCs have a role in wtPC12 and PC12-27 cells, we comparison of wtPC12 and PC12-27 cells link REST levels to
assayed the phosphorylation of target proteins downstream of the TSC2 levels and to b-catenin nuclear activity, which is critical for
two complexes. S6 and 4E-BP1, commonly used as readouts of cell proliferation.
mTORC1 activity, were phosphorylated in both wtPC12 and
PC12-27 cells, however, to a higher extent in the latter. By REST, TSC2 and b-catenin, interconnected in a feed-
contrast, phosphorylation of Akt at S473, a readout of mTORC2 forward loop, control PC12 cell proliferation
activity, and of the Akt substrate, glycogen synthase kinase 3b The results reported so far (Figs 1 and 2), which reveal
(GSK3b) at S9, was lower in the high-REST PC12-27 cells when differences in structure, signaling and proliferation between the
compared with the low-REST wtPC12 cells (supplementary two PC12 clones, the low-REST wtPC12 and the high-REST
material Fig. S1A). Thus, in PC12-27 cells, the signaling of both PC12-27, suggested that REST, TSC2 and b-catenin might be
mTORC1 and mTORC2 appears to be deregulated. interconnected in a signaling loop controlling proliferation of4 Journal of Cell Science 124 (0)
Fig. 2. In high-REST PC12-27 cells, reduced TSC2 levels correlate
with b-catenin nuclear accumulation and with increased b-catenin-
Journal of Cell Science
dependent transcription and proliferation. (A) Lysates and
(B) nuclear and cytosolic fractions of wtPC12 and PC12-27 cells were
analysed by SDS-PAGE and western blotting. b-tubulin and the
histone H2b were used for normalization. Representative western blots,
with molecular size markers (indicated here and in the following
figures in kDa), are shown to the left; means ¡ s.e.m. of the results of
three independent experiments quantified by densitometry, on the
right. a.u., arbitrary units. (C) b-catenin co-transcriptional activity was
evaluated by a luciferase reporter assay. wtPC12 and PC12-27 cells
were transfected, the luciferase activity was measured 24 hours later.
Results shown are means ¡ s.e.m. from three independent
experiments. (D) Expression of b-catenin target genes in wtPC12 and
PC12-27 cells. mRNA encoding Myc, cyclin D1 and REST was
assayed by RT-PCR and values were normalized to the GAPDH
housekeeping gene and then expressed relative to control wtPC12
cells. Means ¡ s.e.m. of the results from three independent
experiments are shown. (E) b-catenin co-transcriptional activity
evaluated by the luciferase reporter assay: effects of quercetin (a
blocker of b-catenin-dependent transcription, 100 mM) and endo-
IWR1 (that favors b-catenin degradation, 10 mM) administered from
the fourth and fifth day of culture. Nt, untreated cells. Results shown
are means ¡ s.e.m. from three independent experiments.
(F) Expression of Myc and Rest genes in PC12-27 cells, effects of
quercetin and endo-IWR1, conditions and processing and presentation
of the results as in D. Results shown are means ¡ s.e.m. from three
independent experiments. (G) wtPC12 and PC12-27 cell proliferation
measured daily by viable Trypan-Blue-assisted counting of triplicate
wells as in Fig. 1D. nt, PC12-27 cells untreated with the drugs.
Treatment with quercetin and endo-IWR1 as in E. Results shown are
means ¡ s.e.m. from three independent experiments. Significance
shown between PC12-27 cells without and with drug. ***P,0.001;
**P,0.01; *P,0.05.
PC12 cells. In view of the considerable differences in gene First, we investigated the impact of REST downregulation and
expression existing between the two clones (Grundschober et al., TSC2 overexpression in PC12-27 cells. Transient transfection of a
2002), however, the possibility of the results to be correlative, dominant-negative construct of REST (D’Alessandro et al., 2008)
rather than conclusive, could not be excluded. To directly prove correlated with significant increases of the TSC2 levels
the link of REST, TSC2 and b-catenin we carried out gene (supplementary material Fig. S3A), suggesting that the latter is
complementation and downregulation experiments. under the inhibitory control of the repressor. Likewise, transfectionSignaling and proliferation of neural cells 5
of PC12-27 cells with a full-length construct of TSC2 caused a We next investigated the effects of TSC2 knockdown by
significant decrease of Myc and Rest gene expression shRNA. TSC2 levels were reduced when compared with the
(supplementary material Fig. S3B), together with a gain of the wtPC12 cells transfected with a control shRNA (Fig. 4A). TSC2
b-catenin and REST proteins. These initial data suggest therefore downregulation correlated with increased accumulation of b-
that the expression of REST, TSC2 and b-catenin is linked. catenin (Fig. 4A) that proved to be transcriptionally active
Then we turned to wtPC12 cells. First, the cells were infected (Fig. 4B), and with large increases of Myc and Ccnd1 gene
with lentiviral vectors encoding GFP (control cells) or for GFP– expression (Fig. 4C). In addition to b-catenin, also REST levels
Myc-tagged REST, and then sorted by FACS. Forced REST and gene expression were found to increase following TSC2
upregulation (Fig. 3A,B) caused a downregulation of TSC2 with downregulation (Fig. 4A,C), and TSC2-knockdown cells
a gain of b-catenin levels (Fig. 3C) and activity (Fig. 3D,E). accumulated to greater numbers compared with control wtPC12
These changes were accompanied by changes of protein and similarly to PC12-27 cells (Fig. 4D). Of note, this
phosphorylation expected in low-TSC2 cells, i.e. increased proliferation advantage was abrogated by quercetin and endo-
phosphorylation of the mTORC1 targets, S6 and 4E-BP1, and IWR1, drugs that affect b-catenin transcription and promote its
decreased phosphorylation of the mTORC2 target Akt and of degradation, respectively (Fig. 4E).
GSK3b (supplementary material Fig. S4). REST-infected PC12 Last, we evaluated the impact of forcing b-catenin nuclear
cells also revealed a proliferation advantage when compared with accumulation and transcriptional activity. PC12 cells were stably
control-infected cells (Fig. 3F). transfected with a b-catenin construct truncated of the N-terminal
Journal of Cell Science
Fig. 3. REST regulates the levels of TSC2 and b-catenin and cell proliferation in wtPC12. wtPC12 cells were infected with GFP (ctrl) or GFP–Myc-tagged
REST (mycREST) lentiviral vectors. (A) Expression of Rest mRNA. (B) Levels of REST in the two infected cell populations, representative western blots also
showing b-tubulin used for normalization (left); and means ¡ s.e.m. of the results of three independent experiments quantified by densitometry (right). (C) TSC2
and b-catenin in the two infected populations, presentation as in A. (D) b-catenin co-transcriptional activity evaluated by the luciferase reporter assay in the two
infected cell populations. Conditions and processing and presentation of the results (from three independent experiments) as in Fig. 2C. (E) Expression of b-
catenin target genes, conditions and processing and presentation of the data (from three independent experiments) as in Fig. 2D. (F) Proliferation of the two
infected cell populations measured daily by viable Trypan-Blue-assisted counting of triplicate wells; means ¡ s.e.m. from three independent experiments as in
Fig. 1D. ***P,0.001; **P,0.01; *P,0.05.6 Journal of Cell Science 124 (0)
Fig. 4. TSC2 regulates b-catenin levels and
cell proliferation in wtPC12. wtPC12 cells
were stably transfected with the control
construct (ctrl) or the shRNA TSC2 construct
(shTSC2). (A) Representative western blots of
cells infected with the two constructs showing
the levels of TSC2, b-catenin and REST
together with H2b and b-tubulin used for
normalization (left); and means ¡ s.e.m. of
the results of six independent experiments
quantified by densitometry (right). (B) b-
catenin co-transcriptional activity evaluated in
the control and shTSC2-transfected cells by
the luciferase reporter assay. Conditions and
processing/presentation of the results (from six
independent experiments) as in Fig. 2C.
(C) Expression of the Myc, Ccnd1 and Rest
genes in the control and shTSC2-transfected
cells. Conditions and processing and
presentation of the data from six experiments
as in Fig. 2D. (D) wtPC12, PC12-27, control
and shTSC2 cells proliferation measured daily
by viable, Trypan-Blue-assisted counts of
triplicate wells; means ¡ s.e.m. from three
independent experiments as in Fig. 1D.
Journal of Cell Science
Significance shown between control and
shTSC2-transfected cell populations.
(E) Control and shTSC2 cell proliferation,
effects of quercetin (middle) and endo-IWR
(right), presented as in D. Significance shown
between shTSC2 and shTSC2+drug cell
populations. ***P,0.001; **P,0.01;
*P,0.05.
90 amino acid residues (D90bCat-GFP). Loss of these residues 27, revealed marked differences in their shape and cytoskeleton
increases b-catenin stability (Chenn and Walsh, 2002). organization (Fig. 1A–C). The question now was whether the
Expression of D90bCat (Fig. 5A) was reflected by gained b- changes of individual components of the REST–TSC2–b-catenin
catenin co-transcriptional activity (Fig. 5B) and upregulation of signaling loop, described in Figs 3–5 and supplementary material
Myc and Rest gene expression (Fig. 5C). Expression of the Ccnd1 Fig. S3, were also able to impact the general structure of wtPC12
gene was also increased, albeit to a lower extent (Fig. 5C). The cells, making them similar to the PC12-27 cells. Fig. 6
levels of the REST protein were increased in D90bCat- demonstrates that this was indeed the case. Although the
transfected wtPC12 cells, whereas TSC2 levels were decreased changes observed were not identical, the wtPC12 cells infected
(Fig. 5D). D90bCat-transfected cells also revealed a proliferation with REST (Fig. 6A), knocked down for TSC2 (Fig. 6B) or
advantage that was similar to that of PC12-27 cells when transfected for D90bCat (Fig. 6C) appeared all larger, flatter and
compared with parental and control cells (Fig. 5E). Interestingly, more strictly attached to the culture surface when compared with
this advantage was largely abrogated by quercetin (Fig. 5F, left the various controls, transfected with the empty plasmids, that
panel), but not by endo-IWR (Fig. 5F, right panel). This latter appeared largely analogous to the parental wtPC12 cells. The actin
result was expected because endo-IWR is largely ineffective on cytoskeleton was reorganized in fibers running through the whole
the degradation-resistant D90bCat construct. cytoplasm (evident especially in the REST-infected cells, Fig. 6A)
Thus, forcing upregulation of REST, downregulation of TSC2 and in discrete structures (prominent in the D90bCat cells,
or increased transcriptional activity of b-catenin promote Fig. 6C), whereas paxillin was also redistributed with some
reciprocal changes in their relative expression levels, and have accumulation in the peripheral cytoplasmic protrusions (prominent
an impact on wtPC12 cell proliferation. These results, which in the REST-infected cells, Fig. 6A).
recapitulate in wtPC12 the properties of PC12-27 cells, directly In various cell types, the acquisition of a proliferative advantage
link REST, TSC2 and b-catenin in a feed-forward loop favoring is accompanied by defects of cell-specific functions. Because
PC12 cell proliferation. REST is a repressor of many neural cell-specific genes, in
particular of those encoding proteins involved in neurosecretion
Interfering with the level or the activity of REST, TSC2 or (Bruce et al., 2006; D’Alessandro et al., 2008), we investigated
b-catenin co-ordinately impacts the structure and whether decreasing TSC2 levels and favoring b-catenin
neurosecretion of wtPC12 cells transcription activity might also have an impact on the
In addition to the differences in proliferation, the comparative expression of neurosecretory genes. To this aim, we analyzed the
study of the low- and high-REST PC12 clones, wtPC12 and PC12- expression of three specific genes known to be REST targetsSignaling and proliferation of neural cells 7
Fig. 5. b-catenin regulates REST and TSC2 levels
and cell proliferation in wtPC12. wtPC12 cells were
stably transfected with either an empty construct (ctrl)
or a construct encoding an N-terminal-truncated form
of b-catenin (D90bcat). (A) Representative western
blots of cells infected with the control and D90bcat
constructs showing the levels of D90bcat-GFP and
endogenous b-catenin together with b-tubulin used for
normalization (left); and comparison of the levels
(means ¡ s.e.m.) of the two forms of b-catenin,
Journal of Cell Science
results of three independent experiments quantified by
densitometry (right). (B) b-catenin co-transcriptional
activity evaluated by the luciferase reporter assay in
the control- and D90bcat-transfected cells. Conditions
and processing/presentation of the results (from three
independent experiments) as in Fig. 2C.
(C) Expression of the Myc, Ccnd1 and Rest genes in
the control and D90bcat-transfected cells. Conditions
and processing and presentation of the data from three
to five experiments as in Fig. 2D. (D) Representative
western blots of cells infected with the control and the
D90bcat constructs showing the levels of REST and
TSC2 together with b-tubulin used for normalization
(left); and means ¡ s.e.m. of the results of three
independent experiments about the REST and TSC2
levels quantified by densitometry (right). (E) Control
and D90bcat-transfected cell proliferation measured
daily by viable Trypan-Blue-assisted counts of
triplicate wells. Comparison with non-transfected
wtPC12 and PC12-27 (left), Means ¡ s.e.m. from
three independent experiments as in Fig. 1D.
Significance shown between control and D90bcat.
(F) Control and D90bcat populations, effects of
quercetin (middle) and endo-IWR (right).
Means ¡ s.e.m. from three independent experiments
as in Fig. 1D. Significance shown between D90bcat
and D90bcat+drug cell populations. ***P,0.001;
**P,0.01; *P,0.05.
(Bruce et al., 2006; D’Alessandro et al., 2008): the dense-core The REST–TSC2–b-catenin loop operates also in NT2/D1
vesicle secretory granin, chromogranin B, the vesicle Ca2+ sensor cells
synaptotagmin-1 and the plasma membrane SNARE SNAP25. In To establish whether the results reported for PC12 cells might be
the wtPC12 cells infected with REST (Fig. 7A), knocked-down for valid also for other neural cells, we investigated the human NT2/
TSC2 (Fig. 7B) or transfected with D90bCat (Fig. 7C), the D1 neural cell model. NT2/D1 cells grown in culture exhibit an
proteins encoded by these neurosecretion genes were decreased, undifferentiated phenotype that is converted irreversibly into
to significant degrees except for synaptotagmin-1 in the D90bCat- neuron-like during long-term treatment with retinoic acid
transfected cells. Thus, changes in either REST, TSC2 or b-catenin (Andrews, 1984). Fig. 8A shows that expression of Myc and
affect not only proliferation, but also the shape, cytoskeleton and Rest was very high in undifferentiated NT2/D1 cells, and greatly
neurosecretory function of PC12 cells. reduced upon 4 weeks of treatment with retinoic acid (10 mM).8 Journal of Cell Science 124 (0)
Journal of Cell Science
Fig. 6. wtPC12 cell size, shape and cytoskeleton before and after
infection or transfection with REST, TSC2 or b-catenin.
Representative images of wtPC12 infected or transfected with the
control constructs (ctrl) of Figs 3, 4 and 5 (top panels of A, B and C)
and the corresponding cells infected or transfected with mycREST,
shTSC2 and D90bcat–GFP (bottom panels), labeled by dual
immunofluorescence with anti-paxillin antibodies (left) and FITC-
conjugated phalloidin (middle). Nuclei were stained with DAPI.
Merged images are on the right. Scale bars: 10 mm.
This was accompanied by a significant gain of TSC2 levels, by the Discussion
downregulation of REST and b-catenin (Fig. 8B) and by Previous studies on the role of REST in cell proliferation have
significant increases of neurosecretion markers, synaptotagmin-1 been carried out in rapidly growing tumors. The results indicated
and SNAP25 (Fig. 8C). Infection of the retinoic-acid- that REST could function both as a tumor suppressor and as an
differentiated NT2/D1 cells (NT2-N in Fig. 8D–F) with REST oncogene, depending upon the cellular context (Coulson, 2005;
induced a reversal of these changes: expression of Myc and Rest Majumder, 2006). Aggressive tumors of non-nerve origin (of the
was re-established (Fig. 8D), TSC2 levels were greatly reduced, lung, breast, colorectum and prostate) were found to have lost (or
whereas b-catenin levels were increased (Fig. 8E). These changes greatly reduced) the otherwise high REST levels of their cells of
were accompanied by the attenuation of the neurosecretion origin (Coulson, 2005; Majumder, 2006; Wagoner et al., 2010;
markers, synaptotagmin-1 and SNAP25 (Fig. 8F). The link Lv et al., 2010). This suggested that REST functions in these cells
between REST, TSC2 and b-catenin appears therefore to operate as a tumor suppressor (Westbrook et al., 2005) by repressing
in NT2/D1 cells analogously to PC12 cells. transcription of the proto-oncogene TrkC (Mulligan et al., 2008)Signaling and proliferation of neural cells 9
Fig. 7. Changes in TSC2, b-catenin or
REST expression levels affect the
wtPC12 cell neurosecretory
machinery. (A–C) Representative
western blots of three proteins involved
in neurosecretion, the secretory protein
chromogranin B (ChgB), the Ca2+ sensor
synaptotagmin-1 (Syt1) and the
Journal of Cell Science
pSNARE SNAP25, in the transfected
wtPC12 cells of Figs 3, 4 and 5, i.e. the
three controls (ctrl) and the cells
transfected with Myc–REST (A),
shTSC2 (B) and D90bcat (C). The
corresponding means ¡ s.e.m. of the
results of three to six independent
experiments quantified by densitometry
are shown on the right. ***P,0.001;
**P,0.01; *P,0.05.
and/or of the kinase Akt2 (Kreisler et al., 2010). By contrast, REST confer a selective proliferation advantage in PC12 cells.
studies on several rapidly growing medulloblastomas and Mechanistically, we found that this is due to the ability of REST
medulloblastoma cell lines provided clear hints for an to lower TSC2 levels by a post-transcriptional process that
oncogenic role for REST. In these cells, REST expression was remains to be identified, and consequently allow b-catenin co-
found to be aberrant and much higher than that found in transcriptional activity. Initially, we considered the possibility
differentiated neural cells (Lawinger et al., 2000). Moreover, that the proliferation advantage was due to hyperactivation of
forced expression of a dominant-negative construct reduced the mTORC1, which indeed was evident in PC12-27 cells. However,
tumorigenic potential of these cells (Fuller et al., 2005). High the proliferation advantage of the latter cells was mostly
levels of REST alone were, however, insufficient for insensitive to the classical blocker of mTORC1, rapamycin.
tumorigenesis and cooperation with high levels of Myc in this This finding, which is consistent with a previous report of PC12
process was needed (Su et al., 2006). These findings raised cells treated with growth factors (Powers et al., 1999), excludes a
questions regarding the mechanism by which high REST main role for mTORC1 in PC12 cell proliferation, which
promotes its tumorigenic effects. The mechanism proposed, therefore was not investigated any further.
maintenance of cell stemness (Su et al., 2006; Kagalwala et al., Low levels of TSC2 in PC12-27 cells were also found to be
2008), could be appropriate for rapidly growing tumors, but not accompanied by the gain and the ensuing nuclear translocation of
for differentiated neural cells. b-catenin, a co-transcription factor known to control cell
Our present work in the PC12 pheochromocytoma cell line proliferation. The cellular levels of b-catenin are controlled by
extends the study to a new area. Indeed, PC12 cells profoundly its turnover, which is governed by the GSK3b complex. A
differ from poorly differentiated, rapidly growing number of signaling pathways, including the Wnt pathway,
medulloblastomas because they are more slowly proliferating, converge to repress the activity of this complex. In PC12-27
chromaffin-like cells, which, upon exposure to NGF, stop cells, however, a major role for GSK3b phosphorylation by
growing and are converted into neuronal-like cells (Greene and kinases such as Akt appears unlikely, because its target site, the
Tischler, 1976). For these reasons, they are the most widely used S9 residue of GSK3b (Zhang et al., 2006), was phosphorylated to
to model differentiated neural cells. By the comparative analysis a much lower extent in PC12-27 cells when compared with
of two clones of PC12, chosen because of their high (PC12-27) wtPC12 (supplementary material Fig. S1A). Furthermore,
and low (wtPC12) expression levels of REST, and by genetic previous studies in PC12 cells reported the ability of Wnt to
complementation results, we demonstrate that high levels of increase b-catenin levels and cell proliferation only upon10 Journal of Cell Science 124 (0)
application of the ligand or overexpression of Wnt, its frizzled translocation of b-catenin, with ensuing strengthening of its
receptors or the intracellular effector dishevelled (Chou et al., transcriptional activity.
2000; Kaliwara et al., 2008; Chacòn et al., 2008; Spinsanti et al., In addition to proliferation, which is probably caused by the
2008), which is not the case in our study. Thus, our data suggest increased transcription of oncogenes such as Myc and Ccnd1, the
that, as previously reported in other cell systems (Mak et al., gain and nuclear translocation of b-catenin was found to increase
2003; Jozwiak and Wlodarski, 2006; Barnes et al., 2010), a transcription of Rest. Although the REST protein has a short half-
decrease of TSC2 hinders the stability of the GSK3b complex life, and its levels are believed to depend primarily on its rapid
and hence favors the decreased degradation and nuclear turnover (Ballas and Mandel, 2005; Guardavaccaro et al., 2008;
Westbrook et al., 2008), a b-catenin control of Rest gene
transcription has been reported in teratocarcinoma (Willert et al.,
2002) and neural stem (Nishihara et al., 2003) cells. Thus, the
TSC2-controlled gain of b-catenin and the b-catenin–TCF-LEF
transcription of the Rest gene has already been reported; however,
the connection between these pathways was previously
unrecognized. The notion that changes of REST protein levels
might also be ascribed to transcriptional regulation in PC12 cells
was underlined by the inhibitory effect of quercetin, a drug that
blocks the b-catenin–TCF-LEF transcription system. Our results
uncovered the existence of a loop, and more specifically, the
ability of REST to set the level of TSC2. Although the mechanism
of the latter process remains to be clarified, the identification of the
link has been crucial to reveal the signaling architecture of the
loop, which appears not to be restricted to PC12 cells, but is also
present in retinoic-acid-treated NT2/D1 cells.
Journal of Cell Science
Interfering with REST, TSC2 or b-catenin was found to impact
not only the proliferation but also the size, shape, cytoskeletal
organization and even neurosecretory function of PC12 cells. The
role of TSC2 in the manipulation of the actin cytoskeleton and
focal adhesions, taking place through the small GTPase Rac1,
was known (Goncharova et al., 2004). Our results demonstrate
for the first time the similar effects induced by manipulations of
the other two factors, possibly mediated by their connection with
TSC2. The inhibition of neurosecretion provides a mechanistic
interpretation to the finding that rapidly proliferating neural cells
are poor or defective in neurosecretion, whereas differentiated
neural cells have lower or no proliferating capacities and proper
neurosecretory functions, thus unveiling a new pathway that
concomitantly governs the two processes (see model in
supplementary material Fig. S5).
In conclusion, our results demonstrate that REST, TSC2 and b-
catenin are linked in an integrated, self-sustaining feed-forward
loop that is crucial for PC12 cell proliferation and neurosecretory
functions. This loop, which could crosstalk with the growth factor
Fig. 8 The REST, TSC2 and b-catenin signaling loop also operates in
NT2/D1 neural cells. (A–C) Results with NT2/D1 cells before and after
differentiation with retinoic acid (10 mM, 4 weeks). (A) Expression of the
Myc and Rest genes, means ¡ s.e.m. of three experiments. (B) Representative
western blots showing the levels of REST, TSC2 and b-catenin together with
GAPDH used for normalization (left); and means ¡ s.e.m. of the results of
four to five independent experiments quantified by densitometry (right). (C)
Representative western blots showing the levels of two proteins involved in
neurosecretion, synaptotagmin-1 (Syt1) and SNAP25 together with GAPDH
(right) and means ¡ s.e.m. of the results of three independent experiments
quantitated by densitometry (right). (D–F) The corresponding results obtained
with retinoic-acid-differentiated NT2/D1 cells (NT2-N) infected with control
or REST vector. (D) Myc and Rest gene expression, means ¡ s.e.m. of three
experiments. (E) Levels of REST, TSC2 and b-catenin, representative western
blots to the left and means ¡ s.e.m. of three experiments on the right. (F)
Levels of synaptotagmin-1 (Syt1) and SNAP25; representative western blots
(left) and means ¡ s.e.m. of the results of three independent experiments
(right).Signaling and proliferation of neural cells 11
and the canonical Wnt pathways (Kwiatkowski and Manning, assay was carried out according to the manufacturer’s instructions. Briefly,
trypsinized cells, washed and resuspended in PBS at a final density of 206106/ml,
2005; Laplante and Sabatini, 2009; Huang and Manning, 2009; were mixed with the same volume of CFSE fluorescent dye in PBS (final
MacDonald et al., 2009), might have a role in other neural cell concentration 1 mM) and incubated for 8 minutes at room temperature. Deacetylated
types (as suggested by the results already obtained in NT2/D1 CFSE was quenched by the addition of FBS. Cells were then washed with complete
medium and seeded in 24-well dishes. CFSE dilution as a result of cell division was
cells) and might also be active in neurons. Although neurons do evaluated in a BD Biosciences FACSCalibur dual-laser cytometer using Flowjow
not proliferate, they remain sensitive to TSC2 and b-catenin acquisition analysis software. Where indicated, the forward scatter (FSC) of the cells
regulation of important processes (Tavazoie et al., 2005; Abe and was analyzed as an indicator of cell size.
Takeichi, 2007; Wisniewska et al., 2010; Nie et al., 2010). In this Cell surface area was estimated in patched-clamped wtPC12 and PC12-27 by
membrane capacitance electrophysiological assays. Experiments were carried out
light, it is tempting to speculate that the REST–TSC2–b-catenin and results were corrected as described previously (Racchetti et al., 2010).
signaling paradigm could be targeted for the development of
combined drug therapies targeting the TSC–mTOR and the Wnt– q-PCR
b-catenin pathways, now being investigated separately for the Total RNA was extracted using RNeasy mini columns (Qiagen, Valencia, CA),
following the manufacturer’s instructions, and its concentration was determined by
prevention of neurodegeneration (Pei and Hugon, 2008; Cerpa et spectrophotometry. 1–2 mg of total RNA were used to generate cDNA templates
al., 2009) and the treatment of medulloblastomas and other neural for RT-PCR, using Oligo dT, dNTPs and RNAsin RNAse (from Promega).
cell tumors (Klesse and Bowers, 2010; Schmidt et al., 2010). Retrotranscriptase M-MLV was from Invitrogen. q-PCR was performed using Real
Time Taqman universal master mix (Applied Biosystems) according to a standard
protocol, using 50 ng template cDNA. All primers were used at the final
Materials and Methods concentration of 900 nM. Values were normalized to the concentration of Gapdh
Antibodies and reagents mRNA. q-PCR was performed using an ABI PRISM 7700 Sequence Detection
The IgG2a, rat-specific anti-chromograninB (ChgB) monoclonal antibody (mAb), System. Values are expressed as either fold of wt or control PC12 or as a
generated in our laboratory, was used as described previously (D’Alessandro et al., percentage of untreated cells.
2008). Other antibodies were from commercial sources: anti-REST and anti-H2B
polyclonal antibodies (pAbs) (Upstate); anti-synaptotagmin-1 and anti-b-tubulin
mAbs (Synaptic Systems); anti-SNAP25 mAb (Sternberger Monoclonals); anti- Western blotting
GFP mAb (Roche); anti-b-catenin and anti-paxillin mAbs (BD Transduction); Total cell extracts were obtained by suspending cells in lysis buffer containing 1%
rabbit pAbs anti-Akt, anti-P(S473)-Akt, anti-4E-BP1, anti-TSC2, anti-TSC1, anti- Triton X-100, 50 mM Tris-HCl, pH 7.5, 250 mM NaCl, 5 mM EDTA, 50 mM
GSK3b, anti-P(S9)-GSK 3b, anti-P(Ser235/236)-S6 and anti-S6 mAb (Cell NaF, and protease and phosphatase inhibitors (Xu et al., 2003). The nuclear
Journal of Cell Science
Signaling); anti-Ki67 pAb (Millipore); anti-actin goat pAb (Santa Cruz); fraction was separated from the first, low-speed pellet by high-speed sedimentation
phalloidin-FITC conjugate and the CellTrace CFSE cell proliferation kit through a dense (1.5 M) sucrose cushion; the cytoplasmic fraction was the
(Molecular Probes); FITC-conjugated and TRITC-conjugated goat anti-rabbit supernatant of the low-speed centrifugation. Proteins were quantified by BCA
pAbs, and goat anti-mouse IgG subclasses (Southern Biotech); horseradish assay and appropriate amounts (most often 50 mg) were separated by SDS-PAGE.
peroxidase-conjugated goat anti-mouse and anti-rabbit pAbs (Bio-Rad). The BCA After transfer to nitrocellulose filters, they were immunolabeled as described
Protein Assay Kit was from Pierce; rapamycin and G418 were from Calbiochem; (Dignam et al., 1983). Photographic development was by chemiluminescence
endo-IWR1 was from Tocris and phosSTOP was from Roche. The fluorescent (ECL, Amersham Bioscience or Immobilon substrate, Millipore). Western blot
DNA-binding probe DAPI, quercetin, all-trans retinoic acid and other chemicals bands were quantified by the ImageJ program (NIH), normalized to markers (b-
were from Sigma. tubulin, actin, GAPDH or histone 2b) immunolabeled in parallel. Data are
expressed as either a percentage of the corresponding values in wt or control PC12
cells, or as arbitrary units (a.u.).
Cells and cell clones.
The PC12 clones, wtPC12 and PC12-27, and the PC12-27 subclone PC12-27/
DBD5, stably transfected with the REST DNA-binding domain, were as described Luciferase assay
previously (D’Alessandro et al., 2008). NT2/D1 cells were as used previously b-Catenin transcription assay was performed using the Dual-luciferase reporter
(Nikcevic et al., 2008). The other subclones were generated in this work. Cells, assay kit (Promega). The 166 TOPFLASH reporter plasmid (1 mg) (a gift from
clones and their subclones were grown and incubated at 37 ˚C. Randall Moon) (DasGupta et al., 2005) and 100 ng of SV40-Renilla-luc were
cotransfected using lipofectamine 2000TM, and luciferase activity was measured
24 hours later, using a luminometer (GloMax Multi Detectionm System of
Transient and stable transfections and infections Promega). Data are expressed as a.u.
Transient and stable transfections were carried out as reported previously
(D’Alessandro et al., 2008) using lipofectamine 2000TM (Invitrogen) in all cases.
The pcDNA3-FLAG-TSC2 cDNA or the corresponding empty vector (gift from Immunofluorescence
Brendan Manning, Dept. of Genetics, Harvard School of Public Health, Boston, MA) Experiments were performed as described previously (D’Alessandro et al., 2008).
were transiently transfected into PC12–27 cells that were processed 48 hours thereafter. Specifically, cell monolayers on coverslips were fixed with 4% formaldehyde for
The nt5iD90bcat/GFP construct (gift from Anjen Chenn and Christopher Walsh, Dept. 10 minutes at room temperature and quenched in 0.1 M glycine, then
Pathology, Brigham and Women’s Hospital, Harvard Medical School, Boston, MA) or permeabilized for 20 minutes in PBS containing 0.2% Triton X-100 and 1%
the vector backbone pEGFP-1 were used for stably transfecting experimental and BSA, and immunolabeled for 1 hour with anti-paxillin mAb, anti-Ki67 pAb or
control wtPC12 cells. Subclones, indicated as wtPC12/D90bcat, were grown in phalloidin–FITC conjugate diluted in PBS with 1% BSA. The bound antibodies
complete medium supplemented with 450 mg/ml of G418. To generate cells with were stained with FITC-conjugated and TRITC-conjugated goat anti-rabbit pAbs,
stable TSC2 knockdown, we transfected wtPC12 cells with TRC1 lentiviral plasmid or goat anti-mouse IgG subclasses. Nuclei were stained with DAPI. Samples were
vector pLKO.1-puro (Sigma) expressing control or TSC2 shRNAs. Forty-eight hours studied in a Perkin-Elmer Ultraview ERS confocal microscope. Image
after transfection, we added 2.5 mg/ml puromycin and selected clones. Knockdown of deconvolution was performed in a wide-field microscope of the Delta Vision
TSC2 was confirmed by qPCR and immunoblotting. Clones were then cultured in the system.
presence of 2.5 mg/ml puromycin. For infection of 1.56106 wtPC12 or NT2/D1 cells
we used a lentiviral vector (#945.PCCL.sin.cPPT.SV40ployA.eGFP.minCMV.hPGK. Statistical analyses
deltaLNGFR.Wpre, 36108 particles/10 ml) including or not (controls) the full-length The significance of the data was assessed using the two-tailed unpaired t-test and
REST tagged with Myc. After 24 hours of incubation, the cells were washed and the ANOVA test. Data shown are means ¡ s.e.m. The number of experiments is
cultured for 6 days after which they were sorted by FACS. The fraction with high GFP specified in the figures or legends. P,0.05 is considered significantly different. In
fluorescence was collected and used for the assays. the figures, ***P,0.001; **P,0.01; *P,0.05.
Cell proliferation, cell volume and cell surface area assays We thank Gabriella Racchetti, Paola Podini, Davide Pozzi Enrico
Competence of cells for proliferation was investigated by Ki67 immunofluorescence. Ponta and Luca Muzio of our Institute for the deconvolution of
wtPC12, PC12-27 and PC12-27/DBD5 cells were plated at 16104/well in a 24-well microscopic imaging and for other forms of generous support;
dish. Medium was replaced every 48 hours. Upon 3, 4 and 5 days in culture, cells
were trypsinized and counted after Trypan Blue exclusion. Differences among the
Valentina Carabelli (University of Turin, Italy) for the patch
various samples became evident after 4 days, therefore significance was calculated at clamping; Pietro Baldelli (Italian Institute of Technology, Genoa,
the fifth day. 0.1 mM rapamycin, 100 mM quercetin and 10 mM endo-IWR1 were Italy), Brendan Manning (Dept. of Genetics Harvard School of
administered for 24 hours on the fifth day of culture. The vital CFSE dye dilution Public Health, Boston, MA), Randall Moon (Institute for Stem Cell12 Journal of Cell Science 124 (0)
and Regenerative Medicine, University of Washington School of Huang, J., Dibble, C. C., Matsuzaki, M. and Manning, B. D. (2008). The TSC1-TSC2
complex is required for proper activation of mTOR complex 2. Mol. Cell. Biol. 28,
Medicine, Seattle, Wash), Anjen Chenn (Dept. of Pathology, 4104-4115.
Northwestern University Feinberg School of Medicine, Chicago, Johnson, D. S., Mortazavi, A., Myers, R. M. and Wold, B. (2007). Genome-wide
IL) and Christopher A. Walsh (Howard Hughes Medical Institute and mapping of in vivo protein-DNA interactions. Science 316, 1497-1502.
Beth Israel Deaconess Medical Center, Harvard Medical School, Johnson, R., Teh, C. H., Jia, H., Vanisri, R. R., Pandey, T., Lu, Z. H., Buckley, N. J.,
Stanton, L. W. and Lipovich, L. (2009). Regulation of neural macroRNAs by the
Boston, MA) for support and/or gifts of constructs and viral vectors. transcriptional repressor REST. RNA 15, 85-96.
This work was supported by grants from Telethon (GGGP09066 to Jozwiak, J. and Wlodarski, P. (2006). Hamartin and tuberin modulate gene
J.M.), AIRC (to A.M.) and the Ministry of Education and Science, transcription via b-catenin. J. Neurooncol. 79, 229-234.
Republic of Serbia (173051, 143028 and a grant for training of young Kagalwala, M. N., Singh, S. K. and Majumder, S. (2008). Stemness is only a state of
the cell. Cold Spring Harb. Symp. Quant. Biol. 73, 227-234.
postdoctoral researchers, to A.K.). Kaliwara, K., Kamamoto, M., Ogata, S. and Tanhara, M. (2008). A synthetic peptide
corresponding to residues 301-320 of human Wnt-1 promotes PC12 cell adhesion and
Supplementary material available online at hippocampal neuron stem cell differentiation. Peptides 29, 1479-1485.
Klesse, L. J. and Bowers, D. C. (2010). Childhood medulloblastoma: current status of
http://jcs.biologists.org/lookup/suppl/doi:10.1242/jcs.087551/-/DC1 biology and treatment. CNS Drugs 24, 285-301.
Kreisler, A., Strissel, P. L., Strick, R., Neumann, S. B., Schumacher, U. and Becker,
References C. M. (2010). Regulation of the NRSF/REST gene by methylation and CREB affects
Abe, K. and Takeichi, M. (2007). NMDA-receptor activation induces calpain-mediated the cellular phenotype of small-cell lung cancer. Oncogene 29, 5828-5838.
b-catenin cleavages for triggering gene expression. Neuron 53, 387-397. Kwiatkowski, D. J. and Manning, B. D. (2005). Tuberous sclerosis: a GAP at the
Andrews, P. W. (1984). Retinoic acid induces neuronal differentiation of a cloned crossroads of multiple signaling pathways. Hum. Mol. Genet. 14 Spec No. 2, R251-
human embryonal carcinoma cell line in vitro. Dev. Biol. 103, 285-293. R258.
Ballas, N. and Mandel, G. (2005). The many faces of REST oversee epigenetic Laplante, M. and Sabatini, D. M. (2009). mTOR signaling at a glance. J. Cell Sci. 122,
programming of neuronal genes. Curr. Opin. Neurobiol. 15, 500-506. 3589-3594.
Barnes, E. A., Kenerson, H. L., Mak, B. C. and Yeung, R. S. (2010). The loss of Lawinger, P., Venugopal, R., Guo, Z. S., Immaneni, A., Sengupta, D., Lu, W.,
tuberin promotes cell invasion through the b-catenin pathway. Am. J. Respir. Cell Rastelli, L., Marin Dias Carneiro, A., Levin, V., Fuller, G. N. et al. (2000). The
neuronal repressor REST/NRSF is an essential regulator in medulloblastoma cells.
Mol. Biol. 43, 617-627.
Nat. Med. 6, 826-831.
Bruce, A. W., Donaldson, I. J., Wood, I. C., Yerbury, S. A., Sadowski, M. I.,
Lv, H., Pan, G., Zheng, G., Wu, X., Ren, H., Liu, Y. and Wen, J. (2010). Expression
Chapman, M., Göttgens, B., Buckley, N. J. (2004). Genome-wide analysis of
and functions of the repressor element 1 (RE-1)-silencing transcription factor (REST)
repressor element1 silencing transcription factor/neuron-restrictive silencing factor
in breast cancer. J. Cell. Biochem. 110, 968-974.
(REST/NRSF) target genes. Proc. Natl. Acad. Sci. USA 101, 10458-10463.
Journal of Cell Science
MacDonald, B. T., Tamai, K. and He, X. (2009). Wnt/b-catenin signaling:
Bruce, A. W., Krejci, A., Ooi, L., Deuchars, J., Wood, I. C., Dolezal, V. and Buckley, components, mechanisms, and diseases. Dev. Cell 17, 9-26.
N. J. (2006). The transcriptional repressor REST is a critical regulator of the Majumder, S. (2006). REST in good times and bad: roles in tumor suppressor and
neurosecretory phenotype. J. Neurochem. 98, 1828-1840. oncogenic activities. Cell Cycle 5, 1929-1935.
Cerpa, W., Toledo, E. M., Varela-Nallar, L. and Inestrosa, N. C. (2009). The role of Mak, B. C., Takemaru, K., Kenerson, H. L., Moon, R. T. and Yeung, R. S. (2003).
Wnt signaling in neuroprotection. Drug News Perspect. 22, 579-591. The tuberin-hamartin complex negatively regulates b-catenin signaling activity. J.
Chacòn, M. A., Varela-Nallar, L. and Inestrosa, N. C. (2008). Frizzled-1 is involved Biol. Chem. 278, 5947-5951.
in the neuroprotective effect of Wnt3a against Ab oligomers. J. Cell. Physiol. 217, Malosio, M. L., Benfante, R., Racchetti, G., Borgonovo, B., Rosa, P. and Meldolesi,
218-227. J. (1999). Neurosecretory cells without neurosecretion: evidence of an independently
Chen, B., Dodge, M. E., Tang, W., Lu, J., Ma, Z., Fan, C. W., Wei, S., Hao, W., regulated trait of the cell phenotype. J. Physiol. 520, 43-52.
Kilgore, J., Williams, N. S. et al. (2009). Small molecule-mediated disruption of Mulligan, P., Westbrook, T. F., Ottinger, M., Pavlova, N., Chang, B., Macia, E., Shi,
Wnt-dependent signaling in tissue regeneration and cancer. Nat. Chem. Biol. 5, 100- Y. J., Barretina, J., Liu, J., Howley, P. M. et al. (2008). CDYL bridges REST and
107. histone methyltransferases for gene repression and suppression of cellular
Chenn, A. and Walsh, C. A. (2002). Regulation of cerebral cortical size by control of transformation. Mol. Cell 32, 718-726.
cell cycle exit in neural precursors. Science 297, 365-369. Nie, D., Di Nardo, A., Han, J. M., Baharanyi, H., Kramvis, I., Huynh, T., Dabora, S.,
Chou, A. H., Zheng, S., Isukaichi, T. and Bruce, H. (2000). Wnt-1 inhibits nerve Codeluppi, P., Pandolfi, P. P., Pasquale, E. B. et al. (2010). Tsc2-Rheb signaling
growth factor-induced differentiation of PC12 cells by preventing the induction of regulates EphA-mediated axon guidance. Nat. Neurosci. 13, 163-172.
some, but not all, late response genes. Brain Res. Mol. Brain Res. 77, 232-245. Nikcevic, G., Savic, T., Kovacevic-Grujicic, N. and Stefanovic, M. (2008). Up-
Conaco, C., Otto, S., Han, J. J. and Mandel, G. (2006). Reciprocal actions of REST regulation of the SOX3 gene expression by retinoic acid: characterization of the novel
and a microRNA promote neuronal identity. Proc. Natl. Acad. Sci. USA 103, 2422- promoter-response element and the retinoid receptors involved. J. Neurochem. 107,
2427. 1206-1215.
Coulson, J. M. (2005). Transcriptional regulation: cancer, neurons and the REST. Curr. Nishihara, S., Tsuda, L. and Ogura, T. (2003). The canonical Wnt pathway directly
Biol. 15, R665-R668. regulates NRSF/REST expression in chick spinal cord. Biochem. Biophys. Res.
D’Alessandro, R., Klajn, A., Stucchi, L., Podini, P., Malosio, M. L. and Meldolesi, J. Commun. 311, 55-63.
(2008). Expression of the neurosecretory process in PC12 cells is governed by REST. Ooi, L. and Wood, I. C. (2007). Chromatin crosstalk in development and disease:
J. Neurochem. 105, 1369-1383. lessons from REST. Nat. Rev. Genet. 8, 544-554.
DasGupta, R., Kaykas, A., Moon, R. T. and Perrimon, N. (2005). Functional genomic Otto, S. J., McCorkle, S. R., Hover, J., Conaco, C., Han, J. J., Impey, S., Yochum,
analysis of the Wnt-wingless signaling pathway. Science 308, 826-833. G. S., Dunn, J. J., Goodman, R. H. and Mandel, G. (2007). A new binding motif
Dignam, J. D., Lebovitz, R. M. and Roeder, R. G. (1983). Accurate transcription for the transcriptional repressor REST uncovers large gene networks devoted to
neuronal functions. J. Neurosci. 27, 6729-6739.
initiation by RNA polymerase II in a soluble extract from isolated mammalian nuclei.
Nucleic Acids Res. 11, 1475-1489. Park, C. H., Chang, J. Y., Hahm, E. R., Park, S., Kim, H. K. and Yang, C. H. (2005).
Quercetin, a potent inhibitor against b-catenin/Tcf signaling in SW480 colon cancer
Fuller, G. N., Su, X., Price, R. E., Cohen, Z. R., Lang, F. F., Sawaya, R. and
cells. Biochem. Biophys. Res. Commun. 328, 227-234.
Majumder, S. (2005). Many human medulloblastoma tumors overexpress repressor
Pei, J. J. and Hugon, J. (2008). mTOR-dependent signalling in Alzheimer’s disease. J.
element-1 silencing transcription (REST)/neuron-restrictive silencer factor, which can
Cell. Mol. Med. 12, 2525-2532.
be functionally countered by REST-VP16. Mol. Cancer Ther. 4, 343-349.
Powers, J. F., Tischler, A. S. and Cherington, V. (1999). Discordant effects of
Goncharova, E., Goncharov, D., Noonan, D. and Krvmskava, V. P. (2004). TSC2 rapamycin on proliferation and p70S6 kinase phosphorylation in normal and
modulates actin cytoskeleton and focal adhesion through TSC1-binding domain and neoplastic rat chromaffin cells. Neurosci. Lett. 259, 137-140.
the Rac1 GTPase. J. Cell Biol. 167, 1171-1182. Qureshi, I. A. and Mehler, M. F. (2009). Regulation of non-coding RNA networks in
Greene, L. A. and Tischler, A. S. (1976). Establishment of a noradrenergic clonal line the nervous system-what’s the REST of the story? Neurosci. Lett. 466, 73-80.
of rat adrenal pheochromocytoma cells which respond to nerve growth factor. Proc. Racchetti, G., Lorusso, A., Schulte, C., Gavello, D., Carabelli, V., D’Alessandro, R.
Natl. Acad. Sci. USA 73, 2424-2428. and Meldolesi, J. (2010). Rapid neurite outgrowth in neurosecretory cells and
Grundschober, C., Malosio, M. L., Astolfi, L., Giordano, T., Nef, P. and Meldolesi, neurons is sustained by the exocytosis of a cytoplasmic organelle, the enlargeosome.
J. (2002). Neurosecretion competence. A comprehensive gene expression program J. Cell Sci. 123, 165-170.
identified in PC12 cells. J. Biol. Chem. 277, 36715-36724. Sarbassov, D. D., Ali, S. M., Kim, D. H., Guertin, D. A., Latek, R. R., Erdjument-
Guardavaccaro, D., Frescas, D., Dorrello, N. V., Peschiaroli, A., Multani, A. S., Bromage, H., Tempst, P. and Sabatini, D. M. (2004). Rictor, a novel binding
Cardozo, T., Lasorella, A., Iavarone, A., Chang, S., Hernando, E. et al. (2008). partner of mTOR, defines a rapamycin-insensitive and raptor-independent pathway
Control of chromosome stability by the beta-TrCP-REST-Mad2 axis. Nature 452, that regulates the cytoskeleton. Curr. Biol. 14, 1296-1302.
365-369. Schmidt, A. L., Brunetto, A. L., Schwartsmann, G., Roesler, R. and Abujamra, A.
Huang, J. and Manning, B. D. (2009). A complex interplay between Akt, TSC2 and the L. (2010). Recent therapeutic advances for treating medulloblastoma: focus on new
two mTOR complexes. Biochem. Soc. Trans. 37, 217-222. molecular targets. CNS Neurol. Disord. Drug Targets 9, 335-348.You can also read