Deployment Status of Fuel Cells in Road Transport: 2021 Update
←
→
Page content transcription
If your browser does not render page correctly, please read the page content below

Deployment Status of Fuel Cells in Road Transport:
                                          2021 Update
                                          Remzi Can Samsun, Laurent Antoni, Michael Rex, Detlef Stolten

Energie & Umwelt / Energy & Environment   Energie & Umwelt / Energy & Environment
Band / Volume 542                         Band / Volume 542
ISBN 978-3-95806-556-7                    ISBN 978-3-95806-556-7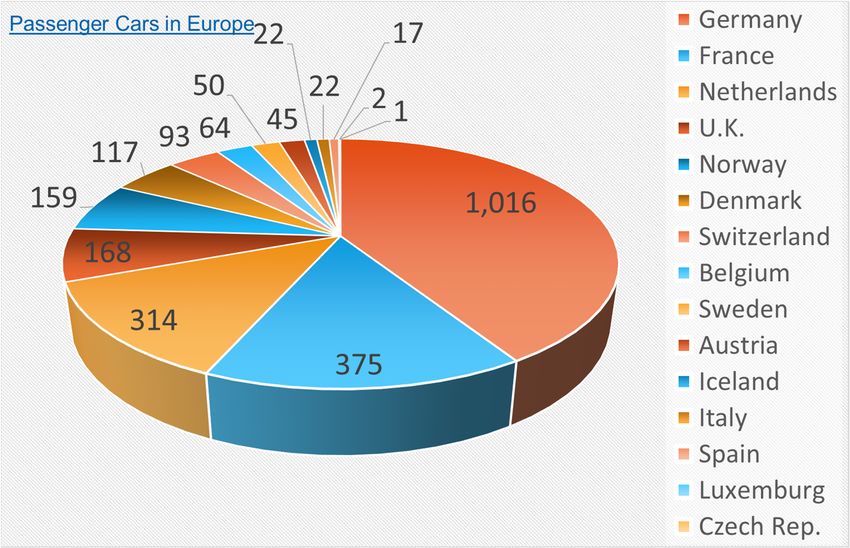
Schriften des Forschungszentrums Jülich
Reihe Energie & Umwelt / Energy & Environment   Band / Volume 542
Forschungszentrum Jülich GmbH
Institut für Energie- und Klimaforschung
Elektrochemische Verfahrenstechnik (IEK-14)

Deployment Status of Fuel Cells in
Road Transport: 2021 Update

Remzi Can Samsun, Laurent Antoni, Michael Rex,
Detlef Stolten

Schriften des Forschungszentrums Jülich
Reihe Energie & Umwelt / Energy & Environment         Band / Volume 542

ISSN 1866-1793 		                               ISBN 978-3-95806-556-7
Bibliografische Information der Deutschen Nationalbibliothek.
Die Deutsche Nationalbibliothek verzeichnet diese Publikation in der
Deutschen Nationalbibliografie; detaillierte Bibliografische Daten
sind im Internet über http://dnb.d-nb.de abrufbar.

Herausgeber                  Forschungszentrum Jülich GmbH
und Vertrieb:                Zentralbibliothek, Verlag
                             52425 Jülich
                             Tel.: +49 2461 61-5368
                             Fax: +49 2461 61-6103
                             zb-publikation@fz-juelich.de
                             www.fz-juelich.de/zb

Umschlaggestaltung:          Grafische Medien, Forschungszentrum Jülich GmbH

Titelbild (Autos):           Dr. Koch (EE Energy Engineers)

Druck:                       Grafische Medien, Forschungszentrum Jülich GmbH

Copyright:                   Forschungszentrum Jülich 2021

Schriften des Forschungszentrums Jülich
Reihe Energie & Umwelt / Energy & Environment, Band / Volume 542

ISSN 1866-1793
ISBN 978-3-95806-556-7

Vollständig frei verfügbar über das Publikationsportal des Forschungszentrums Jülich (JuSER)
unter www.fz-juelich.de/zb/openaccess.

             This is an Open Access publication distributed under the terms of the Creative Commons Attribution License 4.0,
             which permits unrestricted use, distribution, and reproduction in any medium, provided the original work is properly cited.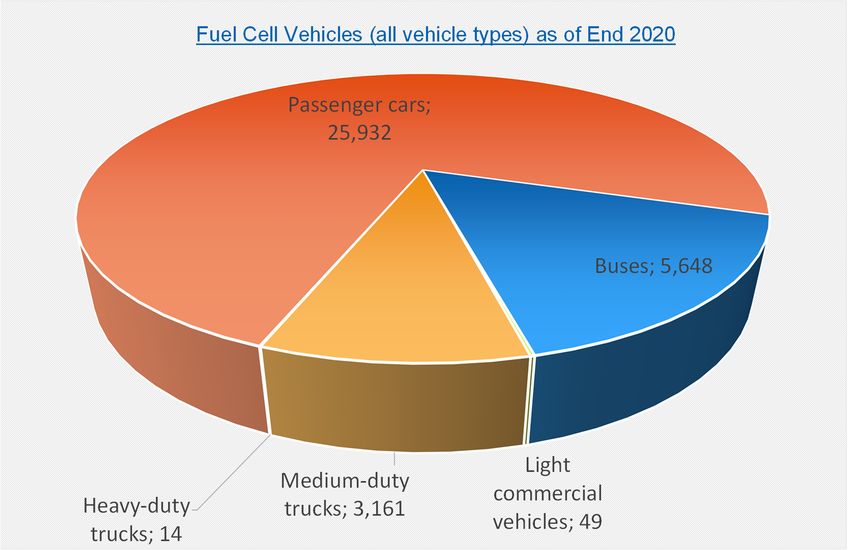
ABSTRACT

The number of fuel cell‐powered vehicles being used for road transport is rapidly increasing
around the world. In order to determine their present deployment status, the International
Energy Agency (IEA) Advanced Fuel Cells Technology Collaboration Programme (AFC TCP) per‐
forms an annual data collection across its member countries and beyond. This report captures
the current state of the country‐base deployment of fuel cell vehicles globally as of the end of
2020. Furthermore, an overview of the worldwide hydrogen refueling station infrastructure is
presented. Based on the most recent numbers and those from more recent years, the devel‐
opment trends are analyzed. Furthermore, information on selected passenger vehicles oper‐
ating with fuel cell technology is updated and accompanied by an analysis of different incen‐
tives and vehicle prices in various countries. Apart from the number of hydrogen refueling
stations, available information on the stations, such as pressure levels and links to their loca‐
tions, are presented. Finally, the report reviews the defined targets, projections and visions
regarding the future development perspectives of fuel cell vehicles and hydrogen refueling
stations.

Based on the results of the data collection, the AFC TCP estimates a total of 34,804 fuel cell
vehicles and 540 hydrogen refueling stations to be in operation as of the end of 2020. The
total number of fuel cell vehicles is made up of 25,932 passenger cars, which saw a 37% in‐
crease in 2020. Having undergone a strong increase in a single year, South Korea now has the
majority of passenger cars equipped with fuel cell technology on its roads. China still leads
global markets for buses and medium‐duty trucks. Moreover, the public refueling stations in
Japan, Germany, China, and the U.S. represent a significant share of 63% of the total number
of stations worldwide.

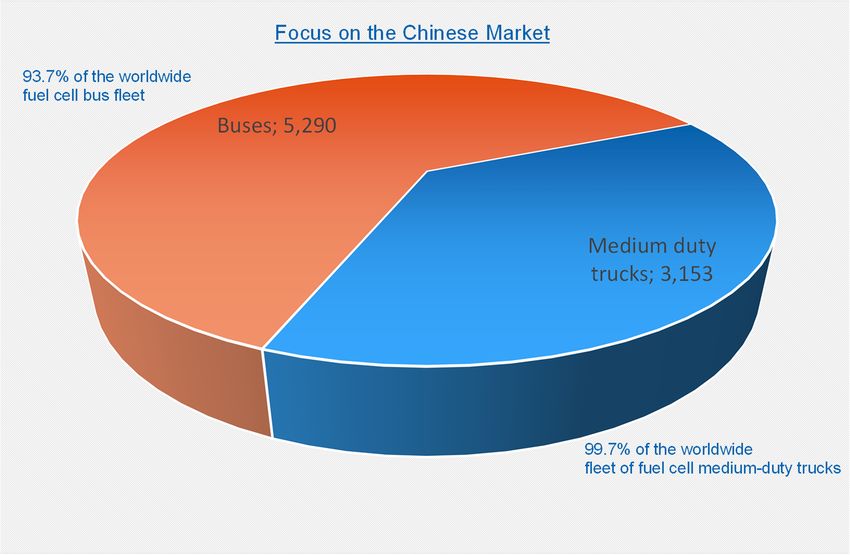
Table of Contents

TABLE OF CONTENTS

Table of Contents ........................................................................................................................ i
1.     Introduction ........................................................................................................................ 1
2.     Fuel Cell Vehicles ................................................................................................................ 3
     2.1.    AFC TCP survey results on the number of fuel cell vehicles........................................ 3
     2.2.    Information on selected vehicles .............................................................................. 10
3.     Hydrogen Refueling Stations ............................................................................................ 15
4.     Targets, Visions and Projections ....................................................................................... 21
     4.1.    Asia ............................................................................................................................ 21
     4.2.    Europe........................................................................................................................ 22
     4.3.    North America ........................................................................................................... 23
     4.4.    Global outlook ........................................................................................................... 24
5.     Conclusions ....................................................................................................................... 27
6.     Acknowledgements and Disclaimer .................................................................................. 29
7.     References ........................................................................................................................ 31
8.     Appendix ........................................................................................................................... 37

                                                                                                                                                i

Introduction

1. INTRODUCTION
Hydrogen produced using renewable sources has the potential to play a major role in achiev‐
ing international greenhouse gas neutrality targets. Hydrogen enables the long‐term storage
of volatile renewable energy and can serve as a vector for the synergistic coupling of various
sectors, such as power, transportation, heat, manufacturing, and chemicals. Thanks to the re‐
cently announced roadmaps and strategies on the regional, national and international levels,
hydrogen technologies are currently enjoying a central position in energy‐ and climate‐related
discourse.
Fuel cell technologies enable the highly efficient conversion of hydrogen into heat and power.
Amongst other applications, fuel cells in the transportation sector can extend the portfolio of
electric vehicles. Here, fuel cell vehicles present a decisive advantage in terms of refueling
times over battery‐electric options, as hydrogen can be refueled in comparable time periods
to conventional liquid fuels. Although several fuel cell vehicle models are already available for
purchase, their high prices, due to low production volumes, have kept their overall numbers
limited.
The goal of this report is to present the present status of fuel cell vehicle (FCV) deployment
and the worldwide hydrogen refueling station infrastructure as of early 2021. Based on data
collected from a detailed survey, the main status and development trends are analyzed. Fur‐
thermore, future development perspectives are presented based on publicly‐released
roadmaps, strategies and visions.
The structure of this document is as follows:
    ‐ The second chapter focuses on fuel cell vehicles. In the first section, the results of the
        AFC TCP survey on the number of fuel cell vehicles are presented and discussed, in‐
        cluding development trends over the last four years. This is followed by an overview
        of selected fuel cell vehicles for passenger car applications, which represents the high‐
        est market share. Finally, subsidy schemes and purchasing prices of fuel cell vehicles
        in selected countries are discussed.
    ‐ The third chapter addresses hydrogen refueling stations. After presenting the status
        of the infrastructure, the development trend of the refueling infrastructure between
        2017 and 2020 is analyzed. Furthermore, the results of the chapters on the vehicles
        and refueling stations are analyzed together. This chapter also includes further data
        on refueling stations, such as pressure levels, the number of public stations, infor‐
        mation on location maps, and additional information on hydrogen refueling stations.
    ‐ The fourth chapter compiles selected announcements from different sources to pre‐
        sent a complete picture of the defined targets of fuel cell vehicle deployment and hy‐
        drogen refueling station infrastructure development. This chapter also outlines the vi‐
        sions of leading sectoral institutions, such as the Hydrogen Council, Hydrogen Europe

                                                                                               1
Deployment Status of Fuel Cells in Road Transport: 2021 Update
and the California Fuel Cell Partnership. At the end, all numbers are placed in a timeline
to give the reader a complete overview of possible future developments.
‐ The final chapter concludes the report with a brief summary of the main findings.
2Fuel Cell Vehicles
2. FUEL CELL VEHICLES
This chapter presents the data collected in the latest AFC TCP survey regarding the registered
number of fuel cell vehicles in road transport. After discussing the continent‐, country‐ and
vehicle type‐based figures, the development trends are discussed. This is followed by an over‐
view of vehicle specifications and subsidy schemes.
2.1. AFC TCP SURVEY RESULTS ON THE NUMBER OF FUEL CELL VEHICLES
The latest AFC TCP survey was begun in early 2021 to capture the status of registered fuel cell
vehicles as of the reporting date of 31/12/2020. This survey represents the fourth in the series,
following those performed in 2018 [1], 2019 [2] and 2020 [3], which also captured the status
as of December 31 of those years.
The survey primarily consists of input from the AFC TCP member countries, supported by the
FCH 2 JU Programme Office for European data. At the same time, information published in
open sources or reports, such as the IPHE Country Updates, complemented the database. Ci‐
tations [4]–[28] list the sources of the data collection. In a few cases, the cited data refers to
other dates than the reporting date of 31/12/2020, which is mentioned in the corresponding
footnote.
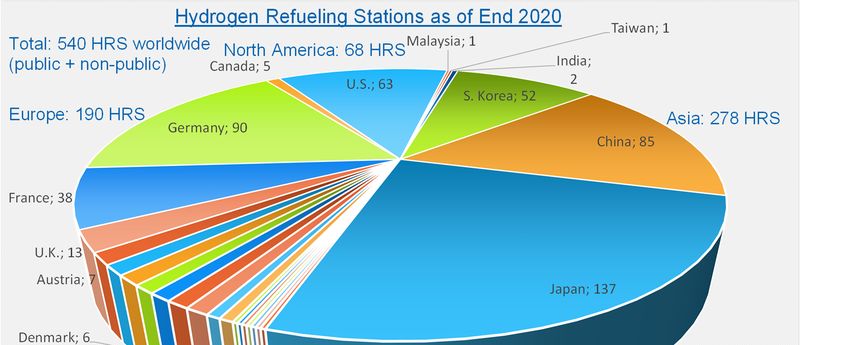
An analysis of the collected data indicates that 34,804 fuel cell vehicles (FCVs) of all types were
in operation worldwide as of the end of 2020. This total includes passenger cars,1 buses,2 light
commercial vehicles,3 and medium‐4 and heavy‐duty trucks.5 Figure 1 presents the number of
vehicles in different countries. It can be seen that most of the vehicles can be found in South
Korea, followed by the U.S., China and Japan. This year, South Korea took the lead for the first
time, replacing the U.S. In order to demonstrate the continental distribution, Figure 2 shows
that 65% of the vehicles are in Asia, followed by 27% in North America, and 8% in Europe. The
vehicle mix is dominated by passenger cars (74.5%), followed by buses (16.2%), and medium‐
duty trucks (9.1%), as is shown in Figure 3.
1
Fuel cell‐electric vehicles (FCEVs) in the category light‐duty vehicles (passenger cars and vans) such as the
Toyota Mirai, Hyundai Nexo, Honda Clarity fuel cell, Mercedes‐Benz GLC F‐CELL, etc., with the maximum mass
not exceeding 3.5 tonnes and there being no more than eight seats in addition to the driver’s seat.
2
Carriage of passengers with more than eight seats in addition to the driver’s seat.
3
Vehicles for the transport of goods and with a maximum mass not exceeding 3.5 tonnes, e.g., the Renault
Kangoo, Master, Mercedes‐Benz Sprinter, Volkswagen Crafter, Caddy, Ford Transit, etc.
4
Trucks with a maximum mass exceeding 3.5 tonnes but not exceeding 12 tonnes; trailers and semitrailers with
a maximum mass exceeding 3.5 tonnes, but not exceeding 10 tonnes.
5
Trucks with a maximum mass exceeding 12 tonnes; trailers and semitrailers with a maximum mass exceeding
10 tonnes.
3Deployment Status of Fuel Cells in Road Transport: 2021 Update
FIGURE 1. DISTRIBUTION OF FUEL CELL VEHICLES ON THE ROAD BY COUNTRY AS OF THE END OF 2020.
FIGURE 2. DISTRIBUTION OF ALL FUEL CELL VEHICLES BY CONTINENT AS OF THE END OF 2020.
4Fuel Cell Vehicles
FIGURE 3. SHARE OF DIFFERENT VEHICLE TYPES ACROSS THE TOTAL NUMBER OF FUEL CELL VEHICLES (FCVS) WORLDWIDE.
The continental distribution exhibits a similar trend for passenger cars (FCEVs: Fuel cell electric
vehicles) as well (see Figure 4). Again, most passenger cars are in Asia (55%), followed by North
America (36%) and Europe (9%). In comparison to the previous year [3], the Asian share in‐
creased by nine percentage points, whereas the shares of North America and Europe both
dropped by seven and two percentage points, respectively.
As is depicted in Figure 5, the North American market is primarily composed of fuel cell vehi‐
cles in the U.S., with a share of 98.7% comprising 9,188 cars. Meanwhile, 128 vehicles were in
operation in Canada. The increase in the U.S. total was limited by 15% this year, in comparison
to 37% in the previous one. More than 99% of the fuel cell vehicle fleet in the U.S. is composed
of passenger cars.
Similarly, Figure 6 provides insight into the distribution of passenger cars in Asia. The main
players in this category are South Korea and Japan, with no contribution from China, despite
being the third highest FCV penetration country, accounting for 24% of the total number
worldwide. Comparing the results with the previous year's survey [3], it can be seen that the
number of passenger cars in South Korea almost doubled in a single year, with a very strong
increase of 98%. With its 10,041 passenger cars, South Korea also leads this category with a
share of 38.7% of the worldwide fleet, followed by the U.S. (35.4%) and Japan (15.8%). To‐
gether, these three countries contribute almost 90% of the global FCEV passenger car fleet.
In Europe, the fleet is dominated by passenger cars in Germany and France, as is shown in
Figure 7, with 56.4% of European FCEVs spanning these two countries. The Netherlands, U.K.,
Norway, and Denmark follow these.
5Deployment Status of Fuel Cells in Road Transport: 2021 Update
FIGURE 4. DISTRIBUTION OF FCEV PASSENGER CARS ACROSS DIFFERENT CONTINENTS.
FIGURE 5. DISTRIBUTION OF PASSENGER CARS ACROSS COUNTRIES IN NORTH AMERICA.
6Fuel Cell Vehicles
FIGURE 6. DISTRIBUTION OF PASSENGER CARS ACROSS COUNTRIES IN ASIA.
FIGURE 7. DISTRIBUTION OF PASSENGER CARS ACROSS COUNTRIES IN EUROPE.
7Deployment Status of Fuel Cells in Road Transport: 2021 Update
The next analysis will focus on the 5,648 fuel cell buses with the help of Figure 8 and present
the distribution of fuel cell buses across the continents. At present, 97% of the buses are op‐
erated in Asia, leaving little space for Europe and North America. Within Asia, 5,290 of the
5,452 total buses are operated in China. A similar analysis can also be made for medium‐duty
trucks, with 3,153 of the 3,161 medium‐duty trucks in Asia being in China. Together, these two
categories make up the Chinese FCV market. As is clearly presented in Figure 9, 93.7% of the
fuel cell buses and 99.7% of the medium‐duty fuel cell trucks worldwide are in China. With
these two segments, China contributes to the global FCV fleet by accounting for every fourth
vehicle with a completely different vehicle type profile than the rest of the world. It has also
been reported that 50 heavy‐duty trucks were produced in China, but had not been registered
by the end of 2020 [29].
FIGURE 8. DISTRIBUTION OF FUEL CELL BUSES (FCB) ACROSS CONTINENTS.
The data collection includes two further vehicle categories, namely light commercial and
heavy‐duty vehicles, which have not been analyzed up until this point. The light commercial
vehicle category was introduced in the survey for the first time. In previous years, this category
was included in passenger cars. The survey results indicate only 49 vehicles in this category
around the world. It must be noted that in the case of some of the countries, e.g., France,
light‐duty vehicles are already included among the total passenger cars. Another challenge
was to monitor the number of heavy‐duty trucks, as many vehicles are prototypes that are
8Fuel Cell Vehicles
being operated for demonstration projects, such as in the U.S. Therefore, the 14 vehicles re‐
ported in this category, specifically the 12 in Switzerland and two in the Netherlands, will be
interpreted with uncertainty as to the possibility of there being a higher number than that
reported here.
FIGURE 9: FOCUS ON THE CHINESE MARKET
Fundamentally, Figure 10 displays the development trend for the number of FCEVs worldwide
from 2017–2020. In 2017, only passenger cars were considered, as the total numbers of other
vehicle types were very low [1]. The 2018 survey introduced a further category, estimating the
total number of all fuel cell vehicles (FCV), taking the market development in China concerning
commercial vehicles into account [2]. The number of registered passenger cars already
showed an increase of 56% at the end of 2018. By late 2019, this trend had continued with a
stronger increase of 69% for passenger cars in one year [3]. The newest survey results indicate
a weaker increase of 37% for the year 2020. In 2019, the number of newly‐registered passen‐
ger cars was 7,700; in 2020, it totaled 7,000. Thus, the absolute increase in the number of
passenger cars was comparable.
The number of all FCVs showed a similar increasing trend of 38% in 2020, which is much slower
than the increase in 2019 of 95%. In 2019, the strong increase was driven by China. The Hy‐
drogen and Fuel Cell Industry Monthly Report from January 2021 [29] points out that sales in
China slowed down considerably due to changes in the national subsidy policy and the overall
market trend starting to improve again in September after five Departments announced the
new policy.
9Deployment Status of Fuel Cells in Road Transport: 2021 Update
The most important growth factor for 2020 was the increase in the number of passenger cars
in South Korea. More than half of the overall increase in the number of fuel cell vehicles
around the world was accounted for by the increase in this figure.
34,804
40,000
Number of fuel cell vehicles
25,932
25,212
30,000
18,913
20,000
12,952
11,212
7,186
10,000
0
2017 2018 2019 2020
passenger cars all vehicles
FIGURE 10. DEVELOPMENT OF THE NUMBERS OF FUEL CELL VEHICLES DEPLOYED WORLDWIDE.
2.2. INFORMATION ON SELECTED VEHICLES
Technical data on selected (FCEV) passenger car models that are currently available for pur‐
chase or lease in different countries is listed in Table 1, based on the information provided by
the car manufacturers. In comparison to last year's report, the table includes the specifications
of the Toyota Mirai in its second generation, the first of which went on sale in late 2020. The
specifications of the Hyundai Nexo, Honda Clarity Fuel Cell and Mercedes‐Benz GLC F‐Cell are
the same as those in last year's report [3].
10Fuel Cell Vehicles
TABLE 1. TECHNICAL SPECIFICATIONS OF THE TOYOTA MIRAI [30], [31], HYUNDAI NEXO [32], [33], HONDA CLARITY FUEL CELL
[34], [35], AND MERCEDES‐BENZ GLC F‐CELL [36], [37].
Toyota Hyundai Honda Mercedes‐Benz
FCEV
Mirai Nexo Clarity Fuel Cell GLC F‐Cell
330 cells
102 g cell weight
128 kW max. output 95 kW
103 kW
5.4 kW/l volume power 440 cells
Fuel cell 358 cells
density 3.1 kW/l power density
stack 33 l volume
5.4 kW/kg mass power @ 0.6 V
52 kg weight
density 60% system efficiency
29 l volume / 32 kg
weight
Lithium‐ion Lithium‐ion polymer
310.8 V power output 240 V voltage
4 Ah / 1.24 kWh capac‐ 40 kW power output Lithium‐ion Lithium‐ion
Battery
ity 1.56 kWh output 346 V voltage 13.5 kWh capacity
44.6 kg battery pack 95.3% charge / dis‐
weight charge efficiency
Permanent mag‐ Permanent magnet AC permanent magnet
Electric mo‐ Asynchronous machine
net, synchronous motor synchronous motor
tor / genera‐ 155 kW power output
134 kW max. power 120 kW power output 130 kW power output
tor 365 Nm max. torque
300 Nm max. torque 395 Nm. max. torque 300 Nm max. torque
179 km/h max. speed
9.2 s 0–100 km/h accel‐
165 km/h maximum
175 km/h max. speed eration 160 km/h maximum
speed
Performance 9.2 s 0–100km/h accel‐ 7.4 s 80–120 km/h ac‐ speed
9.0 s 0‐100 km/h accel‐
eration celeration
eration
‐30 °C cold start tem‐
perature
Fuel con‐ 1 kg / 100 km hydrogen
0.89 kg/100 km com‐
sumption 666 km WLTP 478 km NEDC hybrid
bined (WLTP) 650 km NEDC
/ Driving 756 km NEDC mode
650 km
range (50 km battery only)
700 bar nominal work‐
ing pressure
875 bar max. filling 700 bar
6.33 kg hydrogen 700 bar
pressure 5.46 kg hydrogen
Tank system 156.6 l overall capacity, 4.4 kg hydrogen
5.6 kg fuel tank capac‐ 141 l overall capacity, 2
3 tanks, each 52.2 l
ity tanks, 24 l and 117 l
24 kg tank weight
Three tanks
1,920–1,950 kg curb 2,340 kg gross vehicle
weight weight
Weight 1,875 kg curb weight
2,415 kg gross vehicle 1,814–1,873 kg curb
weight weight
4,975 mm overall 4,670 mm overall
4,915 mm overall 4,671 mm overall
length length
length length
1,885 mm overall 1,860 mm overall
1,875 mm overall 2,096 mm overall
width width
Exterior width width
1,480 mm overall 1,630 mm overall
1,480 mm overall 1,653 mm overall
height height
height height
2,920 mm wheelbase 2,790 mm wheelbase
2,750 mm wheelbase 2,873 mm wheelbase
0.29 drag coefficient 0.329 drag coefficient
11Deployment Status of Fuel Cells in Road Transport: 2021 Update
2.3. SUBSIDY SCHEMES AND PURCHASE PRICES IN SELECTED COUNTRIES
This section highlights different incentives for purchasing or leasing fuel cell vehicles in se‐
lected countries and lists the vehicle prices.
There are different subsidy schemes for fuel cell vehicles in the U.S. The Internal Revenue
Service (IRS) provides a tax credit of up to USD 8,000 at the federal level for the purchase of
qualified light‐duty fuel cell vehicles, the subsidy amount being based on the vehicle's fuel
economy. Based on vehicle weight, tax credits are also available for medium‐ and heavy‐duty
fuel cell vehicles [38]. In addition, different states offer subsidies. The Clean Vehicle Rebate
Project, administered by the CSE for the California Air Resources Board, offers electric vehicle
rebates for the purchase or lease of new, eligible zero‐emissions and plug‐in hybrid light‐duty
vehicles in California. The Honda Clarity Fuel Cell, Hyundai Nexo, and Toyota Mirai FCEVs are
eligible for USD 4,500 rebates [39]. Similarly, the Connecticut Hydrogen and Electric Automo‐
bile Purchase Rebate Program (CHEAPR) offers rebates against the incremental costs of the
purchase or lease of FCEVs, among others. For fuel cell vehicles, the manufacturer suggested
retail price may not exceed USD 60,000; the rebate amount totals USD 5,000 for fuel cell ve‐
hicles [40].
The subsidies for purchasing fuel cell vehicles in Japan vary from JPY 1,173,000 (Toyota Mirai
"new version") to JPY 2,100,000 (Honda Clarity Fuel Cell); in addition, some local governments
offer subsidies [41]. The purchasing price of a Mirai (new version) from Toyota varies between
JPY 7,100,000 and JPY 8,100,000 [42], whereas the Clarity Fuel Cell from Honda has a purchas‐
ing price of JPY 7,800,000 [43].
FCEVs receive a subsidy of up to EUR 6,000 in Spain [44], with the total price of one there
being around EUR 72,000 [21].
The Eco bonus in Italy applies from zero to 20 g/km of CO2 and ranges between EUR 10,000
and EUR 6,000, depending on whether the purchase is made with or without scrapping. Under
this scheme, the maximum price of new cars purchased must not exceed EUR 61,000 [45].
In France, the financial incentive for purchasing FCEVs was increased from EUR 6,000 to EUR
7,000 from 01/06/2020 [46].
In Austria, the Hyundai NEXO is only available for customers with a professional connection to
the hydrogen industry [47], whereas the Toyota Mirai is publicly available for EUR 59,900 [48].
The same subsidies apply for FCEVs as for BEVs: new Passenger cars for private individuals
receive a subsidy of EUR 3,000 from federal funding and EUR 2,000 EUR from the car importer.
For companies and organizations, the subsidy is EUR 2,000, with transporters of up to 2 tonnes
also receiving this support. The subsidy can be a maximum of 30% of the purchase price. The
maximum allowed purchase price corresponds to EUR 60,000 for private individuals and com‐
panies based on the gross list price. The requirement is the proof that the hydrogen used
originates from renewable sources only. In addition, tax benefits apply to FCEVs. There is an
exemption from the standardized consumption tax (NoVa), the engine‐related insurance tax,
12Fuel Cell Vehicles
as well as the vehicle tax. Moreover, an input tax deduction is applied if the purchase price is
lower than EUR 40,000. In addition, regional subsidies have been published for Austria [49]–
[53].
In Denmark, hydrogen cars are exempt from initial registration taxes [54]. The Toyota Mirai is
available for prices between DKK 499,990–589,990 in this country [55].
In Sweden, the bonus malus system for vehicles that emit zero CO2 has been in place since
01/07/2018 and only applies to new vehicles that are taxed and insured, and has consequently
been put into effect on or after that date according to the Swedish vehicle register. FCEVs are
subject to SEK 60,000 when sold new [56]. The purchasing price of Hyundai Nexo is SEK
860,000–880,000, whereas the price of Toyota Mirai is around SEK 700,000 [57].
The drivers of FCVs in Switzerland are exempt from performance‐related heavy vehicle
charges and petroleum taxes. The performance‐related heavy vehicle charge totals CHF
0.0228 tkm for Euro 6 vehicles. In the case of heavy‐duty trucks in the 40 t weight class driving
100,000 km per year, the saving corresponds to CHF 91,200, with the petroleum tax being CHF
0.759 per liter of fuel. Assuming the same mileage as above and a fuel consumption of
32 l/km, an additional annual saving of CHF 24,300 can be realized under this exemption [58].
The prices of available fuel cell vehicles in Canada are CAD 73,000 for the Hyundai Nexo and
CAD 73,800 for the Toyota Mirai, with a federal incentive of CAD 5,000 applying to FCEVs. In
addition, various incentives are available in different regions. In Quebec, the incentives vary
between CAD 3,000 and CAD 8,000 depending on the vehicle manufacturer's suggested retail
price (MSRP). In British Columbia, the incentives amount to CAD 3,000 to a maximum vehicle
MSRP, whereas CAD 5,000 obtains in Yukon [59]–[62].
The basic version of the Toyota Mirai, currently in its second generation, has a starting price
of EUR 63,900 in Germany [63]. The recommended retail price of the Hyundai Nexo is EUR
77,290 [64]. Another available FCEV model in Germany is the Mercedes GLC F‐CELL, which is
only leased based on a full‐service model [65]. Currently, the Toyota Mirai is eligible for the
environmental bonus by the BAFA (as of 19/04/2021) [66]. The interim report from
01/04/2021 shows that 189 applications for FCEVs were received up until that date [67], all of
which were for the Hyundai models, with 170 for the current model NEXO and 19 for its pre‐
decessor ix35 Fuel Cell. By comparison, 313,879 applications were filed for pure electric vehi‐
cles and 234,208 for plug‐in hybrids. Both Hyundai models were listed as eligible for the envi‐
ronmental bonus in the older versions of the BAFA, unlike the first‐generation Mirai. Mean‐
while, the second‐generation Mirai is the only FCEV listed by the BAFA. In the present version,
vehicles that are registered between 03/06/2020 and 31/12/2021 for the first time receive
the innovation bonus (Innovationsprämie), in which the previous environmental bonus is dou‐
bled and the car manufacturer's part remains constant. Up to a BAFA list price of EUR 40,000,
pure electric vehicles and FCEVs receive EUR 6,000 incentives from the federal government
for purchasing, EUR 1,500 for leasing for 6–11 months, EUR 3,000 for leasing for 12–23
months, and EUR 6,000 for leasing for more than 23 months. On top of this, EUR 3,000 is
13Deployment Status of Fuel Cells in Road Transport: 2021 Update provided by the car manufacturer, resulting in EUR 9,000 total incentive for purchasing a new vehicle. For a list price of between EUR 40,000 and EUR 65,000, which is relevant for the cur‐ rently eligible FCEVs, the federal incentives drop to EUR 5,000 for purchasing and leasing for more than 23 months, EUR 1,250 for leasing for 6–11 months, and EUR 2,500 for leasing for 12–23 months. In this case, the car manufacturer's component corresponds to EUR 2,500. The latter window of incentive levels also applies to second‐hand vehicles independent of the BAFA list price, which is the lowest net list price of the base model in Germany at market launch [68]. As noted in the previous section, incentives for purchasing FCEVs in China provided by the central government were terminated in April of 2020. The government intends to commence a new program in selected cities [69]. 14
Hydrogen Refueling Stations

3. HYDROGEN REFUELING STATIONS
This chapter assesses the present worldwide hydrogen refueling station (HRS) infrastructure.
At the end of 2020, 540 HRSs were in operation, including both public and private installations.
A continent‐based analysis reveals that most HRSs are concentrated to Asia, with a total of
278, followed by Europe, with 190, and 68 in North America. The country with the highest
number of stations is Japan (137). Germany (90) and China (85) have the second and third
place, respectively, in this ranking. The U.S. now occupies the fourth position instead of the
third, having more or less undergone a stagnation, with 63 stations, ahead of South Korea (52)
and France (38). The most remarkable changes were registered for China and Japan, each of
which opened 24 new stations in 2020, followed by South Korea with 18, France with 13, and
Germany with 9 new stations. The information sources are given in [70]–[85]. All data is cur‐
rent as of 31/12/2020 unless otherwise stated.

    FIGURE 11. COUNTRY‐BASED OVERVIEW OF HYDROGEN REFUELING STATIONS (HRS) WORLDWIDE AS OF THE END OF 2020.

The available data does not enable an exact estimation of the share of public and private sta‐
tions to be made. However, especially for countries with higher numbers of stations, the num‐
ber of public stations is publicly available. The three countries with the highest numbers of
publicly‐available hydrogen refueling stations changed slightly in 2020. Japan (137) and Ger‐
many (90) are still in the first two places, whereas China is now in the third (66), followed by

                                                                                                              15
Deployment Status of Fuel Cells in Road Transport: 2021 Update
the U.S. (46). This ranking is therefore the same as the total number of stations. In Germany
and Japan, all stations are public. With these numbers, the publicly available HRSs in these
four countries (242) represent 63% of the total stations (public and private) worldwide.
The total number of HRS around the world saw an increase of 15% in 2020. The increase was
weaker than the 23% observed in 2019, but on the same level as that in 2018. The growth in
the number of hydrogen refueling stations around the world over the 2017–2020 period is
presented in Figure 12.
600
540
Number of hydrogen refueling
500 468
400 381
stations
330
300
200
100
0
2017 2018 2019 2020
FIGURE 12. WORLDWIDE NUMERICAL DEVELOPMENT OF HRSS FOR 2017–2020.
As in the last year, based on the number of stations and vehicles, the total number of FCEVs
per hydrogen refueling station could be calculated for the six countries with the highest num‐
bers of HRSs. This theoretical analysis allocates the registered vehicles to a station in each
country without considering the geographical location of the stations or the registry areas of
the vehicles. As Figure 13 shows, the number of vehicles per station is currently nearing 200
in South Korea. The same ratio approaches 150 in the U.S. In the case of China, the number of
vehicles per HRS is around 100. The Japanese ratio takes the fourth position, with about 30
vehicles per station. Germany and France can be put in a joint fifth place, with around 10
vehicles for each station. This diagram shows a strong discrepancy, with a factor of 20 between
both extreme categories in South Korea on the one side and Germany and France on the other.
16Hydrogen Refueling Stations
250
200 194.1
Vehicles per HRS
146.9
150
99.3
100
50
30.7
12.0 10.4
0
Japan Germany China U.S. S. Korea France
FIGURE 13. ANALYSIS OF THE NUMBER OF FCVS PER HRS IN THE SIX COUNTRIES WITH THE HIGHEST NUMBER OF HRSS AS OF THE END
OF 2020. (JAPAN: HIGHEST NUMBER OF HRSS; FRANCE: LOWEST NUMBER AMONG THE TOP SIX COUNTRIES).
As noted above, it was not possible to distinguish between public and private (non‐public)
stations for each of the 540 in operation. For the sake of completeness, the partly available
numbers are listed in Table 2, together with specifications on the pressure levels and links for
station maps.
Most of the stations for passenger cars are operated at 700 bar. Stations for buses typically
utilize 350 bar. The HRS Availability Map of the FCH JU / European Commission indicated 145
public HRS stations in Europe, from which 127 stations provide 700 bar for passenger cars, 46
provide 350, also for passenger cars, and 16 provide 350 bar for buses. It is clear that many
stations offer more than one possibility [86].
Priem analyzed hydrogen delivery among 45 stations in Europe funded by the FCH 2 JU [87].
Nine of the 350‐bar and three of the 700‐bar stations operate with delivered hydrogen; six of
the 350‐bar and ten of 700‐bar stations with on‐site‐produced hydrogen; six of the dual sta‐
tions (350 and 700 bar) with delivered hydrogen, five with on‐site‐produced hydrogen; five
stations at other pressure levels utilize trucked‐in hydrogen and one further station at another
pressure level produces hydrogen on‐site.
17Deployment Status of Fuel Cells in Road Transport: 2021 Update
TABLE 2. NUMBER OF HRSS, PUBLIC STATIONS, PRESSURE LEVELS AND LINKS FOR STATION LOCATIONS [70]–[85].
Country Number Public Notes HRS locations
of HRSs sta‐
tions
Japan 137 137 All: 700 bar http://fccj.jp/hystation/in‐
dex.html#hystop
Germany 90 90 Mainly 700 bar, 7 dual https://h2.live/en
(350/700)
China 85 66 ‐ See attached map in the appendix
U.S. 63 46 350 bar and 700 bar https://afdc.energy.gov/fuels/hydro‐
gen_locations.html
South Korea 52 NA ‐ http://eng.h2korea.or.kr/
France 38 28 350 and 700 bar for vehicles, https://www.vighy‐afhypac.org/
200 bar for bikes
U.K. 13 10 2 x 350, 11 x dual
Austria 7 5 Both 350/700 bar available in https://h2.live/en
the country
Switzerland 6 NA ‐
Denmark 6 6 ‐ https://brintbiler.dk/tankstationer/
Italy 5 1 Both 350/700 bar available in
the country
Spain 5 2 4 x 350, 1 x 700 bar
5 5 Mainly 700 bar, 2 dual http://www.vatgas.se/tanka/sta‐
(350/700); Green hydrogen tioner/
supply in all stations
Sweden
Canada 5 3 700 bar for light‐duty
Netherlands 5 3 3x dual, 1x unknown, 1 x 350
Belgium 3 2 1x dual, 1x 350, 1 x 700 bar
Norway 3 NA 2 x 700, 1 x 350
India 2 NA 350 bar
Croatia 1 1 30 bar, for bicycles
Australia 1 1 350 bar
Costa Rica 1 NA 350 bar
Czech Re‐ 1 NA 350 bar, car and bus
public
Malaysia 1 NA dual
Latvia 1 1 dual
Saudi Arabia 1 NA 700 bar
Taiwan 1 NA ‐
United Arab 1 NA 700 bar
Emirates
Iceland 1 NA 750 bar
Worldwide 540 NA ‐
18Hydrogen Refueling Stations
On its webpage, the Fuel Cells and Hydrogen Joint Undertaking present the state‐of‐the‐art
and future targets, termed the key performance indicators (KPIs), for hydrogen refueling sta‐
tions as derived from the Multi‐Annual Work Plan. Table 3 shows the selected KPIs. The inter‐
national state‐of‐art is based on the year 2017. A full list of the indicators used can be found
in the original source [88].
TABLE 3. SELECTED PARAMETERS FOR STATE‐OF‐THE‐ART AND FUTURE TARGETS FOR HYDROGEN REFUELING STATIONS FOR FCH JU
PROJECTS [88].
State‐of‐the‐art
Parameter Unit FCH 2 JU target 2024 FCH 2 JU target 2030
2017
Lifetime Years 10 15 20
Durability Years ‐ 10 15
Energy consumption kWh / kg 10 4 3
Availability % 95 98 99
Mean time between
Days 20 72 168
failures
EUR 1,000 /
CAPEX 7 3–1.6 2.4–1.3
(kg/day)
Cost of renewable hy‐
EUR / kg 12 9 6
drogen
With respect to the Japanese HRSs, the storage pressure corresponds to 820 bar and the dis‐
pensing pressure to 700 bar. Moreover, the cost figures from Japan are publicly available. As
of March 2020, the CAPEX was JPY 330 million and the OPEX was JPY 31 million [89].
In Austria, the 350‐bar hydrogen refueling station of HyCentA has a storage capacity of
17,600 l of liquid hydrogen and dispensers for liquid and gaseous hydrogen [90]. The 700‐bar
station from OMV features a 200 kg storage capacity [91].
In Germany, the price of hydrogen at all public stations corresponds to EUR 9.50 / kg, including
value‐added tax (VAT) [79].
Excluding the land cost, the investment and construction cost of domestic hydrogen refueling
stations in China is reported to be CNY 15 million, among which the compressor, the storage
tank and refueling system are the three main components, with the compressor accounting
for the highest proportion of up to 32% [76].
19Targets, Visions and Projections
4. TARGETS, VISIONS AND PROJECTIONS
This chapter presents selected announcements relating to the targets for infrastructure de‐
velopment for HRSs or the deployment of fuel cell vehicles for Asia, Europe and North Amer‐
ica. Ultimately, the visions of Hydrogen Council are presented in order to give a perspective
for the global numbers.
In some countries or regions, the targets are defined as visions or projections or as the com‐
ponents of roadmaps. In many countries, the targets for FCVs are included in the overall tar‐
gets for zero‐emissions vehicles. In such cases, where it is not possible to elicit precise figures
for FCVs, the targets are not mentioned here; for a complete overview of the targets support‐
ing electric vehicle development, refer to the IEA Global EV Outlook 2021 [92].
4.1. ASIA
South Korea's Roadmap for the Hydrogen Economy, published in January 2019, outlines one
of the most important national development plans for fuel cells and hydrogen. In this plan,
the government defines a key role for the hydrogen economy to become the driving force of
innovation growth in 2040. It is expected that the hydrogen economy will generate KRW 43
trillion in added value per year and 420,000 new jobs by then. The targets are summarized
below, for the stated milestones [93], [94]:
- 2022: 81,000 FCVs (79,000 passenger cars and 2,000 buses) and 310 HRSs.
- 2040: 6.2 million FCVs (5.9 million passenger cars, 120,000 taxis, 60,000 buses, and
120,000 trucks) and 1,200 HRSs. The annual hydrogen supply reaches 5,260,000
tonnes.
It must be noted that the above‐mentioned numbers refer to production numbers of vehicles
used in the country and those exported. Excluding the exported units, 2.9 million passenger
cars, 80,000 taxis, 40,000 buses, and 30,000 trucks are planned to be operated in South Korea
by 2040.
The Basic Hydrogen Strategy of Japan lays out a vision for common targets that the public and
private sectors should pursue together with an eye to achieving them by 2050. Among other
important points, the strategy suggests that Japan should lead the world in realizing a hydro‐
gen‐based society. The key point of the national strategy includes concrete aims for 2025 and
2030 [95]:
- 2025: 200,000 passenger cars and 320 HRSs, with hydrogen stations made independ‐
ent by the second half of the 2020s.
- 2030: 800,000 passenger cars, 1,200 buses and 900 stations.
21Deployment Status of Fuel Cells in Road Transport: 2021 Update
Similar to South Korea and Japan, further ambitious plans have been developed in China. Ac‐
cording to the revised version of the Hydrogen and Fuel Cell Vehicle Roadmap, the following
targets are defined for China [96]:
- 2025: 100,000 fuel cell vehicles and 1,000 HRSs.
- 2035: The number of vehicles totals 1,000,000 units; the number of HRSs reaches
5,000 stations.
4.2. EUROPE
The European Union and several European countries have set out targets for hydrogen and
fuel cells. The European Green Deal includes an action plan to boost the efficiency of resource
use by moving to a clean, circular economy and restoring biodiversity, as well as cutting pol‐
lution with the aim of emitting net emissions of greenhouse gases by 2050 [97]. The EU Hy‐
drogen Strategy defines a three‐phase approach to develop renewable hydrogen, which can
support the decarbonization of several sectors across Europe within an integrated energy sys‐
tem [98].
In the following, some of the selected targets are listed:
- At least 747 hydrogen refueling stations by 2025 in Europe [99].
- In the largest deployment in the continent to date, both Joint Initiative for Hydrogen
Vehicles in Europe (JIVE) projects will see 291 FC buses on the roads by 2023 [100].
- The French National Plan aims for 5,000 passenger cars and commercial light‐duty ve‐
hicles (LDVs), 200 buses and trucks, and 100 HRSs in 2023. The 2028 targets include
20,000–50,000 passenger cars and commercial LDVs, 800–2,000 buses and trucks, and
400–1,000 HRSs [101].
- Croatia aims for 25 HRSs in 2030, 50 in 2040, and 75 in 2050 [102].
- The Climate Agreement of the Netherlands aims to realize 15,000 passenger cars and
3,000 heavy‐duty vehicles by 2025 and 300,000 passenger cars by 2030 [103].
- Germany set the target of increasing its HRS infrastructure to 400 stations by 2025
[104]. 14 passenger trains with fuel cell technology will also be in operation from 2021
and 27 additional units are planned by 2023 [105]. In its Hydrogen Roadmap, the Fed‐
eral State North Rhine‐Westphalia (NRW) aims to deploy more than 400 fuel cell
trucks, at least 20 truck filling stations, 60 car filling stations, and 500 hydrogen buses
for public transport by 2025 [106]. NRW's targets for 2030 include 11,000 fuel cell
trucks over 20 tonnes, 200 filling stations for trucks and cars, 1,000 fuel cell waste bins,
and 3,800 fuel cell buses for public transport only in NRW.
- In the Hydrogen Roadmap of Spain, the targets defined for the year 2030 include
5,000–7,000 light‐ and heavy‐duty vehicles for goods transportation, 150–200 buses,
two complete train lines operating with fuel cell trains, and 100–150 HRSs for public
22Targets, Visions and Projections
use [107].
- In Switzerland, 1,600 heavy‐duty trucks are planned for operation in 2025 [108].
- In Italy, 290,000 passenger cars and 3,600 buses are the targets for 2030 [109]. 346
HRSs for passenger cars and 96 for buses are also planned until then. In addition, Italy
aims for 200,000 heavy‐duty trucks in 2030 and an infrastructure of 40 HRSs for heavy‐
duty vehicles over the next six years [110], [111].
Finally, the Hydrogen Roadmap Europe prepared for the Fuel Cells and Hydrogen Joint
Undertaking, representing the views of the industry represented by Hydrogen Europe,
proposes the following milestones [98], [112]:
- By 2030: FCEVs could account for 1 in 22 passenger vehicles (with a total fleet of 3.7
million vehicles) and 1 in 12 light commercial vehicles (a total fleet of 500,000) sold,
45,000 trucks and buses, 570 trains, and with 3,700 HRSs in Europe.
- By 2040: 1 in 7 passenger vehicles and 1 in 5 light commercial vehicles (LCVs),
450,000 trucks and buses, 2,000 trains, and with 15,000 HRSs in Europe.
- By 2050, 45 million passenger cars, 6.5 million LCVs, 1.7 million trucks and 250,000
buses powered by hydrogen according to the ambitious scenario. In the business‐as‐
usual scenario with no consolidated efforts, only 1.4 million passenger cars, 700,000
LCVs, 60,000 buses, and 380,000 trucks would be on Europe's roads. It would thereby
not be possible to achieve the EU's climate goals and EU industry's position in the
global economy under this scenario.
4.3. NORTH AMERICA
Canada has defined the long‐term vision of operating more than five million FCEVs and a hy‐
drogen refueling network across Canada by 2050 as part of the Hydrogen Strategy for Canada,
published in December 2020. As short‐ and medium‐term targets, the Government of Canada
set targets for the shares of zero‐emission vehicles, which include battery‐electric vehicles,
FCEVs, and plug‐in hybrid‐electric vehicles [113].
The U.S. is targeting a nationwide 100% clean energy economy with net‐zero emissions by
2050 [114]. Further to this, California will invest USD 20 million per year until 100 public HRSs
are in operation [115]. By the end of 2025, California intends to have 200 stations in operation
[116]. In this state, it is planned that 100% of the in‐state sales of new passenger cars and
trucks by 2035, 100% of medium‐ and heavy‐duty vehicles by 2045, and 100% of off‐road ve‐
hicles and equipment will be, where feasible, zero‐emission [117].
The California Fuel Cell Partnership is pursuing an HRS infrastructure with the goals of 1,000
stations and 1,000,000 FCEVs by 2030 [118]. The California Air Resources Board estimates that
the FCEV fleet will grow to 27,000 vehicles by 2023 and 48,900 by 2026 in California, based on
the surveys of auto manufacturers' FCEV projections [116].
23Deployment Status of Fuel Cells in Road Transport: 2021 Update
4.4. GLOBAL OUTLOOK
The rapid increase in interest in a hydrogen economy was captured in a recent report by the
Hydrogen Council, with over 30 countries having hydrogen roadmaps and 228 large‐scale hy‐
drogen projects announced. Projections in this report showed that the costs for the renewable
production of hydrogen could be in the range of USD 1.4–2.3 per kg. [119]
In its 2017 report, the Hydrogen Council presented the following vision for the worldwide de‐
ployment of fuel cell vehicles [120]:
- 2030: 1 in 12 cars in Germany, Japan, South Korea, and California to be powered by
hydrogen; globally, 10–15 million cars and 500,000 trucks.
- 2050: Hydrogen would power more than 400 million cars, 15–20 million trucks, and
around 5 million buses.
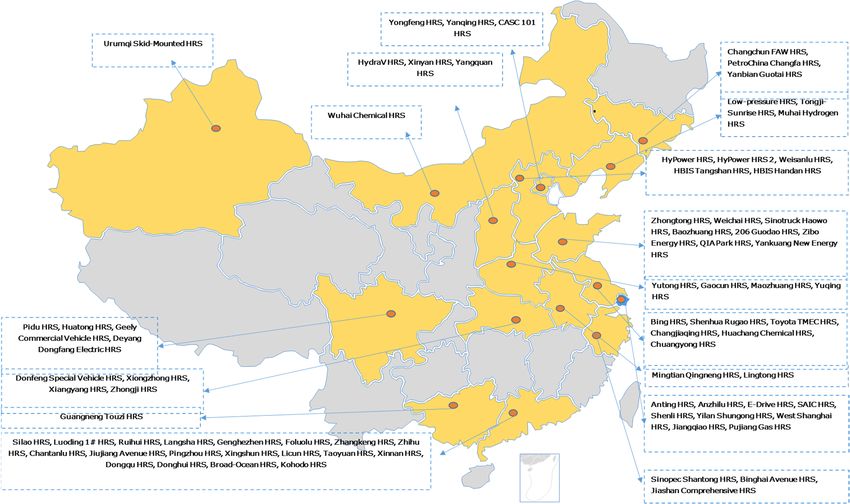
At the end of this chapter, the above‐mentioned plans and visions are combined in a single
chart in Figure 14 in an effort to present a complete picture of all targets and visions being
realized by 2050.
24Targets, Visions and Projections
FIGURE 14. SELECTION OF ANNOUNCED TARGETS, VISIONS AND PROJECTIONS. FCEV: FUEL CELL ELECTRIC VEHICLE (PASSENGER CARS);
FCV: FUEL CELL VEHICLE (ALL CATEGORIES); FCB: FUEL CELL BUS; FCT: FUEL CELL TRUCK; LCV: LIGHT COMMERCIAL VEHICLE; HRS:
HYDROGEN REFUELING STATION; NRW: FEDERAL STATE OF NORTH RHINE‐WESTPHALIA, GERMANY; 1 CARB ESTIMATION; 2 JIVE PRO‐
JECTS; 3 HYDROGEN COUNCIL VISION; 4 HYDROGEN ROADMAP AMBITIOUS SCENARIO; 5 CAFP VISION; 6 INCLUDING EXPORTED VEHI‐
CLES.
25Conclusions
5. CONCLUSIONS
In this document, the worldwide deployment status of FCVs in road transportation and HRSs
as of the end of 2020 was presented and analyzed based on the results from the fourth survey
of the Advanced Fuel Cells Technology Collaboration Programme, and complemented by ad‐
ditional information sources. As of 31/12/2020, the worldwide fleet of FCVs totaled more than
34,800. The fleet consists of passenger cars, buses, medium‐duty trucks, light commercial ve‐
hicles, and heavy‐duty trucks, in decreasing order. Globally, in 2020 South Korea became the
first country to surpass 10,000 vehicles, followed by the U.S. and China with more than 9,000
and 8,000, respectively. About two‐thirds of all currently deployed vehicles are on Asian roads.
With almost 26,000 units, passenger cars still make up the highest share of all vehicle types,
with a head‐to‐head competition between South Korea (10,041) and the U.S. (9,188). Adding
Japan (4,100) as the third‐ranking, 90% of the worldwide stock of fuel cell passenger cars is
reached, shared across these three countries. As in the previous year, the worldwide fleets of
buses and medium‐duty trucks were dominated by the Chinese market. The increasing trends
for both passenger cars and all other vehicle types slowed down in 2020. For passenger cars,
the rate of increase dropped from 69% in 2019 to 37% in 2020, whereas the rate of increase
for all vehicles dropped more strongly, from 95% in 2019 to 38% in 2020. For the strong in‐
crease rate among all vehicles in 2019, the increase in the number of buses and trucks in China
was decisive. In 2020, this trend was halted due to changes in the national subsidy policy in
China. The absolute increase in the number of passenger cars was only around 10% lower in
2020 than in the previous year, but the drop in the relative increase rate was stronger due to
the increased population of vehicles on the road. Looking at the top two countries with the
highest numbers of passenger cars, the development trends in the U.S. exhibited a limited
increase of 15% in 2020 compared to 36% in 2019. In contrast, the number of registered pas‐
senger cars in South Korea increased very strongly, by 98% in 2020, contributing to more than
half of the overall increase in the total number of fuel cell vehicles worldwide.
The AFC TCP survey also reveals that the number of HRSs had increased to 540 as of the re‐
porting date of 31/12/2020, including public and private facilities. Japan, Germany and China
are the three countries with the highest number of stations in operation. The public stations
in Japan, Germany, China and the U.S. represent 63% of the total number of stations globally.
In 2020, the increase rate of new stations slowed down to 15%, in comparison to 23% in 2019.
Bringing the country‐based numbers of registered vehicles and HRSs together, a theoretical
analysis was performed to estimate the number of vehicles per station for the six countries
with the highest numbers of stations. According to this analysis, South Korea has the highest
allocation, with 194 vehicles per station, whereas France and Germany have the lowest, with
around 10–12 vehicles per station. As the geographical location of the stations and the regis‐
tration regions of the vehicles were not considered in this analysis, the real allocation profiles
can lead to even higher, and respectively lower, numbers for both cases.
27Deployment Status of Fuel Cells in Road Transport: 2021 Update The regional, national and international roadmaps, targets and visions presented in this report show that the above‐presented numbers reflecting the 2021 status can develop towards 2050, providing an essential contribution to zero‐emission transportation with hydrogen fuel cells. 28
Acknowledgements and Disclaimer

6. ACKNOWLEDGEMENTS AND DISCLAIMER
Data collection by the Advanced Fuel Cells Technology Collaboration Programme (AFC TCP)
Executive Committee Members.
The authors are deeply grateful to all Executive Committee Members of the AFC TCP who
delivered data for the annual data collection. Special thanks also to the FCH 2 JU Programme
Office for supplying the European data.
The results from the data collection on fuel cell vehicles and hydrogen refueling stations were
originally provided for the publication of the International Energy Agency (IEA) Global EV Out‐
look 2021.
The presented data is intended to provide an overview of the status and perspectives and was
prepared using the available sources. The AFC TCP does not claim that the data provided is
complete.
The AFC TCP functions within a framework created by the IEA. The activities of the AFC TCP
were coordinated by the IEA's Working Party on Energy End‐use Technologies (EUWP). The
views, findings and publications of the AFC TCP do not necessarily represent the views or pol‐
icies of the IEA Secretariat or of its individual member countries.
Publication date: June 2021.

                                                                                            29
References
7. REFERENCES
[1] Closer look at the deployment of fuel cell electric vehicles by the end of 2017. Ad‐
vanced Fuel Cells Collaboration Programme (AFC TCP), 2018. https://www.ieafuel‐
cell.com/fileadmin/publications/AFC_TCP_survey_status_FCEV_2017.pdf Access
date: 12.05.2021
[2] Closer look at the deployment of fuel cell electric vehicles by the end of 2018. Ad‐
vanced Fuel Cells Collaboration Programme (AFC TCP), 2019. https://www.ieafuel‐
cell.com/fileadmin/publications/2019‐04_AFC_TCP_survey_status_FCEV_2018.pdf
Access date: 12.05.2021
[3] Samsun, R.C.; Antoni, L.; Rex, M. Mobile fuel cell application: Tracking market trends
as of end 2019. Advanced Fuel Cells Collaboration Programme (AFC TCP), 2020.
https://www.ieafuelcell.com/fileadmin/publications/2020_AFCTCP_Mobile_FC_Ap‐
plication_Tracking_Market_Trends_2020.pdf Access date: 12.05.2021
[4] Austria (FCEV): Statistik Austria, https://www.statistik.at/web_de/statistiken/ener‐
gie_umwelt_innovation_mobilitaet/verkehr/strasse/kraftfahrzeuge_‐_bestand/in‐
dex.html
[5] Austria (FCB): https://www.postbus.at/en/das‐unternehmen/innovationen/wasser‐
stoffbusse.html;
[6] Austria (FCB): https://blog.wienerlinien.at/der‐wasserstoffbus‐er‐hat‐ueberzeugt/
[7] Canada (FCEV): HIS Markit Catalyst for Insight, 2020
[8] China: China SAE / NDANEV
[9] Denmark: (FCEV): http://brintbiler.dk/
[10] Denmark: (FCB): https://brintbiler.dk/16‐millioner‐kroner‐til‐groenne‐busser‐i‐
nordjylland/
[11] France: France Hydrogene, as of 01.11.2020
[12] Germany (FCEV and FCB): Kraftfahrt Bundesamt, Flensburg, Based on Roman Wolf/
NOW: Auswertung der KBA‐Zahlen, December 2020 (FCEV and FCB)
[13] IPHE Country Update December 2020: Netherlands (FCEV, FCB, MD‐Trucks), Germany
(FCET), Brazil, India, Republic of Korea.
[14] IPHE Country Update Norway (08/2020)
[15] IPHE Country Update Australia (11/2018)
[16] IPHE Country Update Costa Rica (06/2020)
[17] IPHE Country Update Switzerland (FCEV, Trucks, 11/2020)
[18] IPHE Country Update U.K. (FCEV, 02/2021)
[19] FCH2 JU Programme Office: Belgium, Iceland, Latvia, Germany (LDV), Netherlands
(LDV), Switzerland (LDV), U.K. (LDV, FCB).
[20] Japan: METI
[21] Spain: CNH2, February 2021
[22] Sweden: Hydrogen Sweden
[23] U.S. (FCEV): Argonne National Laboratory's Electric Vehicle Sales Tracker.
[24] U.S. (FCB): National Renewable Energy Laboratory's Fuel Cell Bus Database (11/2020).
[25] Italy (FCEV): https://www.h2‐suedtirol.com/it/il‐centro‐idrogeno‐di‐bolzano
31Deployment Status of Fuel Cells in Road Transport: 2021 Update
[26] Italy (FCB): https://www.h2it.it/
[27] Italy (LDV): https://www.seab.bz.it/it/news/seab‐e‐asm‐merano‐collaborano‐al‐pro‐
getto‐revive
[28] Netherlands (HD‐Trucks): https://www.h2haul.eu; Colruyt Group
[29] Hydrogen and Fuel Cell Industry Monthly Report, January 2021, Issue 10. China SAE –
IHFCA, Supported by Ballard Power Systems.
[30] https://www.toyota.com/content/dam/toyota/brochures/pdf/2021/mirai_ebro‐
chure.pdf. Access date 03.05.2021
[31] https://www.toyota‐europe.com. Access date 03.05.2021
[32] https://www.hyundaiusa.com/us/en/vehicles/nexo/compare‐specs. Access date
03.05.2021
[33] https://www.hyundai.news/eu/press‐kits/all‐new‐hyundai‐nexo‐technical‐specifica‐
tions/. Access date 03.05.2021
[34] https://hondanews.eu/eu/en/cars/media/pressreleases/106336/2017‐honda‐clarity‐
fuel‐cell‐press‐kit. Access date 03.05.2021
[35] https://owners.honda.com/vehicles/information/2018/Clar‐
ity%20Fuel%20Cell/specs#mid^ZC4F7JGNW. Access date 03.05.2021
[36] https://www.daimler.com/produkte/pkw/mercedes‐benz/glc‐f‐cell.html. Access date
03.05.2021
[37] https://media.daimler.com/marsMediaSite/de/instance/ko/Mercedes‐Benz‐GLC‐F‐
CELL‐Elektromobiles‐Doppelherz‐Batterie‐und‐Brennstoffzelle.xhtml?oid=41475770.
Access date 03.05.2021
[38] Fuel Cell Motor Vehicle Tax Credit. https://afdc.energy.gov/laws/350
[39] California Clean Vehicle Rebate Project. https://cleanvehiclerebate.org/eng/eligible‐
vehicles
[40] Hydrogen and Plug‐In Electric Vehicle (PEV) Rebate. https://afdc.en‐
ergy.gov/laws/11609
[41] http://www.cev‐pc.or.jp/hojo/pdf/r02/R2_meigaragotojougen.pdf
[42] https://toyota.jp/mirai/
[43] Honda
[44] https://www.boe.es/boe/dias/2020/06/17/pdfs/BOE‐A‐2020‐6235.pdf
[45] https://ecobonus.mise.gov.it/
[46] Green Car Congress: France and Germany lead EU countries in delivering green stimu‐
lus packages; increasing EV subsidies, June 29, 2020. https://www.greencar‐
congress.com/2020/06/20200629‐francegermany.html
[47] https://www.hyundai.at/nexo/finanzierung‐preise
[48] Toyota Austria
[49] https://www.umweltfoerderung.at/privatpersonen/foerderungsaktion‐e‐mobilitaet‐
fuer‐private‐2020‐2021/navigator/fahrzeuge‐1/foerderungsaktion‐e‐mobilitaet‐fuer‐
private‐2020‐2021.html
[50] https://www.umweltfoerderung.at/betriebe/foerderungsaktion‐e‐mobilitaet‐fuer‐
betriebe‐2021.html
[51] https://www.umweltfoerderung.at/fileadmin/user_upload/media/umweltfoerder‐
32You can also read