IMPACT OF TP53 MUTATION ON TUMOR MICROENVIRONMENT IN HPV-HNSCC - by Yuqi Kang A thesis submitted to Johns Hopkins University in conformity with ...
←
→
Page content transcription
If your browser does not render page correctly, please read the page content below
IMPACT OF TP53 MUTATION ON
  TUMOR MICROENVIRONMENT IN
           HPV- HNSCC

                                 by

                             Yuqi Kang

A thesis submitted to Johns Hopkins University in conformity with the

   requirements for the degree of Master of Science in Engineering

                        Baltimore, Maryland
                             May, 2021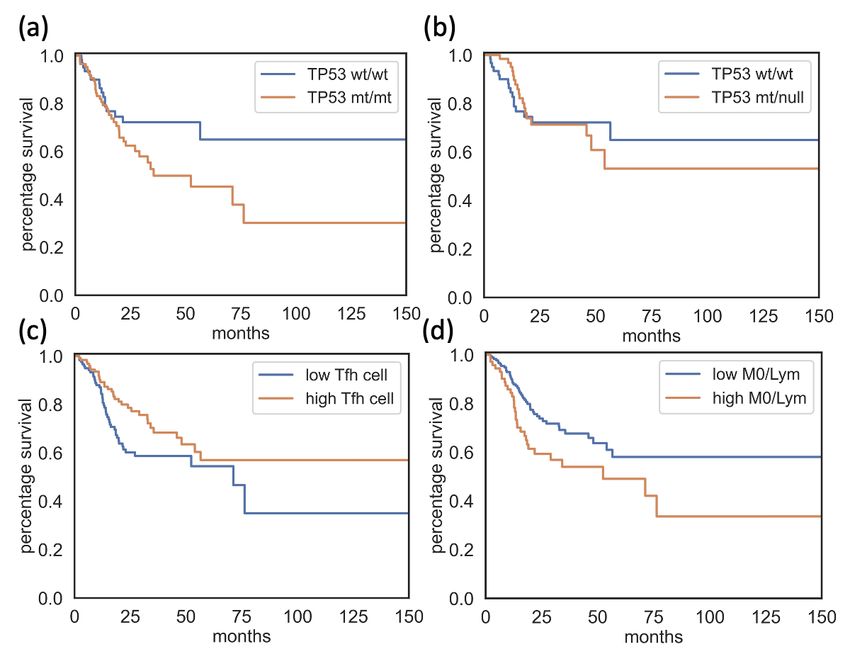
Abstract

TP53 mutations are one of the most frequent genomic alterations in head

and neck squamous cell carcinoma (HNSCC). Particularly, TP53 mutations
are observed in HPV negative (HPV-) HNSCC patients and have a strong
association with poor prognosis. However, the effects of TP53 mutations in

tumor microenvironment (TME) have not been characterized in HNSCC. I
assessed the extent of immune cell infiltrates among HPV- patients from the
TCGA-HNSC Pan-Cancer Atlas dataset.

Patients were stratified based on their TP53 mutation status and were eval-
uated for their TME and survival status. Gene differential expression and

co-mutation comparative analysis were used to identify other co-factors to
further elucidate phenotypic variability among HNSCC patients with different
TP53 mutation status. Gene set enrichment analysis were applied to identify

relevant altered pathways.

HPV- HNSCC was found to be associated with poorer survival status and

unfavorable TME, and more frequent TP53 alterations. Among HPV- HNSCC
patients, the unfavorable clinical outcome co-occurred with higher level of

                                     ii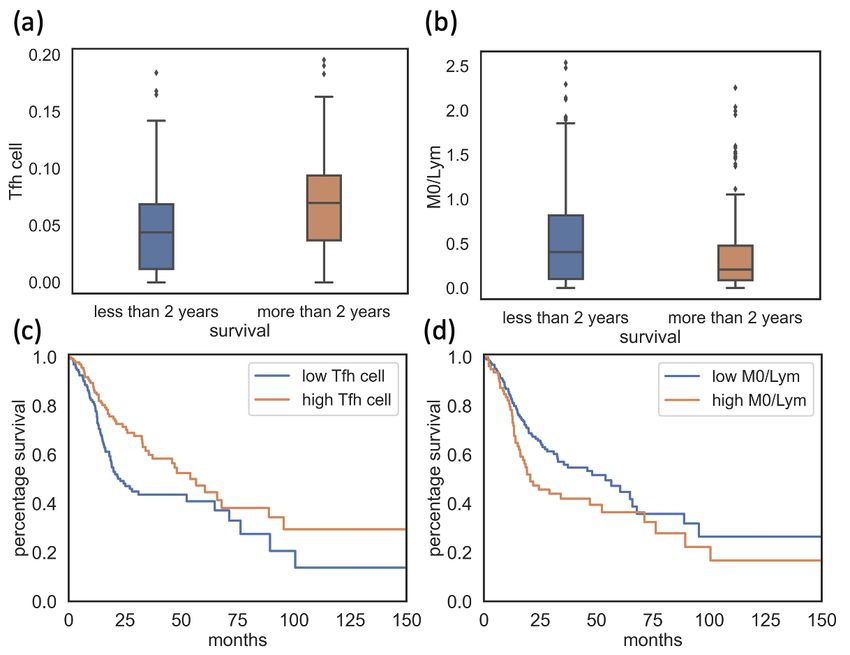
M0 macrophage infiltration and lower level of T follicular helper cell infiltra-
tion. Patients with homozygous TP53 mutation were shown to exhibit poorer

survival status, which is shown to be exaggerated with the co-occurrence of
PIK3CA mutations. I was able to identify immune-related pathways that were
down-regulated and highlight gene interactions that might bring about the

emergence of this immunosuppressive TME.

In conclusion, the poor prognosis associated with TP53 mutation in HN-
SCC patients, was, at least partially, caused by the tumor driven suppression
of immune response by the enrichment of macrophages and the deficiency of

T cells. I identified a subset of HPV- HNSCC patients that associated with a
higher risk of poorer clinical outcomes by a particular TP53 mutation status.

Primary Readers:

Dr. Rachel Karchin,
Dr. Kymberleigh Pagel,
Dr. Brian Caffo

                                      iii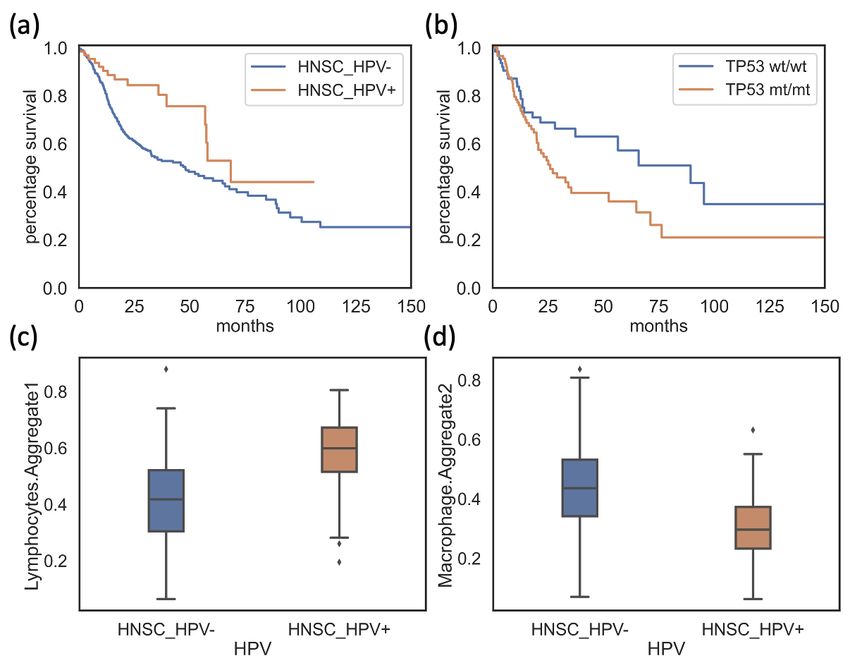
Acknowledgments

I am extremely grateful to my supervisor, Prof. Rachel Karchin, for accept-

ing me in your lab and providing me with the opportunity to work on this
fascinating project. Your support and care are valuable and necessary for my
success as a master student.

I want to express my deepest gratitude to Dr. Kymberleigh Pagel, for mentor-
ing me and helping me draft and edit this master thesis. The completion of

this thesis would not have been possible without your contribution and advice.

I would also like to express my sincere appreciation to Prof. Brian Caffo,

for kindly sparing time reading this thesis and giving me your precious feed-
back.

Special thanks to my families for their love and care!

The results shown here are in whole or part based upon data generated

by the TCGA Research Network: https://www.cancer.gov/tcga.

                                      iv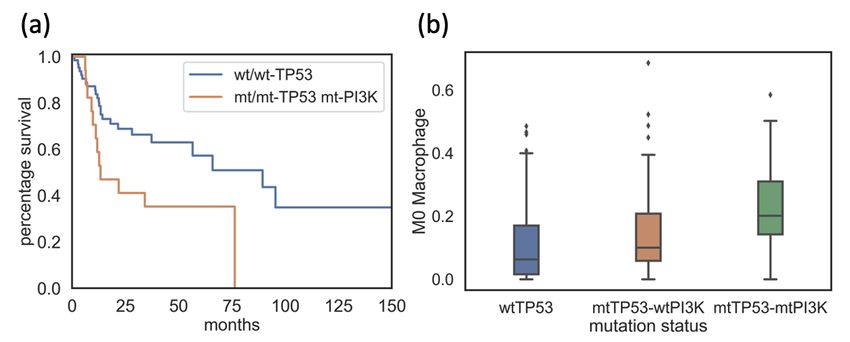
Table of Contents

Abstract                               ii

Acknowledgements                      iv

Table of Contents                      v

List of Tables                        vi

List of Figures                       vii

1   Introduction and Background        1

2   Methods and Materials              5

3   Results                           11

4   Discussion and Conclusion         25

                                  v
List of Tables
2.1 TP53-mutated HPV- HNSCC patient distribution . . . . . . 7
2.2 Mean values of cell infiltrates . . . . . . . . . . . . . . . . . . 8
viList of Figures
3.1 HPV- and HPV+ HNSCC . . . . . . . . . . . . . . . . . . . . . 12
3.2 Unfavorable Tumor Microenvironment . . . . . . . . . . . . 14
3.3 HPV- HNSCC patients: TP53 mutation status . . . . . . . . . 16
3.4 Disease-specific survival analysis . . . . . . . . . . . . . . . . 18
3.5 TP53 PIK3CA co-mutation . . . . . . . . . . . . . . . . . . . . 23
viiChapter 1
Introduction and Background
Head and neck squamous cell carcinoma (HNSCC) is one of the six most
common cancers worldwide, with over 80,000 people diagnosed with it in
2018 (Johnson, 2020). HNSCC could originate from multiple primary tumor
sites: oral cavity, oropharynx, larynx and hypopharynx. The main risk factors
for HNSCC include tobacco, alcohol and human papillomavirus (HPV) infec-
tion. The two subtypes of HNSCC, regarding the HPV status, HPV-associated
(HPV+) and HPV-unassociated (HPV-), are clinically distinct, differing in both
pathophysiology and prognosis. These differences at least partially driven
by mutational patterns. While it is rare in HPV+ HNSCC, TP53 is one of the
most commonly altered genes in HPV- HNSCC, occurring in nearly all cases
(Network, 2015). As with many other types of cancer, TP53 mutation is an
independent poor prognosis factor in HNSCC (Johnson, 2020). As a well-
known tumor suppressor protein, p53 contributes significantly to counteract
the tumor progression. For example, overexpression of p63 is observed to be
related to HNSCC tumor, while normally functioning p53 would degrade p63
and therefore suppress HNSCC tumor (Partridge M, 2007). Mutated TP53
1with altered function would lead to the dysregulation of its related pathways,
including p53-mediated cell sentence and metabolism. Studies have also
shown that HNSCC patients with mutated TP53 tend to lose the sensitivity to
response to chemotherapy treatments (Rodriguez-Ramirez C, 2018). If TP53
mutations are present, about half of patients with locally advanced tumor and
nearly all patients with tumor metastasis would die from their disease.
Similar to other malignancies, targeting the p53 pathway has remained a
challenge due to the various roles that p53 plays in cellular function, and the
presence of both gain and loss of function mutations (Muller and Vousden.,
2014). Activated by cell stress, p53 functions as the key gene in cell-apoptosis,
DNA damage repair, cell cycle regulation and differentiation (Zhou G, 2016).
Recent research on the immunomodulatory effects of p53 suggested that p53
mutants modify tumor microenvironment (TME), contributing to immune
escape. In HNSCC, TP53-mutated tumors have been shown to harbor sig-
nificantly lower antitumor immune signature levels than wild type TP53
tumors (Li L, 2020). As an analogy to macroscopic ecosystem, TME refers
to the surrounding of tumor cells that is shaped by tumor cells and in favor
of tumorigenesis, consisting of their neighboring cells, blood vessels and ex-
tracellular matrix, etc. (B., 2019). TME is essential for the development and
metastasis of tumor. Here, I assessed the impact of tumor cells on TME via
the infiltration of immune cells, also known as leukocytes. The abundance
of immune infiltrates in HNSCC patients have established utility in patient
stratification for improved assessment of prognosis and treatments, serving
as potential targets and predictors (Hollern DP, 2019; Wu T, 2017).
2Leukocytes are white blood cells including neutrophils, monocytes, eosinophils,
basophils, and lymphocytes (Carrick JB, 2008). Monocytes can further differen-
tiate into M0 macrophages and dendrite cells, and lymphocytes are regarded
as the combination of B cells, T cells and NK cells. Resting M0 macrophages
would polarize to tumor-promoting M2 macrophages, induced by IL-4, IL-13
and IL-10, while IFN-y and LPS would drive the polarization towards the path
to tumor-suppressing M1 macrophages (Orekhov AN, 2019; Viola A, 2019).
Mature T cells could be categorized by their cell surface markers: CD8 T cells,
the cytotoxic T cells that fight against pathogen and malign cells like tumor
cells directly, and CD4 T cells, the helper T cells that regulate immune response
(Kishton RJ, 2017). The activation and differentiation of B cells into memory
B cells and plasma cells require the assistance from CD4 T cells, particularly
depending on the T follicular helper (Tfh) cells in germinal center (Kennedy R,
2019). Tfh cells also produce cytokines like IL-21 to modulate B cell prolif-
eration (Cyster JG, 2019). Activated memory B cells and plasma cells are
recognized to be crucial for anti-tumor immunity via secreting immunoglob-
ulin and enhancing T cell response (Tokunaga R, 2019). Immune-related
pathways such as NF-kB and MAPK activation, PI3K/Akt/mTOR pathway
and IFN signaling also exert profound impact on the modification of TME,
participating in the interaction networks of immune cells and regulating their
abundance and activities (Wu T, 2017; Rothenberger NJ, 2018) .
In this work, I characterized the possible mechanisms by which TP53 al-
terations impacted the generation of an immunosuppressive TME in HPV-
3HNSCC. Existing paired whole exome sequencing (n=523) and RNA sequenc-
ing (n=501) data from TCGA-HNSC were analyzed using computational
approaches to identify the immune infiltrates and clinical outcomes that were
related to defective TP53. HPV- HNSCC patients with homozygous TP53
mutation were found to be more likely to exhibit immunosuppressive TME
and poorer survival status. I also identified PIK3CA mutation as a co-factor
that could exaggerate this unfavorable situation, and highlighted key immune-
related pathways that were downregulated in these patients. Immune infil-
trates such as higher M0 macrophages and lower Tfh cells were recognized as
indicators to reflect the status of TME for individual HNSCC patients.
4Chapter 2
Methods and Materials
This study used patient data from Head and Neck Squamous Cell Carcinoma
Cancer Genome Atlas (TCGA-HNSC) Project (Tomczak K, 2015). This dataset
was examined from several aspects: HPV status, somatic mutation, copy num-
ber variation, allele zygosity, immune cell infiltration, and gene expression. To
serve this aim, I first filtered out patients without record of these data points.
After this step, 470 patients remained. Patients’ HPV status was determined
using a threshold of 10 for HPV NRPM, the normalized reads per million
(Thorsson V, 2019). This value was obtained by multiplying the number of
reads that hit the HPV viral genome of a sample with 106 and then dividing
this result by the number of total reads of that sample. In further analysis, I
retained only patients that were HPV-, which resulted in 406 samples.
TP53 mutational status
Somatic mutation calls for patients with HNSCC were obtained from Multi-
Center Mutation Calling in Multiple Cancers (MC3, v0.2.8) (Ellrott K, 2018).
On recommendations from the MC3 group, variants for which the FILTER
5column did not equal “PASS” were excluded. Samples that were designated as
hypermutators were also excluded. Based on the number of mutations found
in the sample, hypermutators were defined as samples with greater than 1000
mutations, and with mutation count greater than 1.5 times the interquartile
range above the third quartile of HNSCC patients. I further filtered out 82
patients with more than one mutation or silent mutations. Thus, remaining pa-
tients could be categorized into the following TP53 status: wild type, missense,
frame shift, in frame mutation, splice site or nonsense. I further separated
missense mutation into two subcategories: gain-of-function (GOF) mutations
(Muller and Vousden., 2014) and missense, and combined nonsense, frame
shift and splice site mutation as loss-of-function (LOF) mutation.
TP53 copy number alterations
TP53 status could also be categorized from allele and copy number aspect:
wild type, homozygous mutation, heterozygous mutation and mutation with a
copy loss. The gene copy number scores were generated via GISTIC2 (Mermel
et al., 2011) and retrieved from cBioPortal (Gao et al., 2013). The threshold val-
ues of GISTIC2 outputs were applied here, where 0 indicates no copy loss, -1
indicates shallow copy loss, while -2 indicates possibly a homozygous deletion.
I obtained the allele information, the counts of reference alleles and alternative
alleles, from the MC3 Mutation Annotation Format (MAF) file (Ellrott K, 2018).
The variant allele frequency (VAF) was calculated based on this information
and further normalized by tumor purity (Donehower LA, 2019). TP53 muta-
tion zygosity was determined by these normalized VAF values, where VAF
6> 0.75 was regarded as a homozygous mutation, and otherwise heterozy-
gous (Donehower LA, 2019). Patients were further divided into subgroups
based upon their TP53 mutation type: homozygous wildtype (TP53wt/wt ),
patients with one or more copies of mutant TP53: heterozygous mutation,
(TP53wt/mt ) or homozygous mutation, (TP53mt/mt ), and those with copy loss
(TP53mt/null ). The combination of TP53mt/mt and TP53mt/null could also be
regarded as loss-of-heterozygosity mutation (TP53LOH ). The TP53wt/null and
TP53null/null groups were not considered in this study due to their significantly
lower sample spaces (n=9/n=3). I also excluded samples with copy number
amplification as there was not a well-defined criterion to evaluate their allele
zygosity (n=40). Table 2.1 shows the distribution of TP53-mutated HNSCC
HPV- patients, while 66/271 patients are in TP53wt/wt group.
TP53wt/mt TP53mt/mt TP53mt/null
Missense 11 27 33
LOF 18 37 25
GOF 9 22 18
Table 2.1: TP53-mutated HPV- HNSCC patient distribution
Immune cellular fractions
To contrast the relative fraction of immune cell types within the leukocyte
compartment, I utilized immune cellular fractions and estimated aggrega-
tions from Thorsson et al (Thorsson V, 2019). These data were generated
via CIBERSORT, using the default LM22 signature genes file to determine
infiltrates of 22 immune cell subtypes including T cells, B cells and myeloid
cells, etc. (Newman et al., 2015). Gene expression profiles of HNSCC patients
7generated from RNA seq data were used as inputs for CIBERSORT. The ratios
of immune cell subtypes were also taken into consideration to compare the
relative abundance of these infiltrates among patients: M0 macrophages to
total lymphocytes (M0/Lym). An outlier was removed with the M0/Lym
ratio larger than 5. These immune cell abundances and their ratios were
categorized as high or low relative to the mean value. Table 2.2 shows these
thresholds. I excluded immune cell types whose infiltrate values that are miss-
ing in more than one third (90) of the patients. Statistical tests were used to
contrast immune cell infiltrates among HPV- HNSCC patients with different
TP53 mutation status.
Cell Type Threshold
Macrophage M0 0.155
T follicular helper cell 0.061
M0 / Lymphocytes 0.511
Table 2.2: Mean values of cell infiltrates
Gene expression Analysis
HTSeq-counts from RNA sequencing data were acquired from the Genomic
Data Commons portal (Grossman, 2016). Genes were mapped from Ensembl
identifier to their HUGO gene symbol using the GENCODE human genome
(GRCh38, v22) (Frankish A, 2019). To avoid ambiguity, I filtered out 399 genes
with more than one Ensembl identifier. To remove genes with low expression,
genes with zero count in more than one third patients (n=90) were excluded.
After this filtering, 32736 out of 60483 genes were left to differential gene
expression analysis using DESeq2, where TP53wt/wt patients served as the
8control group (Love MI, 2014). Genes with adjusted p-value less than 0.05 in
the differential gene expression (DEG) analysis were used for downstream
pathway enrichment analysis with Gene Set Enrichment Analysis (GSEA)
(Subramanian A, 2005). The log-fold change scores of these genes after ap-
proximate posterior estimation for GLM coefficients shrinkage were used as
enrichment scores (Zhu A, 2019). I used the Reactome (Fabregat A, 2017) and
Hallmark pathways (Liberzon A, 2015) in the GSEA Pre-ranked analysis, with
permutation number set to 1000 and a significance cutoff for false discovery
rate (FDR) at less than 0.05. The top 25 pathways with higher enrichment
scores from each TP53 mutated group were selected for further investigation.
DEG and GSEA analysis were also applied to contrast gene expressions and
pathway regulations in tumor site and those in normal tissue within patients
with same TP53 status, following the above workflow.
Gene Co-Mutation Analysis
To detect genes whose mutations frequently co-occur with a certain subtype
of TP53 mutation, two methods were applied: first, I generated a list of genes
that mutated in more than 15% samples for each TP53 mutated group list
one. Then, I inputted the gene mutation information of HNSCC HPV- pa-
tients into pairwise Multivariate Organization of Combinatorial Alterations
(MOCA) analysis (Masica DL, 2011) to achieve a list of genes that mutated
more frequently in this TP53 mutated group compared to all other samples
with FDR less than 0.05 and positive predictive value (PPV) more than 0.1, as
list two. The union of genes in list one and list two were the genes of interest
here and were examined for their association with survival status and tumor
9microenvironment (TME). Thirteen genes were found for our group of interest,
the TP53mt/mt group.
Survival Analysis
Survival analysis was applied to examine the impact of TP53 gene alteration,
cell infiltrates, and the co-occurrence of TP53 mutation and mutation of other
genes on the prognosis of HNSCC HPV- patients via the python package
lifelines, using Kaplan-Meier estimator. The survival variables were extracted
from cBioPortal for the TCGA-HNSC PanCancer dataset, specifically the
OS_MONTHS and OS_STATUS variables for overall survival: decreased or
alive; DSS_MONTHS and DSS_STATUS variables for disease-specific survival:
alive or dead without tumor, dead from tumor (Tomczak K, 2015). I compared
the survival curves between TP53wt/wt group and patients with mutated TP53
subtypes, or patients with co-occurrence of mutated TP53 subtypes and the
mutation of some other gene. The association between cell infiltrates and
patient survival was assessed via two aspects. Firstly, the survival curves
between patient with high cell infiltrates and patient with low cell infiltrates
were compared via statistical tests, using previously defined threshold. Sec-
ondly, patients were divided into two groups by their survival status: patients
who decreased within two years and patients who survived for at least two
years in order to check if any cell infiltrates or ratios was significantly different
between these two groups.
10Chapter 3
Results
HPV- HNSCC distinguished with poor survival status, unfavorable tumor
microenvironment and more frequent TP53 mutation
Overall survival analysis demonstrated that HPV- HNSCC patients had sig-
nificantly poorer survival rate compared to the HPV+ patients (Log-rank test,
p-value < 0.005, Figure 3.1 a). The tumor microenvironment (TME) among
HPV- HNSCC patients showed differences in tumor cell infiltration, exhibiting
significantly greater cell infiltration of macrophages and lower cell infiltra-
tion of lymphocytes (Mann-Whitney U test, p-value = 1.06e-12 and 4.58e-15
respectively, Figure 3.1 c-d ), where decreased lymphocytes are known to
associate with the suppression of anti-tumor immune response (Yang L, 2019)
and tumor-associated macrophages promote an immunosuppressive TME
(Lin Y, 2019). In addition, protein-coding TP53 mutations were 50 times more
frequent in HPV- HNSCC patients compared to the HPV+ HNSCC patients
(330/406 HPV-, 1/64 HPV+). I then evaluated the relationships between the
poor survival outcomes and specific subcategories of TP53 mutations in HPV-
11Figure 3.1: Plot contrasting survival status (a), lymphocytes infiltrates (c) and
macrophages infiltrates (d) between HPV+ (orange) and HPV- (blue) patients from
TCGA-HNSC. Plot contrasting survival status between homozygous TP53 mutated
patients (TP53mt/mt , orange) and Wild Type TP53 patients (TP53wt/wt , blue) in HN-
SCC HPV- group (b).
HNSCC patients. Survival analysis showed a significantly lower survival
rate in TP53mt/mt patients compared to TP53wt/wt patients (Figure 3.1 b, p-
value=0.04). In the following sections, I sought to establish the joint effects
of immune infiltrates and TP53 alterations on the prognosis of HNSCC HPV-
patients, and identify associations between TP53 mutation and altered TME.
12HPV- HNSCC patients with homozygous TP53 mutation exhibited low T
follicular helper cell and high M0 macrophage cell infiltration, which cor-
related with poor survival.
Since HNSCC is an immune-rich disease, the abundances of immune cells in
TME may serve as indicators for patient survival and prognosis, and provide
insights into how the tumor could impact TME. Evaluating the dissimilarity
of pro-inflammatory and anti-inflammatory immune cell infiltrates among
patients with different TP53 mutation subtypes could also help to explain their
distinct immune status. Therefore, I turned to find the association between
immune cell infiltration and patient survival. In patients with poorer survival,
significantly lower T follicular helper (Tfh) cells and higher M0 macrophages
to aggregated lymphocytes ratio, M0/Lym, were observed (Mann-Whitney U
test, p-value =4.44e-5 and 0.0035, respectively, Figure 3.2 a-b). Consistent with
previous research (Wondergem NE, 2020; Gu-Trantien C, 2013; Thorsson V,
2019), overall survival analysis showed that lower Tfh cell infiltrate signifi-
cantly related to poorer survival rate (Log rank test, p-value < 0.005, Figure
3.2 c). This negative impact of low Tfh cell infiltration could be explained by
its irreplaceable role in the survival, maturation of B cells and T-cell-B-cell
interaction (Lechner A, 2019; Hollern DP, 2019). Other studies suggested that
higher monocyte-to-lymphocyte ratio was unfavorable for patient survival
(Hu RJ, 2018; Yang YT, 2018). Monocyte infiltrates were hardly detected in
HNSCC HPV- patients, as 101/271 patients were found to have zero value.
However, a similar ratio, M0/Lym, was identified, where M0 macrophages
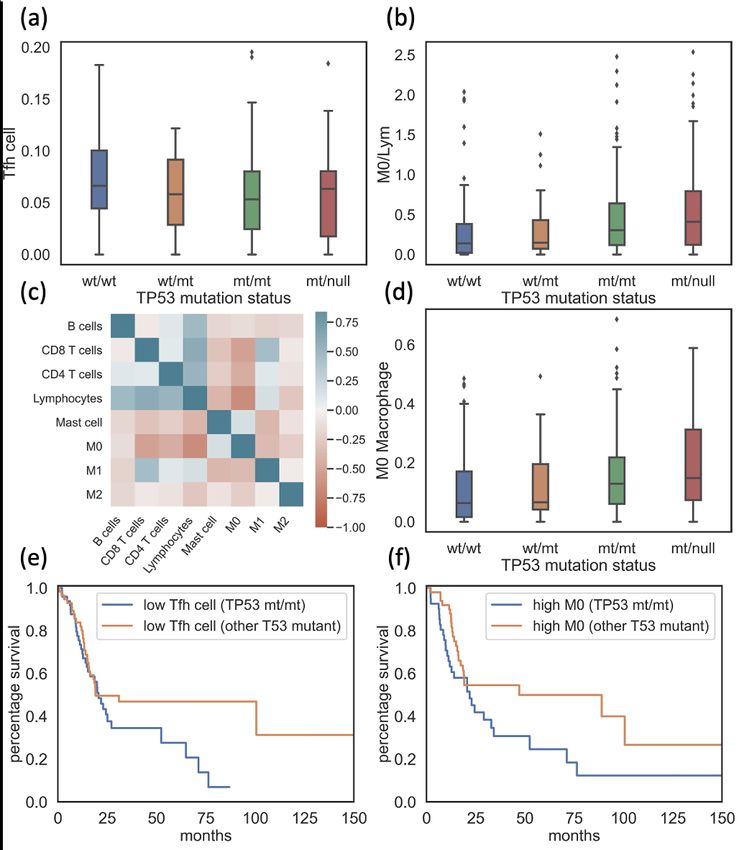
13Figure 3.2: Plot contrasting differences in T follicular helper (Tfh) cell (a) and high
M0 macrophage /Lymphocyte (M0/Lym) (b) in HPV- HNSCC patient group and the
survival rate of patients with different Tfh cell (c) and M0/Lym ratio (d). Tfh cell = T
follicular helper cell, M0 = M0 Macrophages, Lym = Aggregated lymphocytes
differentiated from monocytes and could polarize to pro-inflammatory M1
macrophages and anti-inflammatory M2 macrophages. A higher M0/Lym
ratio was associated with poorer survival (Log rank test, p-value = 0.03, Figure
3.2 d).
With Tfh cell infiltration and M0/Lym ratio identified, I then went to see
if these infiltration values were significantly different in the mutated TP53
groups compared to wild type TP53 patients. Significantly lower Tfh cell
14infiltrates were found in the TP53mt/mt group (Mann-Whitney U test, p-value
= 0.026, Figure 3.3 a). Patients in the TP53mt/mt group and the TP53mt/null
group also had significantly higher M0/Lym (Mann-Whitney U test, p-value
= 0.004 and 0.0004 respectively, Figure 3.3 b). A strong negative correlation
between M0 macrophages and lymphocyte infiltrates was found (Pearson cor-
relation, coefficient = -0.66, p-value = 1.52e-34, Figure 3.3 c). Considering that
the lymphocytes are consisted of multiple disparate cells, M0 macrophages
were used to represent M0/Lym ratio, while the impact of M0 macrophages
was also supported by Jairath et al. (Jairath NK, 2020). The comparison
of M0 macrophage infiltrates between different mutated TP53 groups and
wild type TP53 group returned similar findings to that of M0/Lym, where
the TP53mt/mt group and the TP53mt/null group stood out with significantly
higher M0 macrophage infiltrates, supporting the usage of M0 macrophages
to reflect M0/Lym ratio for simplicity (Mann-Whitney U test, p-value = 0.006
and 0.0007 respectively, Figure 3.3 d). I also observed significantly lower
CD8 T cell infiltrates in TP53mt/mt patients and TP53mt/null patients (Mann-
Whitney U test, p-value = 0.0001 and 6.99e-7 respectively), as well as lower
pro-inflammatory M1 macrophage infiltrates (Mann-Whitney U test, p-value
= 0.007 and 0.0006 respectively). Both of them were recognized as signs to
indicate immunosuppressive TME (Padoan A, 2019; Choo YW, 2018). In
combination, these immune cell infiltrates shaped the unfavorable TME of
TP53mt/mt patients and TP53mt/null patients. However, distinctions between
TME of TP53wt/mt patients and TP53wt/wt patients were not obvious.
The survival analysis could be further extended from overall survival (OS) to
15Figure 3.3: Plot contrasting the Tfh cell (a), M0/Lym ratio (b), and M0 infiltrates (c)
in HNSCC HPV- patients with different TP53 types. Heatmap representing Pearson
correlation of immune cell infiltrates. (d) Overall survival curve for patients with low
Tfh cell infiltrates (e) and high M0 macrophage infiltrates (f) contrasting TP53mt/mt
group and group with other TP53 mutations. Tfh cell = T follicular helper cell, M0 /
Lym = M0 Macrophages over Aggregated lymphocytes.
16disease-specific survival (DSS), where patients were categorized as (1) alive
or dead without tumor or (2) dead from tumor rather than simply alive or
decreased. This categorization could reduce the noise of other factors like age
and the existence of other diseases in survival analysis. However, due to the
relatively incomplete record of HPV- HNSCC patients’ disease-specific sur-
vival status, here I applied this analysis as a validation method to ensure that
our finding would still hold from another more stringent aspect. Similar as
OS analysis, DSS analysis showed obviously poorer survival of the TP53mt/mt
group compared to the TP53wt/wt group, and more noticeable difference be-
tween the survival status between the TP53mt/mt group and the TP53mt/null
group (Log rank test, p-value = 0.07 and 0.67 respectively, Figure 3.4 (a)-(b)).
The statement that patients with lower Tfh cell infiltrates or higher M0/Lym
ratios have significantly more unfavorable survival continued to hold in DSS
analysis, using the same threshold value as OS analysis (Log rank test, p-value
= 0.03 and 0.02, respectively, Figure 3.4 (c)-(d)).
As discussed in previous section, the TP53mt/mt group showed a significantly
poorer survival compared to the TP53wt/wt group, which might be explained
at least partially, by this unfavorable TME pattern of this group. The TP53mt/mt
group tended to have low Tfh cell and high M0 macrophage infiltrates, both of
which were identified to significantly associated with poor prognosis. I then
noticed that within the patients with low Tfh cell infiltrates and patients with
high M0 macrophage infiltrates, homozygous TP53 mutation also seemed to
be the driving co-factor for the unfavorable survival, where in the survival
17Figure 3.4: Plot contrasting survival status between TP53mt/mt patients (orange) (a)
or TP53mt/null patients, orange (b) and TP53wt/wt patients (blue). Plot contrasting
survival status between patients with low cell infiltrate (blue) and patients with
higher cell infiltrate (orange) of Tfh cell (c) and M0/Lym ratio (d). Tfh cell: T follicular
helper cell; M0/Lym: M0 macrophage over Aggregated lymphocytes ratio
18analysis, patients with other TP53 mutation status have better outcomes com-
pared to TP53mt/mt patients (Log rank test, p-value = 0.06 and 0.02 respectively,
Figure 3.3 e-f). Such differences in survival did not hold in other mutated
TP53 groups, implying some uniqueness of TP53mt/mt patients.
The immunosuppressive tumor microenvironment of TP53mt/mt patients
co-occurs with down-regulation of immune-related gene interactions which
differ from those of TP5mt/null patients.
Though TP53mt/mt patients bore significantly poorer survival rate, patients
with TP53LOH mutations (TP53mt/mt and TP53mt/null ) shared the similar im-
munosuppressive TME. Gene expression and pathway regulation of these two
groups were contrasted via DEG and GSEA analysis to find possible mech-
anisms explaining the difference. The expressions of TP53 in patients with
TP53 mutations did not differ from TP53wt/wt patients. However, a significant
decrease was detected in the expression of TP53 inducible nuclear protein
1 (TP53INP1) and TP53 inducible protein 3 (PIG3) in both TP53LOH groups,
indicating the dysfunction of mutated TP53. Interestingly, TP53mt/null patients
also showed an increase of the expression of TP53 inducible protein 11 (PIG11),
an TP53-activated gene which could suppress tumor metastasis by hinder-
ing the epithelial-mesenchymal transition and triggering p53-dependent cell
apoptosis (Xiao T, 2019; Wang Y, 2018; Liu XM, 2009). This result suggests the
possibility that TP53mt/null patients were having more "normally" functioning
TP53 compared to the TP53mt/mt group, and that alternative pathways were
activated in the TP53mt/null group to regulate some of the TP53-dependent
19tumor suppressor genes. The overexpression of this tumor suppressor protein
might associate with the relatively better survival of TP53mt/null patients.
I further split TP53mt/mt patients and TP53mt/null patients by their TP53 mu-
tation subtypes from another aspect: GOF, LOF and missense. Significantly
higher M0/Lym ratio was found in TP53mt/mt patients with LOF and missense
mutations, as well as TP53mt/null patients with GOF and missense mutation.
Lower Tfh cell infiltrates were found in TP53mt/mt and TP53mt/null patients
with missense mutations. Overall survival analysis revealed that TP53mt/mt
patients with missense and LOF mutations tended to have unfavorable sur-
vival, as well as TP53mt/null patients with GOF mutations (Log rank test,
p-value = 0.04, 0.14 and 0.06 respectively). Such unfavorable survival also
seemed to be associated with whether the mutated TP53 could preserve the
normal function, at least partially, since groups with poor survival tended
to decreased expressions of TP53 inducible proteins, while the expression
of TP53 inducible proteins of other mutated TP53 groups were either over-
expressed or did not differ from that of the TP53wt/wt group.
GSEA analysis further illustrated the distinctiveness among the most down-
regulated pathways of the TP53mt/mt group and the TP53mt/null group. Only 8
(32%) of the top 25 down-regulated pathways were commonly shared among
these groups. The most downregulated pathways in the TP53mt/mt group in-
cluded IL-10 synthesis, BCR signaling, and NF-kB and MAPK activation, while
the TP53mt/null group presented major downregulation in IFN-y response,
IFN signaling and TCR signaling, suggesting different mechanisms leading
20to the immunosuppressive TME in these two groups. The most significantly
down-regulated pathways found in TP53mt/mt patients also participated in
macrophage activation and polarization, such as the FCERI mediated activa-
tion of MAPK and NF-kB activation, and the FCGR3A mediated IL-10 syn-
thesis. Since IL-10 could promote the polarization towards M2 macrophages,
down-regulation of IL-10 synthesis would directly inhibit M2 polarization
(Viola A, 2019; Sun Y, 2020).
Macrophage activation could be also regulated by NF-kB and MAPK signaling
(Nie Y, 2019; Park JI, 2019). The inhibition of these two pathways would result
in the suppression of macrophage differentiation, especially towards the M1
macrophages direction (Sun Y, 2020; Islam SU, 2018). Downregulation of
them in TP53mt/mt patients may also contribute to their significantly high
M0 abundance, as a consequence of reduction in macrophage activation and
polarization. Further considering the impact of Tfh cells on B lymphocytes,
the low Tfh cell infiltrates might also relate to the high M0 macrophage in-
filtrates. B cells could induce the polarization of M2 macrophage via IL-10
signaling (Affara NI, 2014). Therefore, the suppression of B cell activation
caused by the low Tfh cells could inhibit the polarization from macrophages
M0 to M2. Significantly down-regulated IL-10 synthesis and B cell receptor
(BCR) related pathways, for example, CD22 mediated BCR regulation and
signaling by BCR, in the TP53mt/mt group supported this possibility. Besides
mediating the activation of NF-kB and MAPK, FCERI (IgE receptor) itself
could also contribute to the elevation of M0 macrophage infiltrates. IgE would
21activate M0 macrophages via binding to its receptor, FCERI. Therefore, re-
duced FCERI could inhibit the polarization of M0 macrophage (Zhang X, 2020;
Karagiannis SN, 2017). To summarize, these top down-regulated pathways
together negatively regulated the activation and polarization of resting M0
macrophages towards either pro-inflammatory M1 or anti-inflammatory M2
direction, therefore leading to the immunosuppressive TME of TP53mt/mt
patients.
The Co-occurrence of PIK3CA kinase region mutation in TP53mt/mt patients
promotes the immunosuppressive TME and contributes to poor survival
The mutation of a single gene is unlikely to be the only driving factor to
cancer development. I hypothesized that the co-occurrence of some additional
factors, such as mutation of other genes, may together promote poor patient
survival. Among genes of interest, the mutations of gene PIK3CA were found
to be associated with poor prognosis, when co-occurring with homozygous
TP53 mutation (Log rank test, p-value = 0.02, Figure 3.5 a). This finding was
supported by previously published studies, suggesting that the co-mutation
of TP53 and PIK3CA is related to poor clinical outcomes (Li AJ, 2018; Chen X,
2019). Studies have shown that PIK3CA mutations lead to a continuous acti-
vation of PI3K/Akt/mTOR pathway (Fujimoto Y, 2020; Zhang Y, 2017). The
hyperactivation of PI3K/Akt/mTOR pathway has been observed in multiple
cancer types and the inhibition of this pathway has been an option for cancer
immunotherapy, due to its role in promoting cell proliferation, survival and
migration (O’Donnell JS, 2018; Okkenhaug K, 2016). The PI3K/Akt/mTOR
22Figure 3.5: Plot contrasting the survival curve of wild type TP53 patients and patients
with both TP53 and PIK3CA mutations (a). Plot contrasting M0 macrophage infiltrates
of TP53wt/wt group, TP53mt/mt group with wild type PIK3CA and TP53mt/mt group
with mutated PIK3CA (b).
pathway might also contribute to the immunosuppressive TME via its impact
on the motility and polarization of macrophages.
Moreover, PIK3CA mutations in exon-20 and exon-9 kinase regions, which
were the major type of PIK3CA mutations in our data set, have previously
been shown to associate with up-regulation of phosphorylated Akt (p-Akt) ex-
pression (Sonnenblick A, 2019). Increased Akt activation leads to the reduction
of macrophage polarization (Vergadi E, 2017). The overexpression of PIK3CA
could also result in the elevation of macrophage infiltration (Xie S, 2014).
Therefore, I postulated that the mutations of PIK3CA may contribute to the
over-abundance of unpolarized M0 macrophage. This hypothesis was further
supported by other work, which suggested that the upregulation of PIK3CA
might contribute to the suppression of pro-inflammatory cytokines, and thus
decrease the polarization to pro-inflammatory M1 macrophage (Xie S, 2014;
23Viola A, 2019), which could lead to an over-abundance of M0 macrophage.
As shown in Figure 3.5 (b), the M0 macrophage infiltration of TP53mt/mt pa-
tients with PIK3CA mutation was higher than both TP53wt/wt patients and
TP53mt/mt patients with wild type PIK3CA.
I also observed a relatively lower PIK3CA mutation frequency, (9.09% (7/77)
in the TP53mt/null group compared to 19.1% (17/89) in the TP53mt/mt group
and 29.3% (12/41) in the TP53mt/mt group with a high M0 abundance. This
difference may also count as an explanation for the poorer clinical outcome of
TP53mt/mt group. Again, the enhancement of PIK3CA mutation frequency in
the TP53mt/mt group with higher M0 abundance (19.1% to 29.3%) suggested
the correlation of PIK3CA mutation and the suppression of macrophage polar-
ization.
24Chapter 4
Discussion and Conclusion
HPV- HNSCC patients with homozygous TP53 mutation observed to have
poorer survival and immunosuppressive TME
HNSCC tumors are among the most highly immune-infiltrated cancer types,
and present an urgent challenge to identify more effective treatments. In-
creased TP53 mutations are presented among HPV- cases compared to HPV+.
These HPV- cases also exhibit poorer clinical outcomes and more immunosup-
pressive tumor microenvironment (TME). Characterization of HPV- HNSCC
patients based upon TP53 mutation types could be used to identify patients
with poorer survival outcomes, and identify the major down-regulated im-
mune pathways among these patients. In particular, patients with homozy-
gous TP53 mutation, TP53mt/mt , exhibited poorer survival and more unfavor-
able immune infiltrate pattern: lower T follicular helper (Tfh) cell infiltrates
and higher ratio of M0 macrophages over aggregated lymphocytes, which I
used M0 macrophage infiltrate as a substitute. These two immune cell infil-
trates, Tfh cells and M0 macrophages, were found to be correlated with poorer
25patient survival. These aspects may together explain for the immunosuppres-
sive TME of TP53mt/mt , at least partially. The higher M0/Lym ratio and M0
macrophage infiltrates, as well as lower CD8 T cells and tumor-suppressing
M1 macrophages, were also observed in TP53mt/null patients, establishing the
similar unfavorable TME as TP53mt/mt patients.
Besides implying the lack of ability to polarize, high M0 macrophages could
also be damaging to patients for their potential M2-like property as previous
studies stated (Orekhov AN, 2019; Kumar AT, 2019; Jairath NK, 2020). Such
anti-inflammatory trait of M0 macrophages could be detrimental to patients,
when M2 macrophages infiltrates did not vary significantly among HPV- HN-
SCC groups with different TP53 status. Low Tfh cell infiltrates would directly
impact the maturation, activation and survival of B cells and therefore im-
pact the anti-tumor immunity (S., 2014). Within patients with homozygous
TP53 mutation, those with co-occurrence of PIK3CA mutations in exon-9 and
exon-20 kinase regions tended to have an exaggerated undesirable survival
status. Studies have shown that PIK3CA mutations in these two kinase regions
would lead to the increased phosphorylated Akt (p-Akt), which could inhibit
the polarization of M0 macrophages to M1 macrophages (Vergadi E, 2017;
Sonnenblick A, 2019). I noticed that these patients exhibited higher abundance
of unpolarized M0 macrophages and significantly higher M0/Lym ratio, even
compared to TP53mt/mt patients with wild type PIK3CA (Mann-Whitney U
test, p-value =0.035).
26The altered TME of TP53mt/mt patients could be impacted by the down-
regulation of immune-related pathways and TP53 mutation
Several pathways among the most downregulated pathways of TP53mt/mt pa-
tients could correlate with the unfavorable TME: NF-kB and MAPK activation,
IL-10 synthesis and B cell receptor (BCR) signaling. While the downregu-
lation of NF-kB and MAPK activation, and IL-10 synthesis would reduce
macrophage activation and polarization, suppressed BCR signaling and reg-
ulation might result from the decreased Tfh cell infiltrates. These impacted
pathways may also associate with TP53 mutations. Studies have suggested
that TP53 is involved in the activation and signaling of MAPK as a upstream
regulator (GS., 2004; Gulati AP, 2006; Brown L, 2006). Dysfunctional TP53
would potentially lead to the opposite direction and therefore result in the
downregulation of MAPK activation. TP53 would promote the synthesis
and secretion of IL-10, which may count for the decrease of IL-10 synthe-
sis in the TP53mt/mt group (Bueter M, 2006; Huang YH, 2020). Since nor-
mally functioned TP53 induces the differentiation of M0 macrophages to
pro-inflammatory M1 macrophages (Blagih J, 2020), mutant TP53 would also
inhibit the polarization towards this direction. The significantly decreased ex-
pressions of TP53 directly induced proteins, such as PIG11 and PIG3, together
indicated that mutant TP53 in TP53mt/mt patients was malfunctioned.
However, most studies suggested that TP53 inhibits NF-kB activation (Liu G,
2009; Murphy SH, 2011) and mutant TP53 enhances the duration of NF-kB
activation (Vaughan CA, 2012), indicating that there might be other causes for
27the downregulation of NF-kB activation in the TP53mt/mt group. A potential
cause might be the pathway interaction of NF-kB, MAPK and FCERI signal-
ing (Zhang X, 2020; Schulze-Osthoff K, 1997). GSEA analysis also revealed
the difference of the most downregulated pathways in TP53mt/mt patients
and TP53mt/null patients. Instead of MAPK activation, BCR signaling and
IL-10 synthesis, TP53mt/null patients were identified with reduced IFN-y re-
sponse, and T cell receptor (TCR) and IFN signaling. The downregulation of
these pathways could contribute to the high M0 macrophage infiltration of
TP53mt/null patients. Recent studies suggested the involvement of interferon,
including IFN-y in macrophage activation (Pascarella A, 2021; Huangfu N,
2020). While downregulation of TCR-related pathways, for example, TCR
signaling and phosphorylation of CD3 and TCR zeta chain, were significant
markers for dysfunctional T cells and immunosuppressive TME, such down-
regulation might associate with the increased abundance of M0 macrophage
infiltration (Sikora J, 2004; Ezernitchi AV, 2006). I also observed enhanced ex-
pression of TP53-induced protein in TP53 in TP53mt/null patients, suggesting
the possibility that TP53 in TP53mt/null patients could bear more "normally
functioned" TP53 or TP53 substitute compared to TP53 in TP53mt/mt patients.
A limited portion of tumor site RNA seq data from GDC portal were paired
with corresponding normal tissue RNA seq data: 7 TP53wt/wt patients, 4
TP53wt/mt patients, 16 TP53mt/mt patients and 7 TP53mt/null patients. Due
to the incomplete sample space, it was hard to draw conclusion from these
data. However, gene expression analysis might provide a hint of possible
gene activity alterations in tumor sites compared to normal tissues of patients
28with different TP53 mutation status. No significantly altered pathways were
observed in the TP53wt/mt group. Several cell-cycle related pathways were
found to be enhanced in this group, such as G2M checkpoint, mitotic G1
phase and G1/S transition, E2F targets and DNA synthesis, while no typ-
ical downregulated pathways detected in TP53wt/wt patients (Kent, 2019).
Similarly, there were no noticeable pathway downregulation in TP53mt/null
group. However, I observed that almost all downregulated pathways found in
TP53mt/mt patients relative to TP53wt/wt patients were significantly enriched in
the TP53mt/mt group, tumor site compared to normal tissue: FCERI-mediated
NF-kB and MAPK activation, IL-10 synthesis and BCR signaling. Again, con-
sidering the small sample size (4 patients), the observation could only serve
as a reference, at most. Besides the hyperactivation of cell cycle modulating
pathways, TP53mt/mt patients also showed remarkable upregulation of epithe-
lial mesenchymal transition (EMT) related pathways, for example, epithelial
mesenchymal transition and extracellular matrix proteoglycans. EMT is an
essential step for tumor metastasis (Scott LE, 2019). Such upregulation in
TP53mt/mt patients could aggregate tumor progression and make patients
more vulnerable, for high enrichment of EMT relevant pathways were not
observed in patients from other groups.
The limitation and possible future direction of this study
This study could be limited, with multiple possible aspects for further in-
vestigation. It basically is a re-analysis of existing data and most of the data
originated from bulk RNA and DNA sequencing data. The application of
29bulk sequencing data alone would possibly affect the accuracy and specificity,
compared to single cell sequencing data. Moreover, gene expression data
generated from RNA seq count do not necessarily represent the actual protein
expression level, and protein level might not equal to functioning protein
level. For example, the phosphorylation of Akt is required for activation and
downstream signaling (Sonnenblick A, 2019). However, whether proteins are
phosphorylated or not could not be induced from RNA sequencing data. An-
other aspect of this study which is worth noticing is that cell infiltration values
used were direct output of CIBERSORT (Newman et al., 2015), which was
the relative abundance in the context of leukocytes (Thorsson V, 2019). Upon
consideration of the complicated gene and pathway interactions in immune
system, the immunosuppressive TME and altered pathways are unlikely to
have only a single cause. For example, the high M0 macrophage infiltration
could be affected by pathways other than NF-kB and MAPK activation, etc.
Without supportive evidence from wet lab experiments, it is also hard to
identify TP53 mutation as the major cause of the downregulation of these
pathways.
Through the GSEA and DEG analysis, I was able to observe the differences
in major downregulated pathways and the expressions of TP53-dependent
tumor suppressor genes in the TP53mt/mt group and the TP53mt/null group.
However, further investigation is needed to fully unravel the intrinsic dis-
tinction of TP53mt/mt patients compared to TP53mt/null patients. TP53mt/null
patients have a similar TME as TP53mt/mt patients and even more significantly
deferentially expressed gene sets when compared to wild type TP53 patients
30(4745 genes for the TP53mt/mt group; 7760 genes for the TP53mt/null group,
DESeq2 output). However, TP53mt/mt patients are the group with unfavorable
survival, whereas the TP53mt/null patients shared a similar survival curve with
wild type TP53 patient in disease-specific survival analysis (Figure 3.1 (b)). The
previous section mentioned that signatures for M2 macrophages could also be
observed in M0 macrophages. Considering that polarized macrophages could
be categorized into several subtypes: M2a, M2b, M2c and M2d (Viola A, 2019),
it could also be possible to identify a specific subtype of M0 macrophages,
probably with M2-like characteristic, which could be more anti-inflammatory
and contribute to tumor progression. If such situation exists, it might be
an explanation for the different survival status of TP53mt/mt and TP53mt/null
patients, given their similar higher overall M0 macrophages.
Though this study focused on HPV- HNSCC, TP53 mutations are prevalent
in other cancer types, and so these findings may be more broadly applica-
ble. Preliminary work has shown promise in the application of particular
immunotherapeutic approaches. I hope that these insights can be used to
improve survival outcomes among these more vulnerable patients.
31References
Johnson D.E., Burtness B. Leemans C.R. et al. (2020). “Head and neck squa-
mous cell carcinoma.” In: Nat Rev Dis Primers. 6.1, p. 92.
Network, Cancer Genome Atlas (2015). “Comprehensive genomic characteri-
zation of head and neck squamous cell carcinomas.” In: Nature. 517.7536,
pp. 576–582.
Partridge M Costea DE, Huang X. (2007). “The changing face of p53 in head
and neck cancer.” In: Int J Oral Maxillofac Surg. 36.12, pp. 1123–1138.
Rodriguez-Ramirez C, Nör JE. (2018). “p53 and Cell Fate: Sensitizing Head
and Neck Cancer Stem Cells to Chemotherapy.” In: Crit Rev Oncog. 23.3-4,
pp. 173–187.
Muller, Patricia A J and Karen H Vousden. (2014). “Mutant p53 in cancer: new
functions and therapeutic opportunities.” In: Cancer cell. 25.3, pp. 304–317.
Zhou G Liu Z, Myers (2016). “TP53 Mutations in Head and Neck Squamous
Cell Carcinoma and Their Impact on Disease Progression and Treatment
Response.” In: J Cell Biochem JN. 117.12, pp. 2682–2692.
Li L Li M, Wang X. (2020). “Cancer type-dependent correlations between TP53
mutations and antitumor immunity.” In: DNA Repair (Amst). 88.102785,
pp. –.
B., Arneth (2019). “Tumor Microenvironment.” In: Medicina (Kaunas). 56.1,
p. 15.
Hollern DP Xu N, Thennavan A Glodowski C Garcia-Recio S Mott KR He X
Garay JP Carey-Ewend K Marron D-Ford J Liu S Vick SC Martin M Parker
JS Vincent BG Serody JS Perou CM. (2019). “B Cells and T Follicular Helper
Cells Mediate Response to Checkpoint Inhibitors in High Mutation Burden
Mouse Models of Breast Cancer.” In: Cell. 179.5, pp. 1191–1206.
Wu T, Dai Y. (2017). “Tumor microenvironment and therapeutic response.” In:
Cancer Lett. 387.1, pp. 61–68.
Carrick JB, Begg AP. (2008). “Peripheral blood leukocytes.” In: Vet Clin North
Am Equine Pract. 24.2, pp. 239–259.
32Orekhov AN Orekhova VA, Nikiforov NG Myasoedova VA Grechko AV
Romanenko EB Zhang D Chistiakov DA. (2019). “Monocyte differentiation
and macrophage polarization.” In: Vessel Plus 3.1, p. 10.
Viola A Munari F, Sánchez-Rodríguez R Scolaro T Castegna A. (2019). “The
Metabolic Signature of Macrophage Responses.” In: Front Immunol. 10.1,
p. 1462.
Kishton RJ Sukumar M, Restifo NP. (2017). “Metabolic Regulation of T Cell
Longevity and Function in Tumor Immunotherapy.” In: Cell Metab. 26.1,
pp. 94–6109.
Kennedy R, Klein U. (2019). “A T Cell-B Cell Tumor-Suppressive Axis in the
Germinal Center.” In: Immunity. 51.2, pp. 204–206.
Cyster JG, Allen CDC. (2019). “B Cell Responses: Cell Interaction Dynamics
and Decisions.” In: Cell. 177.3, pp. 524–6560.
Tokunaga R Naseem M, Lo JH Battaglin F Soni S Puccini A Berger MD Zhang
W Baba H-Lenz HJ. (2019). “B cell and B cell-related pathways for novel
cancer treatments.” In: Cancer Treat Rev. 73.1, pp. 10–19.
Rothenberger NJ Somasundaram A, Stabile LP. (2018). “The Role of the Es-
trogen Pathway in the Tumor Microenvironment.” In: Int J Mol Sci. 19.2,
p. 611.
Tomczak K Czerwińska P, Wiznerowicz M. (2015). “The Cancer Genome Atlas
(TCGA): an immeasurable source of knowledge.” In: Contemp Oncol (Pozn).
19.1A, A68–A77.
Thorsson V Gibbs DL, Brown SD Wolf D Bortone DS Ou Yang TH Porta-Pardo
E Gao GF-Plaisier CL Eddy JA-Ziv E Culhane AC Paull EO Sivakumar
IKA Gentles AJ Malhotra R Farshidfar F Colaprico A Parker JS Mose LE
Vo NS Liu J Liu Y Rader J Dhankani V Reynolds SM Bowlby R Califano A
Cherniack AD Anastassiou D Bedognetti D Mokrab Y Newman AM Rao A
Chen K Krasnitz A Hu H Malta TM Noushmehr H Pedamallu CS Bullman
S-Ojesina AI Lamb A Zhou W Shen H Choueiri TK Weinstein JN Guinney J
Saltz J Holt RA Rabkin CS; Cancer Genome Atlas Research Network Lazar
AJ Serody JS Demicco EG Disis ML Vincent BG Shmulevich I. (2019). “The
Immune Landscape of Cancer.” In: Immunity. 51.2, pp. 411–412.
Ellrott K Bailey MH, Saksena G Covington KR Kandoth C Stewart C Hess
J-Ma S Chiotti KE-McLellan M Sofia HJ-Hutter C Getz G Wheeler D Ding L.
(2018). “Scalable Open Science Approach for Mutation Calling of Tumor
Exomes Using Multiple Genomic Pipelines.” In: Cell Syst. 6.3, pp. 271–281.
Mermel, Craig H., Steven E. Schumacher, Barbara Hill, Matthew L. Meyerson,
Rameen Beroukhim, and Gad. Getz (2011). “GISTIC2.0 facilitates sensitive
33and confident localization of the targets of focal somatic copy-number
alteration in human cancers.” In: Genome Biology. 12.4, R41.
Gao, Jianjiong, Bülent Arman Aksoy, Ugur Dogrusoz, Gideon Dresdner, Ben-
jamin Gross, S. Onur Sumer, Yichao Sun, Anders Jacobsen, Rileen Sinha,
Erik Larsson, Ethan Cerami, Chris Sander, and Nikolaus Schultz (2013).
“Integrative Analysis of Complex Cancer Genomics and Clinical Profiles
Using the cBioPortal.” In: Science Signaling. 6.269, pl1.
Donehower LA Soussi T, Korkut A Liu Y Schultz A Cardenas M Li X-Babur
O Hsu TK-Lichtarge O Weinstein JN-Akbani R Wheeler DA. (2019). “In-
tegrated Analysis of TP53 Gene and Pathway Alterations in The Cancer
Genome Atlas.” In: Cell Rep. 28.5, pp. 1370–1384.
Newman, Aaron M, Chih Long Liu, Michael R Green, Andrew J Gentles,
Weiguo Feng, Yue Xu, Chuong D Hoang, Maximilian Diehn, and Ash A.
Alizadeh (2015). “Robust enumeration of cell subsets from tissue expres-
sion profiles”. In: Nature Methods. 12.5, pp. 453–457.
Grossman Robert L., Heath Allison P. Ferretti Vincent Varmus Harold E. Lowy
Douglas R.-Kibbe Warren A. Staudt-Louis M. (2016). “Toward a Shared
Vision for Cancer Genomic Data.” In: New England Journal of Medicine.
375.12, pp. 1109–1112.
Frankish A Diekhans M, Ferreira AM Johnson R Jungreis I Loveland J Mudge
JM-Sisu C Wright J-Armstrong J Barnes I-Berry A Bignell A Carbonell
Sala S Chrast J Cunningham F Di Domenico T Donaldson S Fiddes IT
García Girón C Gonzalez JM Grego T Hardy M Hourlier T Hunt T Izuogu
OG Lagarde J Martin FJ Martínez L Mohanan S Muir P Navarro FCP
Parker A Pei B Pozo F Ruffier M Schmitt BM Stapleton E Suner MM
Sycheva I Uszczynska-Ratajczak B Xu J Yates A Zerbino D Zhang Y Aken B
Choudhary JS Gerstein M Guigó R Hubbard TJP Kellis M Paten B Reymond
A Tress ML Flicek P. (2019). “GENCODE reference annotation for the
human and mouse genomes.” In: Nucleic Acids Res. 47.D1, pp. D766–D773.
Love MI Huber W, Anders S. (2014). “Moderated estimation of fold change
and dispersion for RNA-seq data with DESeq2.” In: Genome Biol. 15.12,
p. 550.
Subramanian A Tamayo P, Mootha VK Mukherjee S Ebert BL Gillette MA
Paulovich A-Pomeroy SL Golub TR-Lander ES Mesirov JP. (2005). “Gene
set enrichment analysis: a knowledge-based approach for interpreting
genome-wide expression profiles.” In: Proc Natl Acad Sci U S A. 102.43,
pp. 15545–15550.
34Zhu A Ibrahim JG, Love MI. (2019). “Heavy-tailed prior distributions for
sequence count data: removing the noise and preserving large differences.”
In: Bioinformatics. 35.12, pp. 2084–2092.
Fabregat A Sidiropoulos K, Viteri G Forner O Marin-Garcia P Arnau V D’Eustachio
P Stein L Hermjakob H. (2017). “Reactome pathway analysis: a high-
performance in-memory approach.” In: BMC Bioinformatics. 18.1, p. 142.
Liberzon A Birger C, Thorvaldsdóttir H Ghandi M Mesirov JP Tamayo P.
(2015). “The Molecular Signatures Database (MSigDB) hallmark gene set
collection.” In: Cell Syst. 1.6, pp. 417–425.
Masica DL, Karchin R. (2011). “Correlation of somatic mutation and expres-
sion identifies genes important in human glioblastoma progression and
survival.” In: Cancer Res. 71.13, pp. 4550–4561.
Yang L Huang Y, Zhou L Dai Y Hu G. (2019). “High pretreatment neutrophil-
to-lymphocyte ratio as a predictor of poor survival prognosis in head and
neck squamous cell carcinoma: Systematic review and meta-analysis.” In:
Head Neck.. 41.5, pp. 1525–1535.
Lin Y Xu J, Lan H. (2019). “Tumor-associated macrophages in tumor metastasis:
biological roles and clinical therapeutic applications.” In: J Hematol Oncol.
12.1, p. 76.
Wondergem NE Nauta IH, Muijlwijk T Leemans CR van de Ven R. (2020). “The
Immune Microenvironment in Head and Neck Squamous Cell Carcinoma:
on Subsets and Subsites.” In: Curr Oncol Rep. 22.8, p. 81.
Gu-Trantien C Loi S, Garaud S Equeter C Libin M de Wind A Ravoet M Le
Buanec H Sibille C Manfouo-Foutsop G Veys I Haibe-Kains B Singhal SK
Michiels S Rothé F Salgado R Duvillier H Ignatiadis M Desmedt C Bron D
Larsimont D Piccart M Sotiriou C Willard-Gallo K. (2013). “CD4 follicular
helper T cell infiltration predicts breast cancer survival.” In: J Clin Invest.
123.7, pp. 2873–2892.
Lechner A Schlößer HA, Thelen M Wennhold K Rothschild SI Gilles R Quaas
A Siefer OG Huebbers CU Cukuroglu E Göke J-Hillmer A Gathof B Meyer
MF Klussmann JP Shimabukuro-Vornhagen A Theurich S Beutner D von
Bergwelt-Baildon M. (2019). “Tumor-associated B cells and humoral im-
mune response in head and neck squamous cell carcinoma.” In: Oncoim-
munology. 8.3, p. 1535293.
Hu RJ Ma JY, Hu G. (2018). “Lymphocyte-to-monocyte ratio in pancreatic
cancer: Prognostic significance and meta-analysis.” In: Clin Chim Acta.
481.1, pp. 142–146.
35Yang YT Jiang JH, Yang HJ Wu ZJ Xiao ZM Xiang BD. (2018). “The lymphocyte-
to-monocyte ratio is a superior predictor of overall survival compared to
established biomarkers in HCC patients undergoing liver resection.” In:
Sci Rep. 8.1, p. 2535.
Jairath NK Farha MW, Jairath R Harms PW Tsoi LC Tejasvi T. (2020). “Prognos-
tic value of intratumoral lymphocyte-to-monocyte ratio and M0 macrophage
enrichment in tumor immune microenvironment of melanoma.” In: Melanoma
Manag. 7.4, MMT51.
Padoan A Plebani M, Basso D. (2019). “Inflammation and Pancreatic Cancer:
Focus on Metabolism, Cytokines, and Immunity.” In: Int J Mol Sci. 20.3,
p. 676.
Choo YW Kang M, Kim HY Han J Kang S Lee JR Jeong GJ Kwon SP Song SY Go
S Jung M-Hong J Kim BS. (2018). “M1 Macrophage-Derived Nanovesicles
Potentiate the Anticancer Efficacy of Immune Checkpoint Inhibitors.” In:
ACS Nano. 12.9, pp. 8977–8993.
Xiao T Xu Z, Zhang H Geng J Qiao Y Liang Y Yu Y Dong Q Suo G. 2019
Jun;52(6):379-384. (2019). “TP53I11 suppresses epithelial-mesenchymal
transition and metastasis of breast cancer cells.” In: BMB Rep. 52.6, pp. 379–
384.
Wang Y Liu X, Liu G Wang X Hu R Liang X. (2018). “PIG11 over-expression
predicts good prognosis and induces HepG2 cell apoptosis via reactive oxy-
gen species-dependent mitochondrial pathway.” In: Biomed Pharmacother.
108.1, pp. 435–442.
Liu XM Xiong XF, Song Y Tang RJ Liang XQ Cao EH. (2009). “Possible roles
of a tumor suppressor gene PIG11 in hepatocarcinogenesis and As2O3-
induced apoptosis in liver cancer cells.” In: J Gastroenterol. 44.5, pp. 460–
460.
Sun Y Zuo Z, Kuang Y. (2020). “An Emerging Target in the Battle against
Osteoarthritis: Macrophage Polarization.” In: Int J Mol Sci. 21.22, p. 8513.
Nie Y Wang Z, Chai G Xiong Y Li B Zhang H Xin R Qian X Tang Z Wu J-
Zhao P. (2019). “Dehydrocostus Lactone Suppresses LPS-induced Acute
Lung Injury and Macrophage Activation through NF-B Signaling Pathway
Mediated by p38 MAPK and Akt.” In: Molecules. 24.8, p. 1510.
Park JI Song KH, Jung SY Ahn J Hwang SG Kim J Kim EH Song JY. (2019).
“Tumor-Treating Fields Induce RAW264.7 Macrophage Activation Via NK-
B/MAPK Signaling Pathways.” In: Technol Cancer Res Treat. 18.1, pp. –.
36You can also read