Modeling molecular development of breast cancer in canine mammary tumors
←
→
Page content transcription
If your browser does not render page correctly, please read the page content below
Downloaded from genome.cshlp.org on February 17, 2021 - Published by Cold Spring Harbor Laboratory Press

Resource

Modeling molecular development of breast cancer
in canine mammary tumors
Kiley Graim,1,2 Dmitriy Gorenshteyn,2,3 David G. Robinson,2,3 Nicholas J. Carriero,1
James A. Cahill,4 Rumela Chakrabarti,5 Michael H. Goldschmidt,6 Amy C. Durham,6
Julien Funk,1 John D. Storey,2,7 Vessela N. Kristensen,8 Chandra L. Theesfeld,2
Karin U. Sorenmo,5 and Olga G. Troyanskaya1,2,9
1
 Flatiron Institute, Simons Foundation, New York, New York 10010, USA; 2Lewis-Sigler Institute for Integrative Genomics, Princeton
University, Princeton, New Jersey 08544, USA; 3Graduate Program in Quantitative and Computational Biology, Princeton University,
Princeton, New Jersey 08544, USA; 4Laboratory of the Neurogenetics of Language, Rockefeller University, New York, New York
10065, USA; 5Department of Biomedical Sciences and the Penn Vet Cancer Center, School of Veterinary Medicine, University of
Pennsylvania, Philadelphia, Pennsylvania 19104, USA; 6Department of Pathobiology, School of Veterinary Medicine, University of
Pennsylvania, Philadelphia, Pennsylvania 19104, USA; 7Center for Statistics and Machine Learning, Princeton University, Princeton,
New Jersey 08544, USA; 8Department of Cancer Genetics, Institute for Cancer Research, Oslo University Hospital Radiumhospitalet,
0310 Oslo, Norway; 9Department of Computer Science, Princeton University, Princeton, New Jersey 08544, USA

        Understanding the changes in diverse molecular pathways underlying the development of breast tumors is critical for im-
        proving diagnosis, treatment, and drug development. Here, we used RNA-profiling of canine mammary tumors (CMTs)
        coupled with a robust analysis framework to model molecular changes in human breast cancer. Our study leveraged a
        key advantage of the canine model, the frequent presence of multiple naturally occurring tumors at diagnosis, thus provid-
        ing samples spanning normal tissue and benign and malignant tumors from each patient. We showed human breast cancer
        signals, at both expression and mutation level, are evident in CMTs. Profiling multiple tumors per patient enabled by the
        CMT model allowed us to resolve statistically robust transcription patterns and biological pathways specific to malignant
        tumors versus those arising in benign tumors or shared with normal tissues. We showed that multiple histological samples
        per patient is necessary to effectively capture these progression-related signatures, and that carcinoma-specific signatures
        are predictive of survival for human breast cancer patients. To catalyze and support similar analyses and use of the
        CMT model by other biomedical researchers, we provide FREYA, a robust data processing pipeline and statistical analyses
        framework.
        [Supplemental material is available for this article.]

Although there has been extensive progress in the field of breast                   Weinberg 2003; Boone et al. 2015), which alters the tumor dynam-
cancer research, our understanding of the process of tumorigenesis                  ics (Ben-David et al. 2017).
remains incomplete (Bombonati and Sgroi 2011; Karagiannis et al.                          Canine mammary tumor (CMT) is a promising emerging
2017; Yates et al. 2017; Harbeck et al. 2019). Studies of tumor pro-                model for studying naturally occurring breast tumors
gression in humans generally rely on disparate patient samples,                     (Klopfleisch et al. 2011; Pinho et al. 2012; Liu et al. 2014). CMTs
with inter-individual genetic variability obscuring the molecular                   and human breast cancer (BRCA) have similar histopathological
progression signal (Crawford and Oleksiak 2007; Storey et al.                       profiles, including incidence rates, relationship with age and
2007; Hughes et al. 2015). In vitro approaches using human cell                     body mass index, hormonal influence, and clinical presentation
lines have been used to control for this sample heterogeneity; how-                 as shown in many clinical and smaller scale studies (Paoloni and
ever, they are not fully reflective of in vivo tumor progression, in-               Khanna 2008; Rowell et al. 2011; Cekanova and Rathore 2014;
cluding the effects of the microenvironment and the immune                          Kol et al. 2015; Kristiansen et al. 2016). Canine simple carcinomas
system (Stein et al. 2004; Gillet et al. 2011). The (in vivo) murine                share especially strong similarities with human breast cancer in
model of breast cancer has proven very useful in deciphering can-                   terms of both histological and genetic features (Liu et al. 2014).
cer mechanisms; however, it requires experimental modification                      Additionally, BRCA and CMT share chromosomal abnormalities
of the host via genetic modification (transgenic mice) or the trans-                such as copy number variations in several key breast cancer marker
plantation of foreign tissue (xenografts) (Rangarajan and                           genes like MYC and PTEN (Borge et al. 2015). A significant advan-
                                                                                    tage of the canine model is the high incidence of multiple natural-
                                                                                    ly occurring tumors in the same patient (Sorenmo et al. 2009),
                                                                                    which are rarely possible to biopsy in humans but common in
Corresponding authors: ogt@cs.princeton.edu,
karins@vet.upenn.edu, chandrat@princeton.edu
Article published online before print. Article, supplemental material, and publi-   © 2021 Graim et al. This article, published in Genome Research, is available un-
cation date are at http://www.genome.org/cgi/doi/10.1101/gr.256388.119.             der a Creative Commons License (Attribution-NonCommercial 4.0 Internation-
Freely available online through the Genome Research Open Access option.             al), as described at http://creativecommons.org/licenses/by-nc/4.0/.

31:1–11 Published by Cold Spring Harbor Laboratory Press; ISSN 1088-9051/21; www.genome.org                                       Genome Research                1
                                                                                                                                     www.genome.org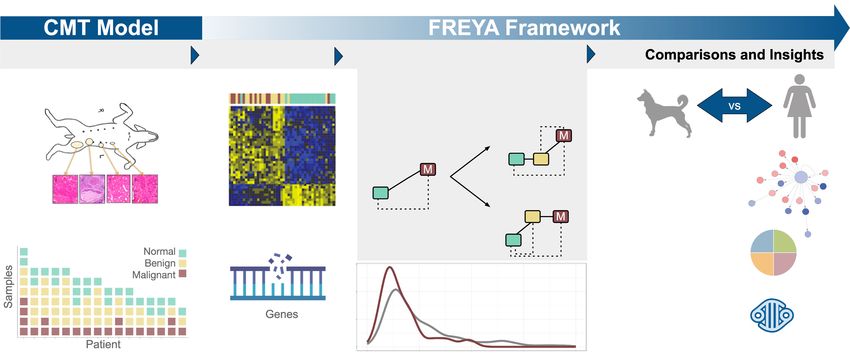
Downloaded from genome.cshlp.org on February 17, 2021 - Published by Cold Spring Harbor Laboratory Press
Graim et al.
canines because they have five pairs of mammary glands and often that inform our understanding of tumor development and treat-
limited clinical monitoring. Thus, it is possible to design studies ment in both humans and dogs.
that overcome the effect of inter-individual genetic variability by
assaying multiple naturally occurring tumor samples from a single
patient, something that is rarely possible to biopsy in humans Results
(Toole et al. 2014). As such, the canine model provides a powerful To study the development of tumors from normal tissue to carci-
complement to both laboratory mice and clinical human studies noma, we collected 89 mammary tissue samples (26 normal, 41
in studying breast cancer in vivo. Furthermore, discoveries with benign, 22 malignant) from 16 dogs of diverse breeds being treated
therapeutic potential made in CMTs can lead to rapid translational through the Penn Vet Shelter Canine Mammary Tumor Program
and clinical studies (LeBlanc et al. 2016). (Methods; Fig. 1). The multiple independent primary tumors typ-
In this study, we map the molecular signals underlying the ical of CMT (required in this study design) present a unique win-
similarities and differences between normal tissue and benign dow into tumor progression (Supplemental Fig. S1A). The
and malignant tumors. We find that the molecular signals in presence of multiple independent lesions at different stages in
CMTs broadly reflect molecular changes in human breast cancer, the same individual (independence determined via systematic
including PAM50 molecular subtypes of clinical significance, analysis of tumor mutational profiles with phylogenetic analysis)
and genetic cancer signatures. We then move beyond traditional (Methods; Supplemental Fig. S1B) allows us to identify molecular
normal versus malignant comparisons to leverage the multiple signals specific to each stage of tumorigenesis. There are many
mammary tumor nature of the canine model, in which dogs can types of canine carcinoma and although on a semantic level the tu-
simultaneously present three types of samples found in canine tu- bular carcinoma may be most similar to human cancer, on the mo-
mor development: non-neoplastic mammary gland tissues (nor- lecular level these relationships are largely unexplored. To provide
mal), benign/premalignant, and malignant. We consider the the broadest analysis of carcinoma-specific signals, we included all
three types of CMT samples in each of our patients as progres- available carcinoma samples (Supplemental Table S1). Using RNA
sion-ordered groups, enabling us for the first time to identify dis- sequencing, we generated genome-wide gene expression profiles
tinct signatures of gene expression reflective of progression from (∼13,000 genes) and called somatic mutations for each sample.
normal to benign to malignant. These signatures are relevant to We developed a robust analytical framework, FREYA, to detect
human cancer biology; in TCGA and METABRIC, human breast and interpret the molecular signals in CMTs to facilitate transla-
cancers with stronger CMT carcinoma progression signature tional BRCA research (https://freya.flatironinstitute.org) (Fig. 1).
have significantly worse survival than patients with weaker carci-
noma progression signature. Throughout, our analysis is driven
by a robust statistical framework we developed for the molecular Molecular and cancer subtype similarities between canine
analysis of CMT -omic data, including a turn-key computational and human tumors
analytic pipeline, FRamework for Expression analYsis Across spe- As a first step, we assessed global cancer signals in malignant CMTs
cies (FREYA), tailored to dog and dog–human cancer comparisons compared to normal tissue by identifying differentially expressed
that we make available to all researchers to promote naturally oc- genes (FDR < 0.05) (Supplemental Table S2). We found that these
curring CMTs as a model for human breast cancer. Altogether, genes form four major modules in the genome-scale mammary ep-
our comprehensive genomic characterization shows that CMTs ithelial functional network, wherein connections between genes
are a powerful translational model of BRCA, providing insights reflect close interactions and participation in pathways and
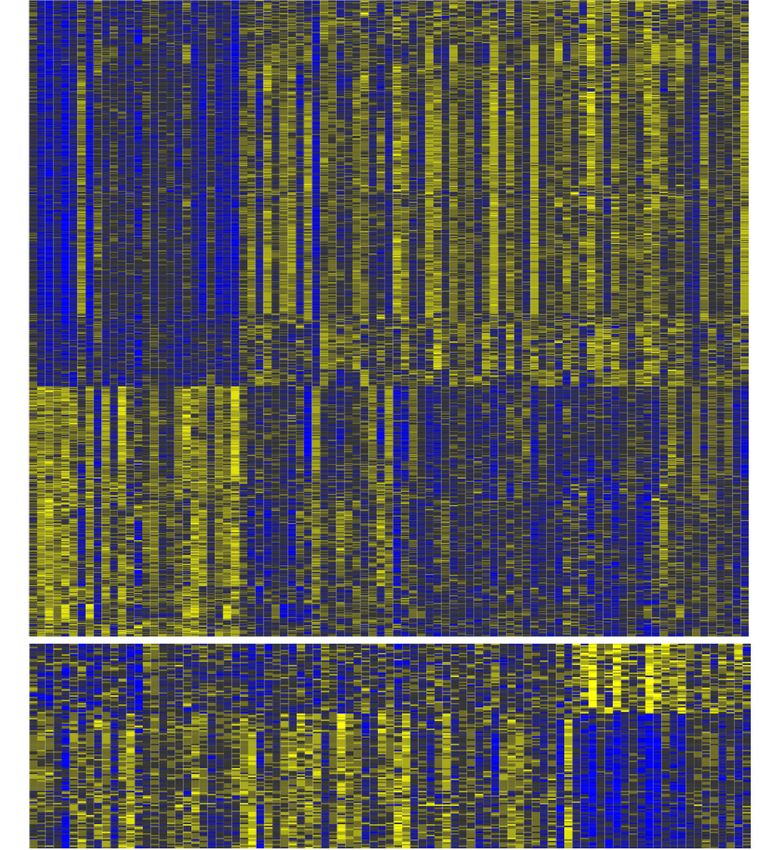
Figure 1. Multiple CMTs per patient model enables discovery of carcinoma-specific processes that inform human BRCA. (Left) CMT model. Tissue sam-
ples were collected and annotated for each of the 89 samples from 16 canine patients. For study inclusion, each patient was required to provide a minimum
of one sample (represented by colored blocks) from each histological group: normal (green), benign (yellow), and malignant (red). Many of the dogs have
multiple samples of different tumor histologies. (Right) FREYA framework. We developed the FREYA framework to study tumor development. Using FREYA,
we analyzed multiple primary tumors per patient with RNA and mutation profiling and developed a statistical framework to determine differences in gene
expression between normal, benign, and malignant samples, and we compared CMT molecular signals to human breast cancer.
2 Genome Research
www.genome.org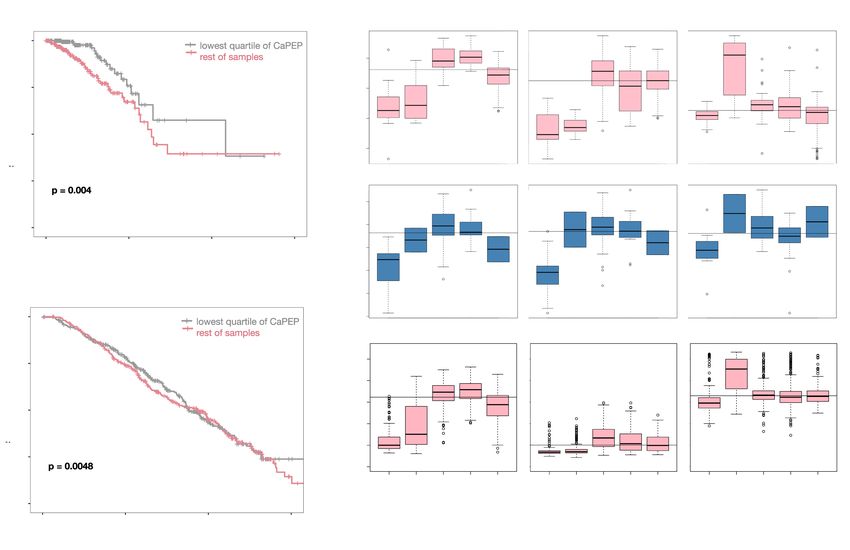
Downloaded from genome.cshlp.org on February 17, 2021 - Published by Cold Spring Harbor Laboratory Press

                                                                                       Modeling molecular development of breast cancer

processes specific to the tissue (Greene et al. 2015; Fig. 2A). These           CMT clusters are weakly correlated with their predicted PAM50
clusters are characterized by distinct enrichment signatures indi-              subtypes based on the human model (P-value = 0.047) and as
cating diverse dysregulated hallmark cancer processes (Fig. 2A), in-            well as histology (P-value = 0.024). This clustering (Supplemental
cluding DNA repair and cell cycle regulation (module 1, including               Fig. S2A) and PCA analysis (Supplemental Fig. S2B) also both point
genes such as BRCA1, BRCA2, and CDKN1A); apoptotic signaling,                   to molecular heterogeneity among the canine tumor samples of
response to hormone, immune functions, and response to stress in                similar histology, which is similar but stronger than that observed
the endoplasmic reticulum (module 2, including genes PIK3CA,                    in human samples (Sorlie et al. 2003; The Cancer Genome Atlas
FOXA1, and MAPK1); responses to hypoxia that enable tumor for-                  Network 2012). As in previous human reports (Sorlie et al. 2003),
mation including angiogenesis and cell migration (module 3, in-                 unsupervised CMT clustering does not simply recapitulate hor-
cluding genes GATA3, HIF1A, and VEGFA); and immune                              mone receptor status (Supplemental Fig. S2C), although cluster
function and hormone signaling (module 4, including ARMC6).                     three samples are enriched in Basal tumors and have low hormone
These results indicate that cancer signals in CMT are broadly sim-              receptor expression levels. Thus, these naturally occurring CMTs
ilar to common human cancer signals.                                            display cancer dysregulations resembling human cancers at both
      We next examined the representation of signals from human                 a global level of transcriptional changes (Fig. 2A) and at the level
PAM50 intrinsic molecular BRCA subtypes within CMTs (Parker                     of specific changes characteristic of clinical subtypes of breast can-
et al. 2009). Using a multinomial elastic net regression model we               cer (Fig. 2B; Supplemental Fig. S2).
trained on known human PAM50 subtype samples from TCGA,
CMT samples were predicted to be one of these types (Fig. 2B;
Supplemental Table S1). Correlations between dog and human                      Canine mammary tumors harbor human cancer–implicated
samples of the same subtype are significantly higher (P-value                   mutations
8.65 × 10−43) compared to different subtypes, showing that dog is               To date, only targeted small-scale sequencing studies have exam-
reflective of the human intrinsic subtypes. Following the same                  ined CMT mutations. We extended our analysis of the molecular
protocols used to define PAM50 subtypes in human, we performed                  signals in CMT by analyzing the whole-transcriptome somatic mu-
unsupervised clustering of the CMT tumor samples (Methods;                      tations (Methods; Fig. 2C) in the CMT tumor samples and com-
Supplemental Fig. S2; Supplemental Table S1). Unsupervised                      pared them to human cancer mutations. For most genes, read

     A                                                                     B

     C                                                                     D

Figure 2. Cancer hallmark processes found in CMT transcriptional programs. (A) Biological processes showing differential gene expression between nor-
mal and carcinoma samples (Supplemental Table S2) were identified by network-based enrichment method at https://humanbase.flatironinstitute.org.
Differentially expressed genes were clustered using a shared nearest neighbor–based community-finding algorithm to identify distinct modules of tightly
connected genes (Krishnan et al. 2016) within the mammary epithelium functional network (Greene et al. 2015). Gene Ontology (GO) enrichment was
performed on each module, and representative significant processes are displayed (for the entire list, see Supplemental Table S3). Circles are genes and the
size of the circle indicates the sum of connections in the graph. Gene expression values (SAM scores) are overlaid. Red indicates increased expression in
carcinoma, and blue indicates decreased expression in carcinoma. COSMIC cancer census genes are indicated in each module (M1–M4). (B) Human
PAM50 intrinsic subtype signals are found in CMTs. Each bar represents the number of samples predicted for each PAM50 subtype, human or canine.
Predictions for CMT samples were based on gene expression programs using a classifier trained on human BRCA samples and PAM50 subtype gene ex-
pression signature data. In human samples, 98% were correctly predicted, reflecting the accuracy of the predictor. (C ) Density plot showing the ge-
nome-wide number of mutations per tumor sample in human (gray) and canine (maroon). (D) OncoPrint showing histology, predicted PAM50
subtype, number of mutations, and histologic subtype (simple/complex) for each sample in the cohort.

                                                                                                                             Genome Research              3
                                                                                                                                www.genome.org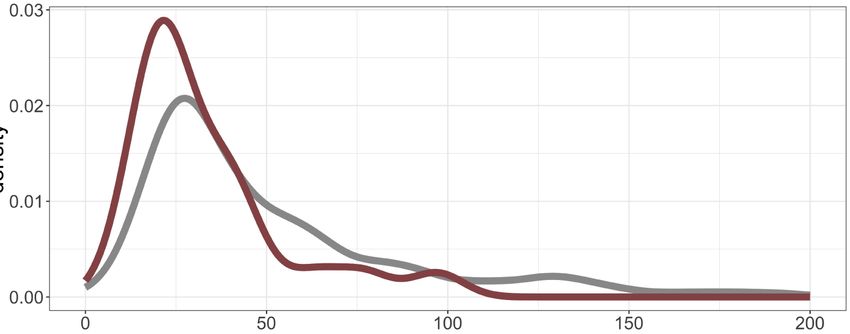
Downloaded from genome.cshlp.org on February 17, 2021 - Published by Cold Spring Harbor Laboratory Press

Graim et al.

depth was sufficient for mutation calling (Methods; Supplemental         histologic types by using both the significance of changes and di-
Fig. S3), but some mutations could be missed due to limitations of       rection of the expression change (Fig. 3). We refer to these signa-
RNA-seq-based mutation calling, including low expression levels,         tures as progression expression patterns (PEPs) (for a full list of
allele-specific expression, and intron-side splice site variants that    genes, see Supplemental Table S5).
exomes would miss.                                                             To empirically assess the advantages of the CMT-based study
      We observed 1904 mutations in 524 genes, of which 226 mu-          for detection of tumor-relevant signals, we compared this multiple
tations fall in genes belonging to the COSMIC catalog of human           tumor types per patient design to the traditional tumor versus nor-
cancer-related genes (∼600 total genes) (Tate et al. 2019). Four of      mal design by subsampling patient samples in our data set. We
the top 30 recurrently mutated genes (Supplemental Fig. S4) are          then assessed how much signal was lost in each case by assessing
COSMIC genes (B2M, CTNNB1, EML4, FGFR1), and 22 mutations                the ability of each subsampled study, with equitable sample sizes,
in these genes are SnpEff predicted high impact mutations (stop-         to identify PEPs discoverable in the full data set. PEPs identified
gain or frameshift), making them candidate driver mutations.             using three histologies were consistently able to more closely reca-
We also observed mutations in many genes involved in human               pitulate the PEPs generated with the full data set than PEPs identi-
breast cancer, including TP53, PIK3CA, NOTCH1, GATA3, FLNA,              fied using just two histological groups but the same number of
CDKN1B, and BAP1 (Supplemental Table S4; Tate et al. 2019).              samples (Wilcoxon rank-sum P-values 6.8 × 10⁻¹⁵ Tumor PEP and
The CMT mutation landscape is similar to that of human breast            1.4 × 10⁻⁸ Carcinoma PEP) (Methods; Supplemental Fig. S6).
cancer, with most tumors harboring fewer than 75 mutations               Specifically, for the carcinoma PEP, the simulation using the two
and a small subset of highly mutated tumors (Fig. 2C;                    histologies design shows no correlation with the carcinoma PEP
Supplemental Table S4; Bailey et al. 2018). Among CMTs, predict-         generated with the full data set, underlining the importance of
ed Basal tumors have significantly higher somatic SNV burden             having three stages of tumor development to discover malig-
compared to all other predicted PAM50 tumor types (P-value < 1           nant-specific processes and underscoring the power of the canine
× 10−16, Spearman’s rho) (Fig 2D), consistent with human breast          model to detect signals with smaller numbers of samples.
cancer. Overall, human cancer genes (COSMIC) are significantly
more likely to be mutated in CMT samples than noncancer genes
(P-value = 8.037 × 10⁻¹⁵), with breast cancer genes specifically en-     Resolving carcinoma-specific processes versus those altered
riched in CMT samples versus general cancer genes (P-value =             at the benign transition
7.81 × 10⁻¹²), indicating strong similarities between BRCA and           We explored processes and pathways represented in each PEP us-
CMT at the mutational level.                                             ing Gene Ontology term enrichment analysis. The Tumor PEP rep-
      Extraction of mutational signatures can indicate mutational        resents genes whose expression is changed concordantly in both
processes driving tumorigenesis. We examined the patterns of             benign tumors and malignant carcinomas, whereas the Carcino-
base substitutions in the CMTs and found, as expected, more tran-        ma PEP consists of genes whose expression is uniquely altered in
sitions than transversions across all tumors (Supplemental Fig. S5)      carcinomas, but not significantly altered in benign tumors relative
with the exception of patient 11. Six of the seven sequenced tu-         to normal tissue. Tumor PEP genes are significantly enriched for a
mors from patient 11 have more transversions, suggesting distinct        number of known human tumor–associated pathways, including
mutagenesis processes in this patient. Deamination of cytidine by        control of cell cycle transitions, DNA repair pathways, regulation
APOBEC enzymes can lead to C→T transitions; these APOBEC sig-            of MAP kinase activity, regulation of adaptive immune response,
nature mutations are significantly associated with BRCA and corre-       and mammary gland epithelial cell proliferation (Supplemental
late with increased somatic SNV burden and clinically aggressive         Table S3). The Carcinoma PEP (Fig. 3; Supplemental Table S5) is
features (Burns et al. 2013; Harris 2015; Takahashi et al. 2020).        significantly enriched for known breast cancer processes, includ-
                                                                         ing negative regulation of apoptosis, regulation of epithelial cell
                                                                         differentiation, and lipid metabolic processes (Supplemental Table
Capture and characterization of progression expression patterns          S3). Included in the Carcinoma PEP are a number of genes impli-
Despite breakthroughs in characterization of breast cancer sub-          cated in breast cancer aggression and metastasis, such as PDGFB,
types, targeted therapy development, and great strides in patient        GATA3, and SMO (Donnem et al. 2010; Benvenuto et al. 2016;
outcomes, the precise mechanisms and processes mediating inva-           Jansson et al. 2018). This suggests that although Tumor PEP genes
siveness and malignancy are not yet fully characterized                  are associated with cancer processes, Carcinoma PEP genes are as-
(Karagiannis et al. 2017; Yates et al. 2017). The presence of multiple   sociated with cancer aggression.
histologies per patient in CMTs can confer sensitivity to detect al-           The availability of multiple tumor types in CMTs presents a
tered pathways specific to malignant tumors that might not be            unique opportunity to resolve those pathways that are dysregu-
identified in paired normal/carcinoma comparisons in human.              lated between normal tissues and all tumors versus the pathways
To leverage this aspect of the canine model and discover tumor           specific to the carcinoma transition. To accomplish this, we com-
stage–specific dysregulations, we analyzed signatures specific to        pared the biological processes enriched in genes identified in the
each of the three epithelial tissue groups: normal/nonneoplastic         traditional Normal versus Carcinoma differential expression anal-
(normal, normal with atypia, duct ectasia, hyperplasia); benign          ysis (Hanahan and Weinberg 2011)—many hallmark tumor pro-
(simple adenoma and complex adenoma); and carcinoma (simple              cesses (Figs. 2A, 4) to those processes found enriched in either
carcinoma, in situ carcinoma, carcinoma in a mixed tumor). More          the Tumor or Carcinoma PEPs (Methods; Fig. 4A; Supplemental
specifically, to identify genes driving the differences between these    Table S3). We found that apoptotic processes were represented in
histologic types, we performed differential gene expression analysis     the normal-carcinoma comparison, genes involved in negative
(Methods) for each pairwise combination of histologic categories         regulation of internal apoptotic signaling were distinctly represent-
and identified genes with expression signatures that are signifi-        ed in the Carcinoma signature, and genes relating to response of
cantly different (FDR < 5%) in at least two of the paired compari-       cells to external death cues were enriched in the Tumor signature.
sons. We then systematically identified genes specific to                This could reflect that tumors in general are antagonized by the

4    Genome Research
       www.genome.org
Downloaded from genome.cshlp.org on February 17, 2021 - Published by Cold Spring Harbor Laboratory Press
Modeling molecular development of breast cancer
Figure 3. Identification of progression expression patterns. Progression expression patterns (PEPs) are identified using differential expression analysis be-
tween histological groups: (top) Tumor PEP, 1023 genes; (bottom) Carcinoma-specific PEP, 136 genes. The diagrams illustrate how each PEP pattern is de-
fined. For example, Tumor PEP includes genes up-regulated in tumors (significantly differentially expressed both between normal and benign samples and
between normal and malignant samples). The heatmap shows the expression patterns for these genes, with patterns divided into up- and down-regulated
(e.g., Tumor PEP includes 567 genes significantly up-regulated in tumors and 456 genes significantly down-regulated in tumors).
immune system, yet the more aggressive carcinomas are express- multiple canine tumor types effectively distinguishes processes
ing genes that are turning off their ability to die in response to in- linked to specific stages of tumor development and identifies path-
ternal apoptotic signaling pathways, thus contributing to ways that are unique to aggressive tumors.
malignancy (French and Tschopp 2002; Fernald and Kurokawa
2013; Ashkenazi 2015; Mantovani et al. 2019). Processes uniquely
enriched in carcinomas also included calcium signaling and ho- Carcinoma PEP signature is predictive of survival
meostasis and regulation of lipid biosynthesis, which may be in human breast cancer
linked to managing endoplasmic reticulum and membrane stress- To understand how the Carcinoma PEP (which delineates malig-
es that can drive malignancy (Urra et al. 2016). Thus, comparing nant-specific tumor signals) relates to human tumors, we
Figure 4. Resolution of cancer hallmark processes by PEPs to discern malignancy-specific processes. Genes differentially expressed between Normal and
Carcinoma samples (as in traditional gene expression analysis) show Tumor or Carcinoma-specific signatures. This experimental design stratifies tumor
processes into those specific to malignant tumors (carcinoma-specific pattern) and those that are perturbed in both benign and malignant tumors (tu-
mor-specific pattern). Five representative example GO terms from each pattern are shown (for a complete list, see Supplemental Table S3).
Genome Research 5
www.genome.orgDownloaded from genome.cshlp.org on February 17, 2021 - Published by Cold Spring Harbor Laboratory Press
Graim et al.
investigated whether this group of genes is predictive of clinical sur- es, including cell migration, cell cycle checkpoints, and apoptotic
vival in breast cancer patients. Indeed, we found that in TCGA BRCA signaling (Fig. 2A; Supplemental Table S3), and molecular sub-
and METABRIC samples, levels and direction of expression change types of human breast cancer are reflected in CMTs. In addition
of Carcinoma PEP is predictive of human survival: patients express- to showing the molecular similarities between CMT and human
ing the weakest Carcinoma PEP signature have significantly better breast cancer and providing a computational framework to facili-
outcomes (all data, Peto-Peto P = 0.0038 TCGA, and P = 0.0058 tate using CMT as an effective model for BRCA, our analysis distills
METABRIC) (Supplemental Fig. S7), and this goes beyond reflecting malignant-specific signals from overall tumor-associated signals.
PAM50 subtypes. Although PAM50 subtype and Carcinoma PEP We show that these cancer dysregulations and aggressive biology
strength correlate (e.g., most Basals have strong Carcinoma PEP sig- captured by the canine carcinoma PEP are relevant to the dysregu-
naling), there is a significant difference in survival within subtype. In lations in human breast cancer, with weakest Carcinoma PEP sig-
the most prevalent subtype, Luminals, there is a survival difference nature correlating with significantly increased patient survival.
relative to the Carcinoma PEP scores (Luminal A, TCGA P-value This information is distinct from that captured by predicted
0.004, METABRIC P-value 0.0048; Luminal B, TCGA P-value 0.004, PAM50 subtype status—the Carcinoma PEP is able to stratify sur-
METABRIC P-value 0.0048) (Fig. 5A,B). Thus, the Carcinoma PEP sig- vival within Luminal A patients, presenting an important perspec-
nature has clinical relevance in human breast cancer, underscoring tive on factors that make this prevalent breast cancer subtype more
the utility of the canine model for capturing molecular signatures as- dangerous. This underscores the potential of the CMT model for
sociated with human breast cancer. molecular studies of human breast cancer.
A critical challenge to translational studies in model organ-
isms is an effective analysis that integrates the findings with hu-
Discussion man biology. To promote comparative oncology studies that
In this study we presented a novel statistical approach for studying leverage the approach of multiple samples per patient afforded
the mechanism of tumorigenesis by leveraging the multiple natu- with CMTs, we developed and are sharing with all biomedical
rally occurring samples per patient features of the canine mamma- researchers a novel analytical framework, FREYA. FREYA is a
ry tumor model to define processes and pathways that are computational suite that enables any researcher to perform analy-
dysregulated between normal tissue, benign, and malignant tu- ses in this manuscript, from data processing to human cancer
mors. We characterize the genome-wide landscape of molecular comparison to figure generation, using either the provided CMT
signals in CMT, both at the transcriptional and mutational level, data or user-provided data. FREYA is available at https://freya
demonstrating that many hallmark human breast cancer process- .flatironinstitute.org.
A C
D
B
E
Figure 5. Dog PEP signature is predictive of survival in human breast cancer. (A,B) Kaplan-Meier plots showing patients with breast cancers bearing stron-
gest Carcinoma PEP signal have worse outcomes in two independent human breast cancer cohorts: (A) TCGA BRCA; (B) METABRIC. (C–E) Dogs, like hu-
mans, have strong hormone receptor expression signaling differences between PAM50 subtypes. Estrogen receptor 1 (ESR1), progesterone receptor (PGR),
and erb-b2 receptor tyrosine kinase 2 (ERBB2) expression within each PAM50 subtype shown: (C) TCGA BRCA; (D) this CMT data; and (E) METABRIC.
Horizontal lines across each graph indicate median receptor expression across the entire cohort.
6 Genome Research
www.genome.orgDownloaded from genome.cshlp.org on February 17, 2021 - Published by Cold Spring Harbor Laboratory Press
Modeling molecular development of breast cancer
Altogether, our study shows the relatedness of human breast was also evaluated histopathologically. A standard published clas-
cancer and canine mammary tumors at the molecular level as well sification system on canine mammary gland tumors was used to
as the utility of the CMT model for discerning signals that are ob- classify and grade all tumors/tissues by board certified Veterinary
scured in other model systems. Although our understanding of hu- Pathologists (Goldschmidt and Durham) (Goldschmidt et al.
man breast carcinogenesis remains incomplete, understanding the 2011).
progression from benign to malignant and identifying its molecu-
lar signature is key both to understand breast carcinogenesis and to Sample processing
identify targets for cancer prevention and therapy. The molecular
Tissue samples were cryo-pulverized then homogenized using a ro-
signals in CMT that we identify indicate the canine model offers tor-stator in TRIzol (Invitrogen 15596-026). The lysate was further
unique opportunities to fill gaps in our understanding of human homogenized using a Qiashredder spin column. mRNA was ex-
breast tumorigenesis and provide a comprehensive canine breast tracted using the Qiagen RNeasy Kit. The sequencing libraries
cancer model that captures the major variables—predicted were prepared at the Princeton University Genomics Core Facility
PAM50 subtypes within CMT have the characteristic hormone re- using the PrepX mRNA Library Protocol for the Apollo324 System
ceptor expression (Fig. 5C–E), hallmarks (tumor genetics, microen- (Wafergen). Sequencing was performed using the Illumina HiSeq
vironment, hormonal effect, and immune function)—and their 2000 platform. This resulted in 5.041 billion mapped reads across
interactions. In such, CMT as a model of human breast cancer pro- 89 samples, with 56 million mapped reads on average per sample.
vides a powerful complement to both human clinical and in vitro
studies as well as model organism studies (e.g., in mouse). Insights RNA-seq processing
from CMTs can be used to direct future mechanistic studies in oth-
RNA-seq reads were mapped to the CanFam3.1 genome assembly
er model systems, and the CMT model offers unique opportunities
(Ensembl release 91) (Zerbino et al. 2018) using the HISAT2 aligner
for expedited clinical trials of therapies, availability of material for
(Kim et al. 2019), after which assemblies were filtered using FastQC
isolation of breast cancer stem cells, and analyses of tumor evolu-
(https://github.com/s-andrews/FastQC). DEXSeq-Count (Anders
tion at both the level of mutations and associated transcriptional
et al. 2012; Reyes et al. 2013) was used to construct read counts
programs. for each gene in this combined transcriptome assembly. The re-
sulting counts matrix was normalized using TMM (Robinson and
Methods Oshlack 2010). We then regressed out the effect of the individual
and row-centered the resulting data to remove breed bias. This
Ethics statement was necessary because of the high heterogeneity between dog
Animal work was approved by the University of Pennsylvania breeds.
Institutional Animal Care and Use Committee (IACUC), listed as
protocol 804298, principal investigator Karin Sorenmo, and titled Variant calling and identification of somatic mutations
“Molecular Evaluation of Canine Mammary Tumors.” CMT mutations were called following the GATK Best Calling Prac-
tices for RNA-seq pipeline (https://github.com/gatk-workflows/
Experimental design gatk3-4-rnaseq-germline-snps-indels) (DePristo et al. 2011; Van
Dogs have a high incidence of multiple primary tumors, making it der Auwera et al. 2013). We made mutation calls in all genes and
possible to study mammary tumor progression without the effects the average read depth of 164-fold coverage (Supplemental Fig.
of inter-individual genetic variability. We created a pipeline to S3) surpassed the threshold for maximum mutation call confi-
map the genomic landscape of CMTs and then compared them dence as shown by Sun et al. (2017). Read depth was calculated us-
to BRCA. We showed that the multiple-diagnoses-per-patient ex- ing BEDTools coverage (BEDTools version v2.29.2) (Quinlan and
perimental design was essential for capturing progression-related Hall 2010). We further filtered the variants by comparing each var-
patterns of expression. Our analyses identified pathways and pro- iable site in the tumor sample to the normal samples from that
cesses dysregulated in CMTs parallel to those altered in BRCA. We same individual and discarded sites where tumor and normal sam-
showed that CMT mutation profiles recapitulated those seen in ples matched. In cases in which normal samples from the same in-
BRCA. CMT has the potential of being a uniquely impactful model dividual had different genotype calls, we required that tumor
integrating transcriptional and other -omics data in a model or- samples differ from all normal tissue samples to call a mutation.
ganism that can bridge mechanistic studies in mouse/rat and hu- We also excluded genotype calls with quality scores less than 40
man clinical data. and calls generated from less than fourfold coverage. Additionally,
genotype calls annotated with HIGH and INTERMEDIATE func-
tional effect scores (SnpEff) (Cingolani et al. 2012) were retained
Sample gathering
and used in downstream analyses. To compare human and CMT
Tumor samples were collected from naturally occurring mammary mutation rates, overall mutation counts for each TCGA BRCA sam-
tumors within sexually intact dogs treated through the Penn Vet ple were downloaded on June 17, 2019, from cBioPortal (https://
Shelter Canine Mammary Tumor Program. All dogs underwent www.cbioportal.org/study/summary id=brca_tcga_pan_can_atlas_
routine clinical staging (including mapping and measuring of all 2018). Because of uneven read coverage in RNA-seq data, there
tumors as well as thoracic imaging) followed by surgical removal are limitations in RNA-seq mutation calling; for example, indels
of the affected glands. All tissues were processed immediately after in low expressed genes such as tumor suppressors may not be iden-
removal. Two parallel small incisional sections were collected from tified owing to a lack of coverage in the region, so that there is not
each tumor as well as sections from visually normal mammary tis- enough data to make a high confidence call.
sue; one section was flash frozen in liquid nitrogen and stored in
−80°F freezer and the adjacent section was fixed in formalin for
routine hematoxylin and eosin staining and histopathological Phylogenetic analysis
evaluation. For mixed carcinomas, the carcinoma portion of the An identity-by-descent phylogeny with proportional branch
tumor was extracted for sequencing. In addition, the whole tumor length (Supplemental Fig. S1) was generated using SNPRelate
Genome Research 7
www.genome.orgDownloaded from genome.cshlp.org on February 17, 2021 - Published by Cold Spring Harbor Laboratory Press
Graim et al.
(Manichaikul et al. 2010) and all SNPs called by FREYA. All sam- 0.05. Specifically, classification of genes to the appropriate pattern
ples, including normals, were included in this analysis. Pairwise is determined using the following criteria:
similarity scores were calculated for all sample pairs, such that sim-
Tumor-specific: A gene differentially expressed in both the nor-
ilarity of mutations in samples a and b (ma, mb) is
mal-adenoma and the normal-carcinoma comparisons; the
ma > mb sign of the change is the same for both comparisons.
.
min (|ma |, |mb |) Carcinoma-specific: A gene differentially expressed in both the
normal-carcinoma and the adenoma-carcinoma comparisons;
Moderate and high impact mutations in named genes, called
the sign of the change is the same for both comparisons.
as described in Methods section, “Variant calling and identifica-
tion of somatic mutations,” were included in the similarity score
calculation. For each pair of tumors, the similarity score is the frac-
tion of mutations in the lesser mutated sample that are mutated in
PAM50 subtypes
both samples, creating a similarity score ranging from 0 to 1. To identify the presence of human PAM50 molecular subtypes
within the dog samples (normal, benign, and malignant), we com-
bined the expression data from 89 dog and the 981 human TCGA
Canine pairwise differential expression analysis tumor samples with PAM50 annotations, subset to the 42 PAM50
Pairwise differential expression comparisons were performed be- genes present in the dog samples (canine orthologs of some genes
tween normal and adenoma, normal and carcinoma, and adeno- are currently unknown), then removed species batch effects
ma and carcinoma samples. Differential expression testing was using SVA (https://bioconductor.org/packages/release/bioc/html/
performed using edgeR (McCarthy et al. 2012), using a negative bi- sva.html). An elastic net (R package glmnet) (Friedman et al.
nomial generalized linear model explaining expression based on 2010) was trained to predict PAM50 subtype based on the human
histology while controlling for individuals. Samples were normal- data and applied to samples for both species. Of human samples,
ized using weighted trimmed mean of M-values (TMM) (Robinson 98% were correctly predicted (in accordance with the sample label
and Oshlack 2010). Genes with more than one count per million in the TCGA data set). R version 3.6.1 (R Core Team 2019) was
in at least 30 samples were used for this analysis. False discovery used. CMT samples were predicted to be all four PAM50 subtypes
rate control was performed using the Q-value method (Storey and in similar ratios seen in humans. PAM50 subtype correlation
and Tibshirani 2003) on each comparison. statistic was calculated by calculating the Wilcoxon rank-sum
test P-value for each subtype (e.g., LumA dog samples vs. LumA hu-
man samples compared to LumA dog samples vs. non-LumA hu-
GO enrichment man samples; P-values are as follows: LumA < 2.2 × 10⁻¹⁶, HER2
We identified enriched processes in differentially expressed genes .36, BasalDownloaded from genome.cshlp.org on February 17, 2021 - Published by Cold Spring Harbor Laboratory Press
Modeling molecular development of breast cancer
Comparison to human breast cancer (BRCA) data tion is necessary; a button click within the GitHub repository will
automatically build an interactive docker image containing
RSEM normalized, log2-scaled RNA-seq data from two human
FREYA. Users have the option of passing unprocessed sequencer
breast cancer cohorts, TCGA BRCA (Hoadley et al. 2018) and
data to FREYA’s DataPrep module or providing their own prepro-
METABRIC (Pereira et al. 2016), were obtained from via
cessed data. Alternatively, we provide a version of FREYA optimized
cBioPortal (https://cbioportal.org/study/summary?id=brca_
for a cluster environment. All versions of FREYA can be run with
tcga_pan_can_ atlas_2018; and https://cbioportal.org/study/
user-provided data.
summary?id=brca_ metabric). We identified orthologs between
dog and human using BioMart (Kasprzyk 2011); only one-to-one
mappings were used for this analysis. Differential expression of Software availability
normal-malignant CMT samples was calculated on the log2 scaled Computer code underlying this statistical approach is available at
data using siggenes (https://bioconductor.org/packages/release/ https://freya.flatironinstitute.org and in Supplemental Code. To
bioc/html/siggenes.html). The list of known cancer-related genes, help with reproducibility and to encourage use of our statistical
oncogenes, and tumor suppressors was taken from COSMIC (Tate framework, we provide version information for each tool as well
et al. 2019). The representation of alternate haplotypes in hg38, as parameters settings in the README and in the automated pipe-
absent in hg19, do not affect the findings of our study. line script.
Carcinoma PEP signature in human breast cancer
Data access
To identify the significance of the PEPs in human breast cancer,
All raw and processed sequencing data generated in this study
we projected the Carcinoma PEP into TCGA BRCA and
have been submitted to the NCBI Gene Expression Omnibus
METABRIC data (see above). We first subtracted the median nor-
(GEO; https://www.ncbi.nlm.nih.gov/geo/) under accession num-
mal expression levels from the malignant gene expression values
ber GSE136197.
in each dog’s samples and used the sum of positive and negative
differences to designate each PEP gene as positive or negative (in-
creased or decreased expression, respectively). We then generated Competing interest statement
signature scores for each human sample, calculating the sum of
all PEP genes for which the gene was in the top of the human ex- The authors declare no competing interests.
pression value ranges for positive PEP genes and in the bottom
quartile for negative PEP genes. We then divided the signature
scores into four groups of equal size and applied the Peto-Peto
Acknowledgments
significance test. We thank the Princeton University Genomics Core Facility for the
We assigned each Carcinoma PEP gene g to the positive or library construction and sequencing services. We thank members
negative signature set by subtracting the median expression levels of the Sorenmo and Troyanskaya laboratories for discussions and
in normal samples (edn) from the median expression levels in ma- editorial help, in particular Rachel Sealfon. We also thank the
lignant samples (edm), within each dog d. Genes are grouped into G Flatiron Institute’s Scientific Computing Core for helping package
+ (up) and G− (down) determined by the ratio of dogs for which the analysis pipeline. Funding for this work was provided by the
the direction of change in expression from tumor to normal is pos- Puppy Up (2 Million Dogs) Foundation. The Penn Vet Shelter
itive or negative as follows: Canine Mammary Tumor Program made this work possible
⎧ through the acquisition of tumor tissues and clinical data used
⎨ 1 1
I
d[D emdg
. endg g g [ G+ in this study.
|D| 2
⎩ Author contributions: K.G., C.L.T., D.G., D.G.R., K.U.S., and
else g [ G−
O.G.T. designed the studies. K.U.S. provided the clinical care, col-
Given these groups, we then calculate Carcinoma PEP signature lected clinical data, and performed tumor tissue sampling. K.G.,
scores for each human sample, such that for each Carcinoma D.G., D.G.R., R.C., J.A.C., M.H.G., A.C.D., N.J.C., and J.F. per-
PEP gene g, the signature is considered present for that patient if formed experiments and analyses. J.D.S. contributed statistical as-
expression levels eg are in either the top or bottom quartiles (Q1, pects of the analyses. V.N.K. provided expert feedback. K.G., D.G.,
Q4), depending on the direction of the expression change in C.L.T., and O.G.T. wrote and edited the manuscript. All authors re-
CMT samples viewed and approved the manuscript.
Ie pg Q3 + Ie pg Q1
g[G+ g[G− References
such that G+ and G− are Carcinoma PEP genes that follow a posi- Anders S, Reyes A, Huber W. 2012. Detecting differential usage of exons
from RNA-seq data. Genome Res 22: 2008–2017. doi:10.1101/gr
tive or negative direction of change within the dogs. Carcinoma .133744.111
PEP signature scores were assigned to all human samples in the Ashkenazi A. 2015. Targeting the extrinsic apoptotic pathway in cancer: les-
TCGA BRCA and METABRIC cohorts and subtype analysis with sons learned and future directions. J Clin Invest 125: 487–489. doi:10
Luminal A and Luminal B samples was performed in parallel. .1172/JCI80420
Bailey MH, Tokheim C, Porta-Pardo E, Sengupta S, Bertrand D, Weerasinghe
A, Colaprico A, Wendl MC, Kim J, Reardon B, et al. 2018.
FREYA statistical framework Comprehensive characterization of cancer driver genes and mutations.
Cell 173: 371–385.e18. doi:10.1016/j.cell.2018.02.060
The FREYA framework (https://freya.flatironinstitute.org) de- Ben-David U, Ha G, Tseng YY, Greenwald NF, Oh C, Shih J, McFarland JM,
scribed here generates expression and mutation profiles from raw Wong B, Boehm JS, Beroukhim R, et al. 2017. Patient-derived xenografts
sequence data, then runs all analyses described in this manuscript undergo mouse-specific tumor evolution. Nat Genet 49: 1567–1575.
doi:10.1038/ng.3967
on that data (with the exception of HumanBase functional net- Benvenuto M, Masuelli L, De Smaele E, Fantini M, Mattera R, Cucchi D,
work module detection [https://humanbase.flatironinstitute.org/], Bonanno E, Di Stefano E, Frajese GV, Orlandi A, et al. 2016. In vitro
SNV substitution profiles, and phylogenetic analysis). No installa- and in vivo inhibition of breast cancer cell growth by targeting the
Genome Research 9
www.genome.orgDownloaded from genome.cshlp.org on February 17, 2021 - Published by Cold Spring Harbor Laboratory Press
Graim et al.
Hedgehog/GLI pathway with SMO (GDC-0449) or GLI (GANT-61) in- ated mechanism. Sci Transl Med 9: eaan0026. doi:10.1126/scitranslmed
hibitors. Oncotarget 7: 9250–9270. doi:10.18632/oncotarget.7062 .aan0026
Bombonati A, Sgroi DC. 2011. The molecular pathology of breast cancer Kasprzyk A. 2011. BioMart: driving a paradigm change in biological data
progression. J Pathol 223: 308–318. doi:10.1002/path.2808 management. Database (Oxford) 2011: bar049. doi:10.1093/database/
Boone JD, Dobbin ZC, Straughn JM Jr., Buchsbaum DJ. 2015. Ovarian and bar049
cervical cancer patient derived xenografts: the past, present, and future. Kim D, Paggi JM, Park C, Bennett C, Salzberg SL. 2019. Graph-based genome
Gynecol Oncol 138: 486–491. doi:10.1016/j.ygyno.2015.05.022 alignment and genotyping with HISAT2 and HISAT-genotype. Nat
Borge KS, Nord S, Van Loo P, Lingjærde OC, Gunnes G, Alnæs GI, Solvang Biotechnol 37: 907–915. doi:10.1038/s41587-019-0201-4
HK, Lüders T, Kristensen VN, Børresen-Dale AL, et al. 2015. Canine Klopfleisch R, Von Euler H, Sarli G, Pinho S, Gärtner F, Gruber A. 2011.
mammary tumours are affected by frequent copy number aberrations, Molecular carcinogenesis of canine mammary tumors: news from an
including amplification of MYC and loss of PTEN. PLoS One 10: old disease. Vet Pathol 48: 98–116. doi:10.1177/0300985810390826
e0126371. doi:10.1371/journal.pone.0126371 Kol A, Arzi B, Athanasiou KA, Farmer DL, Nolta JA, Rebhun RB, Chen X,
Burns MB, Lackey L, Carpenter MA, Rathore A, Land AM, Leonard B, Griffiths LG, Verstraete FJ, Murphy CJ, et al. 2015. Companion animals:
Refsland EW, Kotandeniya D, Tretyakova N, Nikas JB, et al. 2013. translational scientist’s new best friends. Sci Transl Med 7: 308ps21.
APOBEC3B is an enzymatic source of mutation in breast cancer. doi:10.1126/scitranslmed.aaa9116
Nature 494: 366–370. doi:10.1038/nature11881 Krishnan A, Zhang R, Yao V, Theesfeld CL, Wong AK, Tadych A, Volfovsky
The Cancer Genome Atlas Network. 2012. Comprehensive molecular por- N, Packer A, Lash A, Troyanskaya OG. 2016. Genome-wide prediction
traits of human breast tumours. Nature 490: 61–70. doi:10.1038/ and functional characterization of the genetic basis of autism spectrum
nature11412 disorder. Nat Neurosci 19: 1454–1462. doi:10.1038/nn.4353
Cekanova M, Rathore K. 2014. Animal models and therapeutic molecular Kristiansen V, Peña L, Díez Córdova L, Illera J, Skjerve E, Breen A, Cofone M,
targets of cancer: utility and limitations. Drug Des Devel Ther 8: 1911– Langeland M, Teige J, Goldschmidt M, et al. 2016. Effect of ovariohyster-
1922. doi:10.2147/DDDT.S49584 ectomy at the time of tumor removal in dogs with mammary carcino-
Cingolani P, Platts A, Wang LL, Coon M, Nguyen T, Wang L, Land SJ, Lu X, mas: a randomized controlled trial. J Vet Intern Med 30: 230–241.
Ruden DM. 2012. A program for annotating and predicting the effects of doi:10.1111/jvim.13812
single nucleotide polymorphisms, SnpEff: SNPs in the genome of LeBlanc AK, Breen M, Choyke P, Dewhirst M, Fan TM, Gustafson DL,
Drosophila melanogaster strain w 1118; iso-2; iso-3. Fly (Austin) 6: 80–92. Helman LJ, Kastan MB, Knapp DW, Levin WJ, et al. 2016. Perspectives
doi:10.4161/fly.19695 from man’s best friend: National Academy of Medicine’s Workshop
Crawford DL, Oleksiak MF. 2007. The biological importance of measuring on Comparative Oncology. Sci Transl Med 8: 324ps5. doi:10.1126/sci
individual variation. J Exp Biol 210: 1613–1621. doi:10.1242/jeb translmed.aaf0746
.005454 Liu D, Xiong H, Ellis AE, Northrup NC, Rodriguez CO, O’Regan RM, Dalton
DePristo MA, Banks E, Poplin R, Garimella KV, Maguire JR, Hartl C, S, Zhao S. 2014. Molecular homology and difference between spontane-
Philippakis AA, Del Angel G, Rivas MA, Hanna M, et al. 2011. A frame- ous canine mammary cancer and human breast cancer. Cancer Res 74:
work for variation discovery and genotyping using next-generation 5045–5056. doi:10.1158/0008-5472.CAN-14-0392
DNA sequencing data. Nat Genet 43: 491–498. doi:10.1038/ng.806 Manichaikul A, Mychaleckyj JC, Rich SS, Daly K, Sale M, Chen WM. 2010.
Donnem T, Al-Saad S, Al-Shibli K, Busund LT, Bremnes RM. 2010. Co-ex- Robust relationship inference in genome-wide association studies.
pression of PDGF-B and VEGFR-3 strongly correlates with lymph node Bioinformatics 26: 2867–2873. doi:10.1093/bioinformatics/btq559
metastasis and poor survival in non-small-cell lung cancer. Ann Oncol Mantovani F, Collavin L, Del Sal G. 2019. Mutant p53 as a guardian of the
21: 223–231. doi:10.1093/annonc/mdp296 cancer cell. Cell Death Differ 26: 199–212. doi:10.1038/s41418-018-
Fernald K, Kurokawa M. 2013. Evading apoptosis in cancer. Trends Cell Biol 0246-9
23: 620–633. doi:10.1016/j.tcb.2013.07.006 McCarthy DJ, Chen Y, Smyth GK. 2012. Differential expression analysis of
French LE, Tschopp J. 2002. Defective death receptor signaling as a cause of multifactor RNA-seq experiments with respect to biological variation.
tumor immune escape. Semin Cancer Biol 12: 51–55. doi:10.1006/scbi Nucleic Acids Res 40: 4288–4297. doi:10.1093/nar/gks042
.2001.0405 Paoloni M, Khanna C. 2008. Translation of new cancer treatments from pet
Friedman J, Hastie T, Tibshirani R. 2010. Regularization paths for general- dogs to humans. Nat Rev Cancer 8: 147–156. doi:10.1038/nrc2273
ized linear models via coordinate descent. J Stat Softw 33: 1–22. doi:10 Parker JS, Mullins M, Cheang MC, Leung S, Voduc D, Vickery T, Davies S,
.18637/jss.v033.i01 Fauron C, He X, Hu Z, et al. 2009. Supervised risk predictor of breast can-
Gillet JP, Calcagno AM, Varma S, Marino M, Green LJ, Vora MI, Patel C, cer based on intrinsic subtypes. J Clin Oncol 27: 1160–1167. doi:10
Orina JN, Eliseeva TA, Singal V, et al. 2011. Redefining the relevance .1200/JCO.2008.18.1370
of established cancer cell lines to the study of mechanisms of clinical Pereira B, Chin SF, Rueda OM, Vollan HKM, Provenzano E, Bardwell HA,
anti-cancer drug resistance. Proc Natl Acad Sci 108: 18708–18713. Pugh M, Jones L, Russell R, Sammut SJ, et al. 2016. The somatic muta-
doi:10.1073/pnas.1111840108 tion profiles of 2,433 breast cancers refine their genomic and transcrip-
Goldschmidt M, Peña L, Rasotto R, Zappulli V. 2011. Classification and tomic landscapes. Nat Commun 7: 11479. doi:10.1038/ncomms11479
grading of canine mammary tumors. Vet Pathol 48: 117–131. doi:10 Pinho SS, Carvalho S, Cabral J, Reis CA, Gärtner F. 2012. Canine tumors: a
.1177/0300985810393258 spontaneous animal model of human carcinogenesis. Transl Res 159:
Greene CS, Krishnan A, Wong AK, Ricciotti E, Zelaya RA, Himmelstein DS, 165–172. doi:10.1016/j.trsl.2011.11.005
Zhang R, Hartmann BM, Zaslavsky E, Sealfon SC, et al. 2015. Quinlan AR, Hall IM. 2010. BEDTools: a flexible suite of utilities for compar-
Understanding multicellular function and disease with human tissue- ing genomic features. Bioinformatics 26: 841–842. doi:10.1093/bioinfor
specific networks. Nat Genet 47: 569–576. doi:10.1038/ng.3259 matics/btq033
Hanahan D, Weinberg RA. 2011. Hallmarks of cancer: the next generation. Rangarajan A, Weinberg RA. 2003. Comparative biology of mouse versus
Cell 144: 646–674. doi:10.1016/j.cell.2011.02.013 human cells: modelling human cancer in mice. Nat Rev Cancer 3:
Harbeck N, Penault-Llorca F, Cortes J, Gnant M, Houssami N, Poortmans P, 952–959. doi:10.1038/nrc1235
Ruddy K, Tsang J, Cardoso F. 2019. Breast cancer. Nat Rev Dis Primers 5: R Core Team. 2019. R: a language and environment for statistical computing. R
66. doi:10.1038/s41572-019-0111-2 Foundation for Statistical Computing, Vienna. https://www.R-project
Harris RS. 2015. Molecular mechanism and clinical impact of APOBEC3B- .org/.
catalyzed mutagenesis in breast cancer. Breast Cancer Res 17: 8. doi:10 Reyes A, Anders S, Weatheritt RJ, Gibson TJ, Steinmetz LM, Huber W. 2013.
.1186/s13058-014-0498-3 Drift and conservation of differential exon usage across tissues in pri-
Hoadley KA, Yau C, Hinoue T, Wolf DM, Lazar AJ, Drill E, Shen R, Taylor mate species. Proc Natl Acad Sci 110: 15377–15382. doi:10.1073/pnas
AM, Cherniack AD, Thorsson V, et al. 2018. Cell-of-origin patterns dom- .1307202110
inate the molecular classification of 10,000 tumors from 33 types of can- Robinson MD, Oshlack A. 2010. A scaling normalization method for differ-
cer. Cell 173: 291–304.e6. doi:10.1016/j.cell.2018.03.022 ential expression analysis of RNA-seq data. Genome Biol 11: R25. doi:10
Hughes DA, Kircher M, He Z, Guo S, Fairbrother GL, Moreno CS, Khaitovich .1186/gb-2010-11-3-r25
P, Stoneking M. 2015. Evaluating intra- and inter-individual variation in Rowell JL, McCarthy DO, Alvarez CE. 2011. Dog models of naturally occur-
the human placental transcriptome. Genome Biol 16: 54. doi:10.1186/ ring cancer. Trends Mol Med 17: 380–388. doi:10.1016/j.molmed.2011
s13059-015-0627-z .02.004
Jansson S, Aaltonen K, Bendahl PO, Falck AK, Karlsson M, Pietras K, Rydén Sorenmo KU, Kristiansen VM, Cofone MA, Shofer FS, Breen A, Langeland M,
L. 2018. The PDGF pathway in breast cancer is linked to tumour aggres- Mongil CM, Grondahl AM, Teige J, Goldschmidt MH. 2009. Canine
siveness, triple-negative subtype and early recurrence. Breast Cancer Res mammary gland tumours; a histological continuum from benign to ma-
Treat 169: 231–241. doi:10.1007/s10549-018-4664-7 lignant; clinical and histopathological evidence. Vet Comp Oncol 7: 162–
Karagiannis GS, Pastoriza JM, Wang Y, Harney AS, Entenberg D, Pignatelli J, 172. doi:10.1111/j.1476-5829.2009.00184.x
Sharma VP, Xue EA, Cheng E, D’Alfonso TM, et al. 2017. Neoadjuvant Sorlie T, Tibshirani R, Parker J, Hastie T, Marron J, Nobel A, Deng S, Johnsen
chemotherapy induces breast cancer metastasis through a TMEM-medi- H, Pesich R, Geisler S, et al. 2003. Repeated observation of breast tumor
10 Genome Research
www.genome.orgDownloaded from genome.cshlp.org on February 17, 2021 - Published by Cold Spring Harbor Laboratory Press
Modeling molecular development of breast cancer
subtypes in independent gene expression data sets. Proc Natl Acad Sci Toole MJ, Kidwell KM, Van Poznak C. 2014. Oncotype Dx results in multi-
100: 8418–8423. doi:10.1073/pnas.0932692100 ple primary breast cancers. Breast Cancer (Auckl) 8: 1–6. doi:10.4137/
Stein WD, Litman T, Fojo T, Bates SE. 2004. A serial analysis of gene expres- BCBCR.S13727
sion (SAGE) database analysis of chemosensitivity: comparing solid tu- Urra H, Dufey E, Avril T, Chevet E, Hetz C. 2016. Endoplasmic reticulum
mors with cell lines and comparing solid tumors from different tissue
stress and the hallmarks of cancer. Trends Cancer 2: 252–262. doi:10
origins. Cancer Res 64: 2805–2816. doi:10.1158/0008-5472.CAN-03-
3383 .1016/j.trecan.2016.03.007
Storey JD, Tibshirani R. 2003. Statistical significance for genomewide stud- Van der Auwera GA, Carneiro MO, Hartl C, Poplin R, Del Angel G, Levy-
ies. Proc Natl Acad Sci 100: 9440–9445. doi:10.1073/pnas.1530509100 Moonshine A, Jordan T, Shakir K, Roazen D, Thibault J, et al. 2013.
Storey JD, Madeoy J, Strout JL, Wurfel M, Ronald J, Akey JM. 2007. Gene-ex- From FastQ data to high-confidence variant calls: the Genome
pression variation within and among human populations. Am J Hum Analysis Toolkit best practices pipeline. Curr Protoc Bioinformatics 43:
Genet 80: 502–509. doi:10.1086/512017 483–492. doi:10.1002/0471250953.bi1110s43
Sun Z, Bhagwate A, Prodduturi N, Yang P, Kocher JPA. 2017. Indel detection
Yates LR, Knappskog S, Wedge D, Farmery JH, Gonzalez S, Martincorena I,
from RNA-seq data: tool evaluation and strategies for accurate detection
of actionable mutations. Brief Bioinform 18: 973–983. doi:10.1093/bib/ Alexandrov LB, Van Loo P, Haugland HK, Lilleng PK, et al. 2017.
bbw069 Genomic evolution of breast cancer metastasis and relapse. Cancer Cell
Takahashi H, Asaoka M, Yan L, Rashid OM, Oshi M, Ishikawa T, Nagahashi 32: 169–184.e7. doi:10.1016/j.ccell.2017.07.005
M, Takabe K. 2020. Biologically aggressive phenotype and anti-cancer Zerbino DR, Achuthan P, Akanni W, Amode MR, Barrell D, Bhai J, Billis K,
immunity counterbalance in breast cancer with high mutation rate. Cummins C, Gall A, Girón CG, et al. 2018. Ensembl 2018. Nucleic
Sci Rep 10: 1852. doi:10.1038/s41598-020-58995-4 Acids Res 46: D754–D761. doi:10.1093/nar/gkx1098
Tate JG, Bamford S, Jubb HC, Sondka Z, Beare DM, Bindal N, Boutselakis H,
Cole CG, Creatore C, Dawson E, et al. 2019. COSMIC: the Catalogue Of
Somatic Mutations In Cancer. Nucleic Acids Res 47: D941–D947. doi:10
.1093/nar/gky1015 Received August 25, 2019; accepted in revised form December 17, 2020.
Genome Research 11
www.genome.orgYou can also read