Nepotism vs. Intergenerational Transmission of Human Capital in Academia (1088-1800) Online appendix
←
→
Page content transcription
If your browser does not render page correctly, please read the page content below

Nepotism vs. Intergenerational Transmission of
Human Capital in Academia (1088–1800)
Online appendix
David de la Croix* Marc Goñi
March 16, 2021
A Data appendix
This appendix lists the data sources used to construct our dataset and presents to
examples: one to illustrate multiple-generation lineages of scholars (the Chicoyneau
and Mögling dynasties), another to illustrate our data collection process (Honoré
Bicais and his son Michel).
A1 Examples
Multi-generation lineages of scholars. Our database contains 145 families with
three or more generations of scholars at the same university or scientific academy.
For the sake of illustration, Figure A1 shows one of these dynasties of scholars: the
Chicoyneau. The Chicoyneaus had four generations of scholars, all employed at the
University of Montpellier. For almost a century (from 1659 to 1758), there was at
least one Chicoyneau at the University of Montpellier. This lineage was reconstructed
using Dulieu (1983). Note that some Chicoyneaus developed a prolific career. For
example, François Chicoyneau (1672-1752) was a professor at Montpellier and was
also appointed at the Académie des Sciences. Other members of the dynasty were
appointed professor at very early ages. The last member of the dynasty, Jean-François
Chicoyneau (born in 1737), was made a professor in 1752—that is, at the tender at
age of 15. In principle, dynasties like the Chicoyneaus may emerge because human
capital was strongly transmitted across generations, because of nepotism, or because
of a combination of both.
Similarly, Figure A2 displays another multi-generation lineage of scholars: the
Mögling family at the University of Tübingen (Conrad 1960). This lineage spans six
generations, from the sixteenth to the eighteenth century. The first three generations
were professors in medicine. After Johan David Mögling (1650-1695), however, the
family switch to law (in section 5.3 of the main text, we exploit such field switches).
In the first and fifth generation, the lineage members held a professorship elsewhere:
Daniel Mögling (1546-1603) at Heidelberg, Johan Friedrich Mögling (1690-1766) at
Giessen.
* IRES/LIDAM, UCLouvain & CEPR, London. E-mail: david.delacroix@uclouvain.be.
Department of Economics and FAIR, Norwegian School of Economics.
Email: marc.goni@nhh.no
1
Figure A1: The Chicoyneau dynasty.

                                                                 Gaspard Chicoyneau
                                                                 (1673-1693)
                                                                 Prof. Montpellier
                                                                      1691-1693

             Michel Chicoyneau
             (1626-1701)
             Prof. Montpellier
                   1659-1701

                                    François Chicoyneau                     François Chicoyneau                  Jean-François Chicoyneau
                                    (1672-1752)                              (1702-1740)                           (1737-1758)
                                    Prof. Montpellier                        Prof. Montpellier                     Prof. Montpellier
                                          1693-1752                             1731-1740                               1752-1758
                                    Académie des Sciences
                                          1732-1752
                                  Michel-Aimé Chicoyneau
                                      (1670-1691)
                                  Prof. Montpellier                                                               Data source: Dulieu, 1983
                                         1689-1691

                                          Figure A2: The Mögling dynasty.
Daniel Mögling (1546-1603)       Johann Ludwig Mögling (1585-1625)         Johann Ludwig Mögling (1613-1693)            Johann David Mögling (1650-1695)
Prof. in Heidelberg & Tübingen   Prof. in Tübingen                         Prof. in Tübingen                            Prof. in Tübingen
Medicine                          Medicine                                   Medicine                                      Law

                                  Jacob Friedrich Mögling (1708-1742)        Jakob David Mögling (1680-1729)    Johann Friedrich Mögling (1690-1766)
                                  Prof. in Tübingen                          Prof. in Tübingen                  Prof. in Tübingen & Giessen
                                  Law                                         Law                                 Law

          In the main text, we exploit these multi-generation lineages to address measure-
      ment error in estimates for the transmission of human capital. Specifically, we use
      multi-generation lineages to compute correlations in observed publications across mul-
      tiple generations. Elsewhere it has been shown that, under the assumption that
      measurement error is constant across generations, these multi-generation correlations
      reflect the transmission of (unobserved) underlying human-capital endowments (see
      section 2.2). In other words, multi-generation lineages help us tackle the measurement
      error bias in parent-child publication elasticities.

                                                                         2
Data collection example - Honoré and Michel Bicais. In Section 3 on the main
text, we illustrate the data collection process by using the example of Honoré Bicais
and his son Michel, both professors at the University of Aix.

       Figure A3: Example of data collection - Honoré and Michel Bicais.

                                          3
Figure A3 shows the different sources mentioned in the main text: (a) Honoré
Bicais’ biography from Belin’s Histoire de l’Ancienne Universite de Provence (1905) —
used to identify Honoré (and Michel) as professors at the University of Aix; (b) The
biographical dictionary of Aix’s Department, Les Bouches-du-Rhône, Encyclopédie
Départementale by (Mason 1931) — used to retrieve birth years and the quote that
Michel Bicais succeeded his father in “in his chair and in his reputation;” and (c)
Honoré and Michel Bicais’ WorldCat entries — used to measure their scientific output
in the form of library holdings by or about them in modern libraries.

A2     Data sources
Table A1 lists the data sources used to construct our dataset on lineages of scholars.
Specifically, it provides the name, location, foundation date (and, when applicable,
closure date), number of scholar lineages, and the sources used for each of the 100
universities and 40 scientific academies included in our database.

                                          4
Table A1: Number of families (father-son) by institution (1/6)

    Institution                        City          Cntry      Dates      Nb.   Sources
    University of Bologna              Bologna       ITA     1088          171   Mazzetti (1847)
    Royal Society of London (· · · )   London        GBR     1660           76   https://royalsociety.org/
    University of Avignon              Avignon       FRA     1303 1793      58   Laval (1889), Fournier (1892), Teule (1887),
                                                                                     Duhamel (1895), Barjavel (1841)
    University of Padua                Padova        ITA     1222           49   Pesenti (1984), Casellato and Rea (2002),
                                                                                     Facciolati (1757),Del Negro (2015)
    University of Copenhagen           København     DNK     1475           47   Slottved (1978)
    University of Tubingen             Tübingen     DEU     1476           47   Conrad (1960)
    University of Basel                Basel         CHE     1460           45   Herzog (1780), Junius Institute (2013), Michaud (1811)
    Academy of Sciences Leopoldina     Halle         DEU     1652           40   http://www.leopoldina.org/
    University of Montpellier          Montpellier   FRA     1289   1793    34   Astruc (1767), Dulieu (1975, 1979, 1983), Clerc (2006)
    Leipzig University                 Leipzig       DEU     1409           31   Hehl (2017)

5
    University of Jena                 Jena          DEU     1558           30   Günther (1858)
    Univ. of Pavia                     Pavia         ITA     1361           27   Raggi (1879)
    University of Marburg              Marburg       DEU     1527           25   Gundlach and Auerbach (1927)
    University of Greifswald           Greifswald    DEU     1456           24
    University of Giessen              Gießen        DEU     1607           24   Haupt and Lehnert (1907)
    University of Helmstedt            Helmstedt     DEU     1575   1809    22   Gleixner (2019)
    University of Cambridge            Cambridge     GBR     1209           22   Walker (1927), Venn (1922)
    French Academy of Sciences         Paris         FRA     1666   1793    18   http://www.academie-sciences.fr
    University of Paris                Paris         FRA     1200   1793    19   Antonetti (2013), Courtenay (1999),
                                                                                    Hazon and Bertrand (1778)
    University of Rostock              Rostock       DEU     1419           19   Krüger (2019)
    University of Wittenberg           Wittenberg    DEU     1502   1813    16   Kohnle and Kusche (2016)
    Leiden University                  Leiden        NLD     1575           16   Leiden (2019)
    University of Königsberg          Kaliningrad   RUS     1544           15   Naragon (2006)
    University of Strasbourg           Strasbourg    FRA     1538           14   Berger-Levrault (1890)
    University of Edinburgh            Edinburgh     GBR     1582           14   Junius Institute (2013), Grant (1884)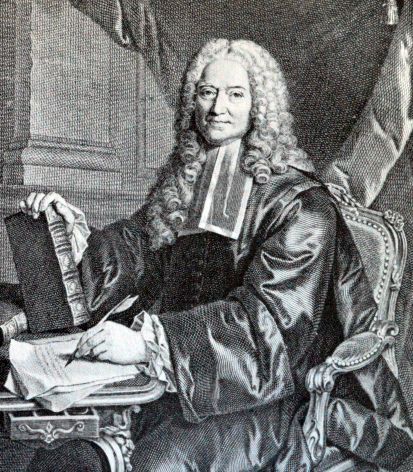
Table A1: Number of families (father-son) by institution (2/6)

    Institution                            City              Cntry      Dates      Nb.   Sources
    University of Geneva                   Genève           CHE     1559           14   Junius Institute (2013), Borgeaud (1900)
    Académie royale d’architecture        Paris             FRA     1671 1793      14   www.cths.fr
    Académie Royale (· · · ) de Lyon      Lyon              FRA     1700 1790      13   https://academie-sbla-lyon.fr/Academiciens/,
                                                                                            Bréghot Du Lut and Péricaud (1839)
    Collège Royal                         Paris             FRA     1530           13   de France (2018)
    University of Halle                    Halle (Saale)     DEU     1694   1817    13   https://www.catalogus-professorum-halensis.de
    University of Pisa                     Pisa              ITA     1343           13   Fabroni (1791)
    Academy of(· · · ) Mainz               Erfurt            DEU     1754           12   Kiefer (2004)
    University of Aix                      Aix-en-Provence   FRA     1409   1793    11   Belin (1896), Belin (1905), Fleury and Dumas (1929),
                                                                                            Masson (1931), de la Croix and Fabre (2019)
    Accademia Fiorentina                   Firenze           ITA     1540   1783    11   Boutier (2017)
    University of Louvain                  Leuven            BEL     1425   1797     8   Ram (1861), Nève (1856),

6
                                                                                             Brants (1906), Lamberts and Roegiers (1990)
    University of Lausanne                 Lausanne          CHE     1537            1   Junius Institute (2013),Kiener and Robert (2005)
    University of Franeker                 Franeker          NLD     1585   1811    10   Feenstra, Ahsmann, and Veen (2003)
    Royal Prussian Academy of Sciences     Berlin            DEU     1700           10   BBAW (2019)
    University of Cahors                   Cahors            FRA     1332   1751    10   Ferté (1975)
    Royal Society of Edinburgh             Edinburgh         GBR     1783           10   RSE (2006)
    Académie des inscriptions (· · · )    Paris             FRA     1663           10   Boutier (2018)
    Collegium Carolinum                    Zurich            CHE     1525           10   Junius Institute (2013),
                                                                                             Attinger, Godet, and Türler (1928)
    Royal Swedish Academy of Sciences      Stockholm         SWE     1739            9   http://www.kva.se
    University of Salerno                  Salerno           ITA     1231            9   Sinno (1921), De Renzi (1857)
    University of Kiel                     Kiel              DEU     1652            9   Volbehr and Weyl (1956)
    University of Poitiers                 Poitiers          FRA     1431   1793     8   Boissonade (1932)
    University of Oxford                   Oxford            GBR     1200            8   Emden (1959), Foster (1891)
    Uppsala University                     Uppsala           SWE     1477            8   Von Bahr (1945), Astro.uu.se (2011)
    University of Göttingen               Göttingen        DEU     1734            8   Ebel (1962)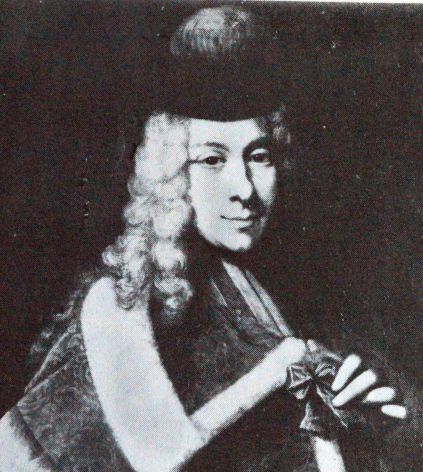
Table A1: Number of families (father-son) by institution (3/6)

    Institution                      City               Cntry      Dates      Nb.   Sources
    University of Angers             Angers             FRA     1250 1793       8   Rangeard and Lemarchand (1868), de Lens (1880),
                                                                                    Denéchère and Matz (2012), Port (1876)
    University of Toulouse           Toulouse           FRA     1229   1793     8   Deloume (1890), Barbot (1905),
                                                                                        Lamothe-Langon (1823)
    Utrecht University               Utrecht            NLD     1636            7   Dorsman (2011)
    Jardin Royal des Plantes Méd.   Paris              FRA     1635   1793     7   Jaussaud and Brygoo (2004)
    Heidelberg University            Heidelberg         DEU     1386            7   Drüll (1991), Drüll (2002)
    French Academy                   Paris              FRA     1635            7   http://www.academie-francaise.fr/
    University of Groningen          Groningen          NLD     1612            7   https://hoogleraren.ub.rug.nl/
    Societas Privatas Taurinensis    Torino             ITA     1757   1792     7   https://www.accademiadellescienze.it/accademia/soci/
    University of Salamanca          Salamanca          ESP     1218            7   Addy (1966), Rodrı́guez San Pedro Bezares (2004),
                                                                                       Arteaga (1917)

7
    Accademia dei Ricovrati          Padova             ITA     1599            6   https://www.bl.uk/catalogues/ItalianAcademies/
    University of Siena              Siena              ITA     1246            6   Frova, Catoni, and Renzi (2001)
    University of Perpignan          Perpignan          FRA     1350   1793     6   Carmignani (2017), Capeille (1914),Izarn (1991)
    Bavarian Academy of (· · · )     München           DEU     1759            6   https://badw.de/en/community-of-scholars/
    Åbo Akademi University          Turku              FIN     1640            6
    University of Nantes             Nantes             FRA     1460   1793     6   Chenon (1890), Grünblatt (1961)
    University of Pont-à-Mousson    Pont-à-Mousson    FRA     1572   1768     6   Martin (1891)
    “Mersenne” Academy               Paris              FRA     1635   1648     6   de Coste (1649)
    Academy of St Petersburg         Saint-Petersburg   RUS     1724   1917     5
    University of Glasgow            Glasgow            GBR     1451            6   Coutts (1909), University of Glasgow (2020)
    Royal Spanish Academy            Madrid             ESP     1713            5   https://www.rae.es/la-institucion/los-academicos/
    Royal College of Physicians      London             GBR     1518            4   Munk (1878)
    University of Modena             Modena             ITA     1175            5   Mor and Di Pietro (1975)
    Uiversity of Valladolid          Valladolid         ESP     1280            5   Alcocer Martinéz (1918)
    University of Rinteln            Rinteln            DEU     1620   1809     4   Hänsel (1971)
    University of Valence            Valence            FRA     1452   1793     4   Brun-Durand (1901), Nadal (1861)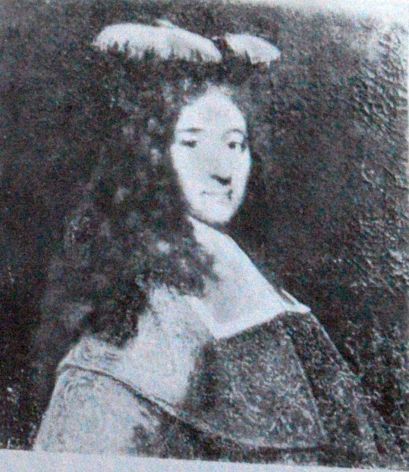
Table A1: Number of families (father-son) by institution (4/6)

    Institution                              City                    Cntry      Dates      Nb.   Sources
    University of Lund                       Lund                    SWE     1666            4   Tersmeden (2015)
    University of St Andrews                 Saint-Andrews           GBR     1411            1   Smart (2004)
    Majorcan cartographic school             Palma                   ESP     1330 1500       4   http://www.cresquesproject.net
    University of Aberdeen                   Aberdeen                GBR     1495            4   Anderson (1893)
    Académie (.) de la Rochelle             La Rochelle             FRA     1732 1744       4   https://cths.fr/an/societe.php?id=682
    Accademia della Crusca                   Firenze                 ITA     1583            4   Parodi (1983)
    Universty of Naples                      Napoli                  ITA     1224            4   Origlia Paolino (1754)
    University of Montauban                  Montauban               FRA     1598 1659       4   Bourchenin (1882)
    Académie d’agriculture de France        Paris                   FRA     1761 1793       4   https://cths.fr/an/societe.php?id=502
    University of Altdorf                    Altdorf bei Nürnberg   DEU     1578 1809       3   Flessa (1969)
    Société Royale des Sciences            Montpellier             FRA     1706 1793       3   Dulieu (1983)
    University of Ferrara                    Ferrara                 ITA     1391            3

8
    University of Harderwijk                 Harderwijk              NLD     1647 1811       3   van Epen (1904)
    University of Caen                       Caen                    FRA     1432 1793       3   de Pontville (1997a)
    Académie des arts et belles lettres     Caen                    FRA     1705 1793       3   de Pontville (1997b)
    Braunschweig University (· · · )         Braunschweig            DEU     1745            3   Albrecht (1986)
    Jagiellonian University                  Krakow                  POL     1364            3   Pietrzyk and Marcinek (2000),
                                                                                                       http://www.archiwum.uj.edu.pl/
    University of Rome                       Roma                    ITA     1303            3   Renazzi (1803)
    Gottingen Academy of Sciences            Göttingen              DEU     1752            3   Krahnke (2001)
    University of Sedan                      Sedan                   FRA     1599   1681     3   Bourchenin (1882)
    University of Dublin                     Dublin                  IRL     1592            3   Kirkpatrick (1912)
    University of Saumur                     Saumur                  FRA     1596   1685     2   Bourchenin (1882)
    Académie des belles-lettres, (· · · )   Marseille               FRA     1726   1793     2
    University of Torino                     Torino                  ITA     1404            2
    University of Florence                   Firenze                 ITA     1321   1515     2
    Viadrina European University             Frankfurt (Oder)        DEU     1506   1811     2   Junius Institute (2013)
    Universite of Die                        Die                     FRA     1601   1684     2   Bourchenin (1882)
Table A1: Number of families (father-son) by institution (5/6)

    Institution                                City        Cntry      Dates    Nb.   Sources
    University of Macerata                     Macerata    ITA     1540          2   Serangeli (2010)
    Académie des Sciences et belles lettres   Bordeaux    FRA     1712 1793     2
    Academy of Gorlitz                         Gorlitz     DEU     1773          2   https://www.olgdw.de/gesellschaft/mitgliederservice/
    Agriculture Society of Lyon                Lyon        FRA     1761          2   http://www.cths.fr/an/societe.php?id=2815
    University of Erlangen                     Erlangen    DEU     1742          2   Wachter (2009)
    Danzig Research Society                    Gdansk      POL     1743 1936     2   Schumann (1893)
    University of Mainz                        Mainz       DEU     1476 1792     1   Benzing (1986)
    Academy of the Unknown                     Venezia     ITA     1626 1661     1   https://www.bl.uk/catalogues/ItalianAcademies/
    Athenaeum Illustre of Amsterdam            Amsterdam   NLD     1632 1877     1   http://www.albumacademicum.uva.nl/
    Academy of the Burning Ones                Padova      ITA     1540 1545     1   https://www.bl.uk/catalogues/ItalianAcademies/
    University of Würzburg                    Würzburg   DEU     1402          1   Walter (2010)
    Freiberg University (· · · )               Freiberg    DEU     1765          1

9
    Zamojski Academy                           Zamosc      POL     1594 1784     1
    Nijmegen University                        Nijmegen    NLD     1655 1679     1
    Veneziana (Seconda Accademia)              Venezia     ITA     1594 1608     1   https://www.bl.uk/catalogues/ItalianAcademies/
    University of Orléans                     Orléans    FRA     1235 1793     1   Bimbenet (1853), Duijnstee (2010)
    University of Perugia                      Perugia     ITA     1308          1
    University of Nı̂mes                       Nı̂mes      FRA     1539 1663     1   Bourchenin (1882)
    University of Moscow                       Moskow      RUS     1755          1   Andreev and Tsygankov (2010)
    Academy of the Invaghiti                   Mantova     ITA     1562 1738     1   https://www.bl.uk/catalogues/ItalianAcademies/
    University of Rennes                       Rennes      FRA     1735 1793     1   Chenon (1890)
    University of Freiburg                     Freiburg    DEU     1457          1
    University of Prague                       Prague      CZE     1348          1
    University of Erfurt                       Erfurt      DEU     1379          1
    Royal Botanic Garden                       Kew         GBR     1759          1
    University of Bordeaux                     Bordeaux    FRA     1441 1793     1
    Academie de Beziers                        Béziers    FRA     1723 1793     1
    University of Cervera                      Cervera     ESP     1714 1821     1   Rubio y Borras (1914)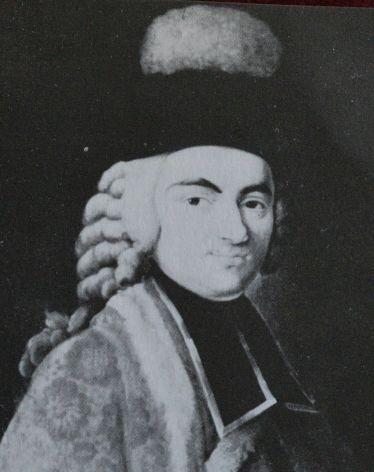
Table A1: Number of families (father-son) by institution (6/6)

     Institution                    City          Cntry       Dates      Nb.   Sources
     Academy of the Umorists        Roma          ITA      1603 1670       1   https://www.bl.uk/catalogues/ItalianAcademies/
     University of Bourges          Bourges       FRA      1464 1793       1
     University of Orange           Orange        FRA      1365            1
     University of Ingolstadt       Ingolstadt    DEU      1459 1800       1
     Society of Observers of Man    Paris         FRA      1799 1804       1

10
     University of Oviedo           Oviedo        ESP      1574            1   Canella Secades (1873)
     Royal Danish Science Society   Copenhagen    DNK      1742            1
     French Academy of Medecine     Paris         FRA      1731 1793       1
     University of Duisburg         Duisbrug      DEU      1654            1
     University of Vienna           Vienna        AUT      1465            1
     University of Cagliari         Cagliari      ITA      1606            1   Tola (1837), Pillosu (2017)
       Notes: Missing sources correspond to families which were mentioned in sources about other institutions.
B Intergenerational estimates in the literature
This appendix presents estimates for measuring intergenerational persistence in the
literature. For a more thorough review, see Solon (1999), Corak (2006), and Black
and Devereux (2011).
Specifically, Panel A of Table B1 presents parent-child elasticities, b, estimated
from:
yi,t+1 = b yi,t + ei,t+1 ,
where i indexes families, t parents, and t+1 children. The outcome y reflects social
status (e.g., income, wealth, education, occupation) and is in logarithms.
Panel B of Table B1 reports estimates of β, the extent to which children inherit
an unobserved human capital endowment h from their parents (e.g., knowledge, skills,
genes, preferences) which then transforms into the observed outcome y imperfectly.
One way to model this is as a first-order Markov process (Clark and Cummins 2015;
Braun and Stuhler 2018):
hi,t+1 = βhi,t + ui,t+1 ,
yi,t+1 = hi,t+1 + εi,t+1 ,
where hi,t ∼ N (µh , σh2 ) and ui,t+1 and εi,t+1 are independent noise terms.
The β-estimates reported in Panel B of Table B1 are obtained through differ-
ent methods: First, by exploiting correlations in y across multiple generations—
specifically, the ratio of the granparent-grandchild elasticity to the parent-child elas-
ticity (see, for example, Lindahl et al. 2015, Braun and Stuhler 2018, and Colagrossi,
d’Hombres, and Schnepf 2019).
Second, by estimating intergenerational regressions such as:
ŷj,t+1 = b ŷj,t + êj,t+1 ,
with group-average data (j) for siblings (Braun and Stuhler 2018) or for people sharing
rare surnames (Clark and Cummins 2015).
Third, through the informational content of rare surnames (ICS)—a moment cap-
turing how much individual surnames explain the total variance of individual outcomes
(see Güell, Rodrı́guez Mora, and Telmer 2015).
Fourth, by using horizontal kinship correlations—e.g., first-, second-cousins, etc.—
in cross-sectional data (Collado, Ortuno-Ortin, and Stuhler 2018). All these methods
are explained in detail in Section 2.2 of the main text.
11Table B1: Persistence of social status in the literature.
Panel A: Estimates of b
b̂ yt Country & Source
0.31–0.41 Wealth Agricultural societies (Borgerhoff Mulder et al. 2009)
0.48–0.59 Wealth UK (Harbury and Hitchins 1979)
0.225 Wealth Norway (adoptees) (Fagereng, Mogstad, and Ronning )
0.6 Earnings USA (Mazumder 2005)
0.34 Earnings USA (Chetty et al. 2014)†
0.47 Earnings USA (Corak 2006)
0.19–0.26 Earnings Sweden (Jantti et al. 2006)
0.11–0.16 Earnings Norway (Jantti et al. 2006)
0.46 Education USA (Hertz et al. 2007)
0.71 Education UK (Hertz et al. 2007)
0.35 Education Sweden (Lindahl et al. 2015)
0.35 Body Mass USA (Classen 2010)
Panel B: Estimates of β
β̂ yt Data & Source
0.70–0.75 Wealth UK probate (1858–2012) (Clark and Cummins 2015)
0.70–0.90 Oxbridge UK (1170–2012) (Clark and Cummins 2014)
0.61–0.65 Occupation Germany, 3 gen. (Braun and Stuhler 2018)
0.49–0.70 Education Germany, 4 gen. (Braun and Stuhler 2018)
0.6 Education Spain, census (Güell, Rodrı́guez Mora, and Telmer 2015)
0.61 Schooling Sweden, 4 gen. (Lindahl et al. 2015)
0.49 Earnings Sweden, 4 gen. (Lindahl et al. 2015)
0.74 Education EU-28, 3 gen. (Colagrossi, d’Hombres, and Schnepf 2019)
0.8 Education Spain, census (Collado, Ortuno-Ortin, and Stuhler 2018)
†
Rank-rank correlations instead of elasticities.
12C Identification example
Figure C1 illustrates our identification strategy by simulating our model. We show the
simulated distributions of the underlying (human capital) and the observed outcome
(publications), father-son correlations in publications and the corresponding QQ plot.
Column A presents a benchmark simulation for 10,000 potential scholars with
β = 0.6, ν = −1, τ = 0, µe = 1, π = 0, µh = 2, σh2 = 5, and σe2 = 0.25. In Column B,
we increase σe2 to 3. That is, we generate measurement error by reducing the extent to
which human capital translates into publications. The distribution of h is not altered
with respect to the benchmark case, but that of y is: both fathers and sons present
a larger mass of zero publications and a larger variance. Since y is similarly affected
for fathers and sons, the QQ plot does not reflect distributional differences across
generations. However, the increase in measurement error attenuates the father-son
correlation in y, which drops from 0.46 to 0.26 with respect to the benchmark case.
Next, Column C increases nepotism with respect to the benchmark case by setting
ν = −5. In contrast to the previous exercise, this affects the distribution of both h
and y, as sons with low levels of human capital now can become a scholar.1 This
generates distributional differences in observed publications between fathers and sons,
reflected in the QQ plot. Most evidently, the mass of sons with zero publications and
the variance of sons’ publications is now larger than their fathers’. Since nepotism
alters both the human capital’s and the observed outcome’s distribution, father-son
correlations become more informative of β than in the benchmark case: the correlation
increases from 0.46 to 0.48.
In sum, measurement error and nepotism have different implications for father-son
correlations, distributional differences (especially, at the bottom of the distribution),
and relative variances of the observed outcome.
1
The father’s h distribution is also affected, albeit to a lesser degree. The reason is that marginal
fathers, i.e., fathers with an h just above the threshold τ , are now more likely to be in the set of
selected families. Before, these fathers were mostly excluded, as their sons were likely to have low
realizations of h, falling below the (nepotic) threshold to become a scholar. Similarly, this may
decrease the variance of fathers’ publications.
13Figure C1: Identification example based on model simulations
(a) Benchmark (b) Measurement error (c) High nepotism
A.1. Human capital B.1. Human capital C.1. Human capital
τ-ν τ τ-ν τ τ-ν τ
.2
.2
.2
fathers fathers fathers
sons sons sons
.1
.1
.1
0
0
0
-6 -5 -1 0 10 -6 -5 -1 0 10 -6 -5 -1 0 10
A.2. Publications B.2. Publications C.2. Publications
π π π
.25
.25
.25
fathers fathers fathers
sons sons sons
.12
.12
.12
0
0
0
-1 0 5 10 15 -1 0 5 10 15 -1 0 5 10 15
A.3. Correlation B.3. Correlation C.3. Correlation
corr = .461 corr = .259 corr = .481
12
12
12
son
son
son
6
6
6
0
0
0
0 6 12 0 6 12 0 6 12
father father father
A.4. QQ plot B.4. QQ plot C.4. QQ plot
15
15
15
10
10
10
son
son
son
5
5
5
0
0
0
0 5 10 15 0 5 10 15 0 5 10 15
father father father
Benchmark High nepotism Measurement error
Notes: The benchmark simulation is for 10,000 potential scholars with β = 0.6, ν = −1, τ = 0,
µe = 1, π = 0, µh = 2, σh = 5, and σe = 0.25. Column B increases σe to 3, Column C increases
nepotism by setting ν = −5.
14D Model fit
This appendix first presents the estimated parameters and the simulated moments
for our baseline estimation and for an alternative model ignoring the selection bias
emerging from nepotism. Second, we show that our baseline model reproduces the
high elasticity of publications across generations (Fact 1) and the empirical fact that
the grandfather-grandson correlation is larger than predicted by iterating the two-
generation correlation.
Table D1 presents the estimated parameters and the simulated moments for two
models: our baseline model (col. 2) and an alternative model ignoring the selection
bias emerging from nepotism, that is, setting ν = τ = 0 (col. 1). As explained
in Section 4.4, the baseline model fits father-son distributional differences (Fact 2).
In contrast, the alternative model—where mean reversion is the only force generat-
ing distributional differences—fails to match Fact 2. In addition, it yields large β-
estimates—close to Clark’s estimates (Clark 2015) and to what we obtained applying
standard multi-generation techniques to our data (Table 4).
Table D1: Simulated and empirical moments for different
models.
Model w/o Baseline
nepotism model Data
Parameters:
β 0.72 0.59 .
ν 0 7.52 .
τ 0 0 .
σe 1.12 0.34 .
κ 3.70 2.14 .
µh 4.47 2.38 .
σh 2.00 3.62 .
Moments:
Fathers with zero pubs. 0.35 0.29 0.29
Sons with zero pubs. 0.36 0.37 0.37
Median, fathers 4.52 3.57 4.43
Median, sons 4.52 3.26 3.18
75th percentile, fathers 6.06 5.64 6.79
75th percentile, sons 6.05 5.53 5.90
95th percentile, fathers 8.23 8.85 8.67
95th percentile, sons 8.19 8.77 7.90
Mean, fathers 3.77 3.63 4.03
Mean, sons 3.76 3.33 3.20
Father-son correlation† 0.35 0.35 0.35
Father-son with zero pubs. 0.20 0.17 0.22
Grandfather-grandson correlation† 0.23 0.17 0.20
Notes: † correlation on the intensive margin.
Next, we compare the simulated and empirical moments regarding correlations
15across generations (see bottom rows of Table D1). We reproduce the high elasticity
of publications across generations (Fact 1). Our model with nepotism matches the
father-son correlation on the intensive margin of publications—that is, conditional on
both father and son having at least one observed publication. This is the correlation to
which our objective function attaches additional weight. Interestingly, this correlation
is below the estimate of β. This implies that father-son correlations in outcomes under-
predicts the extent to which children inherit human capital endowments from their
parents. Our model with nepotism under-predicts the proportion of families where
father and son have zero publications (extensive margin) and the correlation between
grandfathers and grandsons in the intensive margin. That said, we match the empiri-
cal fact that the grandfather-grandson correlation is larger than predicted by iterating
the two-generation correlation. Specifically, our simulated grandfather-grandson cor-
relation is 0.17. In contrast, iterating the simulated two-generation correlation yields
0.352 = 0.12.
16E QQ plots
E1 Additional descriptives
Figure E1: Quantile-quantile plot of Fathers, Sons, and Outsiders
14
Sons, n.obs=604, K−S = 0.081 (0.001)
12
Fathers, n.obs=767, K−S = 0.079 (0)
10
Sons' or Fathers' log publications
8
6
4
2
0
0 2 4 6 8 10 12 14
Outsiders' log publications (n.obs=9729)
Notes: The sample of outsiders are 9,243 scholars whose parents were not academics
(source de la Croix 2021). To make the Fathers’, Sons’, and Outsiders’ sample com-
parable, we restrict them to individuals with a wikipedia and a Woldcat page.
17E2 QQ plots for main results
Figure E2: Quantile-quantile plot by historical period
Period 1687), n.obs=502, K−S = 0.118 (0.002)
Sons' log publications
8
6
4
2
0
0 2 4 6 8 10 12
Fathers' log publications
18Figure E3: Quantile-quantile plot by age of institution
Families after 1543 in new institutions, n.obs=548, K−S = 0.175 (0)
12
Families after 1543 in old institutions, n.obs=604, K−S = 0.118 (0)
10
Sons' log publications
8
6
4
2
0
0 2 4 6 8 10 12
Fathers' log publications
19E3 QQ plots for heterogeneity in nepotism
Figure E4: Quantile-quantile plot by religious affiliation
Protestants, n.obs=753, K−S = 0.163 (0)
12
Catholics aft. 1527, n.obs=424, K−S = 0.146 (0)
10
Sons' log publications
8
6
4
2
0
0 2 4 6 8 10 12
Fathers' log publications
20Figure E5: Quantile-quantile plot by field of study
12
Lawyers, n.obs= 357, K−S = 0.106 (0.035)
Physicians, n.obs=423, K−S = 0.149 (0)
10
Theologians, n.obs=206, K−S = 0.189 (0.001)
Scientists, n.obs=231, K−S = 0.195 (0)
Sons' log publications
8
6
4
2
0
0 2 4 6 8 10 12
Fathers' log publications
21Figure E6: Quantile-quantile plot by nomination bef./after father’s death
Sons nominated after father's death, n.obs=606, K−S = 0.071 (0.095)
12
Sons nominated before father's death, n.obs=602, K−S = 0.198 (0)
10
Sons' log publications
8
6
4
2
0
0 2 4 6 8 10 12
Fathers' log publications
22Figure E7: Quantile-quantile plot by type of institutions
Families after 1543 in universities, n.obs=841, K−S = 0.131 (0)
12
Families after 1543 in academies, n.obs=311, K−S = 0.17 (0)
10
Sons' log publications
8
6
4
2
0
0 2 4 6 8 10 12
Fathers' log publications
23F Stationarity and time trends in publications
To estimate nepotism and the transmission of human capital across generations, we as-
sume that the human capital distribution is stationary among potential scholars. That
is, among individuals with high human capital endowments who could potentially be-
come scholars—whether they are observed in our dataset or not. This assumption is
standard in the intergenerational transmission literature. That said, estimates for the
intergenerational transmission of endowments, e.g., human capital, are often sensitive
to this assumption; an issue which is rarely discussed (Nybom and Stuhler 2019). In
this appendix, we first discuss the use of the stationarity assumption in the literature
and the sensitivity of our β-estimates on human capital transmission to it. Next, we
show that, under stationarity, our nepotism estimates are a lower-bound to the true
level of nepotism. In other words, assuming a non-stationary environment would lead
to higher levels of nepotism than implied by our already large estimates. In addition,
we use a dataset on all pre-modern scholars (not only fathers and sons) collected
by de la Croix (2021) to examine time trends in observed outcomes. These trends
support the stationarity assumptions for both our nepotism and β-estimates.
F1 Stationarity in the intergenerational literature
Theory. Steady-state assumptions play a critical role in the intergenerational trans-
mission literature, especially when the endowments transmitted from parents to chil-
dren are unobserved (Clark and Cummins 2015; Adermon, Lindahl, and Waldenström
2018; Braun and Stuhler 2018). To see this, consider the first-order Markov process
of endowments transmission discussed in Section 2.2:
hi,t+1 = βhi,t + ui,t+1 ,
yi,t+1 = hi,t+1 + εi,t+1 ,
2
where hi,t ∼ N (µh,t , σh,t ) is an unobserved endowment (human capital) transmitted
from parents t to children t + 1 at a rate β; y is an observed outcome (publications),
noisily related to the latent factor h; and ui,t+1 and εi,t+1 are independent noise terms
with standard deviation σu and σe . Note that here we allow the parameters µh,t and
σh,t to be time dependant. In other words, we do not impose stationarity over the
human capital distribution.
As explained in Section 2.2, we can estimate β by exploiting correlations in y
across multiple generations.2 Specifically, the OLS elasticity of outcome y between
parents and children (b1 ) and the corresponding elasticity between grandparents and
grandchildren (b2 ) are:
2 2
+ σε2 ) ,
b1 = β σh,t+1 / (σh,t+1
b2 = β 2 σh,t+2
2 2
+ σε2 ) ,
/ (σh,t+2
Hence, the ratio b2 /b1 identifies β under the assumption that σh,t+1 = σh,t+2 . That is,
when the signal-to-noise ratio is constant across, at least, three generations: parents,
children, and grandchildren. This condition is satisfied by construction when the
human capital distribution is stationary. However, as explained in Nybom and Stuhler
2
Lindahl et al. (2015), Braun and Stuhler (2018), Colagrossi, d’Hombres, and Schnepf (2019).
24(2019), this stationarity assumption is often implicit, and its importance in estimating
β is rarely acknowledged in the literature.
Evidence. Next, we present evidence supporting the stationarity assumption that
σh,t+1 = σh,t+2 in our setting. Ideally, we would show that, e.g., the standard deviation
of human capital h is constant over time for the entire population of potential scholars.
Since, by construction, we do not observe h, we will focus on trends in the standard
error of the mean for our observed human-capital proxy: publications. To evaluate
a population resembling all potential scholars, we use the dataset collected by de la
Croix (2021) on all pre-modern scholars (not only fathers and sons).
Figure F1 presents trends in the standard error of the mean of publications, in
logs. The sample is all scholars in de la Croix (2021) with a reference date between
1088 and 1800.3 The standard error of the mean is calculated over 25-year intervals.
The figure suggests that, after 1350, the standard error of the mean in log-publications
is extremely stable. This supports the assumption of a stable variance in the human
capital distribution over time, that is, that σh,t+1 = σh,t+2 is satisfied. Admittedly,
the standard error of the mean is much larger before 1350. That said, in our dataset
we only observe 33 families where both father and son’s reference date is before 1350.
In other words, it is unlikely that the large changes in standard error of the mean over
time for these few observations are driving our β-estimates.
Figure F1: Trend in standard error of the mean, log-publications
2 1.5
SEM, log-publications
.5 10
25
25
25
25
00
10
12
14
16
18
-
-
-
-
-
00
00
00
00
75
10
12
14
16
17
Notes: The sample is all scholars in de la Croix (2021) with a reference date between 1088 and 1800.
Standard error of the mean in log-publications calculated over 25-year periods.
F2 Stationarity and nepotism
Theory. So far, we have argued that stationarity is a crucial assumption for the esti-
mation of β, the rate at which unobserved human capital endowments are transmitted
across generations. Our estimates for nepotism are also sensitive to this assumption.
3
An individual’s reference date is based on available information on his birth year, nomination
year, or approximative activity year.
25Here we argue that, under stationarity, our nepotism estimates are lower-bound esti-
mates. We then present additional evidence supporting the stationarity assumption
in our setting.
Specifically, we identify nepotism by exploiting two sets of moments: First, we
exploit correlations in observed outcomes across multiple generations. This moment
allows us to uncover the true rate of human capital transmission across generations
(see discussion above). This will be important to estimate nepotism. Second, we
exploit distributional differences in observed outcomes between fathers and sons who
are at the upper-tail of the human-capital distribution. We argue that the observed
distributional differences may be the result of two forces: on the one hand, nepo-
tism lowers the selected sons’ human capital relative to that of the selected fathers,
generating distributional differences in observed publications. That said, not all the
distributional differences can be automatically attributed to nepotism. The second
force at place is mean-reversion. In detail, if human capital strongly reverts to the
mean, the sons of individuals at the top of the human-capital distribution will perform
worse than their fathers even if no nepotism is at place.
To gauge how much do distributional differences depend on nepotism and how
much on mean-reversion, we follow the literature and assume stationarity in the dis-
tribution of human capital over all potential scholars. The stationarity assumption
and our first set of moments (which identify the rate of human capital transmission β)
allow us to uncover the rate of mean-reversion. That is, how different fathers and sons
are supposed to look like in the absence of nepotism. Hence, any excess distributional
differences, net of reversion to the mean, can be attributed to nepotism.
Formally, imposing stationarity implies that the difference in human capital be-
tween fathers and sons should follow:
hi,t+1 = βhi,t + (1 − β)µh + ωi,t+1 ,
where ωi,t+1 is a shock distributed according to N (0, (1 − β 2 )σh2 ). In the absence
of nepotism, this differences in human capital would be directly translated into the
following differences in publications:
yi,t = max(κ, hi,t + i,t )
yi,t+1 = max(κ, βhi,t + (1 − β)µh + ωi,t+1 + i,t+1 )
If the father-son difference in publications is larger than suggested by the previous
equations, then an additional force must be in place. A force selecting fathers and
sons differently, such that the later can become scholars with lower human capital
endowments. In our setting, this additional force is interpreted as nepotism.
Next let’s consider how our nepotism estimates would change in a non-stationary
environment. That is, an environment where the human capital distribution changes
over time. In our setting, it is reasonable to assume that if the human capital distri-
bution is non-stationary, then it improves over time. Under this scenario, we would
expect fewer sons with lower human capital than their fathers than under stationarity.
This implies that, in the absence of nepotism, we would expect virtually no distribu-
tional differences in publications between fathers and sons. In extreme cases, we would
even expect the sons publication’s distribution to first-order stochastically dominate
that of their fathers. Hence, we would need a larger nepotism parameter to reconcile
26the large observed father-son distributional differences in publications with the small
expected differences. In other words, under stationarity, a share of the father-son
distributional differences is attributed to nepotism, and another to a second force:
mean-reversion. In a non-stationary environment, mean-reversion would explain a
lesser share of the father-son distributional differences, and hence, our nepotism es-
timate would have to be larger. Therefore, we can conclude that, under stationarity,
our nepotism estimates are conservative, lower-bound estimates.
Evidence. The fact that our (already large) nepotism estimates are conservative
estimates is reassuring. That said, we present additional evidence supporting the sta-
tionarity assumption, and hence, that our estimated level of nepotism is not severely
downward biased.
As before, ideally we would show that the mean of the human capital distribution,
µh , is constant over time for the entire population of potential scholars. Since, by
construction, we do not observe h, we will focus on trends in our observed human-
capital proxy: publications. To evaluate a population resembling all potential scholars,
we use the dataset collected by de la Croix (2021) on all pre-modern scholars (not
only fathers and sons).
Figure F2 shows the trend in publications (in logs) on the intensive margin. That
is, conditional on having at least one publication listed in WorldCat. To calculate
trends over time, we use a kernel-weighted local polynomial regression of publications
on a scholar’s reference date. The figure shows no trend in the intensive margin of
publications, supporting our stationarity assumption. If anything, we observe some
fluctuations before 1350, but these show no clear trend and are driven by a smaller
sample in the earlier periods.
Figure F2: Trend in log-publications, intensive margin
15
log(1 + publications), intensive margin
5 0 10
1000 1200 1400 1600 1800
year
kernel = epanechnikov, degree = 0, bandwidth = 11.2
Notes: The sample is all scholars in de la Croix (2021). Trend calculated with a kernel-weighted
local polynomial regression of publications (in logs) on a scholar’s reference date.
Next, we turn to the extensive margin of publications: that is, whether a scholar
has at least one publication listed in WorldCat or not. Figure F3 shows this trend,
again calculated using a kernel-weighted local polynomial regression. The figure shows
a U-shaped pattern for the extensive margin of publications.
27In the initial years, the extensive margin is high because of a selection effect: top
scholars are more likely to be observed before 1350. That said, we have a very limited
number of observations from this period. We only observe 33 families where both
father and son’s reference date is before 1350. In other words, it is unlikely that our
nepotism estimates are driven by these few observations, even if before 1350 the data
does not seem to support our stationarity assumption for the extensive margin of
publications.
Figure F3: Trend in log-publications, extensive margin
1 .8
publications, extensive margin
.2 .4 0 .6
1000 1200 1400 1600 1800
year
kernel = epanechnikov, degree = 0, bandwidth = 11.23
Notes: The sample is all scholars in de la Croix (2021). The dashed line corresponds to the intro-
duction of the printing press.
More importantly, there is a structural break in the extensive margin of publi-
cations around the introduction of the printing press (1450). That said, there are
several reasons to believe that the trend on the extensive margin of publications after
1450 does not reflect a change in the human capital distribution but a change in the
technology for printing and preserving books:
First, it is well-documented that the introduction of the printing press lead to a
massive increase in the diffusion and preservation of scholar’s books (Dittmar 2019).
This alone could explain the observed trend without resort to changes in the human
capital distribution. Formally, we believe this trend is related to our parameter κ, the
measurement error on the extensive margin of publications, and not to µh , the mean
of the human capital distribution among potential scholars. This is supported by our
higher estimates for κ for earlier periods (see Section 4.5).
Second, it is unlikely that this trend reflects changes in the human capital dis-
tribution because such a change would affect the trends in both the extensive and
the intensive margin of publications. The fact the we only observe a trend in the
former suggests that the explanation is related to improvements in the printing and
book-preservation technology.
Finally, note that this increasing trend implies that, around 1450, some sons ben-
efited from the existence of the printing press to publish (and preserve) their work. In
contrast, we are more likely to observe zero-publications for their fathers, whose out-
put was not printed and may have been lost. Correcting for this bias would increase
28the observed father-son distributional differences for this period. Hence, would lead
to larger nepotism estimates.
In sum, the de la Croix (2021) dataset comprising 42,954 scholars shows no trend
on the intensive margin of publications. This supports our stationarity assumption
for the human capital distribution. On the extensive margin, we find evidence of a
structural break around 1450. That said, this is likely related to the changes brought
about by the printing press in terms of book diffusion and preservation, rather than
with a change in the human capital distribution.
29G Robustness to Distributional Assumptions
The model of intergenerational transmission of wealth is almost always based on nor-
mality assumptions on both the initial distribution of wealth hi,t and the distribution
of the idiosyncratic shock ui,t+1 . Given the properties of the normal distribution, and
in particular the fact that it is sum stable, the shape of the distribution remains the
same across all generations once transformed by Equation 5, hi,t+1 = βhi,t + ui,t+1 ,
only its parameters change. This stability property is not just a theoretical curios-
ity. Without this property, we face a lack of coherence in modelling, as the initial
distribution of human capital could not be rationalized by the model itself, its shape
having vanished after one period.
As, in this paper, we are talking about individuals at the very top of the tal-
ent distribution, a relevant question is what such distributions mean for the esti-
mated parameters, and could it be that the arguably massive effects estimated for
the “nepotism” threshold ν are due to these distributional assumptions? An attrac-
tive alternative to normality consists in drawing shocks from fat-tailed distributions,
giving higher likelihood to the emergence of geniuses.
When using shocks from fat tailed distributions, one should we aware that some
targeted moments commonly used when shocks are normal might not be defined.
This is the case for the Pearson correlations and for the mean of the distributions
of human capital. We thus define an alternative objective VS (p) where the Pearson
correlation has been replaced by the Spearman rank correlation, which remains well
defined with any distribution, and we drop the two means from the objective. We
thus have four overidentifying restrictions instead of six. We apply the same SMM
algorithm to this new objective keeping the normality assumption on shocks in order
to define a new benchmark. Table G1 compares the estimation results under the
two different objectives. We first observe that the Spearman correlations ρS are very
close to their Pearson counterparts ρ. The estimated parameters lead to a slightly
higher intergenerational elasticity β, but still within the confidence interval of the
benchmark. The standard errors of the parameters are in general smaller with VS (p),
which might indicates that the estimation with VS (p) is more robust to the exclusion of
possible outliers in the bootstrapped samples. The simulated importance of nepotism
is very similar across the two columns.
We can now analyze the effect of changing the distribution of shocks. There
are three families of distributions where one can write down closed form expressions
for the density and verify directly that their shape is preserved (up to scale and
shift) under addition: Normal, Cauchy and Levy distributions (Nolan 2003). In this
appendix, we implement the Cauchy distribution, which is fat tailed but, unlike the
Levy distribution, still defined over R.
The model where shocks are Cauchy is as follows. A potential scholar in generation
t of family i is endowed with an unobserved human capital hi,t (in logarithms). This is
distributed according to a Cauchy distribution with location xh and scale parameter
γh :
hi,t ∼ Cauchy(xh , γh )
The offspring of this generation, indexed t + 1, partly inherit the unobserved human
capital endowment under the first-order Markov process given in Equation (5). The
noise term ui,t+1 represents an i.i.d. ability shock affecting generation t + 1, which has
a Cauchy distribution, Cauchy(xu , γu ).
30Table G1: Identified parameters.
Objective: V (p) VS (p)
Father-son Pearson corr., intensive margin ρ(yt , yt+1 ) 0.35
Father-son Spearman cor., intensive margin ρS (yt , yt+1 ) 0.36
Grandfather-grandson,
Pearson corr. intensive margin ρ(yt , yt+2 ) 0.20
Grandfather-grandson,
Spearman corr. intensive margin ρS (yt , yt+2 ) 0.23
Intergenerational elasticity of human capital β 0.594 0.662
(0.046) (0.039)
Nepotism ν 7.515 6.055
(1.552) (1.481)
Std. deviation of shock to publications σe 0.340 0.584
(0.128) (0.140)
Threshold of observable publications κ 2.144 2.033
(0.159) (0.139)
Mean of human capital distribution µh 2.383 1.990
(0.410) (0.391)
Std. deviation of human capital distribution σh 3.616 3.743
(0.210) (0.179)
degrees of overidentification 6 4
percentage of nepotic sons 15.6% 16.2%
Notes: τ normalized to 0. S.E. between parentheses obtained by estimating parameters
on 100 bootstrapped samples with replacement
31We assume that human capital among the population of potential scholars is
stationary. Formally we assume that, conditional on the model’s parameters be-
ing constant, the human capital of generations t and t + 1 is drawn from the same
distribution. Formally, hi,t ∼ Cauchy(xh , γh ) and hi,t+1 = βhi,t + ui,t+1 implies
hi,t+1 ∼ Cauchy(βxh + xu , |β|γh + γu ).4 Imposing stationarity leads to the follow-
ing two restrictions:
xu = (1 − β)xh
γu = (1 − |β|)γh .
The publications for fathers, yi,t , and sons, yi,t+1 , in the set of scholar lineages P
are still given by Equations (7)-(8) but the shocks i,t , i,t+1 ∼ Cauchy(0, γe ) (shocks
affecting how human capital translates into publications).
There are three possible variants to the model of the main text (Model I): Cauchy
for all shocks (Model II), Cauchy for human capital and Normal for publications
(Model III), Normal for human capital and Cauchy for publications. Models II and
III are the most appealing ones as they lead to non-normal distribution of human
capital. We consider both of them to look at the robustness of the results.
Table G2: Identified parameters under different model assumptions.
Parameter Mod I Mod II Mod III
Intergen. elast. of human capital β 0.662 0.256 0.446
Nepotism ν 6.055 9.960 9.387
Std. dev. of shock to publications σe 0.584 2.283
Scale of shock to publications γe 0.010
Threshold of observable publications κ 2.033 1.073 0.074
Mean of human capital distrib. µh 1.990
Location of human capital distrib. xh 1.211 0.312
Std. dev. of human capital distrib. σh 3.743
Scale of human capital distrib. γh 1.102 0.970
value of objective V (p) 488 4652 3526
% nepotism 16% 15% 20%
Notes: τ normalized to 0; degrees of overidentification: 6
Table G2 shows the estimation results. Looking first at the value of V (p), it
appears clearly that choosing a Cauchy distribution for the shocks to human capital
considerably deteriorates the fit for the same degree of overidentification. The reason
is that the data cannot be fitted to a distribution with such fat tails. For example,
the gap between the 95th quantile and the median for the distribution of publications
of sons is 4.726 in the data (from Table D1), 5.622 in the simulation with the Normal
distribution, and 7.99 in the simulation with the Cauchy. The two alternative models
also lead to a lower value of β, but leave nepotism unchanged.
4
Because if X ∼ Cauchy(x0 , γ0 ) we have kX + ` ∼ Cauchy(kx0 + `, |k|γ0 ). And if Y ∼
Cauchy(x1 , γ1 ), X + Y ∼ Cauchy(x0 + x1 , γ0 + γ1 ).
32To sum up, using fat tailed distributions for shocks to human capital seems a
priori to be an appealing alternative to the usual normality assumption. They how-
ever do not fit the data, which are very normal after all. Moreover, the estimated
importance of nepotism is robust to assuming such shocks, although the estimated
intergenerational persistence is not.
33H Linearity of β
Our estimation assumes that human capital endowments are transmitted linearly.
That is, that parents with high and low human capital transmit their endowments at
the same rate β. This assumption would be violated, for example, if successful fathers
with a high publications’ record could spend less time with their children, reducing
their human capital transmission systematically. In this appendix, we show empirical
evidence suggesting that in our setting this was not the case and, hence, that our
assumption is satisfied.
To do so, we examine the parent-child elasticity of publications in the intensive
margin. This is one of the moments that we target in our estimation in order to iden-
tify β. In fact, a large literature derives estimates of β directly from such parent-child
elasticities (see Section 2.1 for details). Specifically, here we compare elasticity esti-
mates obtained using OLS (akin to our targeted moments) to elasticities estimated
non-parametrically. The latter allow elasticities to be different in families with dif-
ferent levels of publications, and hence, with different human capital endowments.
We find identical estimates using OLS and non-parametric techniques. This strongly
suggests that the parent-child elasticity of publications is linear. In other words, it is
identical for parents with high and low publications. Altogether, this lends credence
to the assumption that human capital endowments are transmitted at the same rate
by parents with high and low levels of human capital.
Formally, our OLS elasticity estimates, bols , correspond to:
yi,t+1 = c + bols yi,t + ei,t+1 , (H.1)
where yi,t+1 and yi,t are the logarithm of 1 + number of publications for, respectively,
sons and fathers. The sample is all fathers and sons with at least one publication in
WorldCat. That is, bols captures the publications’ elasticity in the intensive margin.
Importantly, this assumes that bols is linear. That is, the publications’ elasticity is
assumed to be the same for parents with high and low levels of publications.
Conversely, non-parametric estimates for the parent-child publication’s elasticity,
np
b , correspond to:
yi,t+1 = g(yi,t ) + ei,t+1 , (H.2)
where the function g(.) does not follow any given parametric form. Instead, it is
derived from the data. In other words, this non-parametric estimation P accounts im-
np j
plicitly for any polynomial form for function g(.)—i.e., g(yi,t ) = c + j bj yi,t for all
j ∈ Z. Hence, it allows elasticities to be different across families with different levels
of publications. The non-parametric elasticity bnp corresponds to the marginal effect
of yi,t .5
Figure H1 compares OLS and non-parametric elasticity estimates graphically. It
shows a scattergram of fathers’ (y-axis) and sons’ (x-axis) publications, OLS fitted
values from Equation (H.1) (dashed line), and non-parametric fitted values and 95%
confidence intervals from Equation (H.2) (thick red line and grey area). Specifically,
the latter plots the smoothed values of a kernel-weighted local polynomial regression
of yi,t+1 on yi,t . To further capture non-linearities, we choose a polynomial of degree
one for the smoothing. The kernel function (epanechnikov), the bandwith, and the
5
This is obtained as averages of the derivatives.
34pilot bandwidth for standard error calculation are set at default values.6 Finally, note
that in this figure the OLS and non-parametric elasticities correspond to the slopes
of the plotted lines.
Overall, the figure shows that there is no statistically significant difference be-
tween the OLS and non-parametric estimates. This holds true at all levels of father’s
publications. For example, for fathers with fewer than 1 log-publications (≤ 20 in
levels), the fitted OLS and non-parametric values are identical. In turn, the parent-
child elasticity in publications (i.e., the slope of the lines) is tightly identified around
0.33 for both estimates. Similarly, for successful fathers with a record of 6 to 10 log-
publications (ca. 1,000 to 60,000 in levels), the fitted OLS and non-parametric values
are identical. The parent-child elasticity of publications is, as before, tightly identified
around 0.33 for both estimates. At the very top of the distribution, we also do not
observe significant differences between OLS and non-parametric estimates, although
the confidence intervals are wider due to fewer number of observations.
Figure H1: Parent-child publications’ elasticity (intensive margin), robustness
15
95% CI non-parametric OLS
Son's log publications
5 0 10
0 5 10 15
Father's log publications
kernel = epanechnikov, degree = 1, bandwidth = .86, pwidth = 1.29
Notes: The sample are families in which the father and the son are scholars with at least one recorded
publication.
Table H1 confirms this pattern for the different periods analyzed in Section 4.5.
Specifically, the table shows the OLS (eq. H.1) and non-parametric (eq. H.2) elas-
ticity estimates for the all families with at least one publication (row 1) and for
the corresponding families: before the Scientific Revolution (1088–1543); during the
Scientific Revolution (1543–1632) and (1632–1687); and during the Enlightenment
6
The STATA program lpoly calculates a rule-of-thumb (ROT) bandwidth estimator. The default
pilot bandwidth for standard error is 1.5 times the value of the ROT bandwidth selector.
35(1688–1800). The only period where estimates vary is before 1543, although the OLS
and non-parametric estimates are not statistically different from each other. This is
because the number of observations is small. For the remaining historical periods,
the OLS and non-parametric estimates are almost identical. For example, during the
Enlightenment the parent-child elasticity is tightly estimated around 0.401 (OLS) and
0.403 (non-parametric).
Table H1: Parent-child publications’ elasticity (intensive margin), robustness
OLS non-parametric
elasticity elasticity
[1] [2]
All 0.333*** 0.335*** N=820
(0.030) (0.034)
Pre-Scientific Revolution (1088–1543) 0.090 0.245 N=70
(0.111) (0.157)
Scientific Revolution (1543–1632) 0.316*** 0.324*** N=173
(0.069) (0.074)
Scientific Revolution (1632–1687) 0.326*** 0.326*** N=229
(0.055) (0.053)
Enlightenment (1688–1800) 0.401*** 0.403*** N=348
(0.046) (0.055)
Notes: The sample are families in which the father and the son are scholars with at least one
recorded publication; Column [1] reports bols from equation (H.2), column [2] bnp from equa-
tion (H.1); Non-parametric standard errors obtained with 1,000 bootstrapped replications;
*** pYou can also read