University of Bolton Access and participation plan 2020-21 to 2024-25 - University of ...
←
→
Page content transcription
If your browser does not render page correctly, please read the page content below
University of Bolton
Access and participation plan 2020-21 to 2024-25
1. Assessment of performance
This APP demonstrates that the University is highly successful in attracting one of the most socially inclusive
student populations of any HEI in the country. However, this is a critical factor for the context of this Plan, as
these student groups have differential outcomes that, across the sector, are known and are typically being
targeted for improvement i.e. Black and Minority Ethnic (BAME) students, Students from low socio-economic
backgrounds, Disabled students, and Mature students. Additionally, over 70% are commuter students who
travel from their home either locally or further afield. Their economic and cultural characteristics can lead to
very specific constraints on progression, performance and employment options. Bolton and the surrounding
areas within the Greater Manchester City Region have not enjoyed even limited growth in employment
opportunities or economic growth experienced in other parts of the country. Many of our graduates are, for
a variety of personal and family reasons, unable to relocate in search of employment.

There have been steady improvements in both overall non-continuation and attainment but are still notably
below the sector average for both of these measures. The percentage of University of Bolton (UoB) full-time
first-degree 2016/17 entrants no longer in HE in 2017/18 was 15.7% against a benchmark of 11.7% (latest
HESA PI). This represents a 1.4 percentage point improvement from 2015/16. Our student attainment
figures have improved steadily over the last 4 years, but we are still behind the sector average in 2017/18
with 60.8% of our students achieving good honours degrees compared to a sector average of 76.3%. The
percentage of 2016/17 graduates in work or further study as measured by the DLHE survey saw a 3.2
percentage point drop (82.3% against a benchmark of 92.6%), although part-time progression has improved
to 94.0%, close to our benchmark of 94.9%.

The University recognises that there are some substantial absolute gaps in performance, which we are
seeking to address. We are seeking to enhance the statistical analysis and evaluation skills within our
Professional Services team through the recruitment of a Monitoring and Evaluation Officer and, in the
meantime have commissioned an academic research project with our School of Education and Psychology
to gain further insight into the structural and unexplained gaps. This project is currently underway and will
be completed in early 2020 prior to the start of the plan. We will then enter this APP period with a better
understanding of these gaps and should we need to adjust any of our narrative or targets as a result we will
contact OfS to do so.

The University has made strategic commitment to improve these various aspects through this APP and other
institutional strategies with which it is aligned, and has made substantive progress over the past two years
in implementing key initiatives designed to improve retention, satisfaction and employment. We have
considered the impact on our performance of numbers at our franchise partners and will work with them to
ensure they are contributing to achieving our targets in relevant areas.

1.1 Higher education participation, household income, or socioeconomic status

      Access – data analysis from the OfS Dataset

Recent HESA Performance Indicators show that our student population continues to be one of the most
socially inclusive of any higher education institution in the country and we consistently exceed our access
and participation benchmark indicators in regard to those from low participation, low household income or
socioeconomic backgrounds.

        National KPM 1 – reducing the gap in participation between the most and least represented groups
        (POLAR4 quintiles 5 and 1 respectively)

                                                                                                                1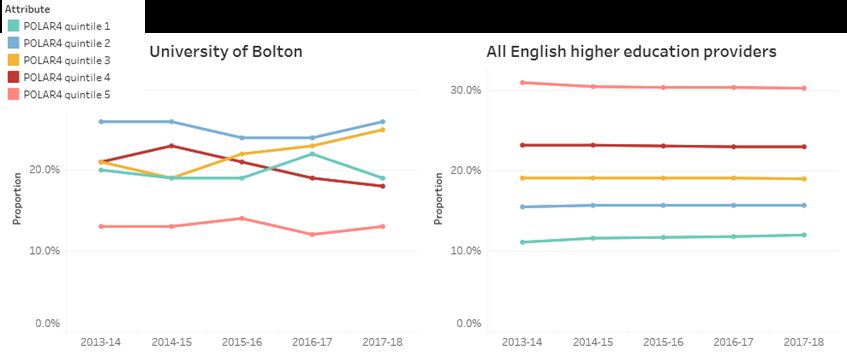
The proportion of students at the University from P4Q1 is 19%. This figure is 6 percentage points higher
than our proportion of students in P4Q5 (13%) thus representing a negative gap. The proportion in Q1
is significantly higher than the national position (12%). Our proportion of full-time students in Quintiles 1
& 2 of Polar4 (P41&2) is 45% (17/18) compared with the national position of 27.7%. Analysis over the past
5 years demonstrates that our position remains strong.
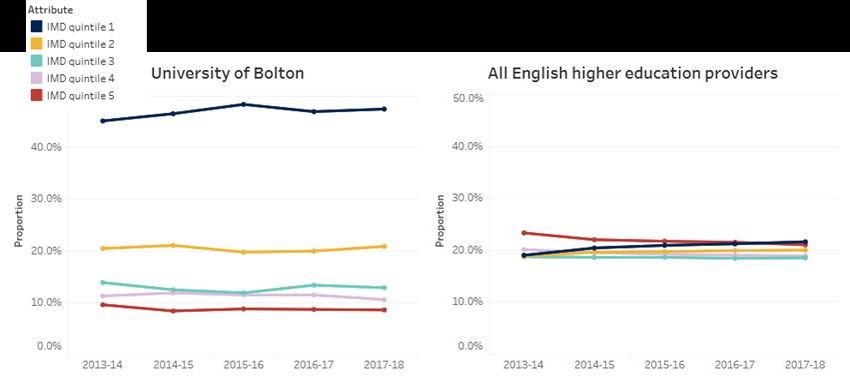
In terms of IMD, the proportion of students in Q1 is 47.4% compared to 8.5% in Q5 representing a negative
gap of 38.9 percentage points. In terms of sector comparisons, IMDQ1&2 is 68.2% compared with the
national position of 41.6%.
Figure 1. Proportion of full-time students in each Polar4 quintile at UoB and graph compared to national.
Source: OFS Dataset
Figure 2. Graph of students in each IMD quintile at UoB compared with national.
Source: OFS Dataset
We have identified a gap of 19 percentage points between P4Q1 (9%) and P4Q5 (28%) for part-time
students. This gap is less than five students and is based on a total population of just 21 students in 2017/18.
Very small changes in the number of part-time students causes large fluctuations in the percentage point
participation gaps for part-time students. We are, therefore, not setting a target for this group, however, we
will continue to monitor our performance for part-time students against this measure.
Success – data analysis from the OfS Dataset
Non-continuation
In the two most recent years of data the University has recorded a negative gap in continuation of P4Q1
students compared to P4Q5 (15/16 = -2pp, 16/17= -1pp). We do however, acknowledge that the gap has
varied over the past five years of data and shows a gap of 10pp in 14/15. We will therefore monitor this
closely to ensure that this gap does not appear again in future years.
2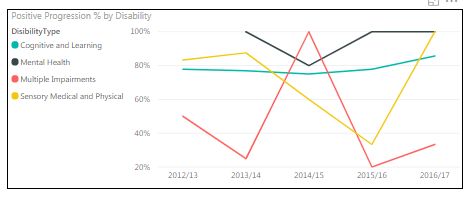
Overall, continuation1 rates for full-time UG students for P4Q1-5 is significantly lower than the national
comparison data but the gap is getting narrower. This is of strategic importance to us as an institution.
Continuation for students in P4Q1 improved from 77% in 2014/15 to 83% in 2017/18, narrowing the gap
between UoB and the national average from 12.4% to 6.2%. Continuation for students in P4Q2 has also
improved over the past 3 years from 79% in 2014/15 to 84% in 2017/18, narrowing the gap between us and
the national average from 12% to 6.9%.In 2017/18 continuation was lowest amongst students in P4Q5 (82%)
against a national average of 94.2%. In fact, continuation rates for UoB students in P4Q5 have regressed
since 2014/15 from 87% to 82% in 2017/18.

Figure 3. National KPM 2 – reducing the gap in non-continuation between the most and least represented groups (POLAR4
quintiles 5 and 1 respectively)

Source: OFS Dataset

In terms of IMD measures, the gap between IMDQ1 and Q5 has reduced to 2pp in 16/17. Both Q2 and Q3
have also improved in recent years. Given that in previous years there has been a more substantial gap we
will monitor this closely to ensure that this gap does not widen again.

While there is a gap of 10pp between IMDQ1 and Q5 for part-time students, the data is less meaningful as
the numbers of students in Q5 has fallen each year from 130 in 11/12 to 30 in 15/16. This fall has resulted
in a dramatic fall in non-continuation in the last two years. We will monitor this gap closely.

                  Attainment

The attainment gap between P4Q1 and Q5 has increased steadily between 2014/15 and 2016/17as
attainment of Q5 has improved and while the gap reduced in 2017/18 to 12pp this remains of concern to
us and we will therefore set a new target to continue to close this gap.

Figure 4. Attainment by POLAR4

    Source: OFS Dataset

1   Subsequent references in this plan are to Continuation rather than Non-continuation, for consistency with targets in Improvement Plan

                                                                                                                                            3
Figure 5. Attainment Quantile 5 compared with quantile 1 percentage point difference for full-time students
Source: OFS Dataset
The gap in attainment between IMDQ1 and IMDQ5 at 25pp was statistically significant for 2017/18 (but not
consistently so year on year), with 53.5% of IMDQ1 attaining a good degree compared to 78.5% of IMDQ5.
That gap is wider than the national gap of 18 percentage points, but has varied substantially year on year
and was less than 6% for 2014/15. We are setting a new target to address this.
Figure 6. Attainment rates of UoB UG students by IMD quintile for full-time students
Source: OFS Dataset
Progression to employment or further study – data analysis from the OFS Dataset
In terms of graduate level employment, progression for full-time UG students for P4Q1-5 is significantly lower
than the national comparison data, in fact there has been a drop in the most recent data against all quintiles
demonstrating the need to work with the University cohort as a whole.
The gap between P4Q1 and Q5 is currently at 5pp. This figure has fluctuated from negative gaps over the
past five years, There is, however very little gap at the University between P4Q1&2 and P4Q3-5. P4Q1&2
progression stands at 53% compared nationally with 69.9%, and for P4Q3-5, progression is at 54%
compared nationally with 73.1%.
When looking at all employment from the DLHE data, we note that the gap between P4 Q1 (77.4%) and Q5
(79.5%) is very small at just 2.1 percentage points.
Our part-time data presents more positive results and in relation to P4Q1, progression stands at 65%
compared to a national figure of 64.2%.
There is a gap between IMD1 (60%) and IMD 5 (65%) of 5pp for full-time students, however, the gap between
IMDQ1&2 and IMDQ3-5 at the University is very small. In relation to IMD data we are closer to national
comparisons at 61% graduate employment for IMDQ1&2 compared to the national position of 69.9%. We
will monitor performance for this measure.
4There has been a lot of fluctuation across IMD Q1 to Q5 for part-time students since 2012/13. From 2013/14
to 2015/16 there appeared to be a trend showing a decrease in progression outcomes for IMDQ1, falling
from 79.5% to 70.8%. Despite the latest year showing an improvement, as there is an increasing gap over
a five year period the University will set a new target.
Figure 7. Progression by IMD Quantile for part-time students
Source: OFS Dataset
1.2 Black, Asian and minority ethnic students
Access – data analysis from the OFS Dataset
The proportion of full-time BAME students in 17/18 was 38.8% representing a rise from 36.3% in 13/14. This
compares with the national position of 31.1%. For part-time students this is 19% compared nationally to
14.6%. This pattern has been consistent over the past 5 years. The proportion of Black students is similarly
higher than the national position 17.5% compared to 13.7%. Our proportion of full-time Asian students is
currently 13.3% compared nationally to 13.7% and we have seen a dip in these numbers over the 5 year
period to 17/18. This, however, is higher than the resident England population of Asians (7.5%) and in the
Bolton area (9.6%). Our proportion of part-time Asian students is strong at 12% compared to 5.4% nationally.
Figure 8. Proportion of UG students at UoB by ethnicity
Source: OFS Dataset
Success – data analysis from the OFS Dataset
Non-continuation
With the exception of 14/15, there has been a consistent gap in BAME non-continuation for full time
students. While not statistically significant, the gap for 16/17 is 7pp.
While continuation figures for Black students has remained steady, with 83% of our Black students
continuing their studies in 2016/17 compared to 85% nationally, there is a gap between Black and White
5students of 4pp. The gap between Asian and White students is wider at 8pp. In 2016/17 79% of our Asian
students continued their studies compared to 90.3% nationally. The gap between Mixed and White is 9pp.
We are therefore setting new targets to address these gaps. While there is a gap between Other and
White of 10pp, the numbers are very small for Other (40 students) so we will not set a target but monitor
performance closely.
The continuation rate for part-time BAME students at the University in 2015/16, was 80%, well above
the sector average at 58.1%. However, this still represents a gap of 5pp between BAME and white part-
time students. This gap has increased over the past four years of data and we will monitor this to ensure
that it is reduced.
Figure 9. Continuation rate of part-time BAME students
Source: OFS Dataset
An analysis of the OfS datasets reveals that there was a 7.7% point gap in continuation rates between part
time white students and part time Asian students in 2015/16. This has increased from a negative gap of
14.3% in 2013/14. The University recognises that the number of part-time Asian students is low (23 of 30
Asian students in 2015/16 continuing) so it will monitor this data and should the gap between part-time Asian
and White students increase in relation to continuation then a target may be set in the future.
In order to better understand any structural and unexplained patterns in the continuation rates of our students
the University has commissioned research specialists in our Psychology department to analyse the last three
years’ of continuation data in greater statistical detail, and build a statistical model of student continuation.
This analysis is designed to recognise the confounding of variables including gender, subject, age, ethnicity,
mode of study, Disability, POLAR4 and IMD classification as predictor variables.
The project will apply linear regression and cluster analysis techniques to deliver probability expectations of
continuation based upon these characteristics. This should help to inform structural and unexplained gaps.
Initial results should be available in the autumn 2019, with the report subsequently available by the end of
the first Semester 2019. We will then commission a second phase to be carried out during the Autumn of
2019, reflecting on the initial outputs and evaluating the approach taken, and reporting back in early 2020
on attainment. We will then enter this APP period with a better understanding of these gaps.
Attainment
We have a much more significant issue regarding the attainment of our BAME students, with significant gaps
in attainment for both Black and Asian student groups and our analysis of the data shows that this gap is
widening for Black students. There are statistically significant gaps in 2017/18 for Black students compared
with White students (30pp) and Black students compared with all other ethnicities (26pp). In 2017/18 38%
of our Black students graduated with good honours compared to 58.9% nationally and compared to 68% of
6our white students. This represents a statistically significant equality gap of 30 percentage points. This gap
is growing in contrast to a marginal decline nationally. We will set a target to deal with this gap.
There is also a statistically significant gap between attainment for White students and all ethnicities except
White (21pp). The underlying principal groups impacting on this gap are Black and Asian which we are
already setting specific targets to address and this will therefore impact on this measure.
Figure 10. Proportions of students at UoB getting a good degree by ethnicity
Source: OFS Dataset
Figure 11. National KPM 3 – reducing the gap in degree outcomes (1st and 2:1s) between white students and black students
Source: OFS Dataset
In 2017/18, 50% of our Asian students graduated with good honours compared to 71.9% nationally,
representing a gap of 21.9%. Our attainment gap has remained steady but still falls significantly below the
national average. The gap between White and Asian students, while not statistically significant in 2017/18
is substantial at 18 percentage points.
Figure 12. Gap between White and Asian UoB Student Attainment
7The attainment rate for part time BAME students in 2017/18 was 45%. This is above the sector average
and on an upward trajectory; however there is still a gap of 25pp between BAME and white part-time
students. The data is too small to disaggregate between specific ethnicities so we will monitor this
performance closely.
Figure 13. Attainment rate for part time BAME students
Please see page 6 for information relating to the proposed statistical analysis of attainment data.
Progression to employment or further study – data analysis from the OFS Dataset
Graduate Level Employment
There is a statistically significant gap of 16 percentage points between Asian and White full-time students at
the University (48% compared with 64%) in terms of graduate level employment.
The gap is smaller between Black full-time at 4pp and the overall graduate level employment rate is 60%,
much closer to the national data at 69.3% and white students at the University of 64%. We will monitor this
gap.
Figure 14. Gap in graduate level employment of full-time Asian compared to White UoB students.
Source: OFS Dataset
For part-time Asian students compared to White students then we need to look at unrounded unpublished
data for 16/17, which shows that 11 out of 18 part-time Asian students went into graduate level employment
(61% compared to 83% - 22pp gap). Given the low numbers, we are not setting a target for this but will
monitor closely.
8Similarly, there is a gap of 22pp between part-time Black and part-time White students going into graduate
level employment but this gap reflects just 8 out of 13 part-time Black students. We will monitor these
numbers and the outcomes for these students during the course of this APP.
Figure 15. Progression by ethnicity for part-time students:
Source: OFS Dataset
All Employment
In terms of students in all employment, there is also a gap for Asian students. This shows a 14 percentage
point gap between Asian (73.8%) and White (87.8%) students.
There is a gap of around 8.5 percentage points in terms of levels of all employment for Black (79.3%)
students compared with White (87.8%) students.
1.3 Mature students
Access– data analysis from the OfS Dataset
The proportion of full-time mature students at the University has grown to 54.5% in 17/18 compared to 27.8%
nationally. 92% of our part-time students are mature compared to 87.4% nationally.
Success – data analysis from the OfS Dataset
Non-continuation
For full time students there is a small negative gap of 1pp in continuation between mature students and
young students. In 2016/17, our continuation rate for full-time mature students was slightly better than the
national average at 85.2% compared to 84.8%. Our continuation rates for mature learners have improved
continually since 2014/15.
There is a gap of 11.9pp between young and mature continuation for mature students. This variation is not
shown on the standard APP dataset as the numbers of PT young for 2015/16 are below the publication
threshold. The table below shows the data using the unrounded OfS dataset:
9Figure 16:Continuation of Part-time undergraduates
Year
Age 2011/12 2012/13 2013/14 2014/15 2015/16
Young 79.5 74.5 75.9 75 93.9
Mature 78.5 81.7 84.4 82.8 82
Gap 1 -7.2 -8.5 -7.8 11.9
The denominator for the PT young 2015/16 which drives the figure of 93.9% that yields the 11.9% gap is
so small that the data is below the publication threshold, and hence is not a meaningful gap.
Overall the proportion of mature students continuing is 82% and significantly above the sector average of
61.8%.
Figure 17. Continuation rates for part-time mature students
Source: OFS Dataset
Attainment
At the University of Bolton there is a gap in attainment between full-time young and mature students of 5pp,
however, this is not statistically significant and is less than the national gap of more than 10 percentage
points. We will look at a further year of data and if it demonstrate a widening of the gap for mature student
attainment we will set a target and update our plan accordingly.
Figure 18. Attainment by age for full-time students
Source: OFS Dataset
Part-time mature student attainment is above the sector average at 66% in 2017/18.
10Figure 19. Attainment rates for part-time mature students
Source: OFS Dataset
Progression to employment or further study – data analysis from the OfS Dataset
Our full-time UG mature students outperform our young students over the past 5 years. In 2017/18, 65.9%
of mature students are in graduate level employment compared with 53.2% of our young students
representing a negative gap of 12.7ppThis however is under the national position of 75.7%. Similarly the
levels of graduates in all employment from DLHE data is higher for our mature students (85.4%) when
compared to our younger students (79.4%)
If we consider those undertaking part-time study, then both young and mature students fare much better.
Progression for part-time mature students it is 82% (75.8% nationally) representing a negative gap of 10pp.
1.4 Disabled students
Access – data analysis from the OfS Dataset
The proportion of full-time disabled students at the University is 17.3% in 17/18 compared to 14.6%
nationally. This is the highest proportion of disabled students over the past 8 years of data. Just 6% of our
part-time students report a disability compared to 14.8% nationally.
We have looked at the proportions of students by Disability Type and noted that we have a higher proportion
than national of students declaring disabilities in almost all categories:
• 4.7% a Mental Health condition (compared to 3.5% nationally);
• 3.1% of students with Sensory, Medical or Physical impairment (not reported nationally on APP
dashboard);
• 6% with cognitive or learning disabilities (compared with 5.5% nationally);
• 1.4% with social or communication impairment (compared with 0.8% nationally).
Success - data analysis from the OfS Dataset
Non-continuation
There is no gap in continuation between our disabled and non-disabled students. Our proportion of disabled
students continuing has remained static at around 84% in line with the national picture.
An analysis of our internal data reveals that the continuation rate for disabled students, both full and part-
time, differs when disaggregating the data. When the data is disaggregated by disability type the numbers
11are small e.g. 2016/17 15 of 20 full-time students with Social and Communication difficulties continued
their studies. The small numbers fluctuate year on year. As a result of small cohorts when disaggregating
data the university is not setting specific targets but will monitor this going forward.
Internal data analysis reveals that there was an increase in the continuation rate for part-time disabled
students in 2015/16 of around 20% but the very small numbers (15 of 18 part-time disabled students
continued in 2015/16) of these students should be noted. Part-time disabled student continuation at the
University has been slightly above the sector average over the last three years.
Figure 20. Continuation rates for part-time disabled students
Source: OFS Dataset
Attainment
The gap between disabled student attainment at UoB compared with non-disabled is 1pp in 17/18. This gap
has emerged following three years of a negative gap but remains better than the national average (1%
compared to 2.8% in 2017/18). The University is aware of this emerging gap and will monitor it closely
throughout the lifetime of this Access and Participation Plan. We will look at a further year of disaggregated
data and if the gap continues to grow we will set a target and update our plan accordingly.
Figure 21. Attainment by disability for full-time students
Source: OFS Dataset
Part-time disabled student numbers are low and, consequently, there are no OfS publishable results for
attainment. Whilst the attainment rate for part time students with sensory medical and physical impairments
as well as cognitive learning difficulties has decreased, the numbers are so small that in some years there
is no publishable data available.
12Figure 22. National KPM 4 – reducing the gap in degree outcomes (1st and 2:1s) between disabled and non-disabled
students
Source: OFS Dataset
Progression to employment or further study – data analysis from the OfS Dataset
There is no gap in progression between those with a disability and those without at the University. The
proportion of full-time UG students with a declared disability who progress to graduate level employment
and/or further study is lower than the national figure of 71.5%, and currently stands at 60%.
If we look at the DLHE data for graduates in all employment there is a small non-significant gap of 5.5 pp for
disabled students (78.6%) compared to those without a disability (84.1%).
Full-time progression shows a reduction in percentage for students with Mental Health and Social
Communication disabilities. Whilst mental health sees the most significant dip and is down 39.6pp to 31.8%
in the most recent year, the total population is just 22 students.
Figure 23. Progression by disability type for full-time students
Source: OFS Dataset
Positive destination figures for our part-time cohort of those with a declared disability (84.21%) are much
stronger and are outperforming students with no declared disability (79.90%) by just under 5pp (as of
2016/17). This compares above the national rate of 66.7% for part-time students.
Part-time progression is again affected by small numbers, which has resulted in greater variation year on
year. The largest population of all disability types in 2016/17 for part time students is Sensory Medical and
Physical with just 8 students.
13Figure 24. Progression by disability type for part-time students
Source: OFS Dataset
As a result of the small cohorts, we are not setting specific targets for the disaggregated disabilities but the
University will address improvements within its strategic measures, and will ensure that progression across
the different disability types is reported and monitored through data sets and targeted interventions.
1.5 Care leavers
Access – data analysis from UoB data
The number of care leavers at the University is very small and it has not been possible to ascertain a national
figure for comparison. Nevertheless, we are aware that the absolute number of care leavers in 2017/18 has
dipped to a low of just 8 students compared with a high in 2016/17 of 27 students. We will therefore commit
to increase the proportion of care leavers at the University during the course of this APP but are not setting
a target given the very small numbers and proportions involved.
We are committed to working with our local councils to understand the number of care leavers in the system
and the proportion of those going into higher education so that we can benchmark ourselves more effectively
in the future and potentially set new targets.
Success and Progression – data analysis from UoB data
Given that our current number of care leavers is very low we have not been able to conduct a meaningful
analysis of the success and progression of these students. When the numbers increase we will ensure that
we are evaluating any gaps in performance against the wider student population for these measures.
1.6 Intersections of disadvantage
Access – data analysis from UoB data
The gap for intersection of deprivation quintile and ethnicity is just 0.9% (full-time UG) between
IMDQ1&2 white (34.5%) and IMDQ1&2 non-white (33.6%). Both are higher than those students in IMDQ3-
5 and white (26.1%) and non-white (5.8%) and ahead of the national position of around 21%. Similarly, the
intersection between POLAR4 and ethnicity outperform the national position.
We have a gap between male and female participation overall (highlighted below). The intersection of
deprivation quintile and sex also shows a gap between those in P4Q1&2 and male (26.95) and female
(41.3%). Again, participation from these intersections is higher than the national average for both male
(17.7%) and female (23.9%). The gap for the intersection between POLAR4 and sex, the gap is much
14smaller, with just 2 percentage points between P4Q1&2 males (21%) and females (23%). Again, these are
much higher than the national position for P4Q1&2 males (12%) and females (15.7%).
We have identified a falling proportion of male full-time
undergraduates at the University. Although this falling
proportion (39.4% in 17/18 compared nationally to 44.1%) is
as a direct result of a rapidly growing Adult Nursing course
which started in 2014/15, our overall numbers of male
students has fallen to 730 in 17/18 from 780 in 13/14.
Figure 25. Proportion of UoB full-time UG Entrants by Gender
Source: OFS Dataset
Reported in our E&D Report 2016-17, in the overall Bolton population, women very slightly outnumbered
men in 2015-16, making up 50.4% of the total population (all ages), which is a slight decrease from 2001
(51.3%) as male life expectancy has been increasing over the past decade to become more in line with
females. From the ONS Subnational population projections for England: 2016-based, looking more
specifically just at age 18, it is projected that in 2020 in Bolton there will be 1683 males (52.1%) and 1549
females (47.9%). By 2024 these figures will increase to 1957 males (53.3%) and 1716 females (46.7%).
While there is clear evidence of underrepresentation at UoB of males compared to the population generally,
more detailed analysis shows that there is a gap of 14 percentage points between male mature students
(46%) and female mature students (60%) at the University.
Our proportion of mature students is significantly higher than the national average for both male and female
and these proportions have not deteriorated over the past 5 years. Given this we are not setting a target
around this particular measure.
We have also noted a gap between white males in Polar4 Q1&2 (42.6%) compared to white females in Q1&2
(57.4%) This proportion has also been falling due to the Nursing courses mentioned above. Given that the
proportion of male students from Q1&2 is still much higher than the national figures we are not setting a
target around this particular measure.
Success – data analysis from UoB data
Non-continuation
The continuation rate for male students from P4Q1&2 improved by 3 percentage points from 77% in
2014/15 to 80% in 2016/17 (national 88.7%). The rates between male and female students from P4Q1&2
differed by 7 percentage points in 2017/18. However, this gap is not specific just to P4Q1&2 and again
suggests we should focus on male students overall (albeit including those from low participation
backgrounds) as discussed in section 1.7.
Continuation rates amongst our female students from P4Q1&2 have improved by 8 percentage points from
79% in 2014/15 to 87% in 2016/17, with the gap to national reduced to 4.3% in 2016/17.
Continuation rates for BAME students from P4Q1&2 at UoB have fluctuated although we have concluded
that the key driver for continuation is BAME rather than the intersections with POLAR.
15We have identified a problem with continuation rates of male students at the University. Having carried out
further analysis of the intersection of males with other underrepresented groups we conclude that the driver
for this issue is gender and not the intersections with gender as there are gaps across most areas as shown
below:
Figure 26. Continuation by gender
Intersection Male Female Gap
Mature 75.2% 87.4% 12.2pp
White 81.4% 86.7% 5.3pp
Asian 54.9% 84.8% 29.9pp
Black 68.9% 86.9% 18pp
With disability 75.9% 85.3% 9.9pp
IMD1 69.8% 85.5% 15.7pp
IMD2 71.8% 85.2% 13.4pp
Source: Continuing or qualified as % of population inferred from OfS APP Dataset
Attainment
Nationally, the number of BAME students from P4Q1&2 gaining a good honours degree has increased by
4.4 percentage points between 2015/16 and 2017/18 from 65.7% to 70.1%. At UoB, this number has
decreased from 50% in 2015/16 to 45% in 2017/18. A discussed above, we will target BAME student
attainment generally, including but not just from P4Q1&2.
Nationally, attainment rates for female students from P4Q1&2 has improved steadily from 75.4% in
2015/16 to 78.3% in 2017/18.Similarly, the number of female students from P4Q1&2 graduating with a good
honours degree has increased by 12 percentage points in three years from 54% in 2015/16 to 66% in
2017/18, narrowing the gap to national by 9.1 percentage points from 21.4% to 12.3% in 2017/18.
Progression – data analysis from UoB data
The group most notably below the University and sector average for graduate-level employment are those
from Asian backgrounds, but full-time young male students across all ethnicities also require attention.
Both mature, Asian, full-time UG students (48%) and young, Asian, part-time UG students (47%) require
further support to improve their progression to highly skilled employment and further study. Whilst Black,
mature, full-time and part-time students are faring much better, Black, young, full-time UG students have
fallen from 61% in 2015/16 to 43% in 2016/17.
Figures 27. Intersectional effect of ethnicity and age on rates of attaining positive progression for full time students:
2014/15 2015/16 2016/17
Asian, young female 58% 75% 55%
Asian, young male 57% 50% 38%
Black, young female 80% 54% 46%
Black, young male 58% 70% 38%
White, young female 54% 60% 47%
White, young male 60% 73% 63%
Source: OFS Dataset
16The table above shows variation across the three-year period. The only group where males are
outperforming their female counterparts is with young White students. If we cross check this data further
with P4, then White, young, female P4Q1&2 UG students have a progression rate of 47% against their male
counterparts at 56%. The overall level of employment of our graduates is of strategic importance to the
University.
1.7 Other groups who experience barriers in higher education
Success – data analysis from UoB data
There is a statistically significant gap of 9 percentage points in
the continuation rates of males (79%) compared with females
(88.6%) at the University. This is wider than the national gap of
2.8 percentage points.
Figure 28. Male and female student continuation at UoB.
Source: OFS Dataset
2. Strategic aims and objectives
2.1 Target groups
Access
Although we are meeting our benchmarks and objectives in most areas of our access performance, we will
commit to monitoring this performance to ensure that participation levels for each of the under-represented
groups remains strong and in line with our recent performance.
As a socially-inclusive institution all of our recruitment and outreach activity is targeted at under-represented
groups and this is reflected in the proportion of students that fall into one or more of the five core under-
represented groups (98.6%). The institution’s strategic approach to access and participation is very much
embedded within all of our activity; however, we will make adjustments and develop additional strategic
measures should our performance change during the course of this plan. Given this commitment, we will
continue to invest in initiatives and interventions to target these groups.
In line with this commitment, we have adjusted our reported investment in access activity. This now includes
investment in outreach activity which can be directly attributed to one or more of the five underrepresented
groups. Given that such a large proportion of our students (98.6%) fall into one or more of these groups, it
could be argued that all of our marketing and recruitment spend is directed at access students, however, for
the purposes of reporting investment we have not included this wider spend.
In terms of participation, we are setting internal targets to address a decline in the absolute numbers of male
students attending the institution. From our analysis of the data, we conclude that the driver for this is gender
rather than the intersections with any underrepresented groups and we are therefore not setting any targets
as part of this APP. We are also committing to improving the number of care leavers joining the university
during the life of this plan.
17Success
We have outlined in this plan our ongoing strategic focus on improving the continuation rates of all
undergraduate students at the university. We have noted a particular problem with continuation rates for
male students as a whole, the driver for this is gender rather than the intersections of male with other
underrepresented groups.
We have identified gaps in continuation amongst BAME students and are setting targets to reduce these
gaps for Black, Asian and Mixed students.
In terms of attainment, we will put strategic focus on improving the attainment levels of BAME students (with
specific focus on Black and Asian students) to reduce the gap in attainment compared with white students.
Additionally we will set new targets to reduce the attainment gap between POLAR4 Q1 and Q5 and IMD Q1
and IMD Q5.
Progression
It is a strategic priority for the institution to improve employment and graduate level employment for all
students at the University. Our analysis has shown that there are gaps in a number of areas (Polar4,
Disability and Ethnicity) in terms of the number of graduates going into all employment, which we intend to
monitor.
We have identified a particular problem with graduate employment levels amongst our full-time Asian
students and these will also be of particular focus.
Furthermore, due to an increasing gap over time we will aim to reduce the gap between IMDQ1 and IMDQ5
part-time students.
2.2 Aims and objectives
Access
1. The University aims to maintain its strong performance in terms of participation from all
underrepresented groups. We will continue to invest in outreach activities and specific interventions
for these students in order to do this.
2. The University will commit to sign the Care Leavers Covenant and to closer working relationship with
Bolton Council and Bolton College in order to increase the number of care leavers entering the
University.
Success
The University is committed to equality of outcomes for our students and it setting ambitious targets to
either completely remove the gaps or significantly reduce them within this five-year plan. We recognise
that there are continuation and attainment gaps for our BAME students and attainment gaps for our
students from low participation and low socio economic backgrounds.
18We are carrying out further analysis of continuation and attainment via our psychology department during
2019/20 and will commit to review these targets before the start of this plan in September 2020 based
on new data and evidence.
Continuation
3. To remove the gap between Black and White full-time undergraduate students continuing their
studies from 4pp in 2017/18 to 0pp in 2024/25.
4. To remove the gap between Asian and White full-time undergraduate students continuing their
studies from 8pp in 2017/18 to 0pp in 2024/25.
5. To reduce the gap between Mixed ethnicity and White full-time undergraduate students continuing
their studies from 9pp in 2017/18 to 2pp in 2024/25 and will aim to close the gap entirely within 10
years.
Attainment
6. To reduce the gap between Black and White full-time undergraduate students achieving a good
degree (1st or 2:1) by 15 percentage points from 30% in 2017/18 to 15% in 2024/25. We are setting
an ambitious target over a 5 year period however acknowledge that is likely to take longer to close
the gap completely to attainment levels for white students (currently at 68%) and will aim to do so
within 10 years.
7. To reduce the gap between Asian and White full-time undergraduate students achieving a good
degree (1st or 2:1) by 15 percentage points from 18% in 2017/18 to 3% in 2024/25. We are setting
an ambitious target over a 5 year period however acknowledge that is likely to take slightly longer to
close the gap completely to attainment levels for white students (currently at 68%) and will aim to do
so within 10 years..
8. To reduce the gap between P4Q1 and P4Q5 full-time undergraduate students achieving a good
degree (1st or 2:1) by 5 percentage points from 10% in 2017/18 to 5% in 2024/25. We are setting
an ambitious target over a 5 year period however acknowledge that is likely to take longer to close
the gap completely of attainment levels between these groups and will aim to do so within 10 years..
9. To reduce the gap between IMDQ1 and IMDQ5 full-time undergraduate students achieving a good
degree (1st or 2:1) by 10 percentage points from 25% in 2017/18 to 15% in 2024/25. We are setting
an ambitious target over a 5 year period however acknowledge that is likely to take longer to close
the gap completely of attainment levels between these groups and will aim to do so within 10 years..
Progression
Achieving positive employment outcomes for all our students in the University’s number one priority in
the coming years. We have identified that some of our students are more likely than others to be in
graduate level employment following graduation and we will work to significantly reduce these gaps in
outcomes during the course of this plan.
1. To reduce the gap between IMDQ1 and IMDQ5 part-time undergraduate students going into
graduate level employment/further study from 17.5 percentage points in 16/17 to 7.5 percentage
points in 2024/25.
2. To reduce the gap between Asian and White full-time undergraduate students going into graduate
level employment/further study from 16 percentage points in 16/17 to 6 percentage points in 2024/25.
193. Strategic measures
3.1 Whole provider strategic approach
Overview
Our diversity is one of our distinctive features and we are stronger and add greater value as a result. We
take seriously our responsibilities to understand the needs of our students and tailor our learning
opportunities to help them succeed, despite any structural, economic and cultural constraints. We have
developed a Theory of Change to enable the University to close or narrow gaps in access and outcomes of
underrepresented groups by 2024/25 (see diagram on page 22).
In working to achieve this overarching goal we intend to deliver on three core outcomes:
• Maintain rates of participation at the University of Bolton of underrepresented groups and improve
participation for Care Leavers
• Ensure that every student at the University of Bolton has the same opportunities to succeed
• Reduce or eliminate progression gaps between underrepresented groups in Graduate
Employment.
We will employ an evidence informed approach to designing our strategic measures, which will include but
not be limited to:
• Statistical Analysis Project
• Self-assessment Evaluation
• Evaluation of interventions and new initiatives
• Office for Students A-Z Best Practice
• Specific External Research e.g. UUK/NUS BME Report.
Taking a whole provider approach our strategic measures are detailed within this document referencing
appropriate evidence where possible not withstanding that we intend to carry out further analysis in the run
up to 2020 and during the course of the plan. Our overarching strategy is to focus on developing new
‘Platinum’ programmes that attract well-qualified applicants, regardless of background, and deliver higher
than average outcomes, including student retention and professional employment. The Platinum Strategy,
now underway for three years, seeks to fundamentally transform the institution into a “Teaching Intensive,
Research Informed (TIRI) University”. As part of this bold agenda, the University has been reshaping its core
academic provision with the creation of a strong “Course based student eco-system”, where each
programme recruits and sustains a large enough critical mass of learners of high quality to provide cohort
cohesion and team spirit amongst students. These student groups create strong learning communities and
enhance the overall student experience, supported by sufficiently varied high quality academic staff teams
in the respective disciplines, whose research directly informs the teaching and student learning experience.
A suite of actions is being implemented as enablers to complement and underpin the development of our
Platinum programmes in order to achieve tangible further improvements in student continuation and
attainment outcomes:
• Commitment to Invest and Resource the strategic measures and evaluation
• Communications Plan and Raising Awareness of equality gaps amongst the academic and
professional support community in pursuance of our goal
• Expanding our Data Analysis Capabilities and Expertise and development of an Evaluation
Framework
• Commitment to adopting and sharing Best Practice
• Enhancing our Staff Development and Training programme.
In order to monitor our performance and adapt and adjust our strategic measures in a timely manner we are
putting in place monitoring and evaluation protocols designed incorporating the wider university community.
As detailed elsewhere in this plan these include the following:
20• Evaluation Framework
• Appointment of a Monitoring and Evaluation Officer
• Steering Group
• Student Consultation
• Board of Governors Oversight
The University has committed to invest in the necessary resources to deliver its targets, including new
staffing appointments such as substantial strengthening of our “Employment Team”; and the appointment of
a Monitoring and Evaluation Officer leading improvements to outcomes including retention.
In addition, Baroness Newlove joins the University of Bolton as Pro Vice Chancellor (Access and Widening
Participation). She is a Working Peer, previously working at ministerial level. As a high profile motivational
speaker, presenter and Women’s Champion, she acts as role model, demonstrating through her own
experience that someone from a working class background can become a successful Peer of the Realm.
She will undertake regional outreach and play a leading role in University Open Days, aiming to inspire
students from diverse backgrounds to achieve their aspirations. She not only believes that victims of crime
need to be supported, but also that those who can be seen as victims of their own family circumstances or
background should receive the support from the educational system to help realise their full potential. She
retains her connections in the national political arena, whilst also increasing the profile of the University
including through external visits and TV/Radio appearances.
Our radical new approach to our institutional philosophy (TIRI) and our course portfolio strategy (Platinum
Courses) since 2015-16 is already demonstrating tangible dividends in student continuation and completion,
confirming the appropriateness of our bold approach.
21The University of Bolton Access and Participation Theory of Change
GOAL:
Close or Narrow gaps in Access and
Outcomes for Underrepresented Groups
at the University of Bolton by 2024/25
Maintain rates of
participation at the Reduce or eliminate
Ensure that every student
University of Bolton of progression gaps
at the University of
underrepresented groups between
Bolton has the same
and improve underrepresented groups
opportunities to succeed
participation for Care in Graduate Employment
Leavers
Evaluation of Specific External
Office for
Statistical Self-assessment interventions Research e.g.
Students A-Z
Analysis Project Evaluation and new UUK/NUS BME
Best Practice
initiatives Report
Strategic Lead
Partnership Mission HE
for Outreach –
Access
Work with Local Project / Maths
Appointment of
Authorities – Club / Boys
Baroness
Care Leavers Brigade / Chess
Newlove Mentoring e.g.
Platinum PASS and Peer
Revision of our Student Support Agenda: Mentors Assessing our
LEAP and
Success
Teaching Investment in 1) Strong Demand
Equality and
Diagnostics/Early 2) Employer Links
Assessment Mental Health Engagement e.g. Diversity
Intervention 3) Student
Adapt and Adjust
Adapt and Adjust
Strategy and Wellbeing Satisfaction Student Priorities
4) Outcomes Employment
GAME – Interns
Progression
Investment in
Graduate
Internships and Employer
Attributes
Placements Engagement
Matrix for
Consultants
Employability
Commitment to Communication Data Analysis Staff
Commitment to
Invest and and Raising Capabilities and Development
Best Practice
Resource Awareness Expertise and Training
Board of
Evaluation Evaluation Student
Steering Group Governors
Framework Officer Consultation
Oversight
22Collaborative work not specifically included in measures below
Children from Military Families & Ex Service Personnel
We are a signatory to the Armed Forces Covenant which is a public pledge demonstrating our support for
the Armed Forces community to ensure they do not face disadvantage in taking HE opportunities. We offer
financial support to ex-service personnel who have completed a minimum of three years in the armed
services. This bursary is worth £500 per year for the normal duration of the course.
Through the Lancashire and North West SCiP (Service Children’s Progression) alliance hubs, we will work
collaboratively with other HEIs across the region to engage young people from military families.
National Network of Collaborative Outreach: NCOP- GM Higher
We are committed to working collaboratively with other HEIs, third sector organisations and employers in the
region through the Greater Manchester Higher partnership to raise awareness of, and encourage
progression to, the full range of HE opportunities. We aim through our collaborative work to:
• Raise the HE participation rate for learners from P4Q1&2 in Greater Manchester
• Increase the proportion of Care Leavers from the 10 Greater Manchester Local Authorities who
progress to HE
The partnership does not currently have the regional data to enable us to set appropriate targets in these
areas but we will commit to developing and delivering these targets during the period of this plan.
Alignment with other strategies
This Plan strongly aligns with the Improvement Plan separately submitted to the OfS, which focuses on
launching these specific new interventions to student continuation, completion, employment and further
study with strategic investments, while revitalising the current successful approaches being implemented
through TIRI. The aim is to achieve a quantum transformative change in our engagement with these issues
and improve the outcomes. We will continue to invest significantly in the academic staff, learning
infrastructure and student support personnel in focussed subject areas.
At the time of writing, we are in the process of refreshing our Learning Teaching and Assessment Strategy.
This is being developed alongside our APP, with the same team members working on both plans, hence
ensuring consistency. We also have an Employability, Enterprise and Apprenticeship Strategy and again the
staff responsible for this strategy have been intrinsic in formulating this APP.
Similarly, we are about to launch a new suite of Equality & Diversity Priorities. A representative from the
Steering Group that oversees development of this Plan has attended the E&D Committee, summarised the
findings identified above in the assessment of performance, and has agreed the measures to be put in place
through this Plan which will be reflected in the new Institutional E&D Priorities.
We have completed the integration of Bolton College (Further Education College) within the University Group
which, amongst much else, will allow us to manage and improve the pathways to higher education for
thousands of learners in the region in a structural fashion (articulating pre-degree provision and enhancing
preparedness to study at HE level). This targeted amalgamation directly supports the delivery of the regional
Skills Strategy while enabling the University to access a wide range of employment sectors and
jobs/employers in the region, directly supporting the aims of this Plan and its continuous improvement.
23The University Group continues to grow and as we form strategic alliances relevant to this APP. The
University sponsors the Bolton UTC. In a strategic alliance with local apprenticeship provider Alliance
Learning we are encouraging local people from all underrepresented groups into further and higher
education, particularly those who might not normally take up further study. The Anderton Outdoor Activities
Centre has recently joined the Group, providing team and confidence building programmes for Bolton
College and University students to support transition into HE, continuation and engagement
Strategic measures
Access
Commitment to improve the participation rate of Care Leavers
Although we have good relationships with the councils in Rochdale and Oldham in relation to looked after
children, there is currently very little shared understanding and collaboration in the Bolton and Bury area. As
a result the number of care leavers at the University is very low.
We will sign the Care Leavers Covenant and will enhance current initiatives and interventions for care leavers
with the aim of increasing the number of care leavers at the University by 2024/25. We are already an active
partner in the ‘Looked After Children Forum’ which is a collaborative project with the other GM Universities
to support progression into higher education.
We currently run a project for year 9 and 10 students in Rochdale and Oldham called ‘Success 4 Life’. This
is a 9-week aspiration and confidence-raising programme to support the acquisition of transferable skills
amongst looked after children. This is part of a wider GM Higher project (non-NCOP funded).
We will continue to offer our Care Leaver Bursary, which is worth £1,000 per year for the normal duration of
the course and will continue our involvement in the Greater Manchester Care Leaver Awards. From 2020
this award will be expanded and offered to part-time students on a pro-rata basis as long as they are studying
for a full undergraduate award. This bursary will be available to full and part-time, home-funded, students
who have been in care for a minimum of 12 months within the last five years.
In order to achieve our objective we will commit to improving our data and understanding of care leavers by
the end of 2020-21 in the local area by working with Bolton and Bury Councils and Bolton College. From
2020, we will bring the ‘Success 4 Life’ project to the local area (Bolton, Bury) and will deliver training to
foster carers and social workers on HE progression. Additionally we will provide funding for looked after
children to attend open and visit days at the University or College.
The success of this measure is dependent on our ability to engage Bolton and Bury Councils in the same
way that we are already successfully collaborating with Rochdale and Oldham Councils.
As recommended via consultation with students, we will explore further opportunities to work with local
community groups, such as Lads and Girls, which could give opportunity to raise the ambitions of Care
Leavers. Current students within our Community Development & Youth Work programme may be able to
foster and develop such links.
24Internal target to increase the number of male students at the University
We are committed to helping male students in the locality and region to raise their aspirations towards higher
education, to help them understand the career roles that are relevant to their interests and skills, to see that
University is affordable and provide options for them to go to University. We will do this through a variety of
initiatives including:
• Working with Boys Brigade in England and Wales through a unique partnership to develop an HE
transition programme
• Our Maths Club initiative working with state schools to raise attainment at GSCE level
• a flagship ‘Mission HE’ project aimed at raising confidence and increasing awareness of HE
pathways amongst white working class males.
• Chess in Schools project
• Enhancing relationships with Bolton Wanderers Football Club and Academy, Bolton College and
Bolton UTC, Princes Trust, Bolton Lads and Girls Club, Duke of Edinburgh and the Scouts.
Success
Measures to Address Continuation and Attainment of BAME, P4Q1 and IMDQ1 Students
Our Early Intervention & Transitional Support Model is designed to provide an inclusive learning
environment and to support student transition. Given the diversity of our student profile, an inclusive, whole
of institution approach to student success is essential and our Early Intervention (EI) model is designed
specifically to help us achieve our aim of improving continuation and attainment rates 2024/25.
Nevertheless, whilst the Early Intervention approach is designed to improve the continuation rates of all of
our students, it also enables us to specifically address the support needs of our most vulnerable student
groups and where we have identified gaps in continuation and/or attainment, such as BAME, Polar4 and
IMD as identified in our strategic aims and objectives shown in section 2. Our diagnostics approach enables
us not only to identify these students but also examine the intersectionality of their characteristics.
Consequently, we have detailed information about which students are more likely to face significant barriers
to learning and participation in our HE environment. This is cross-referenced with sector-wide best practice
to assure consistency of approach. We can not only identify students from BAME backgrounds, mature
students, part time students and those from deprived areas (using IMD) but we can assess their
preparedness for learning by reviewing their profile and responses to the LEAP questionnaire. This allows
us, via academic tutoring, to provide tailored support to improve their prospect of continuation through the
development of key “actionable insights” which are based on evidence from interventions that have high
impact. At the same time, tutors are being trained to better understand how to raise student attainment
and aspiration, through involving them in analysis of our continuation and attainment gaps, focussing
specifically on vulnerable student characteristics and implementing actionable insights. We also use this
information to match students with an appropriate tutor who is equipped to support their learning journey.
Tutors are therefore better equipped to have a structured learning conversation with students who are most
likely to face significant barriers to continuation.
We have a ten-point action plan, specifically designed to enhance student engagement and student learning
development. Six of these action points relate directly to interventions/enhancements specifically designed
to improve rates of continuation and attainment for our student groups:
(1) Bolton Student Lifecycle Journey Mapping
(2) Early Intervention & Transitional Support – Bolton “LEAP Ahead” Diagnostics (formerly Skills
Checks) and Enhanced (Senior) Academic Tutoring
25You can also read