Spatial and temporal patterns of global soil heterotrophic respiration in terrestrial ecosystems
←
→
Page content transcription
If your browser does not render page correctly, please read the page content below
Earth Syst. Sci. Data, 12, 1037–1051, 2020
https://doi.org/10.5194/essd-12-1037-2020
© Author(s) 2020. This work is distributed under
the Creative Commons Attribution 4.0 License.

      Spatial and temporal patterns of global soil heterotrophic
                respiration in terrestrial ecosystems
         Xiaolu Tang1,2 , Shaohui Fan3 , Manyi Du4 , Wenjie Zhang5,6 , Sicong Gao6 , Shibin Liu1 , Guo Chen1 ,
                                           Zhen Yu7,8 , and Wunian Yang1
                    1 College of Earth Science, Chengdu University of Technology, Chengdu 610059, China
      2 State Environmental Protection Key Laboratory of Synergetic Control and Joint Remediation for Soil & Water
                             Pollution, Chengdu University of Technology, Chengdu 610059, China
        3 Key laboratory of Bamboo and Rattan, International Centre for Bamboo and Rattan, Beijing 100102, China
           4 Experimental Center of Forestry in North China, Chinese Academy of Forestry, Beijing 102300, China
       5 State Key Laboratory of Resources and Environmental Information System, Institute of Geographic Sciences

                                     and Natural Resources Research, Beijing 100101, China
                   6 School of Life Science, University of Technology Sydney, Ultimo, NSW 2007, Australia
                7 School of Applied Meteorology, Nanjing University of Information Science and Technology,

                                                    Nanjing 210044, China
         8 Department of Ecology, Evolution, and Organismal Biology, Iowa State University, Ames, IA 50011, USA

                Correspondence: Shaohui Fan (fansh@icbr.ac.cn) and Wunian Yang (ywn@cdut.edu.cn)

                                 Received: 16 July 2019 – Discussion started: 3 September 2019
                           Revised: 26 March 2020 – Accepted: 7 April 2020 – Published: 7 May 2020

      Abstract. Soil heterotrophic respiration (RH) is one of the largest and most uncertain components of the ter-
      restrial carbon cycle, directly reflecting carbon loss from soils to the atmosphere. However, high variations and
      uncertainties of RH existing in global carbon cycling models require RH estimates from different angles, e.g.,
      a data-driven angle. To fill this knowledge gap, this study applied a Random Forest (RF) algorithm (a machine
      learning approach) to (1) develop a globally gridded RH dataset and (2) investigate its spatial and temporal
      patterns from 1980 to 2016 at the global scale by linking field observations from the Global Soil Respiration
      Database and global environmental drivers (temperature, precipitation, soil water content, etc.). Finally, a glob-
      ally gridded RH dataset was developed covering from 1980 to 2016 with a spatial resolution of half a degree and
      a temporal resolution of 1 year. Globally, the average annual RH was 57.2 ± 0.6 Pg C a−1 from 1980 to 2016,
      with a significantly increasing trend of 0.036 ± 0.007 Pg C a−2 . However, the temporal trend of the carbon loss
      from RH varied in climate zones, and RH showed a significant and increasing trend in boreal and temperate
      areas. In contrast, such a trend was absent in tropical regions. Temperature-driven RH dominated 39 % of global
      land and was primarily distributed at high-latitude areas. The areas dominated by precipitation and soil water
      content were mainly semiarid and tropical areas, accounting for 36 % and 25 % of global land area, respectively,
      suggesting variations in the dominance of environmental controls on the spatial patterns of RH. The developed
      globally gridded RH dataset will further aid in the understanding of the mechanisms of global soil carbon dy-
      namics, serving as a benchmark to constrain terrestrial biogeochemical models. The dataset is publicly available
      at https://doi.org/10.6084/m9.figshare.8882567 (Tang et al., 2019a).

Published by Copernicus Publications.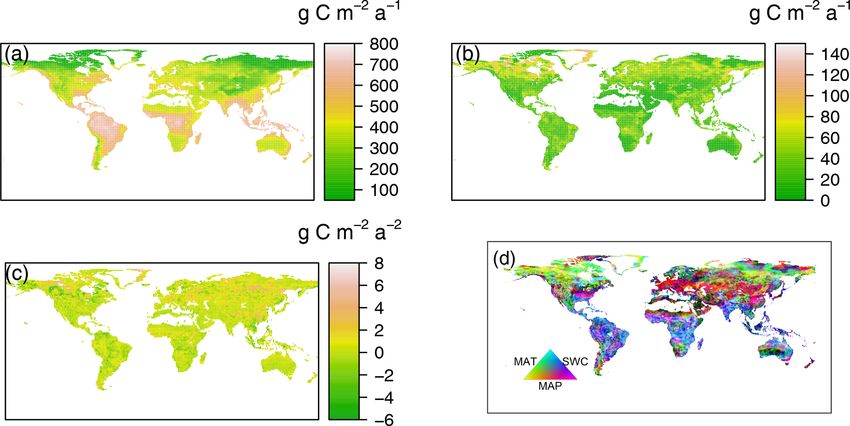
1038                                     X. Tang et al.: Spatial and temporal patterns of global soil heterotrophic respiration

1   Introduction                                                   2010a; Zhou et al., 2016). Hashimoto et al. (2015) and Bond-
                                                                   Lamberty and Thomson (2010b) predicted global soil respi-
Global soils and surface litter store up to 2 or 3 times the       ration rates using climate-derived models driven by tempera-
amount of carbon present in the atmosphere (Trumbore,              ture and precipitation; however, these models commonly ex-
2009), and therefore a small change in soil carbon content         plain less than 50 % of variations in soil respiration, requiring
could have profound effects on atmospheric CO2 and climate         new techniques and potential new numerical and algorithmic
change (Köchy et al., 2015). Although global carbon flux           methods to better quantify and understand the large-scale soil
from soil-to-atmosphere is increasing (Zhao et al., 2017), the     carbon fluxes (Bond-Lamberty, 2018). To improve model-
degree to which future climate change will stimulate soil car-     ing accuracy, more recent studies have used linear regres-
bon loss via heterotrophic respiration (RH) remains highly         sion or machine learning approaches including more abiotic
uncertain (Bond-Lamberty et al., 2018; Friedlingstein et al.,      or biotic variables, such as soil carbon supply, soil properties
2014; Trumbore and Czimczik, 2008), particularly for areas         and NPP (Hursh et al., 2017; Zhao et al., 2017), and obser-
with a high temperature sensitivity or rapid changes in pre-       vations collected from newly published measurements (Jian
cipitation frequency and intensity.                                et al., 2018; Zhao et al., 2017). On the other hand, includ-
   Soil RH represents the carbon loss from the decomposi-          ing more variables in linear or nonlinear regression models
tion of litter detritus and soil organic matter by microorgan-     may cause overfitting and autocorrelation issues (Long and
isms (Subke et al., 2006), accounting for one of the largest       Freese, 2006). To overcome overfitting and autocorrelation,
components of the terrestrial carbon cycle (Bond-Lamberty          machine learning approaches, such as the Random Forest
et al., 2016). However, RH’s feedback to climate variability       (RF, Breiman, 2001), have been applied to explore the hierar-
is poorly understood. RH could affect future climate change        chical importance of environmental factors, such as temper-
via the mineralization of long-stored soil carbon, offsetting      ature, soil water content (SWC), NPP and soil pH (Hursh et
net primary production (NPP) and even converting terrestrial       al., 2017). Machine learning techniques are highly effective
ecosystems from a carbon sink to a carbon source (Trem-            because they are fully data adaptive, do not require initial as-
blay et al., 2018). Conversion of the sink or source role de-      sumptions on functional relationships and can function with
pends on how strongly large-scale processes are affected by        nonlinear dependencies (Bodesheim et al., 2018). Therefore,
environmental drivers, e.g., temperature, precipitation, and       these approaches are beginning to see use in Earth science,
soil organic carbon content (Hursh et al., 2017; Sierra et al.,    particularly in carbon and water flux modeling (Jung et al.,
2015), or extreme conditions, e.g., fire, human disturbance,       2010, 2017; Yao et al., 2018b), and may provide more re-
and drought (Kurz et al., 2013; Metsaranta et al., 2011). Al-      liable estimates of soil respiration (Bond-Lamberty, 2018;
though it is widely recognized that warming enhances CO2           Zhao et al., 2017). However, no study to date has assessed the
release from soils, the magnitude of such release is uncertain     global variability of RH using empirical field observations to
due to variations in the temperature sensitivity of soil organic   bridge the knowledge gap between local, regional and global
matter decomposition (Suseela et al., 2012). In addition, en-      scales.
vironmental drivers of RH, e.g., temperature and soil mois-           The newly emerged Dynamic Global Vegetation Models
ture, are still undergoing changes under climate warming and       from the TRENDY model ensembles and Earth System Mod-
can affect RH individually or interactively. Therefore, reduc-     els have been widely used to investigate major physiological
ing RH uncertainty and clarifying the response of RH to en-        and ecological processes and ecosystem structures, providing
vironmental factors are both essential for future projections      a novel database and approach to examine and estimate RH
of the impact of climate change on the terrestrial carbon bal-     at the global scale (Zhu et al., 2017), although RH improve-
ance.                                                              ments in Earth System Models are still required (Shao et al.,
   Due to the diurnal, seasonal and annual variability in          2013). TRENDY and Earth System Model simulations incor-
RH, in addition to the difficulties of large-scale measure-        porating a RH component are commonly calibrated and vali-
ments, regional and global RH estimations mainly depend            dated by eddy covariance measurements, e.g., net ecosystem
on modeling approaches using regional or global variables,         carbon exchange; however, modeled RHs from these mod-
such as temperature, precipitation and carbon supply (Bond-        els have not yet been calibrated and validated using field
Lamberty and Thomson, 2010b; Hashimoto et al., 2015;               observations. Therefore, these modeled RHs may be funda-
Hursh et al., 2017). Besides temperature and precipitation,        mentally different from observed values and no global obser-
soil variables, such as water, carbon and nitrogen contents,       vations exist to evaluate model effectiveness. Consequently,
are also important factors in the regulation of RH and should      a data-driven RH dataset could improve our understanding
be considered for accurate RH estimations (Hursh et al.,           of the underlying mechanisms of RH variability to climate
2017; Zhao et al., 2017), although these variables vary with       change at the global scale and could serve as a benchmark to
biome and climate.                                                 constrain terrestrial biogeochemical models.
   Observational studies have examined the responses of               Thus, we used a RF algorithm to estimate global RH based
soil respiration to different climatic variables at different      on updated RH observations from the Global Soil Respira-
locations across the globe (Bond-Lamberty and Thomson,             tion Dataset (SRDB, Bond-Lamberty and Thomson, 2010a)

Earth Syst. Sci. Data, 12, 1037–1051, 2020                                         www.earth-syst-sci-data.net/12/1037/2020/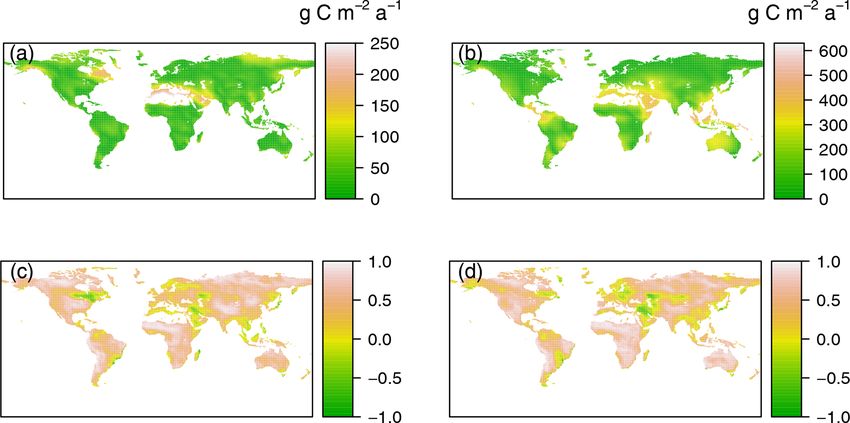
X. Tang et al.: Spatial and temporal patterns of global soil heterotrophic respiration 1039
with the objectives of (1) developing a globally gridded RH nitrogen deposition dataset from the global Earth System
product (named data-derived RH), (2) detecting the spatial Models of GISS-E2-R, CCSM-CAM3.5 and GFDL-AM3
and temporal patterns of RH, (3) identifying the dominant from 1850 to the 2000s (https://www.isimip.org, last access:
driving factors for spatial and temporal variabilities of RH, June 2017, Lamarque et al., 2013); monthly Palmer Drought
and (4) comparing the data-derived RH dataset with RH Severity Index data (PDSI, https://www.esrl.noaa.gov/psd/,
generated by Dynamic Global Vegetation Models from the last access: October 2017, Dai et al., 2004) and soil wa-
TRENDY ensembles. ter content (SWC, https://www.esrl.noaa.gov, last access:
March 2018, van den Dool et al., 2003). Before further data
analysis, monthly data were aggregated to an annual scale.
2 Materials and methods
These variables could stand for different environmental con-
2.1 Soil heterotrophic respiration database development
trols on RH. For example, temperature, precipitation and
SWC are critical environmental controls on microbial activ-
The basis of the database developed here included observed ities for soil organic matter decomposition (Jian et al., 2018;
global RH values from SRDB (Bond-Lamberty and Thom- Suseela et al., 2012; Tremblay et al., 2018). Soil organic mat-
son, 2010a), which were freely obtained at https://github. ter, soil carbon stock and soil nitrogen are important carbon
com/bpbond/srdb (last access: January 2018). The database and nitrogen substrates for microbes that are related to the
was further updated using observations collected from peer- decomposition of soil organic matter (Tremblay et al., 2018).
reviewed Chinese publications at the China Knowledge Re- The drought index (PDSI) and diurnal temperature range
source Integrated Database (https://www.cnki.net/, last ac- represent water and temperature stress on RH (Berryman et
cess: March 2018) until March 2018. This study included al., 2015; Zhu and Cheng, 2011). The global environmental
the RH data for (1) annual RH, as directly reported in pub- drivers for each given site were extracted by site longitudes
lications with at least 1 year continuous measurements, and and latitudes corresponding to annual RH observations. If the
(2) the start and end years extracted from SRDB, directly environmental driver is not in a spatial resolution of 0.5◦ , we
from publications, or calculated by the “years of data” in first resampled this environmental driver to a 0.5◦ resolution
the SRDB. (3) Observations measured by alkali absorption using the bilinear interpolation.
or soda lime approaches were not included because of their
potential underestimation of respiration flux with increas-
ing pressure in the measurement chamber (Pumpanen et al., 2.3 RH from TRENDY models
2004). (4) Experiments with treatments, such as nitrogen ma-
nipulation or fertilization were excluded, and only RH mea- Over the last several decades, TRENDY models were de-
surements from the control treatment were included (Jian et veloped to simulate key processes (e.g., photosynthesis, res-
al., 2018). (5) SRDB observations labeled as “potential prob- piration, evapotranspiration, phenology and carbon alloca-
lem” (Q10), “suspected problem” (Q11), “known problem” tion) that drive the dynamics of global terrestrial ecosystems
(Q12), “duplicate” (Q13) and “inconsistency” (Q14) were (Piao et al., 2015). TRENDY models follow a common pro-
not included (Bond-Lamberty and Thomson, 2010a). In total, tocol and use the same climate-forcing data from National
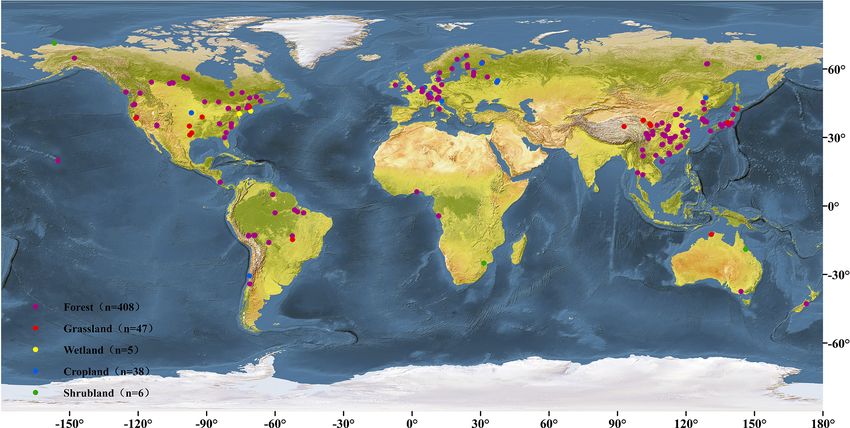
the newly updated database included 504 RH observations in Centers for Environmental Prediction at a spatial resolution
total. Although most of the observations were from China, of 0.5◦ . For modeled products with different spatial resolu-
North America, South America and Europe, this database tions, new errors will be produced when resampling to 0.5◦ .
covered all of the major terrestrial biomes across the world Therefore, to compare the dynamics in the data-derived RH
(Fig. 1). dataset and TRENDY RH dataset, we used model outputs
from seven TRENDY models: Community Land Model 4.5
2.2 Climate and soil data
(CLM4, Lawrence et al., 2011), Integrated Science Assess-
ment Model (ISAM, Cao, 2005), Lund-Potsdam-Jena (LPJ,
To investigate the global spatial and temporal RH patterns, Sitch et al., 2003), Lund-Potsdam-Jena General Ecosystem
global spatial–temporal grids of RH driving factors were Simulator (LPJ-GUESS, Smith et al., 2001), VEgetation-
required. A total of nine global variables were included Global-Atmosphere-Soil (VEGAS, Zeng et al., 2005), and
(Table S1): monthly gridded data of temperature, precip- Vegetation Integrative Simulator for Trace gases (VISIT,
itation, diurnal temperature range from Climatic Research Kato et al., 2013). Additionally, the RH dataset generated
Unit TS v.4.01 over 1901–2016 (https://crudata.uea.ac.uk, empirically by Hashimoto et al. (2015) was compared (de-
last access: September 2017, Harris et al., 2014); short- noted as Hashimoto RH), which is publicly available (http:
wave radiation (SWR, https://www.esrl.noaa.gov, last ac- //cse.ffpri.affrc.go.jp/shojih/data/index.html, last access: Jan-
cess: March 2018, Kalnay et al., 1996); gridded soil or- uary 2018) and estimated from a global relationship be-
ganic carbon content (Hengl et al., 2017) and nitrogen con- tween RH and soil respiration (Bond-Lamberty et al., 2004),
tent from https://webmap.ornl.gov/ogc/index.jsp, last access: and the total soil respiration was predicted from a climate-
March 2018, (Global Soil Data, 2000); monthly gridded driven model using precipitation and temperature based on
www.earth-syst-sci-data.net/12/1037/2020/ Earth Syst. Sci. Data, 12, 1037–1051, 2020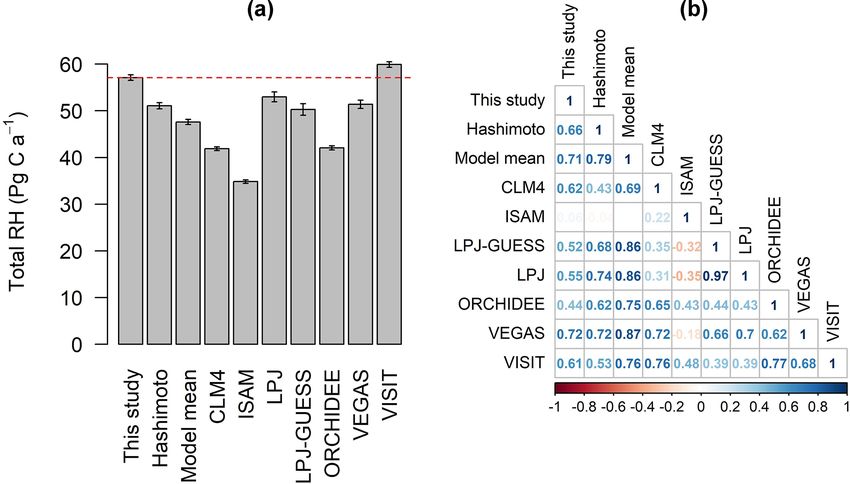
1040                                        X. Tang et al.: Spatial and temporal patterns of global soil heterotrophic respiration

Figure 1. Distributions of the study sites for RH observations.

the observations from SRDB. More details can be found in             ployed to investigate the significant changes in RH trend at a
Hashimoto et al. (2015).                                             significance level of 0.05.

2.4    RF-based RH modeling                                          2.6   Relationships between RH and temperature,
                                                                           precipitation and SWC
RF is a machine learning approach that uses a large number
of ensemble regression trees with a random selection of pre-         Although previous studies have used precipitation as a proxy
dictive variables (Breiman, 2001). Two free parameter set-           for SWC (Bond-Lamberty and Thomson, 2010b; Chen et al.,
tings are required, which are the number of trees and candi-         2010), this may result in variability in soil respiration esti-
date variables for each split. However, the RF model is not          mates (Jassal et al., 2007; Zhang et al., 2006) because the re-
usually sensitive to the number of trees or variables. A RF          lationship between SWC and soil respiration was much more
regression can deal with a large number of features, assist-         complex than that between soil respiration and temperature
ing a feature selection based on the importance value of each        or precipitation (Jian et al., 2018). Therefore, mean annual
variable and the avoidance of overfitting (Bodesheim et al.,         temperature (MAT), precipitation (MAP) and SWC were all
2018; Jian et al., 2018). In the present study, a RF model           considered potentially important proxies driving RH (Bond-
was trained using nine variables (Table S1) in the caret pack-       Lamberty et al., 2016; Reichstein and Beer, 2008). Annual
age (version 6.0-80, accessed on 27 May 2018) in R (R Core           mean RH was regressed against the three proxies. The rela-
Team, 2018), which was then implemented to predict RH for            tionships between the data-derived RH and MAT, MAP, and
each grid at a spatial resolution of 0.5◦ . To characterize the      SWC were assessed locally for each grid cell by calculating
performance of RF, a 10-fold cross-validation was applied,           the correlations using partial correlation analysis. When an-
which meant that the dataset was stratified into 10 parts,           alyzing the partial correlations between RH and the proxy,
and each part contained a roughly equal number of samples.           the other two proxies were controlled to remove their con-
The target values for each of these 10 parts were predicted          founding effects on RH. The correlation strengths of MAT,
based on the training models using the remaining 9 parts.            MAP and SWC were used to derive RGB combinations and
Two model evaluation statistics were used, including model-          indicate the drivers of RH.
ing efficiency (R 2 ) and root-mean-square error (RMSE, Tang
et al., 2019b; Yao et al., 2018b).                                   2.7   The comparison map profile method

2.5    Trend analysis
                                                                     To detect the spatial similarity and difference patterns be-
                                                                     tween the data-derived RH and TRENDY and Hashimoto
A trend analysis of RH was estimated using the Theil–Sen             RH values from 1981 to 2010, we utilized the comparison
linear regression and tested with the Mann–Kendall nonpara-          map profile (CMP) method (Gaucherel et al., 2008). This
metric test. The Theil-Sen estimator is a nonparametric slope        method was based on the absolute distances (D) and cross-
estimator based on median values, and this approach was              correlation coefficients (CC) across multiple scales, with D
widely used for time series analysis, e.g., carbon fluxes (Dai       and CC reflecting the similarity and the spatial structures
et al., 2016) and vegetation greening and browning (Pan et           of two compared images with the same sizes, respectively
al., 2018). The Mann–Kendall nonparametric test was em-              (Gaucherel et al., 2008). The D value between moving win-

Earth Syst. Sci. Data, 12, 1037–1051, 2020                                           www.earth-syst-sci-data.net/12/1037/2020/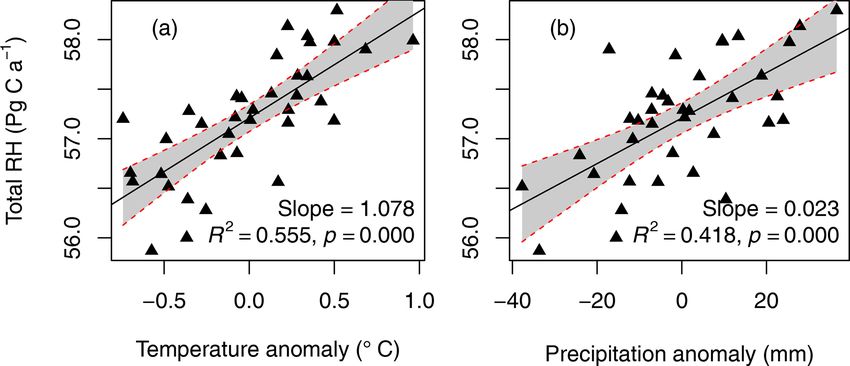
X. Tang et al.: Spatial and temporal patterns of global soil heterotrophic respiration                                                 1041

Figure 2. Spatial patterns of (a) mean data-derived RH, (b) standard deviations, (c) temporal trends of annual heterotrophic respiration (RH)
from 1980 to 2016 and (d) dominant environmental drivers for the interannual variability of global RH. MAT is mean annual temperature,
MAP is mean annual precipitation and SWC is soil water content.

dows (from 3 × 3 to 1 × 41 pixels in present study) of two               and temporal variability of RH, therefore enabling derivation
compared images was calculated by Eq. (1):                               of a global gridded RH dataset.
                                                                            The data-derived RH dataset showed a strong spatial
D = abs(x − y),                                                 (1)      pattern globally (Fig. 2a). The largest RH fluxes oc-
where x and y represent mean values calculated over two                  curred in tropical areas, e.g., Amazonian tropical forests, at
moving windows. Finally, the mean D value was calculated                 > 700 g C m−2 a−1 ; followed by the subtropics, e.g., south-
as an average of different moving windows.                               ern China and America; and humid temperate areas, e.g.,
   The CC was calculated according to Eq. (2):                           North America and western and central Europe, with an an-
                                                                         nual RH of 400–600 g C m−2 a−1 . Relatively low annual RH
         1 X N X N
                     (xij − x) × (yij − y)                               of less than 200 g C m−2 a−1 was generally observed in ar-
CC =                                       ,                    (2)      eas with cold and dry climates, such as boreal areas, charac-
        N 2 i=1 j =1       σx × σy
                                                                         terized by low temperatures and short growing seasons and
                                                                         dry or semiarid regions (e.g., northwestern China), where
           1 X   N X N                                                   water availability limits ecosystem development. However,
σx2 =                    (xij − x)2 ,                           (3)      the most variable changes in RH over the time from 1980
        N 2 − 1 i=1 j =1
                                                                         to 2016, using standard deviation and coefficient of variation
where xij and yij are pixel values at the ith row and j th col-          (CV, the ratio of the standard deviation and the mean) as a
umn of the moving windows of two compared images, re-                    proxy (Figs. 2b and S3), were found in boreal regions with
spectively. N represents the total number of pixels covered              RH higher than 70 g C m−2 a−1 or a CV > 0.7. The majority
by each of moving windows. σx and σy stand for standard                  of areas of RH variabilities were lower than 30 g C m−2 a−1
deviations of two moving windows. Low D values reflect a                 or a CV < 0.3. Similarly, TRENDY RH showed similar pat-
goodness of fit between the compared images, while low CC                terns, with the highest RH in warm and humid areas and
values suggest a low similarity. Finally, the mean D and CC              the lowest RH in cold and dry regions (Fig. S2). How-
were calculated as the average from different moving win-                ever, differences existed in the absolute RH fluxes (Fig. S2).
dows.                                                                    For example, CLM4 and VISIT models predicted RH to be
  All data analyses mentioned above were conducted in R                  higher than 1400 g C m−2 a−1 within Amazon forest regions,
(version 3.5.0, access on April 2018).                                   while ISAM and LPJ-GUESS estimates were typically low
                                                                         at around 1000 g C m−2 a−1 . However, the data-derived RH
                                                                         dataset and Hashimoto RH showed the highest RH fluxes in
3     Results                                                            tropical regions of about 800 g C m−2 a−1 .
                                                                            To examine the similarity in the patterns between the
3.1     Spatial patterns of RH
                                                                         data-derived RH dataset and TRENDY–Hashimoto RH, the
Based on the 10-fold cross-validation, R 2 and RMSE were                 CMP method was employed (Fig. 3). Larger D and lower
50 % and 143 g C m−2 a−1 (Fig. S1), respectively. This indi-             CC values indicate less consistent magnitudes and a lo-
cates that the RF algorithm effectively captured the spatial             cal gradient distributions between the two compared im-

www.earth-syst-sci-data.net/12/1037/2020/                                                Earth Syst. Sci. Data, 12, 1037–1051, 2020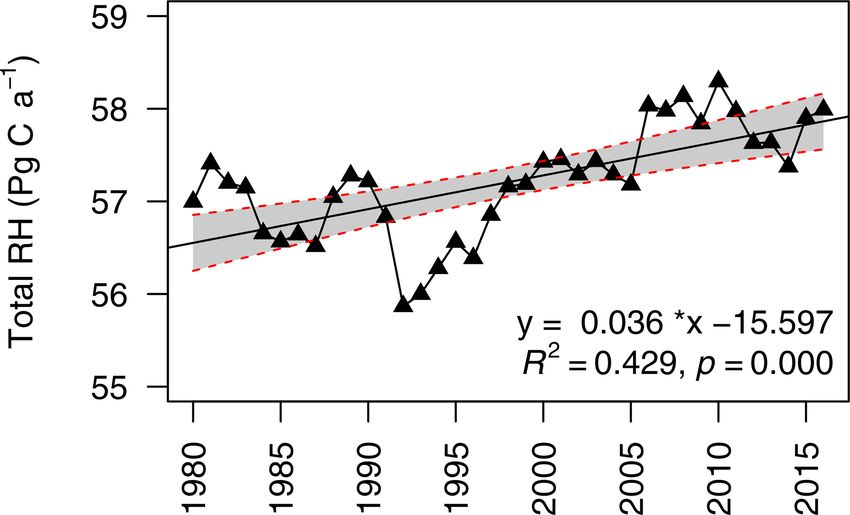
1042                                        X. Tang et al.: Spatial and temporal patterns of global soil heterotrophic respiration

Figure 3. Comparing the data-derived RH dataset with Hashimoto RH (a, c) and mean RH of TRENDY models (b, d) based on absolute
distances (g C m−2 a−1 , a, b) and cross-correlations (c, d). The absolute distances and cross-correlations were calculated using comparison
map profile method (Gaucherel et al., 2008).

ages. The data-derived RH dataset and Hashimoto RH dif-
fered greatly in eastern Canada and the Middle East with
D values higher 200 g C m−2 a−1 and CC values lower than
−0.5. Interestingly, the most noticeable differences between
the data-derived RH and mean TRENDY RH occurred in
East Asia and the Middle East, where D was higher than
500 g C m−2 a−1 , while CCs were around −0.1. When as-
sessing each TRENDY model individually (Figs. S4 and S5),
the differences between the data-derived RH dataset and
TRENDY RH were even larger. The most remarkable dif-
ferences were found for CLM4 and VISIT models in re-                    Figure 4. Interannual changes in global heterotrophic respiration
gions where D was above 800 g C m−2 a−1 with CC values                  (RH) from 1980 to 2016. The grey area indicates 95 % confi-
of about −0.3 (East Asia and America).                                  dence intervals. For the linear regression model, R 2 = 0.429 and
   Across the latitudinal gradients, zonal mean RH values in-           p < 0.01.
creased from cold or dry areas (e.g., tundra, and desert or
semiarid areas) to warm or humid areas (e.g., temperate and
tropical areas, Fig. S6). The data-derived RH dataset varied            3.2    Total RH
from 60 ± 12 at about 75◦ N to 640 ± 71 g C m−2 a−1 at the
Equator, reflecting higher resource limitation in high-latitude         Over the last 37 years, the global RH has increased from
areas and lower resource limitation in low-latitude areas. In           55.8 Pg C a−1 (1 Pg = 1 × 10¹⁵ g) in 1992 to 58.3 Pg C a−1
the dry tropical areas (10–25◦ S and 10–25◦ N) limited by               in 2010, with an average of 57.2 ± 0.6 Pg C a−1 and strong
water, the zonal mean RH decreased slightly. With the in-               annual variabilities (Fig. 4). Compared to the data-derived
crease in water availability, RH showed a second peak in the            RH dataset, TRENDY–Hashimoto RH was underestimated
Northern and Southern hemispheres around 20◦ N and 40◦ S,               (Fig. 5a), with the exception of the VISIT model. ISAM pre-
respectively. Nonetheless, there was a high level of variabil-          dicted the lowest global RH of 34.8±0.4 Pg C a−1 , while the
ity between the data-derived RH and TRENDY–Hashimoto                    VISIT model produced the highest RH of 59.9±0.6 Pg C a−1
RH in equatorial regions (Fig. S6), with predictions gener-             (Fig. 5a). The model mean RH was 47.6 ± 0.5 Pg C a−1 , un-
ally overestimating RH at the Equator. Peak RH values in                derestimating RH by 9.6 Pg C a−1 (16 %) in comparison to
the equatorial region ranged from 660 ± 65 g C m−2 a−1 for              the data-derived RH dataset. Due to this large divergence,
ORCHIDEE model to above 1200 ± 460 g C m−2 a−1 for the                  the strength of correlation between the data-derived RH and
CLM4 model, resulting in a considerably higher peak RH                  TRENDY–Hashimoto RH varied greatly from 0.06 to 0.72
value for the model mean (950 ± 300 g C m−2 a−1 ).                      (Fig. 5b). Boreal, temperate and tropical regions were the
                                                                        three most important contributors for the global RH ac-
                                                                        cording to the Köppen–Geiger climate classification system
                                                                        (Peel et al., 2007), contributing 76 % of the total global RH.

Earth Syst. Sci. Data, 12, 1037–1051, 2020                                                www.earth-syst-sci-data.net/12/1037/2020/
X. Tang et al.: Spatial and temporal patterns of global soil heterotrophic respiration 1043 Figure 5. (a) Total global heterotrophic respiration (RH, mean ± standard deviation of annual RH from 1981 to 2010) fluxes and (b) the correlation coefficient analyzed by Pearson correlation between data-derived RH and TRENDY–Hashimoto RH. The dashed red line in (a) represents the average of data-derived RH from 1981 to 2010. The mean RH of boreal, temperate and tropical areas were 10.8 ± 0.3, 12.9 ± 0.1 and 19.5 ± 0.2 Pg C a−1 , accounting for 19 %, 22 % and 35 % of the total global RH, respectively (Fig. S8). 3.3 Trends in RH Globally, although there was a great interannual variabil- ity in RH, the total RH has significantly increased at a rate of 0.036 ± 0.007 Pg C a−2 from 1980 to 2016 (p = Figure 6. The relationships between heterotrophic respiration (RH) 0.000, Fig. 4). Comparison of the data-derived RH dataset and mean annual temperature (a) or precipitation anomalies (b). and TRENDY RH during the period of 1981 to 2010 The change was calculated as the difference of each given year to was performed. The data-derived RH increased at 0.041 ± the average over 1980 to 2016. Grey areas indicate 95 % confidence 0.01 Pg C a−2 (Fig. S7), which was lower than that of intervals. TRENDY RH (0.057 ± 0.009 Pg C a−2 ) and Hashimoto RH (0.057 ± 0.009 Pg C a−2 ). Additionally, temporal trends var- ied greatly among TRENDY models (Fig. S7), with the levels increased significantly by 0.34 ± 0.032 ◦ C and 6.69 ± largest increasing trend of 0.123 ± 0.013 Pg C a−2 for LPJ- 2.399 mm per decade, respectively (p < 0.01, Fig. S12a GUESS and the largest decreasing trend of −0.018 ± and b). Therefore, the correlations between RH and MAT and 0.007 Pg C a−2 for ISAM. MAP were evaluated. Globally, RH was significantly cor- Temporal trends varied among climate zones. RH in boreal related with MAT (R 2 = 0.56, p < 0.001) and MAP (R 2 = and temperate areas increased by 0.020 ± 0.004 and 0.007 ± 0.42, p < 0.001, Fig. 6) anomalies. On average, the global 0.002 Pg C a−2 from 1980 to 2016 (p < 0.001, Fig. S8), re- RH increased by 1.08 ± 0.163 Pg C a−1 per 1 ◦ C increase spectively, while RH in tropical areas did not show a signifi- in MAT and 0.23 ± 0.046 Pg C a−1 per 10 mm increment in cant temporal trend, although interannual variabilities were MAP. observed (p = 0.362, Fig. S8). TRENDY–Hashimoto RHs showed significant increasing temporal trends in boreal, tem- 3.4 Spatial pattern of RH trends perate and tropical regions, except in the ISAM and OR- CHIDEE models (Figs. S9–11). However, the increasing Spatially, the data-derived RH trends presented heteroge- magnitude varied among different TRENDY models. neous geographical patterns (Fig. 2c). Positively increasing From 1980 to 2016, the global RH was expected to be trends of RH were found for more than half of the global land driven by multiple environmental factors, such as tempera- areas (59 %, calculated from cell areas; Fig. S13). Generally, ture and precipitation. During this period, MAT and MAP the increasing rates of RH were lower than 3 g C m−2 a−2 . In www.earth-syst-sci-data.net/12/1037/2020/ Earth Syst. Sci. Data, 12, 1037–1051, 2020
1044                                      X. Tang et al.: Spatial and temporal patterns of global soil heterotrophic respiration

contrast, the highest RH increase was above 6 g C m−2 a−2           ally, the mean RH amounted to 57.2±0.6 Pg C a−1 from 1980
in boreal regions, such as Russia, northern Canada and the          to 2016, 13.6 Pg C a−1 higher than RH from a satellite-driven
Tibetan Plateau. RH exhibited a decreasing trend in 41 %            estimate (Konings et al., 2019) and 6.4 Pg C a−1 higher than
of the global land area and most considerably in South              Hashimoto RH (Hashimoto et al., 2015). The differences be-
Asia (Fig. 2c). Similar to the data-derived RH trends, RH           tween the data-driven RH and Hashimoto may be due to
trends estimated by the TRENDY–Hashimoto RH trend                   several reasons. Firstly, the two RH products covered dif-
also showed heterogeneous geographical patterns (Fig. S14).         ferent land areas, with the data-derived RH dataset cover-
However, large discrepancies were found among TRENDY–               ing a higher land area. If the data-derived RH dataset was
Hashimoto RH (Figs. 2c and S14). Generally, the largest in-         masked by Hashimoto RH over 1981–2010, the total RH
crease in RH trends occurred in boreal areas, except for out-       was 51.8 ± 0.6 Pg C a−1 , close to that of Hashimoto RH with
puts by LPJ-GUESS and LPJ models, which showed a de-                51.1±0.7 Pg C a−1 (Fig. S18). However, the spatial and tem-
creasing trend for most boreal areas. There was a decreasing        poral patterns varied greatly (Figs. 3 and 5).
trend across most of the tropics (e.g., Southeast Asia), with          Secondly, the two RH products used different variables
the exception of VEGAS model (Fig. S14).                            and algorithms for RH predictions. RH was not only af-
                                                                    fected by temperature and precipitation but also by carbon
3.5     Dominant factors in RH annual variability                   substrates, soil nutrient levels and other variables (Hursh et
                                                                    al., 2017). Besides temperature and precipitation, we also in-
MAT and MAP were the most important factors dominat-                cluded SWC, soil nitrogen and carbon contents as indica-
ing RH in 39 % and 36 % of global land areas, respectively          tors for environmental and nutrient constraints on RH. Con-
(Fig. S15), while SWC dominated the remaining 25 % of               versely, Hashimoto RH was estimated from a climate-driven
global land areas. Spatially, the dominant drivers controlling      model including only temperature and precipitation as the
RH varied greatly across the globe (Fig. 2d), with the area         driving variables (Hashimoto et al., 2015). This simple model
dominated by temperature mainly distributed in boreal areas         can partly explain the reasons that Hashimoto RH could not
above 50◦ N. This was also observed in the relatively high          capture the significant decrease in RH in 1982 and 1991
and positive partial correlation coefficient between tempera-       due to the El Chichón and Pinatubo eruptions, respectively
ture and RH (Fig. S15a). In contrast, precipitation dominated       (Zhu et al., 2016), while the data-derived RH dataset and
temperate areas between 25 and 50◦ N (such as northern              TRENDY RH successfully captured such effects.
China, the Middle East and America), where a wide distri-              Thirdly, the linear model between total soil respiration
bution of desert or semiarid regions occur, SWC dominated           and RH was developed based on forest ecosystems (Bond-
in tropical areas, such the Amazon, India and Africa. Sim-          Lamberty et al., 2004; Hashimoto et al., 2015), which could
ilarly, water availability (SWC and precipitation) were also        be another uncertainty when applying this linear model to
main driving factors for RH in Australia.                           other ecosystems, e.g., croplands and grasslands.
   Spatial patterns in environmental controls on TRENDY–
Hashimoto RH varied greatly compared to the data-derived
RH dataset or among TRENDY models (Figs. 2d and S15–
                                                                    4.1.2   Comparison with TRENDY models
17). Water availability (including precipitation and SWC)
appeared to be more important than temperature. The per-            As the data-derived RH dataset often serves as a bench-
centage of the areas dominated by temperature (mainly dis-          mark for terrestrial biogeochemical models, the data-derived
tributed in boreal areas, except for in ISAM model out-             RH dataset was compared with TRENDY models from
puts) was less than the areas dominated by precipitation            1980 to 2010. Although the data-derived RH dataset lay
and SWC (globally distributed) (Fig. S17). In terms of the          within the model range (34.8 ± 0.4 Pg C a−1 for ISAM to
mean TRENDY RH, precipitation dominated most of global              59.9 ± 0.6 Pg C a−1 for VISIT, Fig. 5a), the mean TRENDY
land areas (43 %), followed by SWC (36 %) and temperature           RH was underestimated by 16 % compared to the data-
(21 %) (Fig. S15).                                                  derived RH dataset. Due to the different temporal trends
                                                                    among TRENDY models and their low spatial correlations
4     Discussion                                                    to the data-derived RH dataset (correlation efficiencies rang-
                                                                    ing from 0.06 to 0.72, Fig. 6b), TRENDY RHs clearly have
4.1     Annual RH                                                   different sensitivities to climate variations. Additionally, the
                                                                    difference in RH magnitude and spatial pattern varied con-
4.1.1    Comparison with Hashimoto RH
                                                                    siderably, as shown by analysis of absolute distances and
Despite increasing efforts to quantify the global carbon cy-        cross-correlations. This effect was mostly notable in tropical
cle, large uncertainties still remain in the spatial and temporal   areas in VISIT and CLM4 models (Figs. S4 and S5). This
patterns in RH. To the best of our knowledge, this is the first     phenomenon may be associated with several factors. Firstly,
study to apply the RF approach to predict the spatial and tem-      plant functional types differed among TRENDY models. For
poral patterns of global RH using field observations. Glob-         example, the VEGAS model included 4 plant functional

Earth Syst. Sci. Data, 12, 1037–1051, 2020                                          www.earth-syst-sci-data.net/12/1037/2020/
X. Tang et al.: Spatial and temporal patterns of global soil heterotrophic respiration 1045
types (Zeng et al., 2005), while the LPJ model defined 10 and NPP (net ecosystem production) was 2.8–4.3 Pg C a−1 ,
plant functional types (Sitch et al., 2003). which is similar to the global estimates of net ecosystem
Secondly, for each set of equations, constant vegeta- production from the International Geosphere-Biosphere Pro-
tion parameters (e.g., photosynthetic capacity) were applied gramme, which ranged from 1.9 to 4.1 Pg C a−1 from 1959
across time and space for most TRENDY models, which may to 2016 (Le Quéré et al., 2013, 2016, 2014). With a 1 ◦ C
induce an RH bias. Model parameters using short-term ob- increase in global MAT, RH will increase by 1.08 Pg C a−1
servations do not account for the interannual variability of globally, and such an increase is 0.23 Pg C a−1 for a 10 mm
climatic and soil conditions, generating a simplistic repre- increment in global MAP. These findings indicate that car-
sentation of RH due to its inability to capture the response bon fluxes from the decomposition of soil organic matter and
of RH to new environmental controls in short-term observa- litter (RH) may positively feedback to global climate change
tions. – typically characterized by increasing temperature and the
Thirdly, models that do not consider nitrogen constraint changes in precipitation (IPCC, 2013).
could overestimate the increasing trend of RH because nitro-
gen limitation was globally observed (LeBauer and Treseder, 4.3 Dominant factors in RH
2008). This could explain why the CLM4 model with a ni-
trogen constraint produced a much smaller increasing trend Dominant factors driving RH varied spatially. As tempera-
compared to other TRENDY models, with the exception of ture and energy were the most limited climatic factors in
ISAM (Fig. S7). Therefore, including soil nitrogen as a driv- high-latitude areas, temperature was a dominant factor for
ing variable in modeling RH in this dataset had the advantage RH in high-latitude regions above 50◦ N (Fig. 2d), with low
of detecting the nitrogen constraints on RH. temperatures leading to low RH (Fig. 2a). Similarly, due to
Fourthly, the lack of the representation of human activi- the limited amount of precipitation, RH in semiarid areas
ties and agricultural management (e.g., fertilization and irri- was mainly controlled by precipitation, which was consis-
gation) may underestimate RH because fertilization and ir- tent with both reported field observations (Bai et al., 2008)
rigation were important practices to increase RH (Chen et and modeling studies (Gerten et al., 2008). SWC control
al., 2018; Zhou et al., 2016). This could explain why five of of RH in tropical areas could be explained by the mecha-
seven TRENDY models could not explain the significant in- nisms of RH. Excessively high SWC can reduce the diffu-
creasing change of RH in central China (Fig. S14), which sion of oxygen, while excessively low SWCs could limit wa-
experienced an intensive use of fertilization for food security ter and soluble substrate availabilities, preventing microbial
in recent decades. activities (Luo and Zhou, 2006; Xu et al., 2004). Suseela et
Finally, uncertainties and differences in model structures al. (2012) proposed that RH fluxes declined sharply when
could also lead to inconclusive RH estimations. Although the volumetric soil moisture reduced below ∼ 15 % or exceeded
same climatic data, e.g., temperature and precipitation, were ∼ 26 %, which supported the findings of the present study.
used for TRENDY models to reduce the uncertainty caused However, it should be noted that dominant environmental
by various meteorological forcings, systematic errors may be controls on spatial carbon flux gradients might vary among
caused by applying a particular forcing, and the errors might different years (Reichstein et al., 2007), such as with climatic
be propagated to model outputs (Anav et al., 2015). There- extremes.
fore, TRENDY models should be improved by incorporating
more processes such as nutrient constrains and an assessment 4.4 Temporal variability of tropical, temperate and
of the model response to environmental variability (Keenan boreal areas
et al., 2012; Wang et al., 2014; Yao et al., 2018b).
RH in tropical areas did not exhibit a significant temporal
4.2 Linkage to global carbon balance
pattern between 1981 and 2010 (Fig. S8, p = 0.362), indicat-
ing that in our model climate change did not affect RH fluxes
Assuming that the global ratio of RH / total soil respiration in these areas. However, RH in boreal and temperature ar-
ranged from 0.56 (Hashimoto et al., 2015) to 0.63 (Bond- eas experienced significant increasing trends of 0.020±0.004
Lamberty et al., 2018), annual soil respiration varied from and 0.007 ± 0.002 Pg C a−2 , respectively (Fig. S7), suggest-
90.8 to 102.1 Pg C a−1 , within the reported values of 83 to ing that a positive feedback may occur with climate change.
108 Pg C a−1 based on recent studies (Bond-Lamberty and Tremblay et al. (2018) proposed that the increased RH was
Thomson, 2010b; Hursh et al., 2017). This indirectly high- mainly related to the increasing temperature in boreal forest
lights the reliability of the use of RF for global RH pre- soils, which supported the findings of the present study. It
diction. Moreover, these findings also have important indi- should be noted that both the data-derived RH dataset and
cations of carbon balance estimations. According to a re- Hashimoto/TRENDY RH in boreal areas showed a tempo-
cent NPP estimate from observations and IPCC report data rally increasing trend from 1981 to 2010, although the mag-
(IPCC, 2013; Li et al., 2017), the global NPP ranged from nitude of increase differed (Fig. S9). Furthermore, despite the
61.5 to 60 Pg C a−1 , respectively. The residual between RH ISAM model showing a decreasing trend for temperate and
www.earth-syst-sci-data.net/12/1037/2020/ Earth Syst. Sci. Data, 12, 1037–1051, 20201046 X. Tang et al.: Spatial and temporal patterns of global soil heterotrophic respiration
tropical regions, the ISAM model had an increasing trend in based on the training dataset and was typically data-limited
RH from 1981 to 2010 in boreal areas (Fig. S9). These re- in terms of quantity, quality and representativeness. Uneven
sults indicate that boreal regions are becoming increasingly data distribution has been a known issue in many ecological
important in global carbon cycling and that the increasing studies across the world, e.g., Bond-Lamberty and Thom-
trend may continue due to a large amount of carbon stored son (2010b), Jung et al. (2011), Xu and Shang (2016), and
in soils. Therefore, climate change may fundamentally alter Yao et al. (2018a). The RH observations were mainly from
carbon cycling in boreal areas through changes in the decom- China, Europe and North America, while there were a lack
position rate of soil organic matter (Crowther et al., 2016; of RH observations in Russia, Africa, Australia and south-
Hashimoto et al., 2015; Schuur et al., 2015). Furthermore, western Asia in our study. Thus, the uneven coverage of the
the response of RH to climate variability varied with climate observations was an important source of uncertainty to de-
zone, indicating that different carbon loss rates from RH will velop the data-derived RH dataset, which may cause a bias
occur in different regions to climate change. in the RF model towards the areas with more observations.
However, our dataset covered a large climatic and edaphic
4.5 Advantages, limitations and uncertainties
gradient covering the major land covers and climate zones.
Therefore, in future studies, increasing field observations in
Based on the updated SRDB database, we used a RF al- unsampled areas should greatly improve our ability to eval-
gorithm to predict the spatial and temporal patterns of RH uate spatial and temporal patterns of RH at the global scale
at the global scale and its response to environmental vari- and model the global carbon cycle of climate change.
ables, and the data-derived RH could serve as a benchmark Secondly, the misrepresentation of human activities, par-
for terrestrial biogeochemical models and reduce RH uncer- ticularly regarding land management and land use change,
tainties. This data-derived RH dataset provided several ad- could result in uncertainties in RH (Bond-Lamberty et al.,
vantages to the estimation of global RH compared to pre- 2016; Tang et al., 2016). These human activities include both
vious studies, e.g., Hashimoto et al. (2015) and Konings site-level in situ information and the corresponding global
et al. (2019). Firstly, we compiled up-to-date field observa- grids. Otherwise, such information must not have been in-
tions from SRDB and peer-reviewed Chinese literatures up cluded, as the corresponding site information or globally
to March 2018, including 504 observations in total covering gridded datasets are missing or insufficient. Although soil
the majority global terrestrial ecosystems and climate zones organic carbon stock, soil nitrogen content, SWC and short-
(Fig. 1). Secondly, total RH and its interannual variabil- wave radiation were selected as inputs for the development of
ity were assessed for boreal, temperate and tropical zones, the RF model, which could partly capture land use change,
i.e., the three main global climate zones. Analysis from the the impacts of land use change on the interannual variabil-
data-derived RH dataset further concluded that RH in dif- ity of RH have not been fully qualified in the present study.
ferent climate zones responded differently to global climate Therefore, further efforts are required to characterize and
change. Thirdly, we applied the RF to predict and map RH quantify the effects of land use change on the global RH.
at the global scale using climate and soil predictors. Com- Thirdly, the data-derived RH dataset was derived at an an-
pared to the linear regression analysis for predicting soil res- nual timescale, which may cause an additional uncertainty
piration (as no such global RH predictions were previously regarding the interannual variability of RH. Therefore, the
available for comparison) with model efficiencies of < 50 % needs for a larger number of global observations and to
(Bond-Lamberty and Thomson, 2010b; Hashimoto et al., develop finer-scale temporal dynamics need further explo-
2015; Hursh et al., 2017), the RF algorithm achieved a higher ration, in combination with remote-sensing measurements
model efficiency of 50 %. In addition to a feature selection and field observations, which may provide new insights
according the importance value of each variable and avoid- into terrestrial ecosystem carbon dynamics at the global
ing overfitting (Bodesheim et al., 2018; Jian et al., 2018), the scale. Aside from this, without consideration of the tempo-
RF algorithm improved RH modeling accuracies and reduced ral changes of soil organic carbon content from 1980 to 2016,
uncertainties. Meanwhile, the data-derived RH dataset was this might be another uncertainty because the increase in pro-
cross-validated globally by a 10-fold cross-validation (see ductivity driven by CO2 fertilization would increase litter in-
Sect. 2), which could improve its reliability and feasibility put into soils. However, there is a lack of global soil organic
compared to TRENDY-based RH that was not validated and carbon content product that considers its temporal changes
calibrated by field observations, bridging the knowledge gap based on observations.
between local, regional and global scales temporally and spa- Finally, we developed a global RH at a half-degree spa-
tially with a large number of empirical field measurements. tial resolution, which included a scale mismatch between the
However, although the data-derived RH dataset could be observations and global gridded variables. This could be a
used as a benchmark for the verification of global carbon cy- great challenge for spatial modeling and using global gridded
cle modeling, bridging the knowledge gaps between local, re- variables with a finer resolution is encouraged to overcome
gional and global scales, a few uncertainties and limitations this limitation (Xu and Shang, 2016). On the other hand, the
still remain. Firstly, the RF algorithm constructed a model study sites were globally distributed and there was a large
Earth Syst. Sci. Data, 12, 1037–1051, 2020 www.earth-syst-sci-data.net/12/1037/2020/X. Tang et al.: Spatial and temporal patterns of global soil heterotrophic respiration 1047
climatic and edaphic gradient covering the major land covers Competing interests. The authors declare that they have no con-
and biomes, which should reflect a larger variability than the flict of interest.
site-to-grid mismatch.
Acknowledgements. This study was supported by the National
5 Data availability
Natural Science Foundation of China, Fundamental Research Funds
of International Centre for Bamboo and Rattan, Fundamental Re-
The developed globally gridded RH database, the field RH search Funds of Public Welfare of Central Institutes, the State Key
observation dataset and R codes used to produce the main Development Program of National “Thirteenth Five-year” plan of
results are free to the public for scientific purposes and can be China, Innovation funding of Remote Sensing Science and Tech-
downloaded at https://doi.org/10.6084/m9.figshare.8882567 nology of Chengdu University of Technology, Starting Funding of
(Tang et al., 2019a). Chengdu University of Technology, Foundation for University Key
Teacher of Chengdu University of Technology, and Open Funding
from Key Laboratory of Geoscience Spatial Information Technol-
6 Conclusions
ogy of Ministry of Land and Resources (Chengdu University of
Technology). The authors thank Liang Liu, Yuhang Zhang, and
A data-derived global RH dataset may be used as a bench-
Xinrui Luo for their kind help of data collection from Chinese
mark for terrestrial biogeochemical models; however, no publications; Yitong Yao for her kind help with R codes and the
such study has yet been conducted to assess the global vari- contributors of global soil respiration dataset and TRENDY mod-
ability in RH using a large dataset of empirical measure- els. Dai Palmer Drought Severity Index data were provided by the
ments to bridge the knowledge gap between local, regional NOAA/OAR/ESRL PSD, Boulder, Colorado, USA, from their web-
and global scales. To fill this knowledge gap, we developed site at https://www.esrl.noaa.gov/psd/ (last access: October 2017).
a globally gridded RH dataset, which was 0.5◦ × 0.5◦ from
1980 to 2016 with an annually temporal resolution, using a
RF algorithm by linking field observations and global vari- Financial support. This research was supported by the National
ables. Our robust conclusions are as follows. (1) Annual Natural Science Foundation of China (grant nos. 31800365 and
mean RH was 57.2 ± 0.6 Pg C a−1 between 1980 and 2016, 41671432); Fundamental Research Funds of International Centre
with an increasing trend of 0.036 ± 0.007 Pg C a−2 , indicat- for Bamboo and Rattan (grant nos. 1632017003 and 1632018003);
ing an increase in carbon loss from soils to the atmosphere. Fundamental Research Funds of Public Welfare of Central Insti-
tutes (grant no. CAFYBB2018MA002); the State Key Development
(2) Significant temporal trends were observed in the RH in
Program of National “Thirteenth Five-year” plan of China (grant
boreal and temperate areas, although none were found in no. 2018YFD0600105); Innovation funding of Remote Sensing Sci-
tropical regions. This indicates that the temporal trend in RH ence and Technology of Chengdu University of Technology (grant
varied with climate zone, highlighting their different sensi- no. KYTD201501); Starting Funding and Foundation for Univer-
tivities to climate change. (3) The magnitude and dominant sity Key Teacher of Chengdu University of Technology (grant nos.
factors of the data-derived TRENDY RH varied greatly, in- 10912-2018KYQD-06910 and 10912-2019JX-06910); and Open
dicating that future efforts should focus on improving the Funding from Key Laboratory of Geoscience Spatial Information
representation of RH and its response to environmental vari- Technology of the Ministry of Land and Resources (Chengdu Uni-
ability in terrestrial biogeochemical models. (4) More field versity of Technology).
observations are required in areas with limited observational
datasets, with the integration of smaller-scale temporal dy-
namics (rather than annual timescales) potentially providing Review statement. This paper was edited by Yuyu Zhou and re-
new insights into terrestrial ecosystem carbon dynamics at viewed by Ben Bond-Lamberty and two anonymous referees.
the global scale. (5) The data-derived RH dataset could serve
as a benchmark to constrain the terrestrial biogeochemical
models, further contributing to improving our understanding References
of the mechanisms of global soil carbon dynamics.
Anav, A., Friedlingstein, P., Beer, C., Ciais, P., Harper, A.,
Jones, C., Murray-Tortarolo, G., Papale, D., Parazoo, N. C.,
Peylin, P., Piao, S., Sitch, S., Viovy, N., Wiltshire, A., and
Supplement. The supplement related to this article is available
Zhao, M.: Spatiotemporal patterns of terrestrial gross pri-
online at: https://doi.org/10.5194/essd-12-1037-2020-supplement.
mary production: A review, Rev. Geophys., 53, 785–818,
https://doi.org/10.1002/2015rg000483, 2015.
Bai, Y. F., Wu, J. G., Xing, Q., Pan, Q. M., Huang, J. H., Yang, D.
Author contributions. XT, SF and WY design the study; XT, L., and Han, X. G.: Primary production and rain use efficiency
WZ, SG, MD and ZY contributed to data analysis, including im- across a precipitation gradient on the Mongolia plateau, Ecology,
proving R code; SL and GC provided constructive comments. All 89, 2140–2153, https://doi.org/10.1890/07-0992.1, 2008.
authors contributed to review the manuscript. Berryman, E. M., Barnard, H. R., Adams, H. R., Burns, M. A.,
Gallo, E., and Brooks, P. D.: Complex terrain alters tempera-
www.earth-syst-sci-data.net/12/1037/2020/ Earth Syst. Sci. Data, 12, 1037–1051, 20201048 X. Tang et al.: Spatial and temporal patterns of global soil heterotrophic respiration ture and moisture limitations of forest soil respiration across a Dai, A., Trenberth, K. E., and Qian, T.: A Global Dataset of Palmer semiarid to subalpine gradient, J. Geophys. Res.-Biogeo., 120, Drought Severity Index for 1870–2002: Relationship with Soil 707–723, https://doi.org/10.1002/2014jg002802, 2015. Moisture and Effects of Surface Warming, J. Hydrometeorol., 5, Bodesheim, P., Jung, M., Gans, F., Mahecha, M. D., and Reichstein, 1117–1130, https://doi.org/10.1175/JHM-386.1, 2004. M.: Upscaled diurnal cycles of land–atmosphere fluxes: a new Dai, E., Huang, Y., Wu, Z., and Zhao, D.: Analysis of spatio- global half-hourly data product, Earth Syst. Sci. Data, 10, 1327– temporal features of a carbon source/sink and its relationship 1365, https://doi.org/10.5194/essd-10-1327-2018, 2018. to climatic factors in the Inner Mongolia grassland ecosystem, Bond-Lamberty, B.: New Techniques and Data for Understanding J. Geogr. Sci., 26, 297–312, https://doi.org/10.1007/s11442-016- the Global Soil Respiration Flux, Earth’s Future, 6, 1176–1180, 1269-0, 2016. https://doi.org/10.1029/2018ef000866, 2018. Friedlingstein, P., Meinshausen, M., Arora, V. K., Jones, C. D., Bond-Lamberty, B. and Thomson, A.: A global database Anav, A., Liddicoat, S. K., and Knutti, R.: Uncertainties in of soil respiration data, Biogeosciences, 7, 1915–1926, CMIP5 Climate Projections due to Carbon Cycle Feedbacks, https://doi.org/10.5194/bg-7-1915-2010, 2010a. J. Clim., 27, 511–526, https://doi.org/10.1175/jcli-d-12-00579.1, Bond-Lamberty, B. and Thomson, A.: Temperature-associated in- 2014. creases in the global soil respiration record, Nature, 464, 579– Gaucherel, C., Alleaume, S., and Hely, C.: The comparison map 582, https://doi.org/10.1038/nature08930, 2010b. profile method: a strategy for multiscale comparison of quantita- Bond-Lamberty, B., Wang, C., and Gower, S. T.: A global re- tive and qualitative images, IEEE T. Geosci. Remote, 46, 2708– lationship between the heterotrophic and autotrophic compo- 2719, https://doi.org/10.1109/TGRS.2008.919379, 2008. nents of soil respiration?, Glob. Chang. Biol., 10, 1756–1766, Gerten, D., Luo, Y., Le Maire, G., Parton, W. J., Keough, C., Weng, https://doi.org/10.1111/j.1365-2486.2004.00816.x, 2004. E., Beier, C., Ciais, P., Cramer, W., Dukes, J. S., Hanson, P. Bond-Lamberty, B., Epron, D., Harden, J., Harmon, M. E., J., Knapp, A. A. K., Linder, S., Nepstad, D. A. N., Rustad, L., Hoffman, F., Kumar, J., McGuire, A. D., and Vargas, R.: and Sowerby, A.: Modelled effects of precipitation on ecosys- Estimating heterotrophic respiration at large scales: chal- tem carbon and water dynamics in different climatic zones, Glob. lenges, approaches, and next steps, Ecosphere, 7, e01380, Chang. Biol., 14, 2365–2379, https://doi.org/10.1111/j.1365- https://doi.org/10.1002/ecs2.1380, 2016. 2486.2008.01651.x, 2008. Bond-Lamberty, B., Bailey, V. L., Chen, M., Gough, C. M., and Var- Global Soil Data: Global Gridded Surfaces of Selected Soil Charac- gas, R.: Globally rising soil heterotrophic respiration over recent teristics (IGBP-DIS), ORNL Distributed Active Archive Center, decades, Nature, 560, 80–83, https://doi.org/10.1038/s41586- https://doi.org/10.3334/ornldaac/569, 2000. 018-0358-x, 2018. Harris, I., Jones, P., Osborn, T., and Lister, D.: Updated Breiman, L.: Random forests, Mach. Learn., 45, 5–32, high-resolution grids of monthly climatic observations– https://doi.org/10.1023/A:1010933404324, 2001. the CRU TS3.10 Dataset, Int. J. Climatol., 34, 623–642, Cao, L.: An Earth system model of intermediate complexity: Sim- https://doi.org/10.1002/joc.3711, 2014. ulation of the role of ocean mixing parameterizations and cli- Hashimoto, S., Carvalhais, N., Ito, A., Migliavacca, M., Nishina, mate change in estimated uptake for natural and bomb radio- K., and Reichstein, M.: Global spatiotemporal distribution of soil carbon and anthropogenic CO2 , J. Geophys. Res., 110, C09002, respiration modeled using a global database, Biogeosciences, 12, https://doi.org/10.1029/2005jc002919, 2005. 4121–4132, https://doi.org/10.5194/bg-12-4121-2015, 2015. Chen, S., Huang, Y., Zou, J., Shen, Q., Hu, Z., Qin, Y., Chen, H., Hengl, T., Mendes de Jesus, J., Heuvelink, G. B., Ruiperez and Pan, G.: Modeling interannual variability of global soil res- Gonzalez, M., Kilibarda, M., Blagotic, A., Shangguan, W., piration from climate and soil properties, Agr. Forest. Meteorol., Wright, M. N., Geng, X., Bauer-Marschallinger, B., Gue- 150, 590–605, https://doi.org/10.1016/j.agrformet.2010.02.004, vara, M. A., Vargas, R., MacMillan, R. A., Batjes, N. H., 2010. Leenaars, J. G., Ribeiro, E., Wheeler, I., Mantel, S., and Chen, Z., Xu, Y., He, Y., Zhou, X., Fan, J., Yu, H., and Ding, Kempen, B.: SoilGrids250m: Global gridded soil informa- W.: Nitrogen fertilization stimulated soil heterotrophic but not tion based on machine learning, PLoS One, 12, e0169748, autotrophic respiration in cropland soils: A greater role of or- https://doi.org/10.1371/journal.pone.0169748, 2017. ganic over inorganic fertilizer, Soil Biol. Biochem., 116, 253– Hursh, A., Ballantyne, A., Cooper, L., Maneta, M., Kimball, J., and 264, https://doi.org/10.1016/j.soilbio.2017.10.029, 2018. Watts, J.: The sensitivity of soil respiration to soil temperature, Crowther, T. W., Todd-Brown, K. E., Rowe, C. W., Wieder, W. R., moisture, and carbon supply at the global scale, Glob. Chang. Carey, J. C., Machmuller, M. B., Snoek, B. L., Fang, S., Zhou, Biol., 23, 2090–2103, https://doi.org/10.1111/gcb.13489, 2017. G., Allison, S. D., Blair, J. M., Bridgham, S. D., Burton, A. J., IPCC: Climate Change 2013: The Physical Science Basis. Contri- Carrillo, Y., Reich, P. B., Clark, J. S., Classen, A. T., Dijkstra, F. bution of Working Group I to the Fifth Assessment Report of the A., Elberling, B., Emmett, B. A., Estiarte, M., Frey, S. D., Guo, Intergovernmental Panel on Climate Change, Cambridge Univer- J., Harte, J., Jiang, L., Johnson, B. R., Kroel-Dulay, G., Larsen, sity Press, Cambridge, UK, New York, NY, USA, 2013. K. S., Laudon, H., Lavallee, J. M., Luo, Y., Lupascu, M., Ma, L. Jassal, R. S., Black, T. A., Cai, T., Morgenstern, K., Li, Z., N., Marhan, S., Michelsen, A., Mohan, J., Niu, S., Pendall, E., Gaumont-Guay, D., and Nesic, Z.: Components of ecosystem Penuelas, J., Pfeifer-Meister, L., Poll, C., Reinsch, S., Reynolds, respiration and an estimate of net primary productivity of an L. L., Schmidt, I. K., Sistla, S., Sokol, N. W., Templer, P. H., intermediate-aged Douglas-fir stand, Agr. Forest. Meteorol., 144, Treseder, K. K., Welker, J. M., and Bradford, M. A.: Quantifying 44–57, https://doi.org/10.1016/j.agrformet.2007.01.011, 2007. global soil carbon losses in response to warming, Nature, 540, Jian, J., Steele, M. K., Thomas, R. Q., Day, S. D., and Hodges, S. 104–108, https://doi.org/10.1038/nature20150, 2016. C.: Constraining estimates of global soil respiration by quanti- Earth Syst. Sci. Data, 12, 1037–1051, 2020 www.earth-syst-sci-data.net/12/1037/2020/
You can also read