Supplemental Climate Information for Bruce Peninsula National Park and Fathom Five National Marine Park - April 11, 2018 - Sources of ...
←
→
Page content transcription
If your browser does not render page correctly, please read the page content below
April 11, 2018

Supplemental Climate Information for
  Bruce Peninsula National Park and
  Fathom Five National Marine Park

                             Prepared by:

                             Scott Parker, Ph.D.
                             Office of the Chief Ecosystem Scientist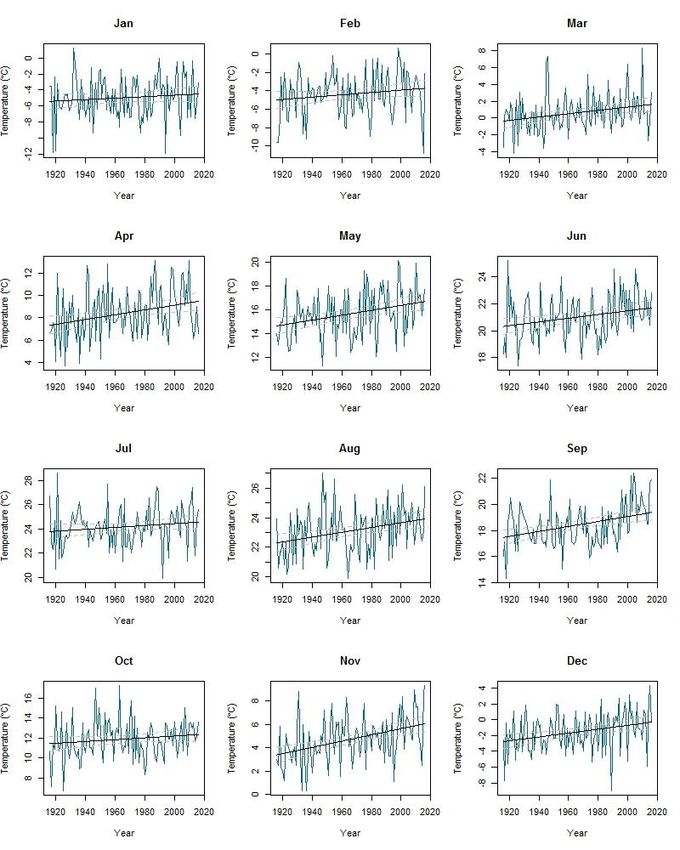
Contents
Preface .......................................................................................................................................................... 2
Highlights...................................................................................................................................................... 3
1. Historic Climate ........................................................................................................................................ 4
    1.1 Temperature ........................................................................................................................................ 5
    1.2 Precipitation ........................................................................................................................................ 6
    1.3 Surface Wind Speed ........................................................................................................................... 7
2. Projected Climate Trends .......................................................................................................................... 8
    2.1 Temperature ........................................................................................................................................ 8
        Growing Season ................................................................................................................................... 9
    2.2 Precipitation ...................................................................................................................................... 10
        Rainfall Intensity, Duration and Frequency (IDF) ............................................................................. 11
        Climate Moisture Index ...................................................................................................................... 12
    2.3 Wind ................................................................................................................................................. 12
3. Climate Change Impacts ......................................................................................................................... 13
    3.1 Water Temperature and Levels ......................................................................................................... 13
        Lake Huron......................................................................................................................................... 13
        Inland Waters ..................................................................................................................................... 13
    3.2 Wildfire............................................................................................................................................. 15
    3.3 Biodiversity ...................................................................................................................................... 16
        Climate Velocity ................................................................................................................................ 17
        Plant Species ...................................................................................................................................... 18
        Bird Species ....................................................................................................................................... 19
        Other Terrestrial Species .................................................................................................................... 21
        Aquatic Species .................................................................................................................................. 21
    3.4 Visitor Experience and Operations ................................................................................................... 22
        Visitor Experience .............................................................................................................................. 22
        Assets and Infrastructure .................................................................................................................... 24
4. References ............................................................................................................................................... 25
Appendix 1. Additional Climate Trends ..................................................................................................... 32
Appendix 2. Model Scatterplots for Temperature and Precipitation .......................................................... 37

                                                                                 1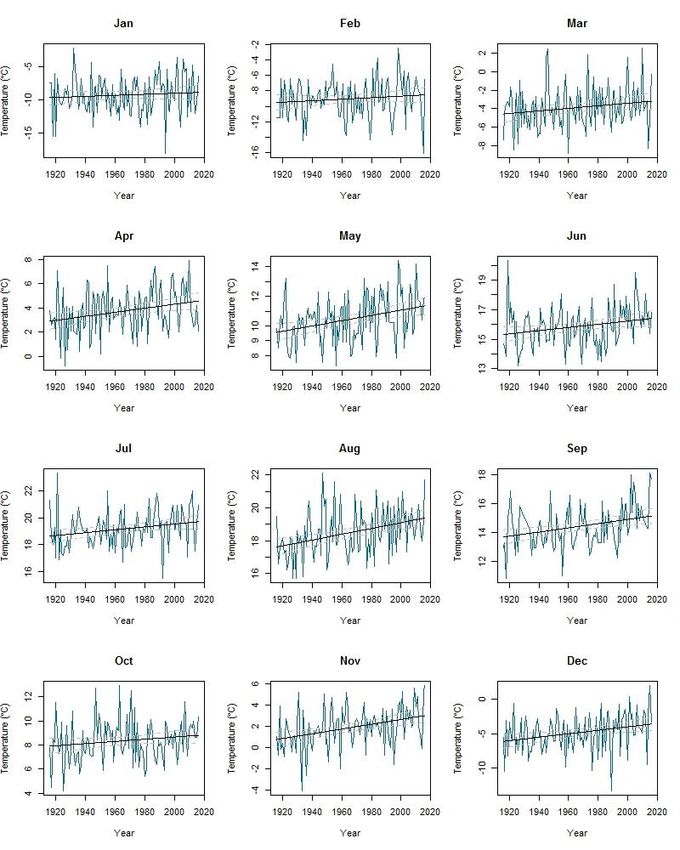
Preface
This is a supplement to the “Let’s Talks about Climate Change: Great Lakes Region” report (Parker,
2017) and is intended to support climate change discussions at Bruce Peninsula National Park and Fathom
Five National Marine Park.

Future climate projections are modelled with several greenhouse gas concentration trajectories, called
Representative Concentration Pathways (RCP) (Vuuren et al., 2011). They describe possible climate
futures and are named after respective radiative forcing values in the year 2100 relative to pre-industrial
values (i.e., +2.6, +4.5 and +8.5 watts/m2). RCP 2.6 assumes we take action and greenhouse gas
emissions peak in 2010-2020 and decline thereafter. RCP 4.5 assumes emissions peak around 2040 and
then decline. RCP 8.5 assumes we take no action and emissions continue to rise “status quo” throughout
the 21st century.

This is a site focussed document and to understand the larger climate change context please consult
Canada’s Changing Climate assessment reports (http://www.nrcan.gc.ca/environment/impacts-
adaptation/10029) and the Intergovernmental Panel on Climate Change assessment reports (e.g., IPCC,
2014) With respect to adaptation and mitigation options, please review Gross et al. (2016) or Gray et al.
(2017).

                                                     2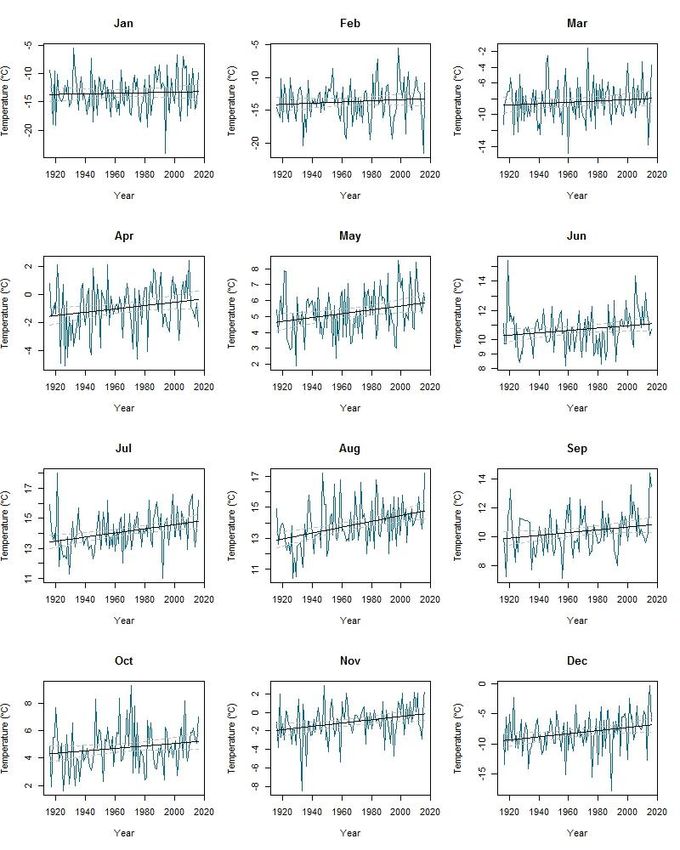
Highlights
Mean annual air temperature in the region has increased by ~1˚C since 1916, with the greatest
increase occurring during winter and nighttime periods.
Mean annual temperature for the region is projected to increase by ~2.1˚C by 2021-2050 and
~4.3˚C by 2051-2080 (RCP 8.5).
The number of extreme heat days (+30˚C) per year is projected to increase from 0.8 days to 21.3
days by 2051-2080 (RCP 8.5).
Growing season has already increased by ~17 days since 1900 and is projected to increase an
additional 86 days by 2100 (RCP 8.5).
Precipitation is variable, most projections suggest a slight increase (9% by 2050-2080) with
greater increase in winter and spring and a decrease in summer. More is expected to fall in intense
events with associated flooding. The “one in 100 year” event is projected to be closer to a “one in
25 year” event and happen more unpredictably.
Mean wind speed has decreased and is projected to continue to decrease, however, extreme
events are projected to have higher wind speeds.
Lake Huron is projected to warm by ~3˚C and the ice free period increase by 45-62 days by 2071-
2100.
Lake Huron levels are projected to fluctuate within historical range of variability, several models
suggest the mean level may be lower, while at least one suggests higher.
Wildfire season length is projected to increase by 20-40 days by 2040-2070. Conditions for more
intense fire behaviour are projected.
Climatic envelopes are projected to change (northward at 3 km/yr) and will no longer be suitable
for many species, particularly those with northern affinities. For instance, a 42% turnover in bird
species is projected by 2100. Plant hardiness zone will change and no longer be suitable for 1000
species.
Visitation is expected to increase, particularly in the autumn.
Human health issues include the impact of extreme heat events and the northward movement of
vector-borne diseases such as Lyme disease and Ehrlichia.
Assets and infrastructure will be exposed to more extreme weather events and wildfire.
Tobermory
(RCP 8.5)
Climograph for Tobermory area. Modelled monthly mean temperature and total precipitation for the 1976-2005
baseline and 2021-2050 future projection (RCP 8.5). Figure source: Climate Atlas of Canada
(https://climateatlas.ca/).
3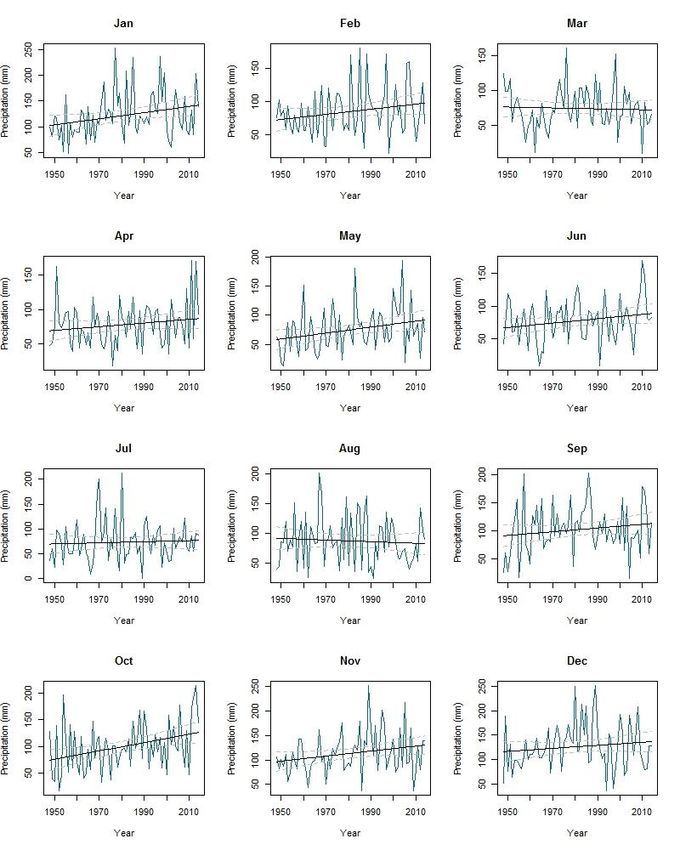
1. Historic Climate
Moderated by its maritime location, the climate of Bruce Peninsula National Park and Fathom Five
National Marine Park (BP/FF) is humid and temperate with warm summers (daily mean of 18.5˚C) and
cool winters (daily mean of -6.1˚C). The summer months are dominated by hot, humid air masses
originating in the Pacific Ocean and the Gulf of Mexico (with extreme maximums reaching 35˚C).
Winters have an increase in Pacific air which is displaced over the season by cold Arctic currents (with
extreme minimums as low as -36˚C). The most prolonged cold periods occur when large Arctic high
pressure air masses stall over Hudson Bay. Spring and autumn represent transitional periods; the autumn
typically being the most turbulent with a relatively high frequency of storms.

Lake Huron tends to buffer macroclimatic extremes. In the spring and summer, the colder lake cools
coastal areas by a few degrees. Conversely, in the autumn and winter the warmer lake moderates
temperatures, often delaying frost for several weeks. Moisture picked up from the lake by prevailing
winds can cause lake effect fog, rain or snow. The annual mean water temperature for Lake Huron is
8.8˚C, with a maximum mean of 21.1˚C and a minimum mean of 1.1˚C. Mean maximum ice cover for
Lake Huron is 51.7%.

Winds are predominately from the southwest to west, with mean speeds of 10 km/hr in summer and 14
km/hr in the other seasons. Normal wave height is 0.7 m during the summer and may exceed 3 m during
strong wind events. Some spectacular storms, especially in the autumn and winter, can experience winds
>80 km/hr and wave heights >5 m.

Climate “normals” (1981-2010) for Wiarton. Figure source: Environment and Climate Change Canada
(http://climate.weather.gc.ca/climate_normals/)

                                                    4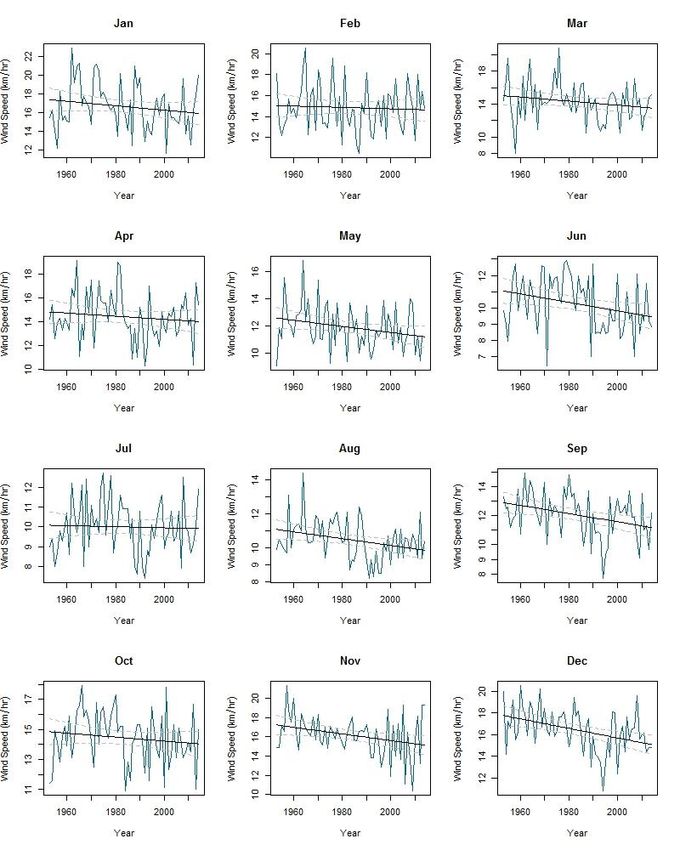
1.1 Temperature
Gore Bay is the closest meteorological station (6092920) with long term temperature data in the AHCCD
(ECCC, 2017). Trends from 1916 to 2016 determined using a generalized linear model (R Core Team,
2017) including 95% confidence intervals. “*” = statistically significant trend (P
1.2 Precipitation
Wiarton is the closest meteorological station (6119500) with long term precipitation data in the AHCCD
(ECCC, 2017). Trends from 1948 to 2014 determined using a generalized linear model (R Core Team,
2017) including 95% confidence intervals. “*” = statistically significant trend (P
*                                                      *

Wiarton total annual rain demonstrated a statistically significant (P
2. Projected Climate Trends
2.1 Temperature
RCP 2.6 RCP 4.5 RCP 8.5
2011-2040
2041-2070
2071-2100
Change from baseline (˚C)
0.0 1.0 2.0 3.0 4.0 5.0 6.0 7.0 8.0
0.5 1.5 2.5 3.5 4.5 5.5 6.5 7.5 8.5+
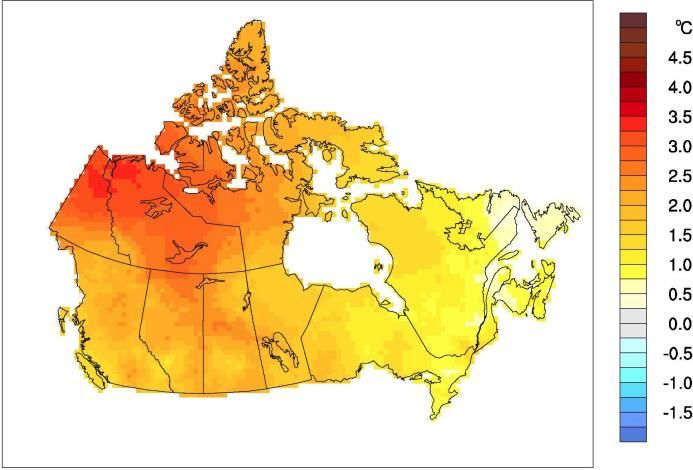
Projected mean annual temperature increase for the Bruce Peninsula from a 1980-2010 baseline. Composite
projection of CanESM2, CESM1CAM5, HADGEM2ES and MIROCESM. Data source: Natural Resources Canada,
Canadian Forest Service, http://cfs.nrcan.gc.ca/projects/3 (Price et al., 2011).
8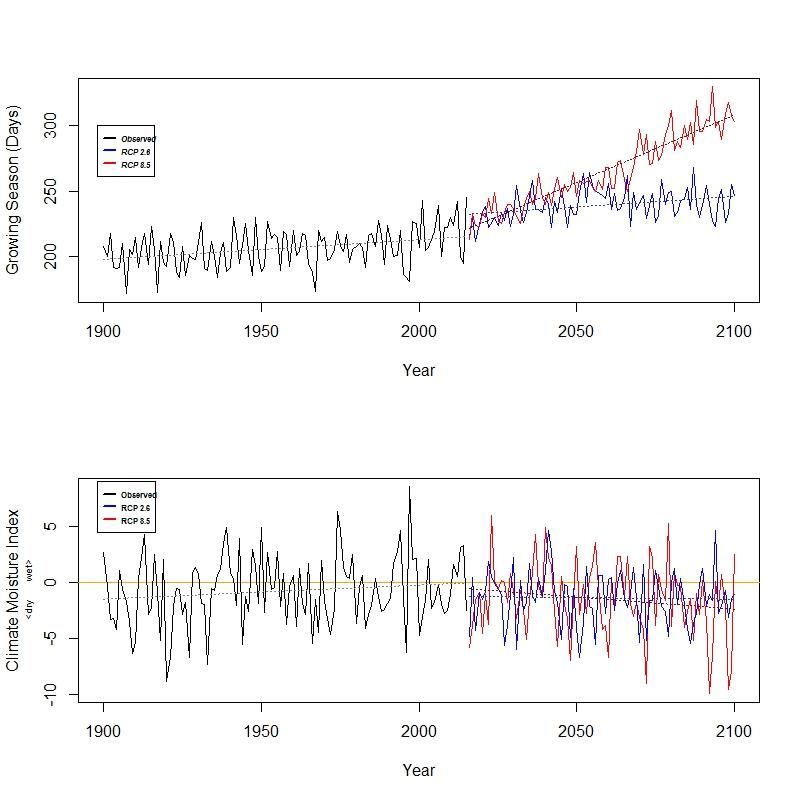
Temperature projections for the BP/FF area from PCIC (2014):
Mean annual temperature is projected (RCP 4.5-RCP 8.5) to increase by 1.9-2.1°C by 2021-2050
and 2.9-4.3°C by 2051-2080.
Winter time is projected to warm the greatest (e.g., 3.7-5.3°C by 2051-2080).
The nighttime period is projected to warm faster than the daytime period.
The number of +30°C days is projected to increase from 0.8 days/year (1976-2005 baseline) to
between 9.4 (RCP 4.5) and 21.3 (RCP 8.5) days/year by 2051-2080.
The number of -30°C days is projected to decrease from 0.8 days/year (1976-2005 baseline) to
between 0.2 (RCP 4.5) and 0.1 (RCP 8.5) days/year by 2051-2080.
Growing Season
Growing Season is calculated as the number of days between the last occurrence of 0°C in spring and the
first occurrence of 0°C in autumn. The metric is a widely used indicator of plant photosynthetic activity
(http://www.nrcan.gc.ca/forests/climate-change/forest-change/18470). Data courtesy of Dan McKenney
and John Pedlar, Canadian Forest Service. Generalized linear model developed in R (R Core Team,
2017).
Growing Season Length for Tobermory, ON. The historic period and the RCP 2.6 and 8.5 future scenarios all
demonstrate a statistically significant (P2.2 Precipitation
Observed and projected total annual precipitation for the Tobermory area. Statistically downscaled data
derived from 12 CMIP5 global climate models (PCIC, 2014). Both the RCP 4.5 and RCP 8.5 scenarios project an
increase in the mean estimate for total annual precipitation of 9% by 2051-2080. See Appendix 2 for scatterplot of
model projections. Figure source: Climate Atlas of Canada, https://climateatlas.ca/.
Other precipitation projections:
Wang et al. (2017) project that total annual precipitation will increase by 7.5%, 10.1% and 5.9%
in the 2030s, 2050s and 2080s respectively relative to the 1961-1990 baseline.
Precipitation patterns are expected to change, including more falling as rain than snow, an
increase in the amount of spring time precipitation and an increase in the intensity of precipitation
events (e.g., Cheng et al., 2012a; Deng et al., 2016; Wang et al., 2015). It is projected that the
mean number of days/year with heavier precipitation (+20 mm) will increase from 5.7 (1950-
2005) to 6.4 (2021-2050) to 7.0 (2051-2080) (PCIC, 2014). As well, reduced ice cover and
greater wind fetch enhances lake evaporation, resulting in greater lake-effect precipitation. Local
air temperatures will determine if the precipitation falls as snow or rain (Kunkel et al., 2009;
Notaro et al., 2015b; Notaro et al., 2014).
Summer drought conditions are projected to increase due to decreased summer rain and increased
temperature and evapotranspiration (Bonsal et al., 2011).
10Rainfall Intensity, Duration and Frequency (IDF)
These rainfall IDF values are calculated with IDF_CC Tool 3.0 (http://idf-cc-uwo.ca/; Simonovic et al. (2017)) using Generalized Extreme Values
(GEV). The Ontario Ministry of Transport also maintains an accessible IDF database, http://www.mto.gov.on.ca/IDF_Curves/terms.shtml.
Baseline total precipitation amounts (mm) for Wiarton from 1973-2007.
Projected (2050-2100) precipitation (mm) for Wiarton using an ensemble of models and RCP 4.5.
Projected (2050-2100) precipitation (mm) for Wiarton using an ensemble of models and RCP 8.5.
Wiarton IDF observations and projections. Observe that today’s “one in 100 year” rainfall event (i.e., 61.39 mm/hr) is projected to be closer to a “one in 25
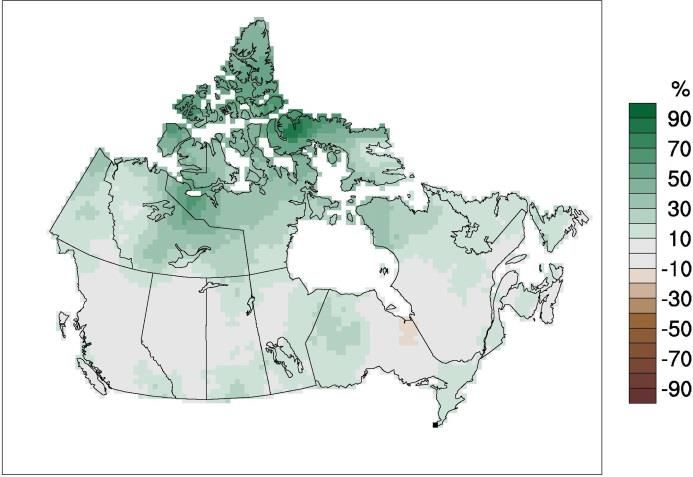
year” event by 2050-2100 for both RCP scenarios and the future “one in 100 year” rainfall event is projected to increase in intensity (i.e., ~83 mm/hr).Climate Moisture Index The Climate Moisture Index (CMI) is calculated as the difference between annual precipitation and potential evapotranspiration. A positive CMI value indicates wet conditions and a negative value indicates dry conditions (http://www.nrcan.gc.ca/forests/climate-change/forest-change/17772). Data courtesy of Dan McKenney and John Pedlar, Canadian Forest Service. Generalized linear model developed in R (R Core Team, 2017). Climate Moisture Index (CMI) for Tobermory, ON. No statistically significant (P
3. Climate Change Impacts
3.1 Water Temperature and Levels
Lake Huron
Lake summer surface water temperature for eastern Lake Huron and Georgian Bay has increased
by 0.11 and 0.07˚C/year respectively from 1994 to 2013 (Mason et al., 2016).
Surface water temperatures for Lake Huron are projected to increase 2.6-3.9°C by 2071-2100
relative to a 1971-2000 baseline (Trumpickas et al., 2009).
An earlier onset and longer period of thermal stratification is expected (Zhong et al., 2016). For
instance, the number of days with a surface water temperature greater than 4°C is projected to
increase by 45-62 days by 2071-2100 relative to a 1971-2000 baseline (Dove-Thompson et al.,
2011; Trumpickas et al., 2008).
Wang et al. (2012) report that the spatial extent of ice coverage on Lake Huron has declined by
62% from 1973 to 2010. Mason et al. (2016) also report that a significant decline in ice cover
duration of -0.67 days/year has occurred for Lake Huron.
Ice cover is projected to continue to decline (e.g., by half, see figure 8 in Notaro et al., 2015b).
Lake level data is available for the Tobermory Hydrographic Station (02FA003) from 1962 to
present day (e.g., http://collaboration.cmc.ec.gc.ca/cmc/hydrometrics/www/ or http://tides.gc.ca).
Although no analysis was undertaken for this report, the data does highlight the variability in lake
levels across times scales from hours to decades, with a recorded minimum/maximum difference
of 2.2 m at this station.
Lake precipitation, basin runoff and lake evaporation are the primary drivers of water levels (IJC,
2009).
Many of the earlier studies predicted lower lake levels due to climate change (e.g., Croley, 1990).
More recent studies suggest that future lake levels will fluctuate within the historical range of
variability but with a lower mean level (e.g., -14 to -25 cm from current) (IJC, 2012; Lofgren and
Rouhana, 2016; MacKay and Seglenieks, 2013; Music et al., 2015) and one study suggests that
lake levels will be higher (+42 cm from current) (Notaro et al., 2015a).
Phosphorus loading into lake is expected to be higher in spring due to increased precipitation and
runoff from agricultural fields and decrease in summer (Collingsworth et al., 2017).
Inland Waters
While there are a few discrete water flow and level records for some lakes and streams in BP/FF, there is
no long term dataset on which to assess trends. The closest hydrographic station is maintained by
Environment and Climate Change Canada, located on the Stokes River at Hwy. 6 (Station ID: 02FA002,
summary data link).
13Stokes River annual flow data (HYDAT database, Jan. 17, 2018 release). Although a statistically significant
(P8˚C).
The majority of peak flows occur in March or April and may be attributed to rain on snow events.
Additional information on inland waters:
The ice free period for the inland waters of Bruce County is projected to increase by 9.6 to 22.6
days by 2041-2070, with spring break-up occurring 1.7 to 7.2 days earlier and freeze-up 7.9 to
15.4 days later (Minns et al., 2014).
Stream temperatures are expected to increase as air temperatures increase (Chu, 2015). Brook
Trout is an example of a species in BP/FF already vulnerable to stream temperature maximums
in Willow and Dorcas Creeks and are known to occupy groundwater discharge and shaded
riparian areas as refugia during summer. This cooling benefit could be reduced as groundwater
warms or riparian areas are opened (e.g., beavers, logging, etc…) (Meisner et al., 1988).
Maximum spring runoff is occurring earlier and with a lower amplitude, flooding from more
extreme precipitation events is expected to increase (Adamowski et al., 2013; Cheng et al.,
2012b; Cunderlik and Ouarda, 2009; Jones et al., 2015; Karl et al., 2009).
Chu (2015) indicates (Figure 3) that the wetlands in BP/FF area have a high vulnerability to
drying due to changes in air temperature and precipitation by the 2080s.
143.2 Wildfire
2011-2040
2041-2070
2071-2100 RCP 4.5 RCP 8.5
0-10 10-20 20-40 40-60 >60
Projected increase in wildfire season for the Bruce Peninsula area. Increased length in days from baseline
(1981-2010) under RCP 4.5 and RCP 8.5 scenarios. Data source: Natural Resources Canada,
http://cfs.nrcan.gc.ca/fc-data-catalogue.
15Additional information on wildfire:
Lightening has a positive correlation with temperature, increasing risk of wildfire ignitions (e.g.,
Veraverbeke et al., 2017; Woolford et al., 2014).
Flannigan et al. (2016) demonstrate that seasonal precipitation must increase 15% to offset every
1˚C rise in temperature. Wotton et al. (2005) project drier forest floor conditions for Ontario,
including the Bruce Peninsula, and predict a province-wide increase in the number of wildfires. In
considering the climate projections for BP/FF, spring precipitation is only projected to increase
by 5.6% for every degree warming and summer precipitation is projected to decline by 0.7% per
every degree warming, thus an increase risk due to drier conditions is possible.
More severe fire weather (heat and drought) may create conditions (i.e., intensity >10,000 kW/m)
where fire suppression is no longer feasible or effective (Colombo, 2008; Podur and Wotton,
2010; Wotton et al., 2017). In the context of BP/FF and in particular maturing jackpine (S2) and
assumed increase in dead balsam fir (M3) stands, a potential increase in fuel types/loads to
support more intense conditions may have occurred since last assessed using 1994 imagery (Del
Degan and Masse et Associes Inc., 2007).
Provincially, Fire Weather Index and Fire Severity values are projected to increase (Lemieux et
al., 2007; Podur and Wotton, 2010; Wotton et al., 2017; Wotton et al., 2005).
An increase in deciduous species may reduce the amount of crown fire and total fuel consumption
(Terrier et al., 2013). However, spring time before leaf-out, still remains a potentially higher risk
wildfire period in BP/FF (Del Degan and Masse et Associes Inc., 2007).
3.3 Biodiversity
Biodiversity is the variety of genes, species and ecosystems and is essential to our social, economic and
ecological well-being. “Agricultural expansion, over-exploitation and introduction of invasive alien
species have been the main drivers of biodiversity loss in the recent past, but several lines of research
suggest that climate change could become a prominent, if not leading, cause of extinction over the coming
century” (Pacifici et al., 2015; Thomas et al., 2004). The latest “Living Planet Report” (WWF, 2017),
cites climate change as a key driver of wildlife loss and reports that half of Canada’s monitored species
(451 of 903) are in decline, and of those, the average decline is 83%.
The effects of climate change on biodiversity are fairly well documented and include (e.g., Nantel et al.,
2014; Nituch and Bowman, 2013):
• Shifts in species distribution.
• Changes in phenology.
• Decoupling of interactions (plant-pollinator)
• Reductions in population size.
• Species extinction and extirpation.
• Habitat loss.
• Increased disease and spread of invasive species.
• Competitive exclusion.
• Change to ecosystem services.
16Climate Velocity
AdaptWest (https://adaptwest.databasin.org/) provides integrative tools that can inform conservation
planning, including the following analysis on climate velocity.
Forw ard m ultivariate clim atic
velocity in km /yr for ensemble
RCP8.5 projection 1995-2055Plant Species
Projected climate refugia areas for tree species. Refugia index based on niche-based velocities for 324 tree
species derived from McKenney et al. (2011). The refugia values for BP/FF are moderate (0.1 – 0.13). Inset image
of Canada/USA. Date source: AdaptWest (https://adaptwest.databasin.org/), for study details see Stralberg et al.
(2018).
Plant Hardiness is associated with probabilities of plant survival in relation to average, broad scale
climatic conditions. As the climate changes, habitat suitability for plant species also changes. Natural
Resources Canada maintains a database that includes future projections of plant hardiness
(http://www.planthardiness.gc.ca/). A query of this database revealed a future decline in the number of
species in BP/FF (45.2N, -81.6W), see Table 1.
Table 1. Potential plant species richness for BP/FF based on current and future plant hardiness projections.
1971-2000 2011-2040 2041-2070 2071-2100
Full Range 1291 1230 664 245
Core Range 550 390 102 26
Eastern white cedar (Thuja occidentalis) is an example of a species whose core and full range is projected to change.
Currently the Bruce Peninsula includes core range, but by the end of century it is projected to decline. More models
and information for this species at: http://planthardiness.gc.ca/index.pl?m=9b&lang=en&speciesid=1001217. Most
of the tree species in BP/FF considered dominant or co-dominnant will experience similar declines, e.g., balsam fir
and american beech will no longer be within their climate envelopes (core or full rnage), and sugar maple will no
longer be within its core range, but will still be within its full range.
18Additional information on plants:
BP/FF is a transition zone with species at both their northern and southern range. As the climate
envelope for boreal tree species (e.g., black spruce, white spruce, jack pine, balsam fir, trembling
aspen) becomes less suitable (see reference to "deborealize" in Taylor et al., 2017), conditions
will become more favourable for Great Lakes-St. Lawrence species (e.g., white pine, red pine,
sugar maple, red oak) (e.g., McKenney et al., 2010; Walker et al., 2002; Warren et al., 2013).
Using future climatic envelopes for 63 native tree species in Ontario, Crowe and Parker (2011)
modelled the optimal location for additional reserves, both with and without the need for
migration, to protect these representative species. The base of the Bruce Peninsula (5) was
identified as one potential location.
Plant productivity may increase due to increased CO2, that is, if species are not otherwise limited
by habitat conditions (e.g., soil, moisture, nutrients, light, or pollinators) or disturbances (e.g.,
fire, flooding, or drought) (Warren et al., 2013).
Climate change could create conditions which are more favourable for invasive species, and
coupled these two impacts presents an important threat to BP/FF’s biodiversity (e.g., Mainka and
Howard, 2010; Walther et al., 2009). For instance, beech are already sensitive to climate change
(e.g., flooding/drought events) and are now facing high rates of mortality from invasive beech
bark disease (Stephanson and Ribarik Coe, 2017). The invasive emerald ash borer doubled its rate
of infestation in Toronto during a recent hot summer, further devastating trees already stressed by
warm and dry conditions (https://toronto.ctvnews.ca/hot-dry-weather-accelerated-toronto-s-
emerald-ash-borer-tree-crisis-1.3044828) (DeSantis et al., 2013). There is strong association
between warmer temperatures and invasive gypsy moth distribution (potential threat to hardwood
forests) (Regniere et al., 2009).
Bird Species
Projected climate refugia areas for songbird species. Refugia index based on niche-based velocities for 268
songbirds derived from Distler et al. (2015). The refugia values for BP/FF are moderate to low (0.18 – 0.2). Inset
image of Canada/USA. Data source: AdaptWest (https://adaptwest.databasin.org/), for study details see Stralberg et
al. (2018).
19The following figures are clipped from the National Audubon Society’s online “The Climate Report”
(Audubon, 2015). Yellow indicates summer range and the darker the shading, the more likely the bird
species will find suitable climatic conditions to survive. The year 2000 and 2080 are presented here, but
intermediate years are also provided. Maps are available for 314 climate threatened (may lose 50% of
current rage by 2080) or climate endangered (may lose over 50% of current range by 2050) bird species.
2000 2080
1. Black-throated Green Warbler. Northward shift, 3% of the current climate space available.
2. Ovenbird. Projected large shift northward in summer habitat.
3. Veery. 89% decline in summer range by 2080.
20Additional information on birds:
A query of Audubon (2015) revealed: A. BP/FF may become less suitable for species such as:
American bittern (summer), bank swallow (summer), pine grosbeak (winter), ruffed grouse
(winter), bohemian waxwing (winter), mourning warbler (summer), least flycatcher (summer),
etc… B. BP/FF may become more suitable for species such as: Bufflehead (winter), black-
crowned night heron (winter), dunlin (winter), gadwall (winter), laughing gull (summer), short-
eared owl (winter), hermit thrush (winter), etc… Season of range change in brackets ().ArcGIS
geodatabases for these and 610 other bird species are available from the USGS ScienceBase-
Catalog (https://www.sciencebase.gov/catalog/item/55897deae4b0b6d21dd61c9d).
Wu et al. (2018) report that by 2050 on average 23% of bird species in found in a given US
national park could be completely different.
Based on changing climatic conditions Lindsay et al. (2016) project that for the BP/FF area the
percent species turnover for migratory bird species could increase from 12% in 2011-2040 to
35% by 2071-2100. The percent species turnover for all bird species could increase from 16%
in 2011-2040 to 42% by 2071-2100. Species turnover is calculated as a composite measure of
species loss (i.e., % of species currently in a cell whose projected future range does not include
the cell) and species gain (i.e., % increase in species due to range expansion).
Earlier peaks in insect populations and plant biomass have been observed and may mismatch with
migrant bird hatchling growth and development (e.g., asynchrony between wood warbler and
eastern spruce budworm) (Knudsen et al., 2011; Nituch and Bowman, 2013).
Rempel and Hornseth (2017) completed a climate change vulnerability assessment for wood
thrush and eastern meadowlark. While the assessment confirmed that these species are highly
vulnerable to climate change, their persistence in the BP/FF area was projected through to 2100.
Other Terrestrial Species
Community level effects from climate change to terrestrial biodiversity in Ontario, including a
summary of effects to 181 terrestrial vertebrate species, is discussed by Nituch and Bowman
(2013). Documented effects include population expansion for 68 species (e.g., wood frog, gray
treefrog, American woodcock, northern rough-winged swallow, little brown bat, meadow vole,
opossum), population contraction for 11 species (e.g., painted turtle, black-capped chickadee,
alder flycatcher, northern flying squirrel) and equivocal for the other 102 species assessed.
A vulnerability assessment for the eastern massasauga rattlesnake predicts that the northern
Bruce Peninsula population will experience high persistence and is stable/least decline in the face
of climate change (Pomara et al., 2014). In addition to land cover (habitat) change, winter
drought and summer flooding (i.e., extreme fluctuations in water table, especially near
hibernacula) were strongly associated with population declines throughout its range.
The distribution and impacts of pathogens and parasites are expected to increase with warmer
temperatures and the northward migration of species (Marcogliese, 2008; 2016).
Aquatic Species
A recent shift to smaller diatom species in the Great lakes may be attributed to warming waters
(Bramburger et al., 2017), however, it appears Lake Huron is not responding to climatic drivers
as quickly as Lakes Ontario and Superior (Reavie et al., 2016; Wang et al., 2012).
Prolonged periods of low lake levels with minimal fluctuations is shown to reduce coastal
wetland area and species diversity (Langer et al., 2018; Midwood and Chow-Fraser, 2012;
Mortsch et al., 2006). During the 1999-2014 low period experienced in FF coastal wetlands
21became stranded, disconnecting potential spawning and nursery habitats, and exposed lakebeds
were more vulnerable to invasive phragmites and narrow-leaved cattail (Parker et al., 2015).
In Ontario, fish distribution has been observed to move northward at a rate of 12-17 km/decade.
Cold-water fishes (e.g., brook trout, lake trout, lake whitefish) are seeking refuge further north
and in deeper waters, while cool- and warm-water fishes (e.g., walleye, smallmouth bass) are
moving into vacated habitats and warmer waters (Alofs et al., 2014; Chu, 2015; Dove-Thompson
et al., 2011). While species fish richness is projected to increase, functional diversity is expected
to decline (Biswas et al., 2017).
The first record of white bass in FF occurred in 2013 (pers. com. S. Campbell). This is a
temperate species known to prefer warmer waters.
As a response to warmer waters, 27 species of fish, including non-native species, may move
northward into Ontario (Mandrak, 1989).
Phenological mismatches including changes in the timing of larval fish emergence and
zooplankton production are possible and in need of further study (Collingsworth et al., 2017).
Ice cover can protect incubating eggs (e.g., lake trout, lake whitefish) by ameliorating wave
action on shallow spawning shoals (Brown et al., 1993). The potential impact of less ice cover on
spawning shoals in FF is uncertain.
Warmer spring and summer temperatures have been shown to have a positive influence on yellow
perch and walleye recruitment in Lake Huron (Collingsworth et al., 2017; Honsey et al., 2016).
While water temperatures in the inland lakes are projected to increase there is a high probability
that conditions will remain thermally suitable for smallmouth bass in the 2050s and 2080s, there
is, however, a very low probability they will remain suitable for walleye (e.g., in Cyprus Lake)
(Van Zuiden et al., 2016).
3.4 Visitor Experience and Operations
Visitor Experience
Visitation Patterns
Although visitation patterns are monitored in BP/FF during the operational season, assessing and
predicting the influence of climate change on total visitation or park specific activities has not been
explicitly studied. However, it is expected that visitation will increase due to an earlier spring and warmer
summer and autumn conditions. Naturally, knowledge from other studies may help to inform
management actions in this regard, for example:
Visitation is projected to increase in Ontario’s provincial parks by the 2020s (11–27%) due to a
warmer climate, and this increase may be even higher (23-41%) when combined with
demographic changes (Jones and Scott, 2006b).
Maximum and minimum temperature were determined to be most influential climate variable for
predicting visitation in 15 national parks (these parks accounted for 86% of Parks Canada’s
visitation at the time) (Jones and Scott, 2006a).
At Pinery Provincial Park critical temperature thresholds for visitation were revealed as being less
than 11˚C and above 29˚C during the shoulder season and above 33˚C during the peak season.
Modelled projections resulted in a 3.1% increase in annual visitation for every degree of warming
(+1 to +5), despite increases in precipitation. Shoulder season visitation, particularly the autumn,
is expected to increase (Hewer et al., 2016; Hewer et al., 2015; Hewer et al., 2017a; 2017b).
The US National Park Service examined visitation response across their network and found that it
generally increased as mean monthly temperatures increased, but decreased strongly as
temperatures exceeded 25˚C. Future climate/visitation projections suggest that there is a complex
22and cascading effect and a need to develop park and neighbouring community adaptation
strategies (Fisichelli et al., 2015).
Recreational Opportunities
Although not specific to BP/FF, Hewer and Gough (2018) reviewed 30 years of climate change
impacts on outdoor recreation in Canada, including increased risks to cold-weather activities and
opportunities for warm weather activities.
Dorcas Bay and other recreational beaches may face closures due to poor recreational water
quality from warmer waters and increased nutrient and bacteria loads (e.g., stormwater runoff).
Harmful algal blooms and filamentous algae growth will increase under such conditions as well
(Barton et al., 2013; Reavie et al., 2014).
Low water levels may affect vessel access to Flowerpot Island and navigational safety near the
islands and shoals (Shlozberg et al., 2014).
Decreased snowpack will negatively impact winter recreational activities such as snowshoeing,
skiing, ice fishing, ice travel and snowmobiling.
A longer and more intense fire season will affect visitor safety and experience (e.g., area closures,
no campfires).
Human Health
Lyme disease (tick carrying the borrelia pathogen), which was formerly restricted to localized
areas by temperature and relative humidity, is expected to expand to the entire Great Lakes region
including BP/FF by mid-century (Eisen et al., 2016; Ogden et al., 2006). Other pathogens
associated with black legged ticks include arboviruses (encephalitis), Anaplasma, Ehrlichia,
Babesia, Rickettsia and Bartonella (Nelder et al., 2016). Lyme disease and arbovisruses are
reportable in Ontario. Companion animals are also at risk to Lyme and other tick-borne diseases
(e.g., Public Health Ontario, 2017).
Increasing incidences of West Nile Virus (mosquito vector) have been linked to climate change,
including the temperature for mosquito development (14-35˚C) and the extrinsic incubation
period (Chen et al., 2013; Soverow et al., 2009).
The literature suggests that climate change will increase the northward expansion of mosquito’s
and associated pathogens (Wudel and Shadabi, 2016). The range of Aedes albopictus which is a
vector for Zika virus, Dengue virus, Yellow fever and other diseases, is projected to expand into
parts of Ontario, including BP/FF, by 2041-2070 (Ogden et al., 2014).
Heat waves in the Grey Bruce Health Unit region are projected to increase from 0.10/year to
2.21/year by the 2080s (Gough et al., 2016).
Changing weather and increased temperature can affect the rate of photochemical smog formation
(e.g., ozone). However, future ozone exceedances (>80 ppb) for the Grey Bruce Health Unit
region only suggests an increase from todays 9 days/year to 10 days/year by the 2080s (Gough et
al., 2016).
Extreme weather events are the top risk globally in terms of likelihood and the second highest
risk in terms of impact (after weapons of mass destruction) (World Economic Forum, 2018). At
BF/FF intense rainfall, lightning storms, hail, extreme winds and wildfire events are all potential
hazards whose risks are projected to increase (e.g., Brimelow et al., 2017; Cheng et al., 2012a;
IPCC, 2012). Besides a potential role in emergency preparedness and response, protected areas
are increasingly being recognized as a “natural solution” in terms of disaster risk reduction (e.g.,
flood control, protection from storm surge, etc…) (e.g., Dudley et al., 2015; Lo, 2016; Murti and
Buyck, 2014).
23Interpretation and Communication
Climate change is a theme in Parks Canada’s communication and interpretation programs (e.g.,
https://www.pc.gc.ca/en/nature/science/climat-climate). By engaging and inspiring the public, Parks
Canada is able to build support for its mandate and adaptation actions. A place for “natural solutions” is a
concept used to frame and present Parks Canada’s response to climate change mitigation and adaptation,
as it highlights the importance and effectiveness of ecosystem-based approaches (e.g., CPC, 2013;
NAWPA, 2012)
"The changing climate surrounds us, compelling us to tell the story" (US NPS). Of related interest, is the
US National Park Service climate change interpretation and education strategy (US NPS, 2016) and
climate change interpreter training (http://idp.eppley.org/training/specialist/interpreting-climate-change).
Parks Canada staff have found this training to be very helpful.
Assets and Infrastructure
The impacts to Canada’s assets and infrastructure from climate change are well documented (e.g., Boyle
et al., 2013; Canada, 2017; Palko and Lemmen, 2017; Warren and Lemmen, 2014) and are explicitly
mentioned as a concern in Parks Canada’s Departmental Plan (Parks Canada, 2017). Although an
assessment of vulnerabilities and risks to infrastructure has not been completed at BP/FF, in light of the
information in this report, expected concerns could include:
Flooding from intense rainfall and winter rain events, overwhelming surface drainage capacity,
particularly undersized or debris filled culverts, and damaging facilities, washing out roads, etc…
Freezing rain or hail damage to buildings and power/communication lines.
Longer wildfire season and more intense burns, especially given the high urban interface.
Increased lake storm intensity and less ice cover increases risk of coastal flooding and erosion.
Although BP/FF has relatively little coastal infrastructure, there may be a need to clean up debris
washed in from other areas.
Longer seasonal use of trails and roads (one benefit, less frost damage to roads in milder winters).
Increased temperatures could lead to premature weathering. Similarly, increased spring rains
could lead to premature weathering and deterioration (e.g., building foundations, corrosion, and
mold).
Summer drought increases water demands and may exceed system capacity.
The energy demands for cooling buildings will increase.
Of related interest, the “Public Infrastructure Engineering Vulnerability Committee” (PIEVC, 2008)
undertook an assessment of risks to the water supply system near Point Pelee National Park (Genivar,
2013) and surface drainage near Rouge National Urban Park (Genivar, 2010; 2011). Concerns with
freezing rain (e.g., transmission lines) and culvert capacity are highlighted in these reports.
An assessment of greenhouse gas (GHG) emissions was not in the scope of this report. However, it is
important to observe that throughout the document different RCP scenarios were presented and if we
meet (and celebrate) RCP 2.6 or continue to track (and mourn) RCP 8.5, depends entirely on our actions
to address and reduce GHG emissions today. Federally the government is committing to reducing GHG
emissions by 80% below 2005 levels by 2050 (https://www.canada.ca/en/treasury-board-
secretariat/services/innovation/greening-government/strategy.html). Also see Parks Canada’s 2015 Master
Plan to reduce GHG emissions (Parks Canada, 2015).
244. References
Adamowski, J., Adamowski, K., and Prokoph, A. (2013). Quantifying the spatial temporal variability of annual
streamflow and meteorological changes in eastern Ontario and southwestern Quebec using wavelet analysis
and GIS. Journal of Hydrology, 499, 27-40. doi:10.1016/j.jhydrol.2013.06.029.
Alofs, K. M., Jackson, D. A., and Lester, N. P. (2014). Ontario freshwater fishes demonstrate differing range-
boundary shifts in a warming climate. Diversity and Distributions, 20(2), 123-136. doi:10.1111/ddi.12130.
Audubon. (2015). Audubon’s Birds and Climate Change Report. National Audubon Society. Contributors: Gary
Langham, Justin Schuetz, Candan Soykan, Chad Wilsey, Tom Auer, Geoff LeBaron, Connie Sanchez,
Trish Distler, New York. http://climate.audubon.org/.
Barton, D. R., Howell, E. T., and Fietsch, C. L. (2013). Ecosystem changes and nuisance benthic algae on the
southeast shores of Lake Huron. Journal of Great Lakes Research, 39(4), 602-611.
doi:10.1016/j.jglr.2013.09.010.
Biswas, S. R., Vogt, R. J., and Sharma, S. (2017). Projected compositional shifts and loss of ecosystem services in
freshwater fish communities under climate change scenarios. Hydrobiologia, 799(1), 135-149.
doi:10.1007/s10750-017-3208-1.
Bonsal, B. R., Wheaton, E. E., Chipanshi, A. C., Lin, C., Sauchyn, D. J., and Wen, L. (2011). Drought Research in
Canada: A Review. Atmosphere-Ocean, 49(4), 303-319. doi:10.1080/07055900.2011.555103.
Boyle, J., Cunningham, M., and Dekens, J. (2013). Climate Change Adaptation and Canadian Infrastructure. A
review of the literature. International Institute for Sustainable Development (IISD).
http://www.iisd.org/sites/default/files/publications/adaptation_can_infrastructure.pdf.
Bramburger, A. J., Reavie, E. D., Sgro, G. V., Estepp, L. R., Shaw Chraïbi, V. L., and Pillsbury, R. W. (2017).
Decreases in diatom cell size during the 20th century in the Laurentian Great Lakes: A response to
warming waters? Journal of Plankton Research, 39(2), 199-210. doi:10.1093/plankt/fbx009.
Brimelow, J. C., Burrows, W. R., and Hanesiak, J. M. (2017). The changing hail threat over North America in
response to anthropogenic climate change. Nature Clim. Change, advance online publication.
doi:10.1038/nclimate3321
http://www.nature.com/nclimate/journal/vaop/ncurrent/abs/nclimate3321.html#supplementary-information.
Brown, R. W., Taylor, W. W., and Assel, R. A. (1993). Factors Affecting the Recruitment of Lake Whitefish in Two
Areas of Northern Lake Michigan. Journal of Great Lakes Research, 19(2), 418-428. doi:10.1016/s0380-
1330(93)71229-0.
Canada. (2017). Pan-Canadian Framework on Clean Growth and Climate Change first annual report. Government
of Canada. https://www.canada.ca/en/services/environment/weather/climatechange/pan-canadian-
framework/first-annual-report.html.
Chen, C. C., Jenkins, E., Epp, T., Waldner, C., Curry, P. S., and Soos, C. (2013). Climate Change and West Nile
Virus in a Highly Endemic Region of North America. International Journal of Environmental Research
and Public Health, 10(7), 3052-3071. doi:10.3390/ijerph10073052.
Cheng, C. S., Auld, H., Li, Q., and Li, G. L. (2012a). Possible impacts of climate change on extreme weather events
at local scale in south-central Canada. Climatic Change, 112(3-4), 963-979. doi:10.1007/s10584-011-0252-
0.
Cheng, C. S., Li, Q., Li, G., and Auld, H. (2012b). Climate Change and Heavy Rainfall-Related Water Damage
Insurance Claims and Losses in Ontario, Canada. Journal of Water Resource and Protection, 4, 49-62.
doi:http://dx.doi.org/10.4236/jwarp.2012.42007.
Cheng, C. S., Lopes, E., Fu, C., and Huang, Z. Y. (2014). Possible Impacts of Climate Change on Wind Gusts under
Downscaled Future Climate Conditions: Updated for Canada. Journal of Climate, 27(3), 1255-1270.
doi:10.1175/jcli-d-13-00020.1.
Chu, C. (2015). Climate Change Vulnerability Assessment for Inland Aquatic Ecosystems in the Great Lakes Basin,
Ontario. Ontario Ministry of Natural Resources and Forestry.
http://www.climateontario.ca/MNR_Publications/CCRR-43.pdf.
Collingsworth, P. D., Bunnell, D. B., Murray, M. W., Kao, Y. C., Feiner, Z. S., Claramunt, R. M., Lofgren, B. M.,
Hook, T. O., and Ludsin, S. A. (2017). Climate change as a long-term stressor for the fisheries of the
Laurentian Great Lakes of North America. Reviews in Fish Biology and Fisheries, 27(2), 363-391.
doi:10.1007/s11160-017-9480-3.
Colombo, S. J. (2008). Ontario’s Forests and Forestry in a Changing Climate. Ontario Ministry of Natural
Resources. https://www.ontario.ca/document/ontarios-forests-and-forestry-changing-climate.
25CPC. (2013). Canadian Parks and Protected Areas: Helping Canada Weather Climate Change. Parks Canada
Agency on behalf of the Canadian Parks Council. http://www.parks-
parcs.ca/english/CPC%20Climate%20Change%20Report%20FINAL%20engLR.pdf.
Croley, T. E. (1990). Laurentian Great Lakes double-CO2 climate change hydrological impacts. Climatic Change,
17(1), 27-47. doi:10.1007/bf00148999.
Crowe, K. A. and Parker, W. H. (2011). Conserving the diversity of Ontario tree species under multiple uncertain
climatic futures. Canadian Journal of Forest Research, 41(3), 533-542. doi:10.1139/x10-228.
Cunderlik, J. M. and Ouarda, T. (2009). Trends in the timing and magnitude of floods in Canada. Journal of
Hydrology, 375(3-4), 471-480. doi:10.1016/j.jhydrol.2009.06.050.
Del Degan and Masse et Associes Inc. (2007). Bruce Peninsula National Park of Canada and Fathom Five National
Marine Park of Canada Wildfire Risk Analysis. Prepared for Parks Canada
Deng, Z. W., Qiu, X., Liu, J. L., Madras, N., Wang, X. G., and Zhu, H. P. (2016). Trend in frequency of extreme
precipitation events over Ontario from ensembles of multiple GCMs. Climate Dynamics, 46(9-10), 2909-
2921. doi:10.1007/s00382-015-2740-9.
DeSantis, R. D., Moser, W. K., Gormanson, D. D., Bartlett, M. G., and Vermunt, B. (2013). Effects of climate on
emerald ash borer mortality and the potential for ash survival in North America. Agricultural and Forest
Meteorology, 178, 120-128. doi:10.1016/j.agrformet.2013.04.015.
Distler, T., Schuetz, J. G., Velásquez‐Tibatá, J., and Langham, G. M. (2015). Stacked species distribution models
and macroecological models provide congruent projections of avian species richness under climate change.
Journal of Biogeography, 42(5), 976-988. doi:10.1111/jbi.12479.
Dove-Thompson, D., Lewis, C., Gray, P. A., Chu, C., and I., D. W. (2011). A Summary of the Effects of Climate
Change on Ontario’s Aquatic Ecosystems. Ontario Ministry of Natural Resources.
http://files.ontario.ca/environment-and-energy/aquatics-climate/stdprod_088243.pdf.
Dudley, N., Buyck, C., Furuta, N., Pedrot, C., Renaud, F., and Sudmeier-Rieux, K. (2015). Protected areas as tools
for disaster risk reduction : a handbook for practitioners. MOEJ and IUCN, Tokyo and Gland,
Switzerland. https://portals.iucn.org/library/node/45054.
ECCC. (2017). Adjusted and Homogenized Canadian Climate Data (AHCCD). Environment and Climate Change
Canada. https://www.ec.gc.ca/dccha-ahccd/.
Eisen, R. J., Eisen, L., Ogden, N. H., and Beard, C. B. (2016). Linkages of Weather and Climate with Ixodes
scapularis and Ixodes pacificus (Acari: Ixodidae), Enzootic Transmission of Borrelia burgdorferi, and
Lyme Disease in North America. Journal of Medical Entomology, 53(2), 250-261. doi:10.1093/jme/tjv199.
Fisichelli, N. A., Schuurman, G. W., Monahan, W. B., and Ziesler, P. S. (2015). Protected Area Tourism in a
Changing Climate: Will Visitation at US National Parks Warm Up or Overheat? PLoS ONE, 10(6), 13.
doi:10.1371/journal.pone.0128226.
Flannigan, M. D., Wotton, B. M., Marshall, G. A., de Groot, W. J., Johnston, J., Jurko, N., and Cantin, A. S. (2016).
Fuel moisture sensitivity to temperature and precipitation: climate change implications. Climatic Change,
134(1), 59-71. doi:10.1007/s10584-015-1521-0.
Genivar. (2010). Toronto and Region Conservation Authority Flood Control Dam Water Resources Infrastructure
Assessment. Engineers Canada. https://pievc.ca/toronto-and-region-conservation-authority-claireville-and-
g-ross-water-control-dams.
Genivar. (2011). Climate Change Vulnerability Assessment for Culverts, City of Toronto. Engineers Canada.
https://pievc.ca/city-toronto-study-three-road-culverts.
Genivar. (2013). Union Water Supply System Climate Risk Assessment. Engineers Canada.
https://pievc.ca/sites/default/files/uwss_climate_risk_assessment_final_report_may_2013.pdf.
Gough, W., Anderson, V., and Herod, K. (2016). Ontario Climate Change and Health Modelling Study: Report.
Ontario Ministry of Health and Long-Term Care.
http://www.health.gov.on.ca/en/common/ministry/publications/reports/climate_change_toolkit/climate_cha
nge_health_modelling_study.pdf.
Gray, P. A., Perdeaux, S., and Cobb, P. (2017). Approaches for Integrating Climate Change into Natural Resource
Management and Management Planning for Protected Areas. A Review of the Literature. Ontario Ministry
of Natural Resources and Forestry
Gross, J. E., Woodley, S., Welling, L. A., and Watson, J. E. M. (Eds.). (2016). Adapting to Climate Change.
Guidance for protected area managers and planners. (Vol. No. 24). Gland, Switzerland: IUCN.
https://portals.iucn.org/library/node/46685.
26Hewer, M., Scott, D., and Fenech, A. (2016). Seasonal weather sensitivity, temperature thresholds, and climate
change impacts for park visitation. Tourism Geographies, 18(3), 297-321.
doi:10.1080/14616688.2016.1172662.
Hewer, M. J. and Gough, W. A. (2018). Thirty years of assessing the impacts of climate change on outdoor
recreation and tourism in Canada. Tourism Management Perspectives, 26(Complete), 179-192.
doi:10.1016/j.tmp.2017.07.003.
Hewer, M. J., Scott, D., and Gough, W. A. (2015). Tourism climatology for camping: a case study of two Ontario
parks (Canada). Theoretical and Applied Climatology, 121(3-4), 401-411. doi:10.1007/s00704-014-1228-6.
Hewer, M. J., Scott, D. J., and Gough, W. A. (2017a). Differences in the importance of weather and weather-based
decisions among campers in Ontario parks (Canada). International Journal of Biometeorology.
doi:10.1007/s00484-017-1364-7.
Hewer, M. J., Scott, D. J., and Gough, W. A. (2017b). Differential temperature preferences and thresholds among
summer campers in Ontario’s southern provincial parks: a Canadian case study in tourism climatology.
Theoretical and Applied Climatology. doi:10.1007/s00704-017-2248-9.
Honsey, A. E., Bunnell, D. B., Troy, C. D., Fielder, D. G., Thomas, M. V., Knight, C. T., Chong, S. C., and Hook,
T. O. (2016). Recruitment synchrony of yellow perch (Perca flavescens, Percidae) in the Great Lakes
region, 1966-2008. Fisheries Research, 181, 214-221. doi:10.1016/j.fishres.2016.04.021.
IJC. (2009). Impacts on Upper Great Lakes Water Levels: St. Clair River. International Upper Great Lakes Study.
http://www.ijc.org/files/publications/IUGLS%20St%20Clair%20Report.pdf.
IJC. (2012). Lake Superior Regulation: Addressing Uncertainty in Upper Great Lakes Water Levels. International
Joint Commission, Upper Great Lakes Study.
http://www.ijc.org/files/publications/Lake_Superior_Regulation_Full_Report.pdf.
IPCC. (2012). Managing the Risks of Extreme Events and Disasters to Advance Climate Change Adaptation. A
Special Report of Working Groups I and II of the Intergovernmental Panel on Climate Change, Cambridge
University Press, Cambridge, UK, and New York, NY, USA. https://www.ipcc.ch/pdf/special-
reports/srex/SREX_Full_Report.pdf.
IPCC. (2014). Climate Change 2014: Impacts, Adaptation, and Vulnerability. Intergovernmental Panel on Climate
Change (IPCC). The Summary for Policymakers of the Working Group II contribution to the Fifth
Assessment Report. http://www.ipcc.ch/index.htm.
Jones, B. and Scott, D. (2006a). Climate Change, Seasonality and Visitation to Canada’s National Parks. Journal of
Park and Recreation Administration; Vol 24, No 2 (2006).
http://js.sagamorepub.com/jpra/article/view/1407
Jones, B. and Scott, D. (2006b). Implications of climate change for visitation to ontario's provincial parks.
Leisure/Loisir, 30(1), 233-261. doi:10.1080/14927713.2006.9651350.
Jones, N. E., Petreman, I. C., and Schmidt, B. J. (2015). High Flows and Freshet Timing in Canada: Observed
Trends. Ontario Ministry of Natural Resources and Forestry.
http://www.climateontario.ca/MNR_Publications/CCRR42.pdf.
Karl, T. R., Melillo, J. M., and Peterson, T. C. (Eds.). (2009). Global Climate Change Impacts in the United States.
New York: Cambridge University Press. https://downloads.globalchange.gov/usimpacts/pdfs/climate-
impacts-report.pdf.
Knudsen, E., Linden, A., Both, C., Jonzen, N., Pulido, F., Saino, N., Sutherland, W. J., Bach, L. A., Coppack, T.,
Ergon, T., Gienapp, P., Gill, J. A., Gordo, O., Hedenstroom, A., Lehikoinen, E., Marra, P. P., Moller, A. P.,
Nilsson, A. L. K., Peron, G., Ranta, E., Rubolini, D., Sparks, T. H., Spina, F., Studds, C. E., Saether, S. A.,
Tryjanowski, P., and Stenseth, N. C. (2011). Challenging claims in the study of migratory birds and climate
change. Biological Reviews, 86(4), 928-946. doi:10.1111/j.1469-185X.2011.00179.x.
Kunkel, K. E., Ensor, L., Palecki, M., Easterling, D., Robinson, D., Hubbard, K. G., and Redmond, K. (2009). A
New Look at Lake-Effect Snowfall Trends in the Laurentian Great Lakes Using a Temporally
Homogeneous Data Set. Journal of Great Lakes Research, 35(1), 23-29. doi:10.1016/j.jglr.2008.11.003.
Langer, T. A., Cooper, M. J., Reisinger, L. S., Reisinger, A. J., and Uzarski, D. G. (2018). Water depth and lake-
wide water level fluctuation influence on alpha- and beta-diversity of coastal wetland fish communities.
Journal of Great Lakes Research, 44(1), 70-76. doi:10.1016/j.jglr.2017.11.001.
Lemieux, C. J., Scott, D. J., Gray, P. A., and Davis, R. G. (2007). Climate Change and Ontario’s Provincial Parks:
Towards an Adaptation Strategy. Ontario Ministry of Natural Resources, Sault Ste. Marie, ON.
http://www.climateontario.ca/MNR_Publications/276924.pdf.
Lindsay, K., Gobeil, J.-F., Lawler, J. L., Schloss, C., Beazley, K. F., and Beechey, T. J. (2016). Wildlife
Conservation, Protected Areas and Climate Change in Canada: Implications of Projected Species Range
27You can also read