KIRIBATI CLIMATE RISK COUNTRY PROFILE - Think Asia
←
→
Page content transcription
If your browser does not render page correctly, please read the page content below
CLIMATE RISK COUNTRY PROFILE

        KIRIBATI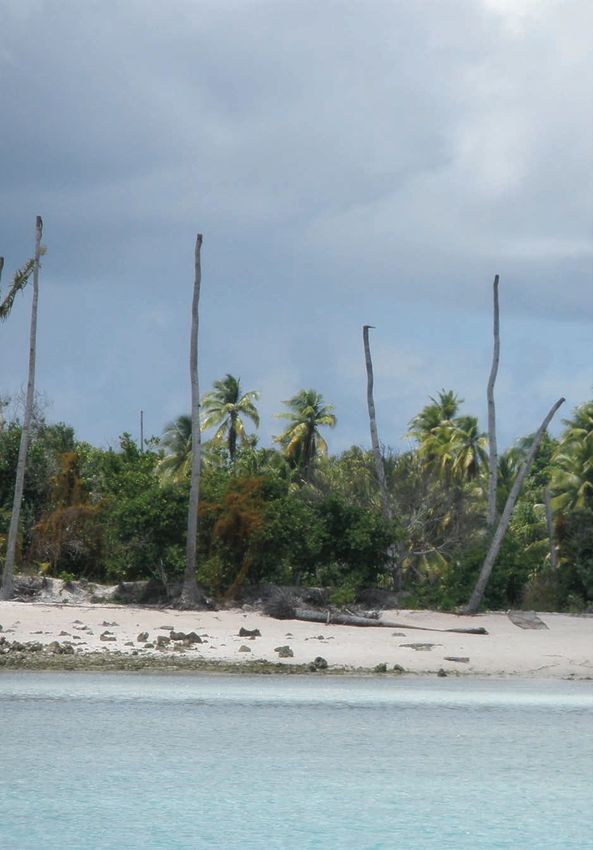
COPYRIGHT
© 2021 by the World Bank Group
1818 H Street NW, Washington, DC 20433
Telephone: 202-473-1000; Internet: www.worldbank.org

© 2021 Asian Development Bank
6 ADB Avenue, Mandaluyong City, 1550 Metro Manila, Philippines
Tel +63 2 8632 4444; Fax +63 2 8636 2444
www.adb.org

This work is a product of the staff of the World Bank Group (WBG) and the Asian Development Bank (ADB) and with external
contributions. The opinions, findings, interpretations, and conclusions expressed in this work are those of the authors’ and do not
necessarily reflect the views or the official policy or position of the WBG, its Board of Executive Directors, or the governments
it represents or of ADB, its Board of Governors, or the governments they represent.

The WBG and ADB do not guarantee the accuracy of the data included in this work and do not make any warranty, express or
implied, nor assume any liability or responsibility for any consequence of their use. This publication follows the WBG’s practice
in references to member designations, borders, and maps. ADB, however, recognizes “China” as the People’s Republic of China
and “Taiwan” as Taipei,China. The boundaries, colors, denominations, and other information shown on any map in this work,
or the use of the term “country” do not imply any judgment on the part of the WBG or ADB, their respective Boards, or the
governments they represent, concerning the legal status of any territory or geographic area or the endorsement or acceptance
of such boundaries.

The mention of any specific companies or products of manufacturers does not imply that they are endorsed or recommended
by either the WBG or ADB in preference to others of a similar nature that are not mentioned.

RIGHTS AND PERMISSIONS
The material in this work is subject to copyright. Because the WB and ADB encourage dissemination of their knowledge, this
work may be reproduced, in whole or in part, for noncommercial purposes as long as full attribution to this work is given. This
work is licensed under the Creative Commons Attribution-NonCommercial 3.0 IGO License. To view a copy of this license, visit
http://creativecommons.org/licenses/by-nc/3.0/igo/ or send a letter to Creative Commons, PO Box 1866, Mountain View,
CA 94042, USA.

his CC license does not apply to WBG or non-ADB copyright materials in this publication. If the material is attributed to another
source, please contact the copyright owner or publisher of that source for permission to reproduce it. WBG or ADB cannot be
held liable for any claims that arise as a result of your use of the material.

Please cite the work as follows: Climate Risk Country Profile: Kiribati (2021): The World Bank Group and the Asian
Development Bank.

Any queries on rights and licenses, including subsidiary rights, should be addressed to World Bank Publications, The World Bank
Group, 1818 H Street NW, Washington, DC 20433, USA; fax: 202-522-2625; e-mail: pubrights@worldbank.org.

Cover Photos: © AusAID, “Kiribati 2009” March 28, 2009 via Flickr, Creative Commons CC BY-NC-ND 2.0. © AusAID, “Fishing
in Kiribati” November 19, 2007 via Flickr, Creative Commons CC BY-NCND 2.0.

Graphic Design: Circle Graphics, Reisterstown, MD.

CLIMATE RISK COUNTRY PROFILE: KIRIBATI                                                                                           ii
ACKNOWLEDGEMENTS
This profile is part of a series of Climate Risk Country Profiles that are jointly developed by the World Bank Group (WBG) and the
Asian Development Bank (ADB). These profiles synthesize the most relevant data and information on climate change, disaster
risk reduction, and adaptation actions and policies at the country level. The profile is designed as a quick reference source for
development practitioners to better integrate climate resilience in development planning and policy making. This effort is co-led
by Veronique Morin (Senior Climate Change Specialist, WBG), Ana E. Bucher (Senior Climate Change Specialist, WBG) and
Arghya Sinha Roy (Senior Climate Change Specialist, ADB).

This profile was written by Alex Chapman (Consultant, ADB), William Davies (Consultant, ADB), and Ciaran Downey (Consultant).
Technical review of the profiles was undertaken by Robert L. Wilby (Loughborough University). Additional support was provided
by MacKenzie Dove (Senior Climate Change Consultant, WBG), Jason Johnston (Operations Analyst, WBG), Yunziyi Lang
(Climate Change Analyst, WBG), Adele Casorla-Castillo (Consultant, ADB), and Charles Rodgers (Consultant, ADB). This profile
also benefitted from inputs of WBG and ADB regional staff and country teams.

Climate and climate-related information is largely drawn from the Climate Change Knowledge Portal (CCKP), a WBG online
platform with available global climate data and analysis based on the current Intergovernmental Panel on Climate Change
(IPCC) reports and datasets. The team is grateful for all comments and suggestions received from the sector, regional, and
country development specialists, as well as climate research scientists and institutions for their advice and guidance on use of
climate related datasets.

CLIMATE RISK COUNTRY PROFILE: KIRIBATI                                                                                         iii
CONTENTS

FOREWORD  .  .  .  .  .  .  .  .  .  .  .  .  .  .  .  .  .  .  .  .  .  .  .  .  .  .  .  .  .  .  .  .  .  .  .  . 1

KEY MESSAGES .   .   .   .   .   .   .   .   .   .   .   .   .   .   .   .   .   .   .   .   .   .   .   .   .   .   .   .   .   .   .   .   .   .  2

COUNTRY OVERVIEW .   .   .   .   .   .   .   .   .   .   .   .   .   .   .   .   .   .   .   .   .   .   .   .   .   .   .   .   .   .   .  2

CLIMATOLOGY  .   .   .   .   .   .   .   .   .   .   .   .   .   .   .   .   .   .   .   .   .   .   .   .   .   .   .   .   .   .   .   .   .   .   4
   Climate Baseline .  .  .  .  .  .  .  .  .  .  .  .  .  .  .  .  .  .  .  .  .  .  .  .  .  .  .  .  .  .  .  .  .  .  .  .  .  .  .  . 4
      Overview  .  .  .  .  .  .  .  .  .  .  .  .  .  .  .  .  .  .  .  .  .  .  .  .  .  .  .  .  .  .  .  .  .  .  .  .  .  .  .  .  .  . 4
      Key Trends .  .  .  .  .  .  .  .  .  .  .  .  .  .  .  .  .  .  .  .  .  .  .  .  .  .  .  .  .  .  .  .  .  .  .  .  .  .  .  .  . 5
   Climate Future .  .  .  .  .  .  .  .  .  .  .  .  .  .  .  .  .  .  .  .  .  .  .  .  .  .  .  .  .  .  .  .  .  .  .  .  .  .  .  .  . 6
      Model Ensemble .  .  .  .  .  .  .  .  .  .  .  .  .  .  .  .  .  .  .  .  .  .  .  .  .  .  .  .  .  .  .  .  .  .  .  .  .  .  . 6
      RCPs .  .  .  .  .  .  .  .  .  .  .  .  .  .  .  .  .  .  .  .  .  .  .  .  .  .  .  .  .  .  .  .  .  .  .  .  .  .  .  .  .  .  .  . 7
      Spatial Variation  .  .  .  .  .  .  .  .  .  .  .  .  .  .  .  .  .  .  .  .  .  .  .  .  .  .  .  .  .  .  .  .  .  .  .  .  .  .  . 9

CLIMATE RELATED NATURAL HAZARDS .   .   .   .   .   .   .   .   .   .   .   .   .   .   .   .   .   .   .   .   .   . 10
       Heatwaves .  .  .  .  .  .  .  .  .  .  .  .  .  .  .  .  .  .  .  .  .  .  .  .  .  .  .  .  .  .  .  .  .  .  .  .  .  .  .  .  . 10
       Drought  .  .  .  .  .  .  .  .  .  .  .  .  .  .  .  .  .  .  .  .  .  .  .  .  .  .  .  .  .  .  .  .  .  .  .  .  .  .  .  .  .  . 10
       Floods, Cyclones and Storm Surge  .  .  .  .  .  .  .  .  .  .  .  .  .  .  .  .  .  .  .  .  .  .  .  .  .  .  .  .  .  . 10

CLIMATE CHANGE IMPACTS .   .   .   .   .   .   .   .   .   .   .   .   .   .   .   .   .   .   .   .   .   .   .   .   .   .   .   . 11
   Natural Resources  .  .  .  .  .  .  .  .  .  .  .  .  .  .  .  .  .  .  .  .  .  .  .  .  .  .  .  .  .  .  .  .  .  .  .  .  .  .  . 11
     Water .  .  .  .  .  .  .  .  .  .  .  .  .  .  .  .  .  .  .  .  .  .  .  .  .  .  .  .  .  .  .  .  .  .  .  .  .  .  .  .  .  .  . 11
     The Coastal Zone  .  .  .  .  .  .  .  .  .  .  .  .  .  .  .  .  .  .  .  .  .  .  .  .  .  .  .  .  .  .  .  .  .  .  .  .  .  . 12
     Island Ecology .  .  .  .  .  .  .  .  .  .  .  .  .  .  .  .  .  .  .  .  .  .  .  .  .  .  .  .  .  .  .  .  .  .  .  .  .  .  .  . 13
     Coral Reefs and Fisheries .  .  .  .  .  .  .  .  .  .  .  .  .  .  .  .  .  .  .  .  .  .  .  .  .  .  .  .  .  .  .  .  .  .  . 14
   Economic Sectors  .  .  .  .  .  .  .  .  .  .  .  .  .  .  .  .  .  .  .  .  .  .  .  .  .  .  .  .  .  .  .  .  .  .  .  .  .  .  . 15
     Agriculture .  .  .  .  .  .  .  .  .  .  .  .  .  .  .  .  .  .  .  .  .  .  .  .  .  .  .  .  .  .  .  .  .  .  .  .  .  .  .  .  . 15
   Communities  .  .  .  .  .  .  .  .  .  .  .  .  .  .  .  .  .  .  .  .  .  .  .  .  .  .  .  .  .  .  .  .  .  .  .  .  .  .  .  .  . 16
     Poverty, Inequality, and Vulnerability to Climate-Related Disaster  .  .  .  .  .  .  .  .  .  .  .  .  .  .  .  . 16
     Gender  .  .  .  .  .  .  .  .  .  .  .  .  .  .  .  .  .  .  .  .  .  .  .  .  .  .  .  .  .  .  .  .  .  .  .  .  .  .  .  .  .  .  . 16
     Human Health .  .  .  .  .  .  .  .  .  .  .  .  .  .  .  .  .  .  .  .  .  .  .  .  .  .  .  .  .  .  .  .  .  .  .  .  .  .  .  . 17

POLICIES AND PROGRAMS  .   .   .   .   .   .   .   .   .   .   .   .   .   .   .   .   .   .   .   .   .   .   .   .   .   .   .   . 18
       National Adaptation Policies and Strategies .  .  .  .  .  .  .  .  .  .  .  .  .  .  .  .  .  .  .  .  .  .  .  .  .  . 18
       Climate Change Priorities of ADB .  .  .  .  .  .  .  .  .  .  .  .  .  .  .  .  .  .  .  .  .  .  .  .  .  .  .  .  .  .  . 19

CLIMATE RISK COUNTRY PROFILE: KIRIBATI                                                                                                               iv
FOREWORD
Climate change is a major risk to good development outcomes, and the World Bank Group is committed to playing an important
role in helping countries integrate climate action into their core development agendas. The World Bank Group (WBG) and the
Asian Development Bank (ADB) are committed to supporting client countries to invest in and build a low-carbon, climate-
resilient future, helping them to be better prepared to adapt to current and future climate impacts.
Both institutions are investing in incorporating and systematically managing climate risks in development operations through
their individual corporate commitments.
For the World Bank Group: a key aspect of the World Bank Group’s Action Plan on Adaptation and Resilience (2019) is to help
countries shift from addressing adaptation as an incremental cost and isolated investment to systematically incorporating climate
risks and opportunities at every phase of policy planning, investment design, implementation and evaluation of development
outcomes. For all International Development Association and International Bank for Reconstruction and Development operations,
climate and disaster risk screening is one of the mandatory corporate climate commitments. This is supported by the World
Bank Group’s Climate and Disaster Risk Screening Tool which enables all Bank staff to assess short- and long-term climate
and disaster risks in operations and national or sectoral planning processes. This screening tool draws up-to-date and relevant
information from the World Bank’s Climate Change Knowledge Portal, a comprehensive online ‘one-stop shop’ for global,
regional, and country data related to climate change and development.
For the Asian Development Bank (ADB): its Strategy 2030 identified “tackling climate change, building climate and disaster
resilience, and enhancing environmental sustainability” as one of its seven operational priorities. Its Climate Change Operational
Framework 2017–2030 identified mainstreaming climate considerations into corporate strategies and policies, sector and
thematic operational plans, country programming, and project design, implementation, monitoring, and evaluation of climate
change considerations as the foremost institutional measure to deliver its commitments under Strategy 2030. ADB’s climate
risk management framework requires all projects to undergo climate risk screening at the concept stage and full climate risk
and adaptation assessments for projects with medium to high risk.
Recognizing the value of consistent, easy-to-use technical resources for our common client countries as well as to support
respective internal climate risk assessment and adaptation planning processes, the World Bank Group’s Climate Change Group
and ADB’s Sustainable Development and Climate Change Department have worked together to develop this content. Standardizing
and pooling expertise facilitates each institution in conducting initial assessments of climate risks and opportunities across sectors
within a country, within institutional portfolios across regions, and acts as a global resource for development practitioners.
For common client countries, these profiles are intended to serve as public goods to facilitate upstream country diagnostics,
policy dialogue, and strategic planning by providing comprehensive overviews of trends and projected changes in key climate
parameters, sector-specific implications, relevant policies and programs, adaptation priorities and opportunities for further actions.
We hope that this combined effort from our institutions will spur deepening of long-term risk management in our client countries
and support further cooperation at the operational level.
Bernice Van Bronkhorst Preety Bhandari
Global Director Chief of Climate Change and Disaster Risk Management Thematic Group
Climate Change Group concurrently Director Climate Change and Disaster Risk Management Division
The World Bank Group Sustainable Development and Climate Change Department
Asian Development Bank
CLIMATE RISK COUNTRY PROFILE: KIRIBATI 1KEY MESSAGES
• Kiribati’s island groups have experienced historical warming of between 0.1°C–0.2°C per decade since 1950.
• Future trends in warming are obscured by the inability of climate models to accurately simulate trends at
sufficiently small spatial resolutions. Warming is likely to take place at a rate slightly lower than the global
average. On the highest emissions pathway (RCP8.5), warming of approximately 3°C is projected by the end
of the century.
• Kiribati faces a diverse set of risks from climate change but data and reliable model projections are lacking,
presenting challenges for decision makers.
• Potential threats to human well-being and natural ecosystems include increased prevalence of heatwave and
drought, intensified cyclones, saline intrusion, wave-driven flooding, and permanent inundation.
• Biodiversity and the natural environment of Kiribati face extreme pressure, and loss of some species of fish,
coral, bird, and terrestrial species is likely without very effective conservation measures.
• Kiribati faces a potential long-term threat from permanent inundation, and some studies have suggested that
many of its low-lying islands will become uninhabitable within the 21st century.
• Some displacement of communities has already been documented from Kiribati’s atolls. However, other
research has suggested that the risk of large-scale net loss of land may previously have been overstated.
• Kiribati’s population already lives in a dynamic ecosystem, to which it has adapted, climate change is likely to
increase its variability, pose new threats, and place stress on livelihoods.
• Communities are likely to need support to adapt and manage disaster risks facing their wellbeing, livelihoods,
and infrastructure. Geographic isolation and economic vulnerabilities, including dependence on remittance and
foreign aid, will increase the challenges faced by communities and decision makers.
COUNTRY OVERVIEW
K
iribati is a nation of 32 coral atolls and one raised limestone island, located in the central Pacific Ocean.
The country contains three major island groups: the Gilbert group in the west, the central Phoenix group,
and the Line group in the east. These islands have a total land area of 811 square kilometers (km2), and
occupy a vast economic exclusion zone of approximately 3.6 million square kilometers. Kiribati’s coral atolls are
very low-lying, with a maximum elevation of 3 to 4 meters (m) above sea level. The country straddles the equator,
with an average annual temperature of 27.5°C. Kiribati had an estimated population of 110,000 in 2015, of
which approximately 51% lived on the island of South Tarawa, where the capital Tarawa is located. As of 2018,
the country was classified as a Least Developed Country economically and in 2016 over 90% of its exports
consisted of fish products.
Kiribati is amongst the most vulnerable nations to climate change on Earth. As an extremely isolated and very
low-lying island nation, Kiribati faces considerable risk from climate variability and sea-level rise. The potential
risk of permanent inundation, and land and marine ecosystem degradation link climate change intrinsically with
CLIMATE RISK COUNTRY PROFILE: KIRIBATI 2development. Kiribati has ratified the Paris Climate Change Agreement (2016), submitted its Second National
Communication to the UNFCCC in 2013 and its Nationally Determined Contributions (2016). The Kiribati Joint
Implementation Plan on Climate Change and Disaster Risk Management (2019) estimates the cost of climate
change adaptation over the period 2014–2023 at around $75 million (approximately 4–5% of GDP per year).1
Green, Inclusive and Resilient Recovery
The coronavirus disease (COVID-19) pandemic has led to unprecedented adverse social and economic impacts.
Further, the pandemic has demonstrated the compounding impacts of adding yet another shock on top of
the multiple challenges that vulnerable populations already face in day-to-day life, with the potential to create
devastating health, social, economic and environmental crises that can leave a deep, long-lasting mark. However,
as governments take urgent action and lay the foundations for their financial, economic, and social recovery, they
have a unique opportunity to create economies that are more sustainable, inclusive and resilient. Short and long-
term recovery efforts should prioritize investments that boost jobs and economic activity; have positive impacts on
human, social and natural capital; protect biodiversity and ecosystems services; boost resilience; and advance the
decarbonization of economies.
This document aims to succinctly summarize the climate risks faced by Kiribati. These include rapid onset and long-
term changes in key climate parameters, as well as the impacts of such changes on communities, livelihoods and
economies, many of which are already underway. This is a high-level synthesis of existing research and analyses
focusing on the geographic area of Kiribati, therefore potentially excluding some international influences and
localized impacts. The core climate projections presented are sourced from the Pacific-Australia Climate Change
Science and Adaptation Planning Program.2,3 This document also directs the reader to other useful sources of
secondary data and research. For a meta-analysis of the research available on climate change adaptation in small-
island developing nations please see Klöck and Nunn (2019).4
1
Kiribati (2019). Kiribati Joint Implementation Plan for Climate Change and Disaster Risk Management (2019–2028). URL: https://
www4.unfccc.int/sites/NAPC/Documents/Parties/Kiribati-Joint-Implementation-Plan-for-Climate-Change-and-Disaster-Risk-
Management-2019-2028.pdf
2
Australian Bureau of Meteorology and CSIRO (2014). Climate Variability, Extremes and Change in the Western Tropical Pacific:
New Science and Updated Country Reports. Pacific-Australia Climate Change Science and Adaptation Planning Program Technical
Report, Australian Bureau of Meteorology and CSIRO, Melbourne, Australia. URL: https://www.pacificclimatechangescience.org/
wp-content/uploads/2014/07/PACCSAP_CountryReports2014_WEB_140710.pdf
3
The NextGen projections for the Pacific region under CMIP5 are expected to be available from July 2021. These will provide an
update on the PACCSAP 2014 projections referenced in this profile. The process for providing the new NextGen CMIP6 projections
for the Pacific is still in the planning phase.
4
Klöck, C. and Nunn, P. D. (2019). Adaptation to Climate Change in Small Island Developing States: A Systematic Literature Review
of Academic Research. The Journal of Environment & Development. DOI: https://doi.org/10.1177/1070496519835895
CLIMATE RISK COUNTRY PROFILE: KIRIBATI 3TABLE 1. Key indicators
Indicator Value Source
Population Undernourished 5 3.0% (2017–19) FAO, 2020
National Poverty Rate 6 unknown ADB, 2020a
Share of Wealth Held by Bottom 20% 7 unknown World Bank, 2019
Net Annual Migration Rate8 −0.7% (2015–20) UNDESA, 2019
Infant Mortality Rate (Between Age 0 and 1)9 4.3% (2015–20) UNDESA, 2019
Average Annual Change in Urban Population 10 3.2% (2015–20) UNDESA, 2019
Dependents per 100 Independent Adults 11 67 (2020) UNDESA, 2019
Urban Population as % of Total Population 12 55.6% (2020) CIA, 2020
External Debt Ratio to GNI13 23.0% (2019) ADB, 2020b
Government Expenditure Ratio to GDP 14 79.2% (2018) ADB, 2020b
CLIMATOLOGY
Climate Baseline
Overview
Temperatures on Kiribati’s islands are generally highly stable throughout the year, although there are some variations
between and within island groups; however, these are more noticeable in precipitation levels. Annual rainfall varies
between 1,000 millimeters (mm) per year and 3,000 mm per year across the country, with the northern parts of the
Gilbert and Line groups typically receiving more rain and the Phoenix group experiencing drier weather. The country
is subject to the effects of El Niño, which typically brings heavy rain to Kiribati, and La Niña, which coincides with
drought periods for Kiribati.15 Rainfall is highest between March and May, and lowest between August and October.
Average monthly temperatures fall between 27°C and 28°C during every month of the year. Figure 1 shows the
seasonal cycle of temperature and rainfall in Kiribati for the latest climatology, 1991–2020.
5
FAO, IFAD, UNICEF, WFP, WHO (2020). The state of food security and nutrition in the world. Building Resilience for peace and food
security. FAO. Rome. URL: http://www.fao.org/documents/card/en/c/ca9692en/
6
ADB (2020a). Basic Statistics 2020. Asian Development Bank. Manila. URL: URL: https://www.adb.org/publications/
basic-statistics-2020
7
World Bank (2019). Income share held by lowest 20%. URL: https://data.worldbank.org/indicator/SI.DST.FRST.20 [accessed 15/02/2021]
8
UNDESA (2019). World Population Prospects 2019. URL: https://population.un.org/wpp/Download/Standard/Population/
[accessed 15/02/2021]
9
UNDESA (2019). World Population Prospects 2019. URL: https://population.un.org/wpp/Download/Standard/Population/
[accessed 15/02/2021]
10
UNDESA (2019). World Urbanization Prospects 2019. URL: https://population.un.org/wup/Download/ [accessed 15/02/2021]
11
UNDESA (2019). World Population Prospects 2019. URL: https://population.un.org/wpp/Download/Standard/Population/
[accessed 15/02/2021]
12
CIA (2020). The World Factbook. Central Intelligence Agency. Washington DC. URL: https://www.cia.gov/the-world-factbook/
13
ADB (2020b). Key Indicators for Asia and the Pacific 2020, 51st Edition. Asian Development Bank. ManilaURL: https://www.adb.org/
sites/default/files/publication/632971/ki2020.pdf
14
ADB (2020b). Key Indicators for Asia and the Pacific 2020, 51st Edition. Asian Development Bank. ManilaURL: https://www.adb.org/
sites/default/files/publication/632971/ki2020.pdf
15
Kiribati (2013). Second National Communication under the UNFCCC. URL: https://unfccc.int/sites/default/files/resource/kirnc2.pdf
CLIMATE RISK COUNTRY PROFILE: KIRIBATI 4Annual Cycle
FIGURE 1. Average monthly temperature and rainfall in Kiribati (1991–2020)16
28.5 180
28 120
Temperature (°C)
Rainfall (mm)
27.5 60
27 0
Jan Feb Mar Apr May Jun Jul Aug Sep Oct Nov Dec
Rainfall Temperature
Key Trends
Temperature
There has been an average increase in maximum temperatures of 0.18°C per decade during the period 1950 to
2009.17 For the capital, Tarawa, maximum temperatures rose by 0.13°C per decade from 1950 to 2013. 1 From
1970 to 2009 there have been rises in the sea surface temperature of 0.15°C in the Gilbert group, 0.12°C in the
Phoenix group and 0.10°C in the Line group.12
Precipitation
Annual rainfall has increased significantly between 1946 and 2013 in Kiritimati island (in the northern part of the
Line islands). In the capital, Tarawa, there has been no significant change in annual precipitation over the same
period.18 Kiribati has been affected by severe droughts at sporadic intervals, with annual rainfall falling below
750mm in 1971, 1985, 1998 and 1999. El Niño Southern Oscillation (ENSO) has a strong influence over inter-
annual precipitation variation over Kiribati’s islands.
16
WBG Climate Change Knowledge Portal (CCKP, 2021). Climate Data: Historical. URL: https://climateknowledgeportal.worldbank.org/
country/kiribati/climate-data-historical
17
Republic of Kiribati (2016). Nationally Determined Contribution. URL: https://www4.unfccc.int/sites/ndcstaging/Pages/Home.aspx
[accessed 04/10/2019]
18
Kiribati Meteorology Service & PACCSAP (2015). Pacific-Australia Climate Change Science and Adaptation Planning Programme:
Current and future climate of Kiribati. URL: https://www.pacificclimatechangescience.org/wp-content/uploads/2013/06/
11_PACCSAP-Kiribati-11pp_WEB.pdf [accessed 04/10/2019]
CLIMATE RISK COUNTRY PROFILE: KIRIBATI 5Climate Future FIGURE 2. ‘Projected average temperature
anomaly’ and ‘projected annual rainfall
Model Ensemble anomaly’ in Kiribati. Outputs of 16 models
Due to differences in the way global circulation models within the ensemble simulating RCP8.5
(GCMs) represent the key physical processes and over the period 2080–2099. Models shown
interactions within the climate system, projections represent the subset of models within the
of future climate conditions can vary widely between ensemble that provide projections across
different GCMs. This is particularly the case for all RCPs and therefore are most robust for
rainfall related variables and at sub-national scales. comparison.20 Three models are labelled.
Exploring the spread of climate model outputs can 5
miroc_esm_chem
assist in understanding uncertainties associated 4.5
Average temperature anomaly (°C)
with climate models. The range of projections from 4
3.5
16 GCMs on the indicators of average temperature
3
gfdl_esm2m
anomaly and annual precipitation anomaly for Kiribati 2.5
under RCP8.5 is shown in Figure 2. However, it 2
noresm1_m
1.5
should be noted that concerns have been raised about Median,
1 10th and 90th
the realism of some of the more extreme outlier models 0.5
Percentiles
labelled in Figure 2.19 0
–40% –20% 0% 20% 40% 60% 80% 100%
Average annual precipitation anomaly (%)
The majority of the models from which outputs are
presented in this report are from the CMIP5 round of
standardization and quality assurance. Unfortunately,
A Precautionary Approach
models of this generation operate at large spatial
scales and are not well equipped to simulate the future
Studies published since the last iteration of
climate of small islands. Typically, the changes projected
the IPCC’s report (AR5), such as Gasser
will relate more to the expected changes over nearby
et al. (2018), have presented evidence which
ocean than the island itself. Caution should therefore
suggests a greater probability that earth will
be applied in interpreting results. This highlights
experience medium and high-end warming
a major area for future development, a research
scenarios than previously estimated.21 Climate
opportunity, and an urgent need from the perspective
change projections associated with the highest
of policy makers planning for climate change.
emissions pathway (RCP8.5) are presented
here to facilitate decision making which is
robust to these risks.
19
McSweeney, C. F., Jones, R. G., Lee, R. W. and Rowell, D. P. (2015). Selecting CMIP5 GCMs for downscaling over multiple regions.
Climate Dynamics, 44(11–12), pp.3237–3260. DOI: https://link.springer.com/article/10.1007/s00382-014-2418-8
20
WBG Climate Change Knowledge Portal (CCKP, 2021). Climate Data: Projections. URL: https://climateknowledgeportal.worldbank.org/
country/kiribati/climate-data-projections
21
Gasser, T., Kechiar, M., Ciais, P., Burke, E. J., Kleinen, T., Zhu, D., . . . Obersteiner, M. (2018). Path-dependent reductions in CO2
emission budgets caused by permafrost carbon release. Nature Geoscience, 11, 830–835. URL: https://www.nature.com/articles/
s41561-018-0227-0?WT.feed_name=subjects_climate-sciences
CLIMATE RISK COUNTRY PROFILE: KIRIBATI 6RCPs
The Representative Concentration Pathways (RCPs) represent four plausible futures, based on the rate of emissions
reduction achieved at the global level. Four RCPs (i.e. RCP2.6, RCP4.5, RCP6.0, and RCP8.5) were selected and
defined by their total radiative forcing (cumulative measure of GHG emissions from all sources) pathway and level
by 2100. In this analysis, RCP2.6 and RCP8.5, the extremes of low and high emissions pathways, are the primary
focus; RCP2.6 represents a very strong mitigation scenario, whereas RCP8.5 assumes business-as-usual scenario.
For reference, Table 2 provides information on all four RCPs over two-time horizons across Kiribati’s three island
groups. In subsequent analysis RCPs 2.6 and 8.5, the extremes of low and high emissions pathways, are the
primary focus. RCP2.6 would require rapid and systemic global action, achieving emissions reduction throughout
the 21st century enough to reach net zero global emissions by around 2080. RCP8.5 assumes annual global
emissions will continue to increase throughout the 21st century. Climate changes under each emissions pathway
are presented against a reference period of 1986–2005 for all indicators. For more information, please refer to
the RCP Database.
TABLE 2. An overview of Kiribati’s temperature change projections (°C) under four emissions
pathways. Projected changes over the 1986–2005 baseline are given for 20-year periods centered
on 2050 and 2090, with the 5th and 95th percentiles provided in brackets. Changes are broken
down for each of Kiribati’s three island groups.1
Line Group
Mean Surface Air Temp Max Temp Min Temp
(Annual) (1-in-20 Year Event) (1-in-20 Year Event)
Scenario 2050 2090 2050 2090 2050 2090
RCP2.6 0.8 (0.6–1.3) 0.8 (0.5–1.3) 0.8 (0.3–1.4) 0.8 (0.3–1.3) 0.8 (0.4–1.1) 0.8 (0.4–1.2)
RCP4.5 1.1 (0.7–1.6) 1.5 (1.0–2.3) 0.9 (0.3–1.5) 1.4 (0.8–2.2) 0.9 (0.6–1.3) 1.4 (0.7–2.0)
RCP6.0 1.0 (0.6–1.4) 1.7 (1.1–2.5) NA NA NA NA
RCP8.5 1.4 (1.0–2.0) 2.9 (2.0–4.0) 1.5 (0.8–2.3) 3.0 (1.7–4.4) 1.4 (0.8–2.0) 3.0 (2.0–3.9)
Gilbert Group
Mean Surface Air Temp Max Temp Min Temp
(Annual) (1-in-20 Year Event) (1-in-20 Year Event)
Scenario 2050 2090 2050 2090 2050 2090
RCP2.6 0.9 (0.6–1.5) 0.9 (0.6–1.5) 0.7 (0.3–1.2) 0.8 (0.4–1.3) 0.8 (0.4–1.5) 0.9 (0.4–1.2)
RCP4.5 1.1 (0.6–1.7) 1.6 (1.1–2.5) 0.9 (0.5–1.2) 1.3 (0.9–2.2) 1.0 (0.6–1.4) 1.4 (1.0–2.0)
RCP6.0 1.0 (0.7–1.6) 1.9 (1.1–2.9) NA NA NA NA
RCP8.5 1.5 (1.1–2.2) 3.1 (2.1–4.5) 1.5 (0.8–2.3) 2.9 (1.8–4.4) 1.6 (0.9–2.6) 3.1 (2.1–4.4)
Phoenix Group
Mean Surface Air Temp Max Temp Min Temp
(Annual) (1-in-20 Year Event) (1-in-20 Year Event)
Scenario 2050 2090 2050 2090 2050 2090
RCP2.6 0.9 (0.6–1.4) 0.9 (0.6–1.4) 0.9 (0.4–1.4) 0.8 (−0.1–1.4) 0.8 (0.4–1.1) 0.8 (0.2–1.4)
RCP4.5 1.1 (0.7–1.7) 1.6 (1.0–2.4) 0.9 (0.2–1.4) 1.4 (0.7–2.3) 1.0 (0.6–1.3) 1.4 (0.7–1.9)
RCP6.0 1.0 (0.6–1.5) 1.8 (1.1–2.8) NA NA NA NA
RCP8.5 1.5 (0.9–2.2) 3.0 (2.1–4.3) 1.4 (0.5–2.1) 3.0 (1.3–4.4) 1.5 (0.9–2.3) 3.1 (2.0–4.2)
CLIMATE RISK COUNTRY PROFILE: KIRIBATI 7Temperature
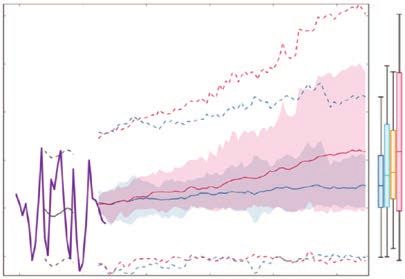
Projections of future temperature change are FIGURE 3. Historical and simulated surface
presented in three primary formats. Shown in Table 2 air temperature time series for the region
are the changes (anomalies) in maximum and minimum surrounding Kiribati’s Gilbert Island group.
temperatures over the given time period, as well as The graph shows the anomaly (from the base
changes in the average temperature. Figures 2 and 3 period 1986–2005) in surface air temperature
display only the average temperature projections. from observations (the GISS dataset, in
While similar, these three indicators can provide slightly purple), and for the CMIP5 models under
different information. Monthly and annual average the very high (RCP8.5, in red) and very low
temperatures are most commonly used for general (RCP2.6, in blue) emissions scenarios. The
estimation of climate change, but the daily maximum solid red and blue lines show the smoothed
and minimum can explain more about how daily life (20-year running average) multi-model mean
might change in a region, affecting key variables anomaly in surface air temperature, while
such as the viability of ecosystems, health impacts, shading represents the spread of model values
productivity of labor, and the yield of crops, which are (5–95th percentile). The dashed lines show the
often disproportionately influenced by temperature 5–95th percentile of the observed interannual
extremes. variability for the observed period (in black)
and added to the projections as a visual guide
The model ensemble’s estimate of warming under (in red and blue). This indicates that future
the highest emissions pathway (RCP8.5) is an surface air temperature could be above or
average temperature increase of approximately 1.5°C below the projected long-term averages
by the 2050s and approximately 3.0°C by the 2090s. due to interannual variability. The ranges
These temperature increases are projected to occur of projections for a 20-year period centered
relatively evenly throughout the year, with little variation on 2090 are shown by the bars on the right
from month to month. The model ensemble’s estimate for RCP8.5, 6.0, 4.5 and 2.6.1
of warming under the lowest emissions pathway
Precipitation anomaly relative to 1986–2005 (%)
200
(RCP2.6) is an average temperature increase of
approximately 0.9°C by the 2050s and approximately 150
0.9°C by the 2090s. These changes are fairly consistent
across all of Kiribati’s island groups. 100
50
Precipitation
While considerable uncertainty clouds projections of 0
local long-term future precipitation trends, some global
–50
trends are evident. The intensity of sub-daily extreme
1980 2000 2020 2040 2060 2080
rainfall events appears to be increasing with temperature, Year
a finding supported by evidence from different regions smoothed GPCP RCP8.5 RCP4.5
GPCP RCP6.0 RCP2.6
of Asia.22 However, as this phenomenon is highly
dependent on local geographical contexts further
research is required to constrain its impact in Kiribati.
22
Westra, S., Fowler, H. J., Evans, J. P., Alexander, L. V., Berg, P., Johnson, F., Kendon, E. J., Lenderink, G., Roberts, N. (2014). Future
changes to the intensity and frequency of short-duration extreme rainfall. Reviews of Geophysics, 52, 522–555. DOI: https://doi.org/
10.1002/2014RG000464
CLIMATE RISK COUNTRY PROFILE: KIRIBATI 8The model ensemble’s projections broadly suggest
some increases in average monthly precipitation FIGURE 4. Boxplots showing the projected
for Kiribati in 2050 and 2090 under all emissions average annual precipitation for Kiribati in the
pathways. The model ensemble’s median estimate period 2080–2099.15
is a 200–300 mm (35%–45%) increase in annual 3000
precipitation by the 2090s under RCP8.5 (Figure 4). 2500
However, as was documented in Kiribati’s Second 2000
National Communication to the UNFCCC (2013),
mm
1500
there is great uncertainty and a minority of models
1000
also project decreases in annual average precipitation
500
rates.23 The Pacific Climate Change Futures Project
0
provides some further detail,24 broadly suggesting Historical RCP 2.6 RCP 4.5 RCP 6.0 RCP 8.5
that around half of the global climate models in the
IPCC model ensemble project much higher increases
in average precipitation, the remaining models then project a range of changes from a large decrease in precipitation
to little to no change. Changes are likely to depend on the interaction between global warming and the ENSO
phenomenon, which is currently poorly understood.
Spatial Variation
Kiribati’s islands can be approached in three distinct groups based on their geographic locations, the Phoenix
Group, Line Group, and Gilbert Group. The projections of change across the groups are broadly similar. However,
the greatest model agreement can be seen for the Gilbert Island Group where 27 of 45 models suggest large
(e.g. 117% under RCP8.5) increases in precipitation, while least agreement is seen in the Line Island Group where
only 16 models show consensus and suggest lesser increases (e.g. 33% under RCP8.5). The remaining group,
the Phoenix Group sees moderate consensus (23 models) and moderate increases (e.g. 73% under RCP8.5).
The directions of change and discrepancies between models remain similar across all of the different emissions
pathways, but the magnitude of change reduces as the emissions level reduces, such that under RCP2.6 most
increases are in the 10%–30% range.25
23
Republic of Kiribati (2013). Second Communication Under the United Nations Framework Convention on Climate Change.
URL: https://unfccc.int/sites/default/files/resource/kirnc2.pdf
24
Bureau of Meteorology and CSIRO (2018). Pacific climate change science – climate futures. Australian Government. URL: https://
www.pacificclimatefutures.net/en/
25
Pacific Climate Change Portal (2019). Data – Kiribati. URL: https://www.pacificclimatechange.net/ [accessed 14/05/2019]
CLIMATE RISK COUNTRY PROFILE: KIRIBATI 9CLIMATE RELATED NATURAL HAZARDS
Heatwaves
Kiribati regularly experiences high maximum temperatures, but typically has a very stable temperature regime,
with an average monthly maximum of around 30.8°C and an average May maximum of 31°C. Further research is
required to better understand the implications of climate change, and its interaction with the ENSO phenomenon,
for Kiribati’s future temperature regime and potential heatwaves. In statistical terms, the probability of heat waves
is likely to grow significantly, as the average temperature moves away from the historical baseline. However, the
implications for communities, and particularly the likelihood that key thresholds of human health risk will be passed
(approximately 35°C wet bulb temperature), require further study.
An additional factor for consideration is the potential for marine heatwaves. Research has identified the Western
Tropical Pacific as a global hotspot for climate change impacts on marine heatwaves. Marine heatwaves are
projected to extend their spatial footprint and to grow in duration and intensity.26 The consequences of this trend
may be serious for marine ecosystems in the region (and the livelihoods dependent on them), which are adapted
to survive under very stable temperature regimes.
Drought
The primary type of drought affecting Kiribati is meteorological drought, usually associated with a precipitation
deficit. The CMIP5 model ensemble does not provide robust information on future drought severity in Kiribati.
Various issues affect accurate model projections, including the nation’s small land mass, wide distribution, sensitivity
to El Niño, remote pacific location and the lack of data on historical trends. General global and regional trends
towards greater climatic extremes are recognized as a cause concern, and a need for disaster risk reduction and
preparedness measures in Kiribati’s Second National Communication to the UNFCCC (2013).19 Some limited
attempts to derive more useful projections, as reported in the National Communication, broadly suggested that
little change from present-day drought distributions might be expected; there is a strong need for further research.
Floods, Cyclones and Storm Surge
Climatic patterns currently tend to shelter Kiribati’s islands from the direct impact of cyclones however, impacts
can still be felt when cyclones pass within a few hundred kilometers. Climate change is expected to interact
with cyclone hazard in complex ways which are currently poorly understood. Known risks include the action of
sea-level rise to enhance the damage caused by cyclone-induced storm surges, and the possibility of increased
wind speed and precipitation intensity. Modelling of climate change impacts on cyclone intensity and frequency
conducted across the globe points to a general trend of reduced cyclone frequency but increased intensity and
frequency of the most extreme events.27,28 Trends emerging from the scientific literature in regard to tropical
26
Frölicher, T. L., Fischer, E. M., & Gruber, N. (2018). Marine heatwaves under global warming. Nature, 560(7718), 360–364.
URL: https://www.nature.com/articles/s41586-018-0383-9
27
Walsh, K., McBride, J., Klotzbach, P., Balachandran, S., Camargo, S., Holland, G., Knutson, T., Kossin, J., Lee, T., Sobel, A., Sugi, M.
(2015). Tropical cyclones and climate change. WIREs Climate Change: 7: 65–89. DOI: https://doi.org/10.1002/wcc.371
28
Widlansky, M. J., Annamalai, H., Gingerich, S. B., Storlazzi, C. D., Marra, J. J., Hodges, K. I., . . . Kitoh, A. (2019). Tropical Cyclone
Projections: Changing Climate Threats for Pacific Island Defense Installations. Weather, Climate, and Society, 11(1), 3–15.
DOI: https://doi.org/10.1175/WCAS-D-17-0112.1
CLIMATE RISK COUNTRY PROFILE: KIRIBATI 10cyclone genesis and tracks in the Pacific point towards a climate change-driven westward shift in the genesis
location of cyclones.29 Evaluation of the climate change implications for severe wind hazard have thus far produced
inconclusive results.30 Other characteristics, such as maximum wave height, have been shown to be strongly
linked to El Niño-Southern Oscillation, and as such will depend upon the poorly understood relationship between
climate change and ENSO.31 One study has suggested that under future climates, cyclone generation will become
more frequent during El Niño events, but less frequent during La Niña events.32 Further research is required to
better understand potential changes in cyclone seasonality and routes, and the potential for cyclone hazards to be
experienced in unprecedented locations. See below for further discussion of the impacts relating to wave-driven
flooding and storm surge.
CLIMATE CHANGE IMPACTS
Natural Resources
Water
Water supply on Kiribati’s islands depends primarily on rainwater collection and groundwater. Both are highly
dependent on rainfall replenishment, and groundwater is vulnerable to saline contamination. Projections of future
trends in water resources in Kiribati are not conclusive. Most models agree that extreme hydrological events
will grow in intensity and as such Kiribati should develop its capacity to endure droughts, storms, and intense
rainfall. As discussed in Kiribati’s Second National Communication to the UNFCCC, droughts in particular place
strain on groundwater resources and terrestrial ecosystems. Kiribati’s ecology, including nesting bird species,
has already shown to be highly sensitive to heavy rainfall events and drought and saline intrusion. These same
events also present risks to human health, notably increasing the risks of bacterial and pollutant contamination
and, through its impact on subsistence agriculture, and hence on food security. The vulnerability and sustainability
of groundwater resources under climate changes and potentially amplified extremes in Kiribati are enhanced by
issues with legislation and regulation enforcement.33
29
Wu, L., Wang, C., & Wang, B. (2015). Westward shift of western North Pacific tropical cyclogenesis. Geophysical Research Letters,
42(5), 1537–1542.DOI: https://doi.org/10.1002/2015GL063450
30
Siquera, A., Arthur, A., Woolf, M. (2014). Evaluation of severe wind hazard from tropical cyclones – current and future climate
simulations. Pacific-Australia Climate Change Science and Adaptation Planning Program. URL: https://ecat.ga.gov.au/geonetwork/
srv/eng/catalog.search#/metadata/79681
31
Stephens, S. A., & Ramsay, D. L. (2014). Extreme cyclone wave climate in the Southwest Pacific Ocean: Influence of the El Niño
Southern Oscillation and projected climate change. Global and Planetary Change, 123, 13–26. DOI: https://doi.org/10.1016/
j.gloplacha.2014.10.002
32
Chand, S. S., Tory, K. J., Ye, H., & Walsh, K. J. E. (2016). Projected increase in El Niño-driven tropical cyclone frequency in the Pacific.
Nature Climate Change, 7, 123. URL: https://ui.adsabs.harvard.edu/abs/2017NatCC...7..123C/abstract
33
Holding, S., Allen, D. M., Foster, S., Hsieh, A., Larocque, I., Klassen, J., & Van Pelt, S. C. (2016). Groundwater vulnerability on small
islands. Nature Climate Change, 6, 1100. URL: https://ui.adsabs.harvard.edu/abs/2016NatCC...6.1100H/abstract
CLIMATE RISK COUNTRY PROFILE: KIRIBATI 11The Coastal Zone
Sea-level rise threatens significant physical changes to coastal zones around the world. Global mean sea-level
rise was estimated in the range of 0.44 meter (m)–0.74 m by the end of the 21st century by the IPCC’s Fifth
Assessment Report34 but some studies published more recently have highlighted the potential for more significant
rises (Table 3). Localized sea-level rise can in fact be an extremely complex phenomenon to measure and model,
notably due to the influence of large-scale climate phenomena such as ENSO. Some studies have suggested that
the western Pacific has been experiencing above average rates of sea-level rise, but the extent to which this is
attributable to human-driven climate change and/or likely to continue requires further research.35
Sea-level rise is not just a threat due to long-term encroachment on coastal areas, but also due to the projected
increase in the frequency of extreme sea-level events.36 The return period of exceptionally high sea-levels, driven
by climate circulations, is expected to reduce and low-lying Pacific island nations are particularly at risk.37 Studies
have shown that the extent of wave-driven flooding is impacted by coral reef height and health, highlighting the
importance of coral conservation as an adaptation.38 Without successful adaptation, some studies have estimated
that wave-driven flooding will make many atoll islands (including many in Kiribati’s island groups) uninhabitable by
the mid 21st century.39 However, the scientific field lacks consensus on the gravity of the threat. Other studies have
shown the potential of atoll islands to sustain and even grow despite sea-level rise thanks to geomorphological
processes which build land.40 The picture is more likely one of a dynamic ecosystem, which will demand adaptive
lifestyles and livelihoods from inhabitants.
Kiribati’s low-lying islands have experienced serious impacts from sea-level rise induced by climate change, some
of these are documented in Kiribati’s Second National Communication to the UNFCCC.19 Communities in outer
islands, such as the village of Tebunginako, Abaiang, have already had to undertake managed relocation after
studies highlighted its vulnerability to permanent inundation. Documentation of other cases of community relocation
is lacking, but many more occurrences are believed to have taken place. Kiribati’s major urban areas are also
exposed, the Second National Communication reports that the combined impact of future scenarios of sea-level
rise and a 1-in-10-year storm event would result in widespread inundation of Tarawa.
34
Church, J. a., Clark, P. U., Cazenave, A., Gregory, J. M., Jevrejeva, S., Levermann, A., . . . Unnikrishnan, A. S. (2013). Sea level change.
In Climate Change 2013: The Physical Science Basis. Contribution of Working Group I to the Fifth Assessment Report of the
Intergovernmental Panel on Climate Change (pp. 1137–1216). Cambridge, United Kingdom and New York, NY, USA: Cambridge
University Press. URL: https://www.ipcc.ch/site/assets/uploads/2018/02/WG1AR5_Chapter13_FINAL.pdf
35
Peyser, C. E., Yin, J., Landerer, F. W., & Cole, J. E. (2016). Pacific sea level rise patterns and global surface temperature variability.
Geophysical Research Letters, 43(16), 8662–8669. DOI: https://doi.org/10.1002/2016GL069401
36
Widlansky, M. J., Timmermann, A., & Cai, W. (2015). Future extreme sea level seesaws in the tropical Pacific. Science Advances, 1(8).
DOI: https://doi.org/10.1126/sciadv.1500560
37
Vitousek, S., Barnard, P. L., Fletcher, C. H., Frazer, N., Erikson, L., & Storlazzi, C. D. (2017). Doubling of coastal flooding frequency
within decades due to sea-level rise. Scientific Reports, 7(1), 1399. DOI: https://doi.org/10.1038/s41598-017-01362-7
38
Beetham, E., Kench, P. S., & Popinet, S. (2017). Future Reef Growth Can Mitigate Physical Impacts of Sea-Level Rise on Atoll Islands.
Earth’s Future, 5(10), 1002–1014. DOI: https://doi.org/10.1002/2017EF000589
39
Storlazzi, C. D., Gingerich, S. B., van Dongeren, A., Cheriton, O. M., Swarzenski, P. W., Quataert, E., . . . McCall, R. (2018). Most atolls
will be uninhabitable by the mid-21st century because of sea-level rise exacerbating wave-driven flooding. Science Advances, 4(4).
DOI: 10.1126/sciadv.aap9741
40
Kench, P. S., Ford, M. R., & Owen, S. D. (2018). Patterns of island change and persistence offer alternate adaptation pathways for
atoll nations. Nature Communications, 9(1), 605. URL: https://www.nature.com/articles/s41467-018-02954-1
CLIMATE RISK COUNTRY PROFILE: KIRIBATI 12TABLE 3. Estimates of global mean sea-level rise by rate and total rise compared to 1986–2005
including likely range shown in brackets, data from Chapter 13 of the IPCC’s Fifth Assessment
Report with upper-end estimates based on higher levels of Antarctic ice-sheet loss from Le Bars
et al. (2017).41
Rate of Global Mean Sea-Level Global Mean Sea-Level Rise in
Scenario Rise in 2100 2100 Compared to 1986–2005
RCP2.6 4.4 mm/yr (2.0–6.8) 0.44 m (0.28–0.61)
RCP4.5 6.1 mm/yr (3.5–8.8) 0.53 m (0.36–0.71)
RCP6.0 7.4 mm/yr (4.7–10.3) 0.55 m (0.38–0.73)
RCP8.5 11.2 mm/yr (7.5–15.7) 0.74 m (0.52–0.98)
Estimate inclusive of high-end Antarctic ice-sheet loss 1.84 m (0.98–2.47)
Island Ecology
Sea-level rise not only threatens humans residing on Pacific islands, but also their unique ecosystem functions
and ecology. Indeed, island biodiversity faces a variety of human pressures.42 Research has shown that inundation
of low-lying islands has the potential to remove important refuges for migrating sea birds.43 As climate changes,
so the suitable range for species to inhabit shifts, typically either upslope or away from the equator. In the Island
environment the capacity for species to shift is extremely limited and as such loss and extinction are becoming
increasingly likely. Major concerns have been raised for the terrestrial ecology of low-lying Pacific islands, for
example endemic lizards, which may become trapped in a shrinking habitat.44 Research has also highlighted the
risks to biodiversity in the Pacific through study of tree richness in New Caledonia, where the range sizes of
87–96% of species was projected to decline, typically by 52%–84%.45
41
Le Bars, D., Drijhout, S., de Vries, H. (2017). A high-end sea level rise probabilistic projection including rapid Antarctic ice sheet mass
loss. Environmental Research Letters: 12:4. URL: https://iopscience.iop.org/article/10.1088/1748-9326/aa6512
42
Jupiter, S., Mangubhai, S., & Kingsford, R. T. (2014). Conservation of Biodiversity in the Pacific Islands of Oceania: Challenges and
Opportunities. Pacific Conservation Biology, 20(2), 206–220. DOI: https://doi.org/10.1071/PC140206
43
Reynolds, M. H., Courtot, K. N., Berkowitz, P., Storlazzi, C. D., Moore, J., & Flint, E. (2015). Will the Effects of Sea-Level Rise Create
Ecological Traps for Pacific Island Seabirds? PLOS ONE, 10(9), 1–23. URL: https://doi.org/10.1371/journal.pone.0136773
44
Taylor, S., & Kumar, L. (2016). Global Climate Change Impacts on Pacific Islands Terrestrial Biodiversity: A Review. Tropical
Conservation Science, 9(1), 203–223. DOI: https://doi.org/10.1177/194008291600900111
45
Pouteau, R., & Birnbaum, P. (2016). Island biodiversity hotspots are getting hotter: vulnerability of tree species to climate change in
New Caledonia. Biological Conservation, 201, 111–119. URL: https://agris.fao.org/agris-search/search.do?recordID=FR2017101025
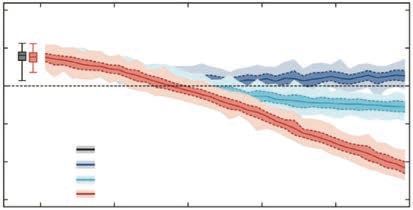
CLIMATE RISK COUNTRY PROFILE: KIRIBATI 13Coral Reefs and Fisheries
Calcium carbonite is used for the external skeletons
of multiple marine organisms – for instance, plankton, FIGURE 5. Projected changes in aragonite
coral reefs, and shell-fish. Increases in atmospheric saturation state in Kiribati’s Phoenix Group
carbon dioxide are understood to lead to reduced of islands from CMIP5 models under RCP2.6,
levels of calcium carbonite saturation on the ocean’s 4.5 and 8.5. Shown are the median values
service via an increase in ocean acidification and by (solid lines), the interquartile range (dashed
decreasing carbonite ion concentrations. As a result, lines), and 5% and 95% percentiles (light
there are serious concerns that if carbonite minerals, shading). The horizontal line represents the
such as aragonite, become under saturated, it could threshold at which transition to marginal
undermine current ocean ecosystems.46 Figure 5 conditions for coral reef health typically
shows the projected aragonite saturation state under occurs.1
three emission scenarios for Kiribati. Worryingly 4.5
under RCP4.5 and RCP8.5 the saturation state is 4
expected to decrease below the threshold needed
Arag Sat. State
3.5
to sustain healthy coral reefs. Horizon
3
Observations
Climate change and human resource exploitation 2.5 RCP 2.6
RCP 4.5
represent a dual threat to fisheries. Species living 2
RCP 8.5
2000 2020 2040 2060 2080 2100
in and around coral reefs, either permanently or in
Year
their juvenile period, and particularly larger species,
face an extinction threat.47 As a result of changes
in temperature, dissolved oxygen, and acidity, the
maximum catch potential of currently resident species has been forecast to decline significantly in Kiribati.48 As a result
there have been strong calls for support to communities to identify suitable responses and financing mechanisms,
and to adapt to the changing marine environment.49
46
Orr, J. C., Fabry, V. J., Aumont, O., Bopp, L., Doney, S. C., Feely, R. A., . . . & Key, R. M. (2005). Anthropogenic ocean acidification over
the twenty-first century and its impact on calcifying organisms. Nature, 437(7059), 681. DOI: 10.1038/nature04095
47
Mellin, C., Mouillot, D., Kulbicki, M., McClanahan, T. R., Vigliola, L., Bradshaw, C. J. A., . . . Caley, M. J. (2016). Humans and seasonal
climate variability threaten large-bodied coral reef fish with small ranges. Nature Communications, 7(1), 10491. DOI: https://doi.org/
10.1038/ncomms10491
48
Asch, R. G., Cheung, W. W. L., & Reygondeau, G. (2018). Future marine ecosystem drivers, biodiversity, and fisheries maximum
catch potential in Pacific island countries and territories under climate change. Marine Policy, 88, 285–294. URL: https://doi.org/
10.1016/j.marpol.2017.08.015
49
Hanich, Q., Wabnitz, C. C. C., Ota, Y., Amos, M., Donato-Hunt, C., & Hunt, A. (2018). Small-scale fisheries under climate change in
the Pacific Islands region. Marine Policy, 88, 279–284. DOI: https://doi.org/https://doi.org/10.1016/j.marpol.2017.11.011
CLIMATE RISK COUNTRY PROFILE: KIRIBATI 14Economic Sectors
Agriculture
Climate change will influence food production via direct and indirect effects on crop growth processes. Direct effects
include alterations to carbon dioxide availability, precipitation and temperatures. Indirect effects include through
impacts on water resource availability and seasonality, soil organic matter transformation, soil erosion, changes in
pest and disease profiles, the arrival of invasive species, and decline in arable areas due to the submergence of
coastal lands and desertification. On an international level, these impacts are expected to damage key staple crop
yields, even on lower emissions pathways. Tebaldi and Lobell (2018) estimate 5% and 6% declines in global wheat
and maize yields respectively even if the Paris Climate Agreement is met and warming is limited to 1.5°C. Shifts
in the optimal and viable spatial ranges of certain crops are also inevitable, though the extent and speed of those
shifts remains dependent on the emissions pathway.50
Kiribati has identified a range of climate impacts in its agriculture sector, with particular threat to its subsistence
farming. Key impacts identified in its Nationally Determined Contribution include: reduced productivity of livestock
due to heat stress, stress on water resources and hence reduced agricultural productivity, water quality and
salinization damage to agricultural productivity and groundwater reserves, and damage and loss of key production,
transport, and storage infrastructure. Climate change impacts in agriculture can often be mitigated through crop
variety adjustments however, the local soils in Kiribati have low fertility, limiting crop choices. These issues, and other
threats to agricultural productivity such as drought, are discussed in Kiribati’s Second National Communication to
the UNFCCC.19
A further, and perhaps lesser appreciated influence of climate change on agricultural production is through its
impact on the health and productivity of the labor force. Work by Dunne et al. (2013) suggests that labor productivity
during peak months has already dropped by 10% as a result of warming, and that a decline of up to 20% might
be expected by the 2050s under the highest emissions pathway (RCP8.5).51 In combination, it is highly likely that
the above processes will have a considerable impact on national food consumption patterns both through direct
impacts on internal agricultural operations, and through impacts on the global supply chain.
50
Tebaldi, C., & Lobell, D. (2018). Differences, or lack thereof, in wheat and maize yields under three low-warming scenarios. Environmental
Research Letters: 13: 065001. URL: https://iopscience.iop.org/article/10.1088/1748-9326/aaba48
51
Dunne, J. P., Stouffer, R. J., & John, J. G. (2013). Reductions in labor capacity from heat stress under climate warming. Nature Climate
Change, 3(6), 563–566. URL: http://www.precaution.org/lib/noaa_reductions_in_labour_capacity_2013.pdf
CLIMATE RISK COUNTRY PROFILE: KIRIBATI 15You can also read