General Insurance Stress Test 2019 - Scenario Specification, Guidelines and Instructions - Bank of England
←
→
Page content transcription
If your browser does not render page correctly, please read the page content below
General Insurance Stress Test 2019
Scenario Specification, Guidelines and Instructions
To be finalised in June 2019

DRAFT FOR FEEDBACK FROM PARTICIPATING FIRMS
April 2019

Note: The Bank may decide to delay or not to run the exercise depending on market conditions.

Prudential Regulation Authority | 20 Moorgate | London EC2R 6DA

CONTENTS

Introduction .............................................................................................................. 2
1. Insurance Asset Shock (IAS)............................................................................. 9
2. US Hurricane Set of Events ............................................................................. 12
3. California Earthquake and Aftershock ........................................................... 16
4. Japanese Earthquake and Tsunami ............................................................... 19
5. UK Windstorm and UK Flood .......................................................................... 22
6. Reserve Deterioration ...................................................................................... 25
7. Cyber underwriting Loss scenario ................................................................. 26
8. Climate Change Scenarios .............................................................................. 28
9. Exposure gathering for Commercial risks by sector .................................... 36
Annex I: Natural Catastrophe scenarios – additional Information ..................... 38
Annex II: Climate Change scenarios – additional information ........................... 42
Annex III: Abbreviations used ............................................................................... 45
Annex IV: Acknowledgements .............................................................................. 46
INTRODUCTION
This document provides instructions for completing the general insurance stress tests, as well as
details of additional data designed to assist the PRA in monitoring sector risks. The stress tests and
the additional data collection are collectively referred to as the PRA’s General Insurance Stress Test
(GIST 2019).
The previous exercise was conducted in 2017. This year there are two notable additions. First we
will be running this exercise concurrently with a life stress test exercise. Second, for the economic
and natural catastrophe scenarios we will be coordinating this exercise with the Bermuda Monetary
Authority (the BMA). Further details are provided in subsequent sections.
Firms are requested to complete the Excel workbook ‘GIST 2019 Template.xls’ (GIST Template) to
record the numerical results for each stress test and provide the additional qualitative information
requested.

OBJECTIVES
The PRA’s objectives in conducting this exercise are to inform our view of sector risks and assist in
the supervision of individual firms. For clarity, this is not a pass/fail exercise and is not designed to
set capital buffers.

 OBJECTIVES: INSURANCE STRESS TESTING

                                            Assess losses gross and net of reinsurance across the UK
                    Sector resilience       insurance industry to severe but conceivable scenarios to inform
                                            PRA’s view of sector resilience.

                                            Assist in understanding the extent to which individual firms make
                    Systemic risks/         business decisions that are appropriate for the firm but, taken
 Sectoral

                    Sectoral behaviours     across the entire sector, may not result in the best outcomes (eg
                                            all switching into one asset class).

                    Counterparty            Identify the extent to which the sector relies on a concentration of
                    dependencies            reinsurers and/or jurisdictions following an extreme scenario.

                    Exploratory risks/      Assist in exploring and raising industry debate around emerging
                                            risks to understand how firms are responding eg in relation to
                    horizon scanning        climate change, liability or cyber risks.

                                            Provide an alternative view of balance sheet volatility to specified
                    Effectiveness of risk
                                            scenarios that inform our view of how firms are managing their
                    management
                                            exposures and whether this is in line with their risk appetite.
 Firm supervisory

                                            The PRA stress testing exercise is not used for setting capital. It
                                            provides a complementary view on a firm’s capital assessment
                    View on capital         with potential for identifying assumptions or approaches that are
                                            optimistic. Note: The severity of some scenarios may be beyond
                                            a firm’s one year change in Own Funds at the 1 in 200 level.

                                            Assist in understanding how different firms address technical
                    Assessment of
                                            challenges in their assessment of extreme loss events eg
                    modelling approaches
                                            impacts of tsunami following an earthquake.

                                                                                                                  2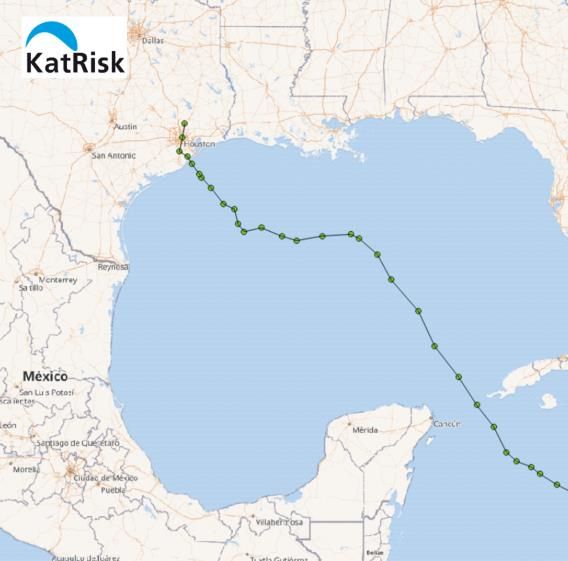
SCOPE OF EXERCISE
Only Category 1 and 2 general insurers, the largest Lloyd’s syndicates and the Society of Lloyd’s are
being requested to participate in the 2019 stress test.
Where firms have not received a request to participate, they do not need to submit a response.
Should firms wish to be included in the exercise, they should contact their supervisor at the PRA,
copying in IST2019@bankofengland.co.uk.

STRUCTURE OF THE GENERAL INSURANCE STRESS TEST
This exercise consists of two parts:
    1. Sections A and B contain the core stress tests: a downturn in the economic environment and
       a set of six severe but conceivable scenarios: four natural catastrophe scenarios, a separate
       claims inflation scenario as well as a new cyber underwriting loss scenario.
    2. Section C is not a stress test; instead it is designed to capture information relating to how
       different firms are managing difficult to assess risks. It comprises a new climate change
       exploratory exercise and repeats a 2017 data request for exposures that will allow the PRA to
       better understand the impact of potential losses by various sectors of the economy.

Section A: Deterioration in the economic environment
General insurers are requested to assess their Balance Sheet against the following scenarios:
Scenario 1: A parallel downward shift in risk free interest rates of 100 bps; a widening in corporate
bond spreads dependent on their current credit rating (eg 150 bps for AAA rated assets); a
simultaneous mass downgrade of credit assets; and a fall in other asset values (including equities
down 30%, commercial property down 40% and residential property down 30%).
At this stage in the exercise, the PRA asks firms to provide feedback regarding the pros and cons of
the two options outlined for the credit downgrade event included in Scenario 1. These options are
outlined in the Event Definition on page 11. Firms should plan for either of the two options being
selected.
Section B: Liability shock coupled with deterioration in the economic environment
The following scenarios are assumed to occur against the backdrop of a deteriorating economic
scenario as defined under Scenario 1 (eg Scenario 2 should consider the impact of three US
hurricanes and a parallel shift to risk free rates of 100 bps):
Scenario 2: Scenario 1 and a cluster of three US hurricanes making landfall in continental US ($181
billion of loss in aggregate). This scenario is more severe than our 2017 US hurricane scenario, which
was an industry loss of around $125 billion.
Scenario 3: Scenario 1 and a severe earthquake of Magnitude ~8.0 along the San Andreas fault,
followed by an aftershock of Magnitude ~7.0, leading to significant property losses and disruption to
supply chains.
Scenario 4: Scenario 1 and an extremely severe earthquake of Magnitude ~ 8.0 with its epicentre
close to Tokyo followed by a tsunami, generating some $60 billion of total industry insured loss.
Scenario 5: Scenario 1 and a large UK windstorm and a large UK flood leading to some £22 billion of
losses in aggregate to the UK insurance sector.
Scenario 6: Scenario 1 and a deterioration in Technical Provisions due to claims inflation (over and
above consumer price inflation) being 2.0% p.a. higher than allowed for in the reserving basis.

                                                                                                    3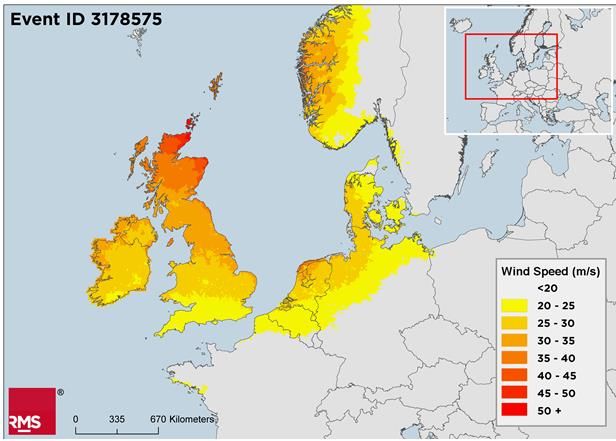
Scenario 7: A cyber underwriting loss scenario based on a gang of hackers exploiting a systemic
weak point in operating systems or chip architecture to carry out a ransomware attack leading to a
mass outage of a few days across multiple sectors of the economy.

Section C: Climate change, liability exposure management
This section is not a stress test. Instead it is designed to capture information to help understand how
different firms are managing difficult-to-assess risks – in this case climate change related risks and
liability exposure management. We expect that market feedback will enhance developments in this
area, increase Board awareness, and will supplement supervisor’s knowledge of the firms’ overall
governance and culture. These findings will also support the climate related activity of the Bank’s
Climate Hub in assisting the Network for Greening the Financial System (NGFS).
Climate Change: firms are requested to consider the impact of three hypothetical greenhouse
emission scenarios on selected metrics of their business models and asset valuations. These
scenarios are expressed by their climatic and financial impacts. The set of assumptions underlying
each scenario is developed for illustrative purposes only, to ensure that firms complete the return on
the same basis and should therefore not be taken as a precedent for future domestic or international
exercises. The assumptions in Section C do not represent a PRA forecast neither do they
represent scenarios that have been built bottom-up by the PRA based on a view of future
carbon price.
We also ask firms to provide qualitative and quantitative information on any climate scenarios that the
firms have already developed.
Liability exposure management: this section is a repeat of the industry level commercial exposure
data requested in our 2017 exercise. However, we have reduced the level of granularity of the data
request (ie fewer industry codes) and expanded the scope to include all worldwide exposures, not just
the UK.
Section C is on a best endeavours basis.

Note: these stress tests, including all parameters and calibrations, have been designed for the
purpose of this stress testing exercise only. Firms should not interpret them as indicators of a
PRA position on risk calibrations or interactions.

                                                                                                     4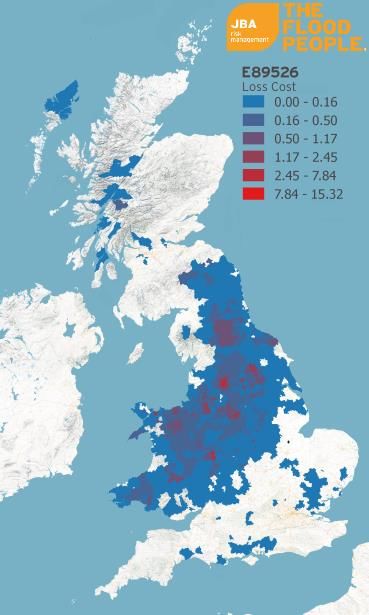
COORDINATION WITH THE BERMUDA MONETARY AUTHORITY
We will be conducting a joint exercise with the Bermuda Monetary Authority (the BMA) for the natural
catastrophe and economic scenarios.
Many London market insurers are exposed to similar risks to those based in Bermuda; furthermore
(as illustrated in our previous stress test exercise) 1 UK based insurers cede a significant proportion of
risks to Bermuda based reinsurers. Consequently, we believe coordination will strengthen both the
PRA’s and the BMA’s understanding of the assessment and interconnectedness of these risks.

Coordination Objectives

    COORDINATION OBJECTIVES

                                 Test the resilience of insurance firms operating across UK and
    Groups resilience
                                 Bermuda jurisdictions including at least the UK and Bermuda.

                                 Provide reassurance to industry, and the wider market, of the
    Reassurance
                                 resilience of our regulated entities.

                                 Enhance our understanding of the interconnectedness between our
    Interconnectedness           different jurisdictions, especially from the reinsurance premium and
                                 claims flows, in the event of our stress scenarios.

                                 Inform and prioritise our supervision of some of the largest firms we
    Supervision
                                 supervise.

Regulatory exchange of information
Formal exchange of information between the BMA and the PRA will be in line with our Memorandum
of Understanding (MOU).
Where participating firms have operations in both the UK and Bermuda, information will be shared in
line with that provided under the existing supervisory college arrangements.
Where firms do not have any operations in Bermuda, we will only share aggregate information,
ensuring that individual firms are not identifiable.
In support of the objectives outlined above we expect to share aggregated information such as gross
and reinsurance recoverables following each stress, the aggregated impact of investment losses from
the economic scenario and additional learnings or observations on firm feedback to the extent that
these were common issues.

Use
This stress test exercise is not being used to set additional capital on firms by either the PRA or the
BMA. Instead, the results from the exercise will inform and advance the supervisory work of the PRA
and the BMA. Were we to identify any prudential issues of concern for a firm, this would be followed
up as part of our business as usual supervision. Where the issue could be common across both
jurisdictions, the PRA and the BMA could carry out joint investigations, subject to the agreement with
the firm. To the extent the exercise contributes to more focussed regulatory investigations, this would
ultimately be less burdensome on our regulated firms.

1     December 2017 available at https://www.bankofengland.co.uk/prudential-regulation/letter/2017/general-
      insurance-stress-test-2017-feedback.

                                                                                                              5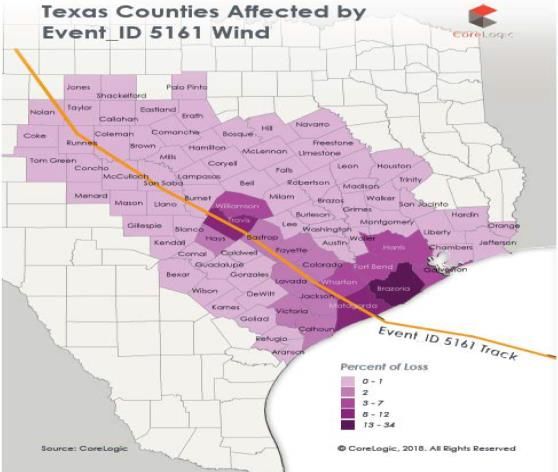
Market Communication
The PRA and the BMA will also be coordinating the publications of our key findings from the exercise.
Only aggregate results and findings will be published drawing attention to sectoral findings or
learnings of interest at a market level. No firm specific information will be published. The PRA and
the BMA are likely to communicate key findings in the form of a Dear CEO letter during the first
quarter of 2020.

ACCOUNTING AND REPORTING
Accounting Basis
Firms are requested to provide a separate submission, on a Solvency II basis, for each material UK
solo or group legal entity, and if applicable, for each of their syndicates at Lloyd’s. Where firms are
uncertain as to the scope of their submission, they should consult with and obtain the agreement of
their PRA supervisor.

Opening Balance Sheet
Firms are required to provide their Balance Sheet as at year-end 2018 on the 2018 Balance Sheet
worksheet. Basic Own Funds are derived from net assets, and eligible own funds should be
disclosed on this worksheet. The worksheet provides the necessary Solvency II QRT references.
Where firms expect or have carried out significant change of their portfolio (for example through a
transfer of business) this should be set out in the expected year-end 2019 projection – see
subsequent section.

Solvency Capital Requirement
On the capital worksheet please disclose details of the SCR as at year-end 2018, and as at year-end
2019 according to the current estimate. Where the estimate differs from that provided in the most
recent Regular Supervisory Report, please explain the difference in the Free Form Comments tab.

Projecting the Balance Sheet – Base Case and following a Stress
Firms are required to project their Own Funds and their estimated SCR as at 31/12/2019. These
projections should be in line with the firm’s business plan and is referred to as the ‘base case’. Where
material, firms should provide an estimate of the change in Own Funds and the projected SCR which
is attributable to any transfers of business taking place during 2019.
Similarly for each stress, firms are also required to quantify the impact on Own Funds and their
estimated SCR to 31/12/2019. As in the previous stress test, firms are required to provide a
breakdown of the impact on the Balance Sheet between the direct stress, market adjustments and
any management actions. For all projected balance sheets and SCRs, firms should calculate any tax
effects using their Solvency II basis, and use the free form comments tab to explain any material
differences which would result if loss relief assumptions for IFRS purposes were used.
Where there is likely to be a material change to the SCR post stress, firms are asked to provide an
estimate of the SCR if different to the Base Case. Firms should make reasonable assumptions eg
scaling is acceptable where it would not lead to materially different results to a more detailed
calculation. Furthermore, changes in risk margin can be approximated.
The “Projected Movement in Net Assets” included in the 2019 Projection worksheet and in Scenarios
1 to 6 is intended to capture all items of income and expenditure, capital transactions and adjustments
which affect basic own funds under headings based on those traditionally used for financial
accounting. Calculation of the SCR according to Article 101 of the Directive should result in the
projected movement in Basic Own Funds under the SCR scenario being equal to the 2018 SCR
disclosed on the Capital worksheet. Please explain any difference on the Free Form Comments tab.

                                                                                                      6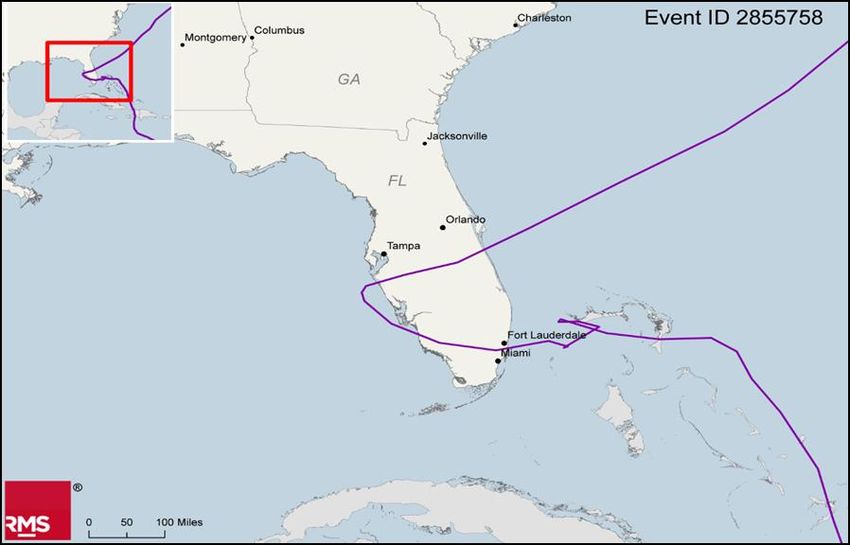
Management actions
Firms should disclose what management actions they anticipate taking in the various scenarios and
how this would impact their Own Funds and their projected SCR.
For example, these could include changes to their reinsurance programme and likely cost allowing for
reinsurance rate increases where relevant, expected changes to their underwriting strategy, changes
to premium rates they would charge and changes to their asset allocation. While some of these
management actions will impact the year-end 2019 Balance Sheet and Own Funds, the full impact
may not be captured. Firms are asked to provide additional qualitative information in the Free Form
Boxes provided.
Where firms anticipate re-capitalisation plans, firms should provide this information, but should not
assume new capital will be in place before year-end 2019 unless existing contractual arrangements
allow for this. Details of any such contractual arrangements should be included in the submission.

Materiality
Firms should complete all scenarios unless they can demonstrate that, given their specific risk
coverage, the impact is immaterial. In this case immateriality is defined as less than 5% of total gross
written premium.
Firms should include a details of exposure to each reinsurer where expected recoveries are more
than 2% of the total recoverable.

PROCESS AND FEEDBACK
Submission template
For each stress scenario, firms are required to submit a number of outputs that are standard across
scenarios within the Excel template provided – the GIST Template.
In certain scenarios we ask for additional information that will allow the PRA to assess the calculation
and impact of each stress in greater detail.

Deadline for submission
Submission of the completed Excel template is required by 17:00 on Monday 30 September 2019.
The Excel workbook should be saved ensuring that Firm Name and FRN number in the file name
and the subject of the email. Submissions should be sent to IST2019@bankofengland.co.uk.

Governance requirements
On submission, the Board of directors is required to confirm they are satisfied with the
submission and that the information provides a reasonable estimate of own funds and their
SCR after each stress scenario. The results do not need to be audited.

Presentation of the Stress Test results to the PRA
The PRA encourages firms to present their stress test results shortly after the formal submission date
to help our understanding of the impact of the stresses and any issues that arose in completing this
exercise. This need not contain any additional information, but reflects the value of a two-way
dialogue to help understand the thought process and the underlying issues in greater depth. Following
our previous stress test exercise some firms shared their Board presentations – these were very
constructive in supporting our understanding of their stress test results.

                                                                                                       7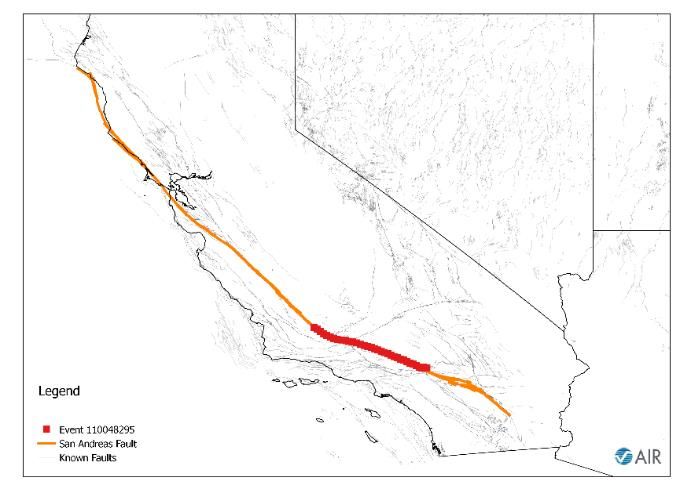
Resubmissions
Individual firm supervisors will be using the stress test submission as part of their ongoing supervisory
reviews and the stress test results will inform the firm’s supervisory risk score.
Firms should ensure that the quantitative and qualitative information provided is clear and sufficient.
Where this is not the case, the PRA will ask for a resubmission to enable it to make an adequate
assessment. Firms will need to provide a resubmission within 2 weeks of request.

PUBLIC DISCLOSURE
The PRA will not publish any firm specific information as part of this exercise. Where there is a need
to take firm specific supervisory action, the PRA will do so as part of our normal supervisory
engagement with the firm.
The PRA intends to publish a Dear CEO letter containing our findings at an aggregate level during Q1
2020, drawing attention to sectoral findings or learnings of interest at a market level.

QUERIES
All queries should be submitted to IST2019@bankofengland.co.uk, copying in the firm’s PRA
supervisor. Please ensure that the Firm Name and FRN number is included in the subject of the
email.

ENCLOSURES
 a)    GIST 2019 Template.xls             to record results

                                                                                                       8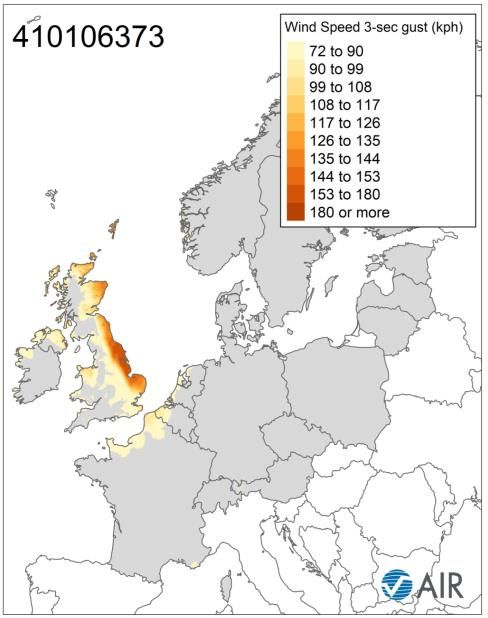
Section A
1. INSURANCE ASSET SHOCK (IAS)
This asset shock has been designed to stress both life insurance and general insurance companies,
with a fall in interest rates and risk free yield curves, a widening of corporate bond spreads, and falls
in equity markets and real estate. This stress should be applied as an instantaneous stress on the
starting balance sheet as at the beginning of the year 2019.

1.1 EVENT DEFINITION
This sections sets out the movements in key macroeconomic variables or market indices.
Interest rates       All interest rate spot curves experience a 100bps absolute fall at all tenors
                     (including the Ultimate Forward Rate).

                     This stress is likely to lead to negative rates at shorter durations. Where this is the
                     case, and firms have the capability to model negative rates they should do so. For
                     firms without the capability to model negative rates, these should be floored at
                     zero, but this should be made clear in the response and firms should attempt to
                     quantify on a best efforts basis the impact were negative rates modelled explicitly.

                     The interest rate stresses should also apply to all assets whose valuation is
                     interest rate sensitive in addition to the stresses outlined below (eg derivatives,
                     corporate bonds, illiquid assets).
Gilt-swap spread     Firms should assume that there is no stress to gilt-swap spreads.

Sovereign and        Firms should assume that there is no stress to sovereign assets.
Central Bank
Bonds

Credit               For Central Government and Central Bank bonds, firms should assume that the
Downgrades           Credit Quality Step (CQS) remains unchanged post stress.

                     Option 1: For all other assets, firms should assume that there is a 2 notch
                     downgrade.

                     Option 2: For all other assets, firms should assume that 75% of each asset
                     experiences a 1 CQS downgrade and the remaining 25% of each asset
                     experiences no movement in credit rating. For avoidance of doubt, all assets
                     should be notionally split into 75%/25% parts.
Credit Spreads       For fixed income assets, firms should apply the following stresses to credit
                     spreads. For avoidance of doubt, the credit rating and Credit Quality Step (CQS)
                     referred to in the table below is the pre-stress rating/CQS.

                      Credit Rating (non-        Credit Quality Step       Credit Spread
                      MA fund)                   (MA fund)                 increase
                      AAA                        0                         150bps
                      AA                         1                         170bps
                      A                          2                         200bps
                      BBB                        3                         300bps
                      BB and lower and           4+                        400bps
                      unrated

                     The credit spread increase will apply to all types of bonds that do not qualify as

                                                                                                            9
‘sovereign’ and does not vary by duration or sector.
Equities All equities experience a 30% decrease in value. This applies to public and
private equity, hedge funds and CIS investments.
Property Firms should assume a 40% fall in commercial property and 30% fall in
residential property.
Cash and Money Firms should assume no stress to the value of cash or money market instruments
Market with duration less than one year. For instruments with duration more than one
Instruments year these should be treated as described under ‘All other assets’ below.
Firms should not assume any management actions post-stress including entering
into new money market transactions.
Derivatives Option values should move in line with an increase in implied volatility at all tenors
of 700bps. This includes, but is not limited to, equity and swaption implied
volatility.
Swap values should move in line with a decrease in the floating yield curve of
100bps at all tenors (ie the interest rate stress). Where relevant, firms should
assume that reference swap assets also fall in value in line with the relevant
stress outlined in the asset shock scenario.
Longevity-linked instrument values should move as if floating longevity
expectations matched the extent to which longevity is stressed (this is applicable
only in scenarios 3 and 4).
Inflation Firms should assume that there is no stress to inflation rates.
Foreign Firms should assume that there is no stress to foreign exchange rates.
exchange
All other assets Any investment asset not specifically referenced should be stressed as if it were a
corporate bond (ie apply the credit spread and interest rate stresses above)
where it is sensible to do so (ie the assets have a contractual cash flow profile and
are either mapped to a CQS or have a credit rating).
Where this is not possible, all other assets should experience a 30% value fall as
for equities. This is to ensure that all assets held by firms (other than cash)
experience some form of stress. This should include investments in subsidiaries
where the firm does not intend to ‘look through’.
Fundamental Firms should use the relevant EIOPA Fundamental Spread (FS) based on the
Spread Financial/Non-Financial sector and revised Credit Quality Step of the asset post-
stress.
Firms should assume there is no change to the EIOPA FS tables at the stress
date.
Firms should assume the Long Term Average Spread (LTAS) floor component of
FS is unchanged following the stress event.
1.2 ASSUMPTIONS
For the valuation of pension scheme liabilities, firms should assume that the discount rate would
change by the level of any change in the risk-free rate plus 50% of the change in spread on AA rated
corporate bonds. Under the proposed stress the risk-free rate decreases by 100bps and 50% of the
spread on AA rated corporate bonds is an increase of 85bps. Therefore, both elements combined
result in a 15bps fall at all tenors to the discount rate.
10Where firms have an approved Internal Model, they should use the same methodology used in the
Internal Model for the pension scheme.
1.3 REPORTING
Firms should assess the impact on both the asset and liability side of their projected Solvency II
Balance Sheet as at year-end 2019.
Firms should disclose any changes they plan to make to their asset allocation.
Firms should separate out the impact on their Defined Benefit Pension Schemes.
11Section B1
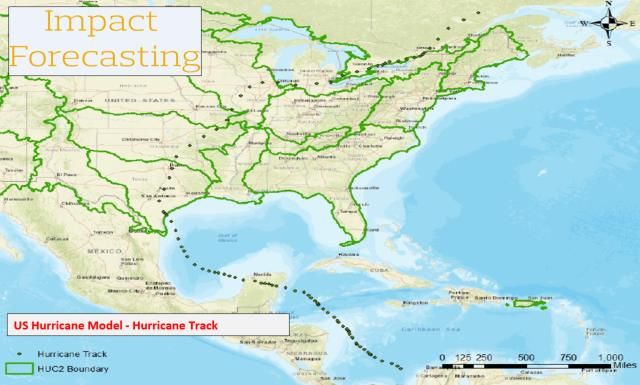
2. US HURRICANE SET OF EVENTS
The US set of hurricanes scenario is a counterfactual to the 2017 Harvey, Irma and Maria (HIM)
cluster of losses, with an Irma-like hurricane making two landfalls in Florida, a Harvey-like hurricane
hitting Houston, and a third hurricane (unrelated to Maria) making landfall on the East coast of the US.
The PRA is specifically interested in how firms model the precipitation induced flooding associated
with slow moving hurricanes while recognising that the insured loss would be less due to significant
portion of these losses not being insured or being retained in national pools. This stress is
superimposed on the insurance asset shock scenario.
2.1 EVENT DEFINITION
This stress scenario is for a Harvey, Irma and Maria (HIM) type of scenario where a cluster of three
major US hurricanes occur in the same year. At today’s values, the three hurricanes are specified to
cause a total industry loss in excess of US$180 billion, with a range of vendor model event IDs
supplied.
Firms are to assume that the events are sufficiently separated in time to be considered three separate
events for the purposes of reinsurance recoveries.
Firms should assume that the asset shock specified in Scenario 1 occurs.
2.2 ASSUMPTIONS
Firms are expected to form their own views in estimating the impact of the losses. In estimating the
gross loss, firms should allow for storm surge, precipitation-induced flooding, policy leakage (across
different Lines of Business) and demand surge or post loss amplification.
Where firms are using external vendor models, firms should adjust the model output reflecting any
model limitations including non-modelled claims, past model performance in recent events and the
firm’s own views.
Firms should assume events fall under the same reinsurance treaty year, that any changes made to
the reinsurance programme do not incept before the first event occurred, and should include the
impact of both inwards and outwards reinstatement premiums. Where additional reinstatements or
back-up covers are purchased, firms should quantify the likely rate increases and should not factor in
reduced attachment points without adequate justification.
In modelling the gross and net impact of the scenario, firms should include the impact of both inwards
and outwards reinstatement premiums and the impact of any profit commission clawback.
Firms should consider what management actions they may take following the series of events. These
include changes to their reinsurance programmes, changes to their planned premium income or rating
structures, and re-capitalisation plans. The cost of these actions, to the extent appropriate, should be
allowed for in the estimation of the Own Funds as at the year-end 2019, with adequate descriptions in
the Free Form Comments box.
2.2.1 First hurricane: Irma-like hurricane hitting Florida
The figure below illustrate the track of the first hurricane of Category 4 on the Saffir-Simpson scale at
landfall from one model provider (refer to Annex I for figures illustrating tracks from other model
providers). The hurricane is assumed to cause losses across the Caribbean before making two
landfalls in Florida, the first one being a Category 4 hurricane. The table below provides details of the
hurricane’s first US landfall.
12Hurricane – Wind AIR RMS
and Surge only
eventID 270025393 2855758
Gross Market Loss
($billion) US & 122.2 141
Carribbean
Saffir-Simpson
4 4
Category
Central Pressure
941.4 941
(mbar)
Maximum
154.8 149
Windspeed (mph)
Speed (mph) 21.7 11
Longitude (degrees) -80.773 -80.11
Latitude (degrees) 25.246 25.96
Modelled hurricane track as modelled by AIR. Refer to
State FL FL
Annex I for figures from other model provider(s).
County Monroe Miami-Dade
Indicatively, the resulting industry loss is assumed to be approximately US$122 billion according to
AIR and US$141 billion according to RMS (approximately 4% of the RMS loss comes from the
Caribbean), with the closest matching AIR Event ID being 27025393 and the closest matching RMS
Event ID being 2855758. Loss estimates include demand surge/post-loss amplification. The PRA is
aware that the event footprint, associated parameters and industry loss differ between vendor models.
2.2.2 Second hurricane hitting Houston
The map below illustrates the modelled track from a vendor model for the second, slow-moving
hurricane making landfall in Galveston and Houston (refer to Annex I for figures from other model
providers). The hurricane is assumed to have a wide footprint leading to significant precipitation-
induced flood losses exceeding 120hrs in duration but less than 504 hours. The hurricane is
assumed to cause losses across the Gulf of Mexico before making a US mainland landfall. The
hurricane is also assumed to lead to surge and wind losses. The tables below provide details of the
hurricane’s US landfall.
Hurricane Variable – Impact RMS RiskLink
AIR Corelogic KatRisk
Wind and Surge only Forecasting
EventID 270191121 5161 82 411741 2858510
Gross market loss
($billion) 7.1 7.0 7.3 5.1
6.8
(inc. Caribbean)
Saffir-Simpson
2.0 3 3 3 1
Category
Central Pressure
943 947 948 944.6 978
(mbar)
Maximum Windspeed
100 130 1541 116 86
(mph)
Longitude (degrees) -94.89 -95.87 -97.11 -95.0 -94.94
Latitude (degrees) 29.23 28.68 27.77 29.01 29.21
State TX TX TX TX TX
County Galveston Matagorda Nueces Galveston Galveston
1 This is the 3-sec gust speed
13Hurricane
Impact
Variable – AIR Corelogic KatRisk RMS (HD)
Forecasting
Inland Flood
EventID 80063564 5161 60940 411741 9615711
Gross market
loss ($billion) 31 30 34.4 33.2 19.4
TX, MN, UT,
States affected SD, LA TX, LA TX TX, LA IL, LA, TX
Event Duration
(hrs) 143 n/a n/a n/a 144
Central Texas
Coastal, Sabine,
Lower Brazon,
Galveston Bay- Great
San Jacinto, Lakes,
Neches, Trinity, Mississippi,
Lower Colorado- Rio
San Bernard Texas and Gulf Grande,
Basins affected n/a Coastal region (HUC12) n/a Texas
Modelled hurricane track and corresponding flood footprint as modelled by KatRisk. Refer to Annex I for figures
from other model provider(s).
Indicatively, the resulting industry loss is assumed to be in excess of US$30 billion including demand
surge/post-loss amplification, split between ~25% of wind and storm surge damage and ~75% of
precipitation-induced damage.
The closest matching vendor model event IDs are provided in the tables above. Please note that
some vendor models have the same event ID across both wind and flood losses whilst other have
provided the closest flood event ID for a given hurricane footprint.
The PRA is aware that the event footprint, associated parameters and industry loss between vendor
models will differ. Where firms do not licence or use an inland flood model, firms may use alternative
methods such as realistic disaster scenarios or pro-rate the wind and storm surge damage
proportionally, providing brief outline of the methodology adopted.
2.2.3 Third hurricane affecting the north east coast of United States
The map below illustrates the RMS track for the third Category 2 hurricane making landfall on the
East Coast and NY state in particular, causing significant losses in Nassau, Suffolk, Kings and
14Queens in particular. Please refer to Annex I for figures illustrating other model provider’s track.
Details of the hurricane’s landfall are provided in the table below.
Hurricane
AIR RMS
Variable
EventID 270153386 2857297
Gross market loss
($billion) 28.9 31
Saffir-Simpson
Category 2 2
Central Pressure
(mbar) 948.9 950
Maximum
Windspeed (mph) 104.3 101
Forward Speed
(mph) 33.8 25
Longitude
(degrees) -73.12 -73.78
Latitude (degrees) 40.68 40.58
State NY NY Modelled hurricane track as modelled by RMS. Refer to
Annex I for figures from other model provider(s).
County Suffolk Queens
Indicatively, the resulting industry loss is assumed to be approximately US$28.9 billion according to
AIR (event ID 270153386) and US$31 billion according to RMS (event ID 2857297). The losses are
expected to be driven by a combination of storm surge and wind. The PRA is aware that the event
footprint, associated parameters and industry loss differ between vendor models.
2.3 REPORTING
Data assumptions and adjustments made to the vendor model estimates to reflect firms’ own view of
risk should be disclosed, including for example:
the allowance made for uncaptured exposures or data limitations (eg locations not geocoded);
and
the allowance made for non-modelled secondary perils (eg storm-surge), non-modelled
coverages (eg contingent business interruption) and non-modelled lines of business (eg on-
shore energy or aviation).
Firms are also asked to disclose their estimates of post loss amplification, their estimates of the
secondary uncertainty (if any) around their loss estimates, the vendor model and version used, as
well as any other assumptions made in the loss estimation.
The gross loss estimate should break down the loss between lines of business and coverage (eg
residential property damage, commercial property damage, business interruption, contingent business
interruption, motor, marine and energy, liability).
The gross loss estimate should also break down the loss between types of peril (eg wind, storm-
surge, inland flood).
Firms should provide details of the exposures that have been modelled (modelled number of risks and
modelled sums insured), their exposures impacted by the different hurricanes (impacted number of
risks and impacted sums insured), and give details of the firm’s expected number of claims and
average cost per claim. Firms may make reasonable assumptions to derive their estimates and
should exclude immaterial claims if using vendor models.
15Section B2
3. CALIFORNIA EARTHQUAKE AND AFTERSHOCK
This stress is similar but not identical to the California earthquake scenario included in GIST2017. It
tests firms’ resilience to a severe earthquake and a subsequent aftershock. It takes into consideration
the latest UCERF3 version of the US hazard model for California that considers the possibility of a
multi-fault rupture that have the potential for Mw7.5+ involving San Andreas and Hayward faults
followed by a second event in the region of Los Angeles. The stress test is analogous to what has
been observed during past earthquake sequences (eg the 2010-2011 New Zealand series of events;
the late 20th century sequence in Turkey; the 1811-1812 New Madrid sequence in the United States of
America). This stress is superimposed on the insurance asset shock scenario.
3.1 EVENT DEFINITION
This stress test is for a severe earthquake in central and southern California, followed by a severe
second event. The scenario has been based on a plausible Magnitude ~8 main shock along sections
of the San Andreas fault and potentially the Hayward fault, and a subsequent magnitude ~7 event in
the region of Los Angeles. At today’s values, the two earthquakes are estimated to cause a total
industry loss of US$ 70 billion approximately according to AIR and US$80 billion according to RMS.
A major earthquake (Magnitude ~8) rupturing sections of the central and southern sections of the San
Andreas fault that potentially triggers also the Hayward fault would be a rare but plausible event. As
far as the San Andreas fault trigger alone is considered, the last major event of similar characteristics
occurred in 1857 near Fort Tejon (magnitude 7.9). Therefore, in PRA’s view, the stress-test event
cannot be ruled out for consideration, especially when time-dependency effects are considered given
that the Hayward fault is at the end of its cycle.
The inclusion of the second event in a plausible multi-event scenario follows the lessons learned
regarding stress transfer mechanisms across different faults (eg New Zealand 2010 and 2011
events). Firms are to assume that the events are sufficiently separated in time to be considered two
separate events for the purposes of reinsurance recoveries.
Firms should assume that the asset shock specified in Scenario 1 occurs.
3.2 ASSUMPTIONS
In estimating the gross loss, firms are asked to allow for demand surge (post loss amplification), using
their natural catastrophe modelling capabilities.
Firms should estimate both the aggregate losses and the breakdown between the two earthquakes
taking into consideration ground-shaking, fire-following, liability losses triggered by earthquake and
tsunami losses. Breakdown between physical damage and contingent business interruption is also
requested. Liability losses examples could include litigation for structural failure or hazardous
biochemical release. Should the firm not have access to suitable modelling capabilities, they are
requested to estimate the non-modelled components (eg liability or contingent business interruption)
using an alternative approach of their choice. The approach should be clearly disclosed, along with
assumptions and expert judgements made, to estimate the non-modelled components.
Where firms are using external vendor models, firms should adjust the model output reflecting any
model limitations including non-modelled claims, past model performance in recent events and the
firm’s own views.
Firms should assume events fall under the same reinsurance treaty year, that any changes made to
the reinsurance programme do not incept before the first event occurred, and should include the
16impact of both inwards and outwards reinstatement premiums. Where additional reinstatements or
back-up covers are purchased, firms should quantify the likely rate increases and should not factor in
reduced attachment points without adequate justification.
In modelling the gross and net impact of the scenario, firms should include the impact of both inwards
and outwards reinstatement premiums and the impact of any profit commission clawback.
Firms should consider what management actions they may take following the series of events. These
include changes to their reinsurance programmes, changes to their planned premium income or rating
structures, and re-capitalisation plans. The cost of these actions, to the extent appropriate, should be
allowed for in the estimation of the Own Funds as at the year-end 2019, with adequate descriptions in
the free form box.
3.2.1 Earthquake sources
The map below illustrates the AIR rupture extents for the first event, which is assumed to match the
characteristics of a multi-fault Magnitude ~7.5+ event rupturing sections of the San Andreas fault
(N.B. RMS event connects with the Hayward fault). For firms not using any vendor model, the fault
rupture characteristics can be found in the table below. The epicentre is located in the region from
Fremont through to Soledad to the region of San Bernardino. The epicentre should be located at
34.66 latitude and -118.41 longitude for the first event. Firms are requested to simulate the second
event (magnitude ~7.0) with an epicentre located at 34.15 latitude and -118.04 longitude i.e. on the
Raymond Fault.
California earthquake fault as modelled by AIR (left) and RMS (right).
For the first event, the closest matching AIR Event ID would be 110048295 (time-dependent
catalogue) causing approximately US$32 billion of industry losses at today’s values, according to AIR.
This loss corresponds to an approximate 100 year return period on AIR’s California exceedance
probability curve computed using AIR’s industry exposure database. The closest matching RMS
Event ID would be 15012046 leading to some US$56 billion of industry losses. This loss corresponds
to an approximate 150 year return period on the RMS USEQ IED.
For the second event, the closest matching AIR Event ID would be 110020504 (time-dependent
catalogue) causing some US$35 billion of industry losses. The closest matching RMS Event ID
(denoted in green in the RMS figure above) would be 15022404 estimated to cause approximately
US$25 billion industry losses.
The PRA is aware that event footprints, associated parameters and industry losses differ between
vendor models.
17Parameters for firms not First earthquake: San Second earthquake: Santa Monica /
relying on vendor Andreas/Hayward Raymond / Hollywood/San Gabriel
models
Model provider AIR RMS AIR RMS
Earthquake magnitude 7.8 8.0 7.1 7.0
(Mw)
Depth (km) 8.1 8.1 9.7 9.7
Rupture length (km) 240 590 62 46
Epicentre latitude (°) 34.66 34.58 34.15 34.15
Epicentre longitude (°) -118.41 -118.12 -118.27 -118.04
3.3 REPORTING
Data assumptions and adjustments made to the vendor model estimates to reflect firms’ own view of
risk should be disclosed, including for example:
the allowance made for uncaptured exposures or data limitations (eg locations not geocoded);
and
the allowance made for non-modelled secondary perils (eg fire following), non-modelled
coverages (eg contingent business interruption) and non-modelled lines of business (eg
energy).
Firms are also asked to disclose their estimates of post loss amplification, their estimates of the
secondary uncertainty (if any) around their loss estimates, the vendor model and version used, as
well as any other assumptions made in the loss estimation.
The gross loss estimate should break down the loss between lines of business and coverage (eg
residential property damage, commercial property damage, business interruption, contingent business
interruption, motor, marine and energy, liability).
The gross loss estimate should also break down the loss between types of peril (eg ground-shaking,
fire following, tsunami).
Firms should provide details of the exposures that have been modelled (modelled number of risks and
modelled sums insured), their exposures impacted by the earthquake and the aftershock (impacted
number of risks and impacted sums insured), and give details of the firm’s expected number of claims
and average cost per claim. Firms may make reasonable assumptions to derive their estimates and
should exclude immaterial claims if using vendor models.
18Section B3
4. JAPANESE EARTHQUAKE AND TSUNAMI
This scenario is for a tsunami-generating event in the order of magnitude 8.1 Nankai earthquake on
the Tokai and Tonankai Segments, affecting the high exposure regions between Tokyo and Nagoya.
For Japan, tsunami-generating events tend to be offshore and at larger distances from the coastline.
This scenario attempts to maximise the impact of loss since it is sufficiently off-shore to generate
tsunami and sufficiently close to the coastline to impact on-shore structures. This event is not too
dissimilar to the 1944 Tonankai event, which ruptured the Tonankai and Nankai sections of the
Nankai Trough. This stress is superimposed on the insurance asset shock scenario.
4.1 EVENT DEFINITION
This stress test is for a severe earthquake in the order of Magnitude 8.1 with its off-shore epicentre
affecting the high exposure regions between Nagoya and Tokyo. The scenario has been based on a
plausible event of approximate Magnitude 8.1 rupturing one or more sections of the Nankai Trough, in
the interface between the Philippine sea and the Amurian plates (the latter is part of the Eurasian
plate). At today’s values, the earthquake and resulting tsunami (including the effects of fire-following)
are estimated to cause a total industry loss of approximately US$37 billion according to AIR and
US$19 billion according to RMS RiskLink model (US$24 billion using the RMS HD model).
The event has similarities to the 1944 Tonankai event, which occurred in the same tectonic region,
albeit in a different section of the Nankai Trough (Tokai-Tonankai segments for this stress event, as
opposed to Nankai and Tonankai in the case of the 1944 earthquake). Although different from a
tectonic perspective, the tsunamic component of this events has similarities to the Fukushima event in
2011 that increased the insurance market’s awareness of tsunami risk (albeit the expected loss for
this event might be different than that of 2011). In the PRA’s view, this type of event could plausibly
occur in our lifetime, especially when time-dependency effects are considered.
Firms should assume that the asset shock specified in Scenario 1 occurs.
4.2 ASSUMPTIONS
In estimating the gross loss, firms are asked to allow for demand surge (post loss amplification), using
their natural catastrophe modelling capabilities.
Firms should estimate the losses taking into consideration ground-shaking, tsunami wave, fire-
following, liability losses triggered by earthquake and tsunami losses. Breakdown between physical
damage and contingent business interruption is also requested. Liability losses examples could
include litigation for structural failure or hazardous biochemical release. Should the firms not have
access to suitable modelling capabilities, they are requested to estimate the non-modelled
components (eg liability or contingent business interruption) using an alternative approach of their
choice. The approach should be clearly disclosed, along with assumptions and expert judgements
made, to estimate the non-modelled components.
Where firms are using external vendor models, firms should adjust the model output reflecting any
model limitations including non-modelled claims, past model performance in recent events and the
firm’s own views.
Firms should assume the event fall under the reinsurance treaties in-force as at the beginning of the
year and should include the impact of both inwards and outwards reinstatement premiums. Where
additional reinstatements or back-up covers are purchased, firms should quantify the likely rate
increases and should not factor in reduced attachment points without adequate justification.
19In modelling the gross and net impact of the scenario, firms should include the impact of both inwards
and outwards reinstatement premiums and the impact of any profit commission clawback.
Firms should consider what management actions they may take following the series of events. These
include changes to their reinsurance programmes, changes to their planned premium income or rating
structures, and re-capitalisation plans. The cost of these actions, to the extent appropriate, should be
allowed for in the estimation of the Own Funds as at the year-end 2019, with adequate descriptions in
the free form box.
4.2.1 Earthquake sources
The map below illustrates footprints of the tsunami-generating Magnitude ~8.0 event, as estimated by
AIR (refer to Annex I for figures from other model providers). Note that for RMS, only the HD model
explicitly covers tsunami and hence RiskLink results will require loading applied by the user to reflect
the tsunami losses. For firms not using any vendor model, candidate earthquake rupture
characteristics are provided in the table below. Tsunami waves are estimated to reach a maximum
wave height of 6 meters along the coastline according to AIR.
Event footprint resulting from a ~Mw8 earthquake on the Tokai segment of the Nankai Trough as
modelled by AIR. Refer to Annex I for event footprint figures from other model provider(s).
For this event, the closest matching AIR Event ID would be 520014687 (Time-dependent catalogue)
causing approximately US$37 billion of industry losses at today’s values, according to AIR. The
closest matching RMS RiskLink Event ID would be 803122 leading to some US$18.5 billion of
industry losses which excludes tsunami losses. The closest RMS HD Event ID would be 8701329
leading to some US$24.3 billion of industry losses, according to RMS.
The PRA is aware that event footprints, associated parameters and industry losses differ between
vendor models.
20Parameters for firms not relying on AIR RMS Link RMS HD
vendor models
Source Subduction- Tokai - Tonankai ANN70 Nankai
fault Trough (XE) TSU
Earthquake magnitude (Mw) 8.16 8.1 8.1
Depth (km) 14.9 10-30 km 10-24 km
Epicentre latitude (°) 34.44 34.27 34.37
Epicentre longitude (°) 138.05 137.16 137.29
Maximum tsunami-induced surge at coastline 5.7 n/a Varies along
(m) coastline
4.3 REPORTING
Data assumptions and adjustments made to the vendor model estimates to reflect firms’ own view of
risk should be disclosed, including for example:
the allowance made for uncaptured exposures or data limitations (eg locations not geocoded);
and
the allowance made for non-modelled secondary perils (eg fire following), non-modelled
coverages (eg contingent business interruption) and non-modelled lines of business (eg
energy).
Firms are also asked to disclose their estimates of post loss amplification, their estimates of the
secondary uncertainty (if any) around their loss estimates, the vendor model and version used, as
well as any other assumptions made in the loss estimation.
The gross loss estimate should break down the loss between lines of business and coverage (eg,
residential property damage, commercial property damage, business interruption, contingent business
interruption, motor, marine and energy, liability).
The gross loss estimate should also break down the loss between types of peril (eg ground-shaking,
fire following, tsunami).
Firms should provide details of the exposures that have been modelled (modelled number of risks and
modelled sums insured), their exposures impacted by the earthquake and the aftershock (impacted
number of risks and impacted sums insured), and give details of the firm’s expected number of claims
and average cost per claim. Firms may make reasonable assumptions to derive their estimates and
should exclude immaterial claims if using vendor models.
21Section B4
5. UK Windstorm AND UK Flood
This scenario is for a set of two events, a large UK windstorm and a large UK flood generating some
£20 billion of gross insured loss. The first event is a UK windstorm causing significant storm surge
losses along the East coast of England generating approximate half of the overall losses. The second
event is for extensive flooding across England and Wales generating the remainder of the overall
losses. Firms are encouraged to develop their own view of risk. This should include adjustments for
the firm’s view of any limitations of the vendor models used. This stress is superimposed on the
insurance asset shock scenario.
5.1 EVENT DEFINITION
This stress test is for a set of two large UK events generating some £20 billion of losses in aggregate
in the United Kingdom. Firms may ignore losses in other parts of Europe.
Firms are to assume that the events are sufficiently separated in time to be considered two separate
events for the purposes of reinsurance recoveries
The return period for aggregate wind, surge and flood losses of this size to the UK is estimated to be
approximately 200 to 250 years according to RMS and AIR, if the events are assumed to be
independent. Firms should note that, if there is some correlation between wind and flood losses, the
return period will differ. Should firms assume correlation in their estimation across perils, they are
expected to outline the basis of their assumptions.
Firms should assume that the asset shock specified in Scenario 1 occurs.
5.2 ASSUMPTIONS
Firms are asked to estimate the size of the loss per event and in aggregate using their natural
catastrophe modelling capabilities. In estimating the gross loss, firms should provide their own view
and allow explicitly for all material non-modelled risks.
In modelling the gross and net impact of the scenario, firms should include the impact of both inwards
and outwards reinstatement premiums and the impact of any profit commission clawback.
Firms should assume events fall under the same reinsurance treaty year, that any changes made to
the reinsurance programme do not incept before the first event occurred, and should include the
impact of both inwards and outwards reinstatement premiums. Where additional reinstatements or
back-up covers are purchased, firms should quantify the likely rate increases and should not factor in
reduced attachment points without adequate justification.
In modelling the gross and net impact of the scenario, firms should include the impact of both inwards
and outwards reinstatement premiums and the impact of any profit commission clawback.
Firms should consider what management actions they may take following the series of events. These
include changes to their reinsurance programmes, changes to their planned premium income or rating
structures, and re-capitalisation plans. The cost of these actions, to the extent appropriate, should be
allowed for in the estimation of the Own Funds as at the year-end 2019, with adequate descriptions in
the free form box.
For this scenario we invite firms to list the following information relating to loss adjusters which PRA
aims to gather to inform operational stresses to the industry:
the number of claims split between commercial and retail with an estimation of what
percentage of each would have external adjusting applied;
22 top three adjusters (by volume of claims adjusted rather than size of claim) and the
percentage of total claims they would settle under commercial and retail;
an estimation of the maximum period by which time 80% of all claims (both outsourced and
handled in-house) are expected to be assessed.
5.2.1 First event: UK windstorm and storm surge
A severe extra tropical cyclone is assumed to cross North of Scotland, causing strong onshore winds
throughout Scotland and Northern England. The strongest winds associated with this event, located
offshore, act to drive water south into the North Sea causing a severe storm surge along the East
coast of England between the Humber and Thames estuaries. This event causes a gross loss of
around £10 billion, of which £9 billion is caused by storm surge. For purposes of this stress tests,
losses outside the UK are assumed to generate negligible losses for this event.
The maps below illustrate footprints for the closest matching RMS events. Refer to Annex I for figures
from other model provider(s).
UK Windstorm (left) and Storm Surge (right) footprints, as modelled by RMS. Refer to Annex I for figures from
other model provider(s).
The RMS Event ID is 3178575 (Version 18) causing approximately £10 billion of industry losses at of
which £9 billion is attributed from coastal flooding. The closest matching event IDs from AIR is
410106373 (for Extra Tropical Cyclone, version 20 onwards) generating some £1 billion of industry
losses in the UK and Event ID 910046257 (for Coastal Flood, version 20) generating some £9 billion
of industry losses. The PRA is aware that event footprints, associated parameters and industry loss
estimates vary between vendor models.
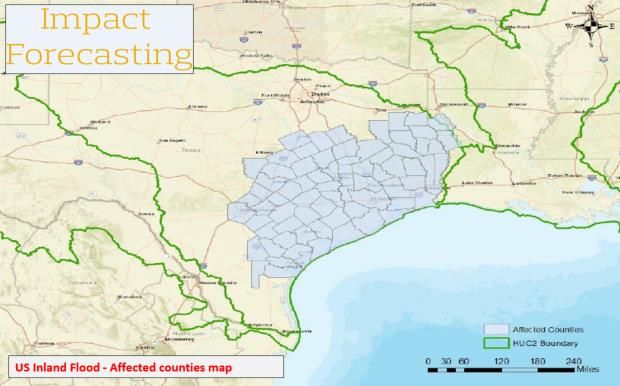
5.2.2 Second event: UK inland flood (England & Wales)
For the second event, firms are to assume extensive pluvial and fluvial flooding across England &
Wales from a sequence of rainfall events throughout the season. This event causes a gross loss of in
the order of £10-12 billion, with the event lasting more than 140 hours across England & Wales. The
map below illustrates the area impacted by flooding for one model vendor. Refer to Annex I for figures
from other model provider(s).
23You can also read