242 HOMERUN: Relative Homogenisation of the Irish Precipitation Network - Authors: John Coll, Mary Curley, Séamus Walsh and John Sweeney ...
←
→
Page content transcription
If your browser does not render page correctly, please read the page content below
Report No. 242

           HOMERUN: Relative Homogenisation
             of the Irish Precipitation Network
Authors: John Coll, Mary Curley, Séamus Walsh and John Sweeney

                                            www.epa.ie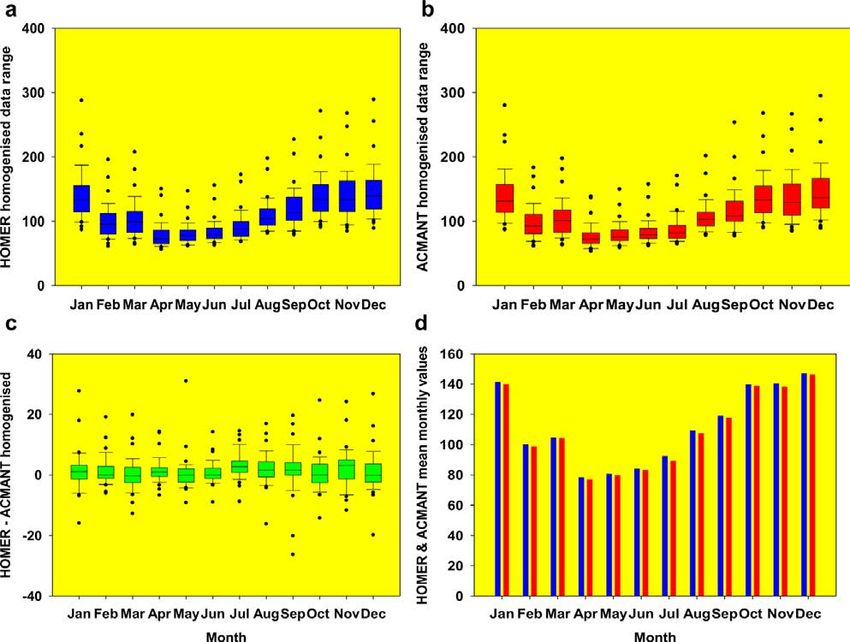
ENVIRONMENTAL PROTECTION AGENCY                                     Monitoring, Analysing and Reporting on the
The Environmental Protection Agency (EPA) is responsible for        Environment
protecting and improving the environment as a valuable asset        • Monitoring air quality and implementing the EU Clean Air for
for the people of Ireland. We are committed to protecting people      Europe (CAFÉ) Directive.
and the environment from the harmful effects of radiation and
                                                                    • Independent reporting to inform decision making by national
pollution.
                                                                      and local government (e.g. periodic reporting on the State of
                                                                      Ireland’s Environment and Indicator Reports).
The work of the EPA can be
divided into three main areas:                                      Regulating Ireland’s Greenhouse Gas Emissions
                                                                    • Preparing Ireland’s greenhouse gas inventories and projections.
Regulation: We implement effective regulation and environmental     • Implementing the Emissions Trading Directive, for over 100 of
compliance systems to deliver good environmental outcomes and         the largest producers of carbon dioxide in Ireland.
target those who don’t comply.

Knowledge: We provide high quality, targeted and timely             Environmental Research and Development
environmental data, information and assessment to inform            • Funding environmental research to identify pressures, inform
decision making at all levels.                                        policy and provide solutions in the areas of climate, water and
                                                                      sustainability.
Advocacy: We work with others to advocate for a clean,
productive and well protected environment and for sustainable       Strategic Environmental Assessment
environmental behaviour.                                            • Assessing the impact of proposed plans and programmes on the
                                                                      Irish environment (e.g. major development plans).
Our Responsibilities
                                                                    Radiological Protection
Licensing                                                           • Monitoring radiation levels, assessing exposure of people in
We regulate the following activities so that they do not endanger     Ireland to ionising radiation.
human health or harm the environment:                               • Assisting in developing national plans for emergencies arising
• waste facilities (e.g. landfills, incinerators, waste transfer      from nuclear accidents.
  stations);                                                        • Monitoring developments abroad relating to nuclear
• large scale industrial activities (e.g. pharmaceutical, cement      installations and radiological safety.
  manufacturing, power plants);                                     • Providing, or overseeing the provision of, specialist radiation
• intensive agriculture (e.g. pigs, poultry);                         protection services.
• the contained use and controlled release of Genetically
  Modified Organisms (GMOs);                                        Guidance, Accessible Information and Education
• sources of ionising radiation (e.g. x-ray and radiotherapy        • Providing advice and guidance to industry and the public on
  equipment, industrial sources);                                     environmental and radiological protection topics.
• large petrol storage facilities;                                  • Providing timely and easily accessible environmental
• waste water discharges;                                             information to encourage public participation in environmental
• dumping at sea activities.                                          decision-making (e.g. My Local Environment, Radon Maps).
                                                                    • Advising Government on matters relating to radiological safety
National Environmental Enforcement                                    and emergency response.
• Conducting an annual programme of audits and inspections of       • Developing a National Hazardous Waste Management Plan to
  EPA licensed facilities.                                            prevent and manage hazardous waste.
• Overseeing local authorities’ environmental protection
  responsibilities.                                                 Awareness Raising and Behavioural Change
• Supervising the supply of drinking water by public water          • Generating greater environmental awareness and influencing
  suppliers.                                                          positive behavioural change by supporting businesses,
• Working with local authorities and other agencies to tackle         communities and householders to become more resource
  environmental crime by co-ordinating a national enforcement         efficient.
  network, targeting offenders and overseeing remediation.          • Promoting radon testing in homes and workplaces and
• Enforcing Regulations such as Waste Electrical and Electronic       encouraging remediation where necessary.
  Equipment (WEEE), Restriction of Hazardous Substances
  (RoHS) and substances that deplete the ozone layer.               Management and structure of the EPA
• Prosecuting those who flout environmental law and damage the      The EPA is managed by a full time Board, consisting of a Director
  environment.                                                      General and five Directors. The work is carried out across five
                                                                    Offices:
                                                                    • Office of Environmental Sustainability
Water Management
• Monitoring and reporting on the quality of rivers, lakes,         • Office of Environmental Enforcement
  transitional and coastal waters of Ireland and groundwaters;      • Office of Evidence and Assessment
  measuring water levels and river flows.                           • Office of Radiation Protection and Environmental Monitoring
• National coordination and oversight of the Water Framework        • Office of Communications and Corporate Services
  Directive.                                                        The EPA is assisted by an Advisory Committee of twelve members
• Monitoring and reporting on Bathing Water Quality.                who meet regularly to discuss issues of concern and provide
                                                                    advice to the Board.
EPA RESEARCH PROGRAMME 2014–2020

HOMERUN: Relative Homogenisation of the Irish
         Precipitation Network

                    (2012-CCRP-FS.11)

                  EPA Research Report

            Prepared for the Environmental Protection Agency

                                   by

                Irish Climate Analysis and Research Units

                                Authors:

        John Coll, Mary Curley, Séamus Walsh and John Sweeney

            ENVIRONMENTAL PROTECTION AGENCY
             An Ghníomhaireacht um Chaomhnú Comhshaoil
           PO Box 3000, Johnstown Castle, Co. Wexford, Ireland

           Telephone: +353 53 916 0600 Fax: +353 53 916 0699
                 Email: info@epa.ie Website: www.epa.ie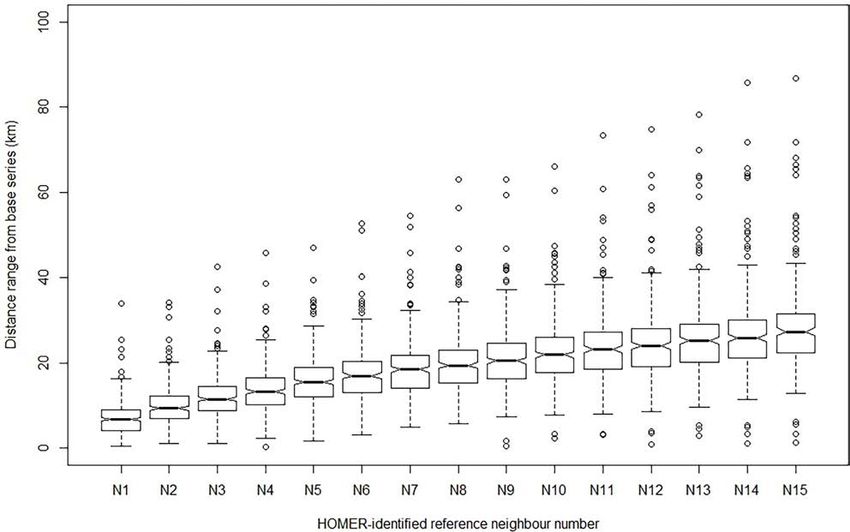
© Environmental Protection Agency 2018

                                 ACKNOWLEDGEMENTS
This report is published as part of the EPA Research Programme 2014–2020. The programme is
financed by the Irish Government. It is administered on behalf of the Department of Communications,
Climate Action and the Environment by the EPA, which has the statutory function of co-ordinating
and promoting environmental research.

The authors acknowledge funding provided by the EPA. In particular, we would like to thank Phillip
O’Brien, Margaret Desmond and Frank McGovern for their input and support over the life of the
project.

We thank Met Éireann for the provision of digitised data and Dan Hollis at the UK Meteorological
Office for providing the Northern Ireland records. We also thank Michael McDonnell at Met Éireann
for metadata collation and provision support. Particular thanks are due to Peter Domonkos and
Enric Aguilar at the Centre for Climate Change (C3), Universitat Rovira i Virgili for their ongoing
collaborative support in the application of ACMANT and HOMER to the range of network
combinations evaluated to date. We also very much thank the anonymous reviewer for their valuable
and constructive comments, which have helped to improve the content here.

                                        DISCLAIMER
Although every effort has been made to ensure the accuracy of the material contained in this
publication, complete accuracy cannot be guaranteed. The Environmental Protection Agency, the
authors and the steering committee members do not accept any responsibility whatsoever for loss
or damage occasioned, or claimed to have been occasioned, in part or in full, as a consequence of
any person acting, or refraining from acting, as a result of a matter contained in this publication.
All or part of this publication may be reproduced without further permission, provided the source is
acknowledged.

The EPA Research Programme addresses the need for research in Ireland to inform policymakers
and other stakeholders on a range of questions in relation to environmental protection. These reports
are intended as contributions to the necessary debate on the protection of the environment.

                         EPA RESEARCH PROGRAMME 2014–2020
                    Published by the Environmental Protection Agency, Ireland

ISBN: 978-1-84095-764-8                                                                March 2018

Price: Free                                                                         Online version

                                                 ii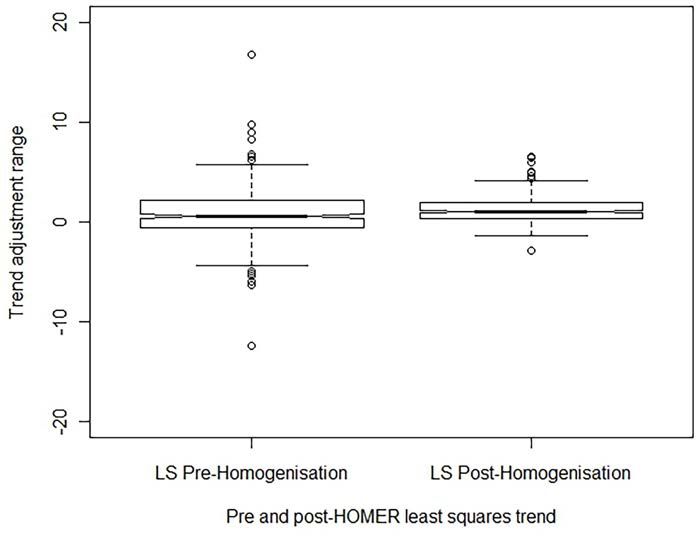
Project Partners

Dr John Coll                                      Séamus Walsh
Irish Climate Analysis and Research Units         Climatology and Observations Division
Department of Geography                           Met Éireann
Maynooth University                               Dublin
Ireland                                           Ireland
Tel.: +353 1 708 6550                             Tel.: +353 1 806 4200
Email: john.coll@mu.ie                            Email: seamus.walsh@met.ie

Mary Curley                                       Emeritus Professor John Sweeney
Climatology and Observations Division             Irish Climate Analysis and Research Units
Met Éireann                                       Department of Geography
Dublin                                            Maynooth University
Ireland                                           Ireland
Tel.: +353 1 806 4200                             Tel.: +353 1 708 6835
Email: mary.curley@met.ie                         Email: john.sweeney@mu.ie

                                            iii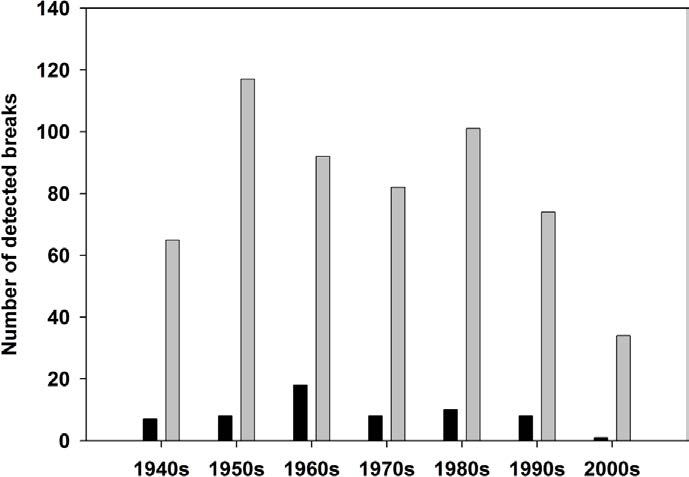
Contents

Acknowledgementsii
Disclaimerii
Project Partners                                           iii
List of Figures and Tables                                 vi
Executive Summary                                          vii
1      Introduction                                         1
2      Methodology                                          3
       2.1    Study Area                                    3
       2.2    Dataset and Quality Control                   3
       2.3    Data Homogenisation Process                   3
              2.3.1 Homogenisation with HOMER               5
              2.3.2 Homogenisation with ACMANT              5
3      Results and Discussion                               7
       3.1    Homogenisation with HOMER                     7
       3.2    Homogenisation with ACMANT                   10
       3.3    Homogenisation Results                       10
              3.3.1 ACMANT–HOMER results comparison        10
              3.3.2 HOMER IENet characteristics            12
       3.4    Adjusted Trends for HOMER-corrected Series   12
4      Conclusions                                         17
5      Future Prospects                                    19
       5.1    Capacity Building and Publications           19
       5.2    Homogenisation of Daily Data                 19
References20
Abbreviations23
Appendix 1                                                 24

                                               v
List of Figures and Tables
Figures
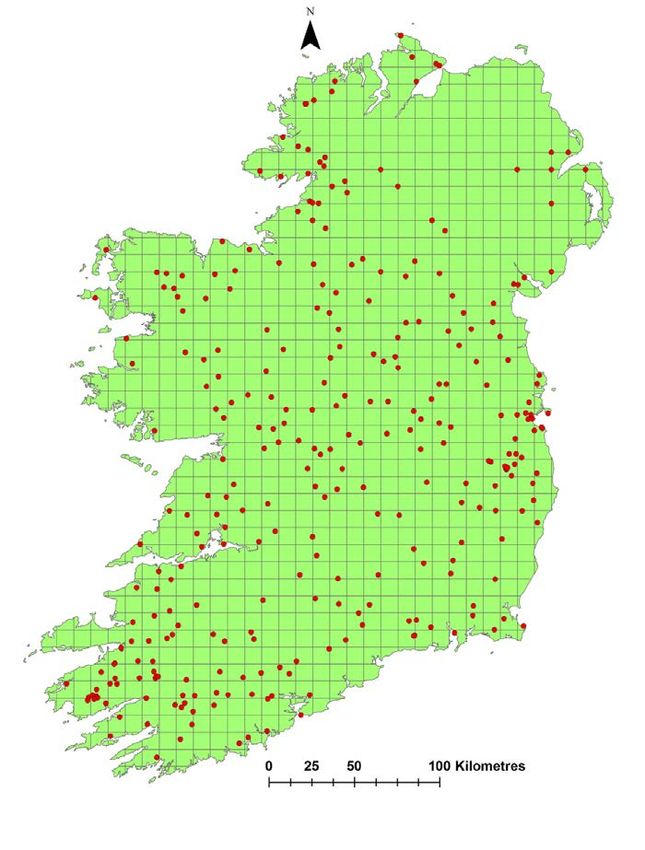
Figure 2.1. Annotated map of the island of Ireland showing the selected Met Éireann
and UKMO monthly station locations for the network of 299 stations (IENet) 4
Figure 2.2. Tasks flow chart of HOMER applied for the precipitation series of IENet 6
Figure 3.1. Waisted boxplots summarising the HOMER-derived geographical distance
range for the base series and the corresponding 15 reference series 7
Figure 3.2. Histogram break detection count summary by HOMER and ACMANT for
the 1941–2010 IENet precipitation series by decade 8
Figure 3.3. Boxplot summaries and a histogram comparison of HOMER and ACMANT
mean monthly values for the NW network 11
Figure 3.4. Waisted boxplots summarising the pre- and post-HOMER LS-adjusted
trends for IENet 14
Figure 3.5. 1941–2010 exemplar monthly and smoother filtered plots for monthly
precipitation. (a) Kilnaleck Garda Station raw data series; (b) Kilnaleck
Garda Station HOMER-corrected data series 15
Figure 3.6. 1941–2010 exemplar monthly and smoother filtered plots for monthly
precipitation. (a) Tralee Clash raw data series; (b) Tralee Clash HOMER-
corrected data series 15
Figure A1.1. HOMER-derived summary of the overall intact and absent monthly data for
the 299 series in the 1941–2010 IENet analysis 31
Tables
Table 3.1. Collated list of HOMER-identified breaks for 44 stations and metadata
explanations where available, or otherwise indicated as none available 9
Table 3.2. Summary statistics for the HOMER-derived sub-networks based on
geographical distance selection for the 299 IENet series 12
Table 3.3. Summary trend adjustment statistics for the HOMER-corrected series 13
Table A1.1. The list of Met Éireann station identifiers with corresponding geographical
data and percentage of entire months missing values, 1941–2010 24
Table A1.2. The list of UKMO NI station identifiers with corresponding geographical
data and percentage of entire months missing values, 1941–2010 30
viExecutive Summary
The Project in Context (Irish Network or IENet) using state-of-the-art relative
homogenisation methods. The HOMER and ACMANT
Long instrumental records are rarely, if ever,
(Adapted Caussinus–Mestre Algorithm) programs
homogeneous and most decade-to-century-scale
are applied to a network of station series where
time series of atmospheric data have been affected
contiguous intact monthly records range from ~31 to
by changes caused by climatic and/or non-climatic
~70 years (1941–2010). HOMER detected 58 breaks
factors. Nevertheless, accurate climate data are a
in total in the country-wide series analysis distributed
prerequisite for basing climate-related decision-making
across 43 stations (~14%) of the 70-year series
on, and quality-controlled homogenised climate data
records analysed. By comparison, ACMANT detected
are becoming integral to efforts across many countries
a considerably higher number of breaks across the
to deliver climate services. The aim of homogenisation
network, 382 distributed across 164 (~55%) of the
techniques (i.e. procedures combining detection and
records analysed. These do not count breaks with an
correction) is the removal or reduction of any spurious
amplitude of less than approximately ±5% for both
non-climatic signal introducing inhomogeneities to
HOMER and ACMANT, as these were considered to
the time series being investigated. Climate change
be within the margins of error for the detection limits of
research has also further spurred research and
the methods.
operational work on the homogeneity of climate data
based on an increased requirement for good-quality The results with HOMER indicate a relatively low
climate data for climate model evaluation. proportion of series with detected breaks (~14%),
a situation generally reflected in observed later
Homogeneity tests can be broadly divided into
20th-century precipitation records across Europe.
“absolute” and “relative” methods. The former are
However, the geographical distances between base
applied to individual candidate stations to identify
and reference series for the HOMER-identified
statistically significant shifts in the section means
sub-networks are low (mean ~19 km) and the spatial
(referred to as breaks or change points), while
correlations obtained between series by ACMANT
relative methods entail comparison of correlated
for the series are high (mean > approximately
neighbouring stations with a candidate station to
0.8 km). Consequently, both HOMER and ACMANT
test for homogeneity. Relative homogenisation is
are detecting breaks of relatively small magnitude;
more robust than absolute methods, provided station
therefore, the relatively high detection frequencies
records are sufficiently correlated, and, as with
may be only an artefact of the network density and the
homogeneity techniques more generally, benefits from
climatic characteristics of the region.
reliable metadata and station histories to account for
breaks and potential outliers. Ireland and Northern
Key results
Ireland have a good repository of monthly precipitation
data, although record lengths vary and the extent of Based on the considerable number of network
the contiguous intact section of the record tends to experiments leading to the version of IENet reported
influence the station data selected for the application on here and on the evaluation of the two relative
of HOMER (Homogenisation Software in R) in homogenisation methods applied to monthly
particular. precipitation data, the following are some of the key
results:
Results Summary
●● HOMER has a lower tolerance of missing values
Relative homogenisation of the extended network than ACMANT.
●● ACMANT is better suited to the automation and
A homogenisation analysis is provided for 299 of the
rapid processing of larger networks, but it offers
available precipitation records for the island of Ireland
viiHOMERUN: Relative Homogenisation of the Irish Precipitation Network
no scope for metadata integration or for graphical homogenised long series on which to base climate
interpretation by the user. change adaptation decisions. HOMER’s worth in
●● By comparison, HOMER offers metadata this regard has already been proven by helping
integration and excellent graphical support for to provide a valuable 1850–2010 reference
the user, but it is better suited to small to medium precipitation series for the island of Ireland.
networks and interactive use in the current state of
3. Overall, and based on a first comprehensive
development.
application to observed precipitation data, there
●● Break detection and assignation for precipitation
is considerable scope to refine and develop both
series in ACMANT appears to be more sensitive
methods for application to monthly precipitation
to seasonal wet/dry month sequences than in
data. For example, ACMANT’s apparent
HOMER.
sensitivity to seasonal wet/dry month sequences
in the present state of development could be
Specific Recommendations
further explored. Similarly, HOMER’s sensitivity
If the ultimate goal of homogeneity research is to sequences of missing data values may be
considered to be establishing data products that can improved with ongoing testing and development.
be regularly updated and used operationally, part
4. A consequence of this, e.g. in the current
of the process of improving these products involves
state of HOMER’s development, is that the
comparing different homogeneity methods and
user has to proceed with caution in relation to
evaluating their advantages and disadvantages. Based
missing values for the evaluation of networks
on the results of this project, the recommendations
based on considerable insights into the data.
provided here will help advance this goal for Ireland
Resolving HOMER’s lower tolerance of missing
while maintaining and extending the capacity
data than ACMANT is realistically likely to be
developed:
a development and code refinement issue for
1. The modern relative homogenisation programs the wider homogenisation community. However,
applied to Irish precipitation data in this work have Bayesian refinements to the detection algorithm
had limited application to observed precipitation component of HOMER currently under way
data and few or no results applying the methods at Météo-France (O. Mestre, Météo-France,
to precipitation data have been published to September 2016, personal communication) offer
date. Features of Ireland’s maritime climate the prospect that a revised version of HOMER
and the relatively dense network of high-value could be usefully piloted and tested on some of
quality-controlled data available lend themselves our Irish networks. This also offers the prospect
to the ongoing test development of relative that, by working with HOMER’s main developers,
homogenisation programs such as HOMER and a more operationally useful version of HOMER
ACMANT. It is therefore suggested that the work could be developed.
applying relative homogenisation methods to the
5. The performance of HOMER, and to a lesser
excellent test resource that Irish data provide
extent of ACMANT, depends on the parameter
should continue. This offers the win–win prospect
settings and the nature of the inhomogeneities,
of method development gains for the wider
but, as things stand, both methods still require
homogenisation community and a spin-off for
the judgement and insight of experienced
Ireland via the provision of high-quality datasets
practitioners. Therefore, tackling these current
for improved climate-based decision-making and
aspects of both methods by increasing automation
climate model evaluation.
but retaining accuracy would further help the goal
2. Such ongoing work should proceed synchronously of homogenisation research more generally by
with expanded data rescue activities to provide providing improved products that could be more
the community and decision-makers with more easily used operationally.
viii1 Introduction
Climate change studies based only on raw long- neighbouring stations with a candidate station to
term data are potentially flawed as a result of the test for homogeneity. Thus, relative homogenisation
many breaks introduced from non-climatic sources; algorithms use the difference time series of a
consequently, quality-controlled and homogenised candidate station with neighbouring stations to identify
climate data are desirable for basing climate-related such breaks. Reference series, which have ideally
decision-making on. Fundamentally, the quality of long- experienced all of the broad climatic influences of
term climate analysis depends on the homogeneity of the candidate but no artificial biases, are commonly
the underlying time series (Vertačnik et al., 2015). This used to detect inhomogeneity in relative methods
also reflects a growing demand for climate information (WMO, 2011) as well as to assess the quality
or climate services more generally (e.g. Buontempoa of the homogenisation process (Kuglitsch et al.,
et al., 2014; Vaughan and Dessai, 2014), sometimes 2009). Reference series themselves do not need
expressed as “actionable knowledge” (Asrar et al., to be homogeneous (Szentimrey, 1999; Zhang et
2013; Kirchoff et al., 2013), for use across a range al., 2001; Caussinus and Mestre, 2004), but they
of decision-making environments. Seasonal cycles must encompass the same climatic signal as the
of precipitation in Ireland are projected to become candidate (Della-Marta and Wanner, 2006). Relative
more marked as the climate changes (e.g. Nolan homogenisation is more robust than absolute
et al., 2013), and regional extremes in summer dry methods, provided station records are sufficiently
spells and winter precipitation have been recorded correlated (Venema et al., 2012). However, relative
in recent years. Therefore, to analyse and monitor approaches can be confounded by a lack of long
the evolution of precipitation patterns across Ireland, records at neighbouring stations for comparison and
quality-controlled and homogeneous climate series are by simultaneous changes in measuring techniques
needed. across a network (Peterson et al., 1998; Wijngaard et
al., 2003). Relative homogenisation algorithms use
A homogeneous climate time series is defined as
the difference time series of a candidate station with
one in which variability is caused only by changes in
neighbouring stations to identify breaks.
weather or climate (Freitas et al., 2013). Most decade-
to century-scale time series of atmospheric data have Homogeneity approaches benefit from reliable
been adversely impacted by inhomogeneity caused by, metadata and station histories to account for
for example, changes in instrumentation or observer breaks and potential outliers. Metadata can provide
practices or station moves or changes in the local information such as location of station instruments,
environment (e.g. urbanisation). Some of these factors when and how observations were recorded,
can cause abrupt shifts, while others cause gradual notes on instrument changes and malfunctions or
changes over time; these can hamper identification any environmental changes (such as vegetation
of genuine climatic variations or lead to erroneous encroachment at the site; Aguilar et al., 2003). This
interpretations (Peterson et al., 1998). Since these information is often useful in interpreting statistical
shifts are often of the same magnitude as the climate homogeneity tests and for informing the nature and
signal (Auer et al., 2007; Menne et al., 2009), a direct magnitude of adjustments that might be applied to
analysis of the original data series can lead to incorrect data.
conclusions about the evolution of climate.
New techniques are emerging for the detection and
Homogeneity tests can be broadly divided into adjustment of inhomogeneity in climate series (Cao
“absolute” and “relative” methods. The former and Yan, 2012; Toreti et al., 2012; Freitas et al., 2013;
are applied to individual candidate stations to Mestre et al., 2013) and the correction of multiple
identify statistically significant shifts in the section change points using reference series (Peterson et
means (referred to as breaks or change points), al., 1998; Menne and Williams, 2005; Toreti et al.,
while the latter entail comparison of correlated 2012). Modern multiple breakpoint methods search
1HOMERUN: Relative Homogenisation of the Irish Precipitation Network
for the optimum segmentation characterised by (HOME, 2013; Mestre et al., 2013); and (2) ACMANT
minimum internal variance within the segments and (Adapted Caussinus–Mestre Algorithm), which is
maximum external variance between the segment fully automatic and homogenises temperature and
means (Caussinus and Mestre, 2004; Lindau and precipitation data on either a monthly or a daily scale
Venema, 2015). A comprehensive assessment of (Domonkos, 2011a, 2015a; Domonkos and Coll,
homogenisation techniques for climate series was 2016). The high performance of HOMER and ACMANT
included in the scientific programme of the COST is based on their mathematical background. Note that
Action HOME ES 0601 (Advances in Homogenisation HOME found three more statistical methods that are
Methods of Climate Series: An Integrated Approach). also effective (MASH, Szentimrey, 1999; USHCN,
The HOME objective was to test the existing Menne et al., 2009; and the Craddock test, Craddock,
statistical homogenisation techniques and develop 1979) and recommended their use alongside HOMER
a standardised method for homogenising climate and ACMANT (Venema et al., 2012).
datasets. This led to the release of two modern,
In this study we will use both HOMER and ACMANT
multiple breakpoint homogenisation packages:
to make comparisons between the homogenisation
(1) HOMER (Homogenisation Software in R), for
results for a medium-sized station network. As far as
the homogenisation of monthly temperature and
we are aware, this is a first such application of both
precipitation, and which can consider metadata
methods to a sizeable network of precipitation stations.
22 Methodology
2.1 Study Area data from nearby stations (WMO, 2011). Recent
work on establishing new 1981–2010 long-term
The study area is the whole island of Ireland, which
averages for Ireland involved the implementation of
covers ~84,421 km2 on the Atlantic margin of north-
comprehensive quality control procedures on all Met
west Europe, between ~51° and 56° N. Elevations
Éireann’s digital temperature and rainfall data (Walsh,
reach up to 1038 m above sea level (a.s.l.) (Corrán
2013). The extension of this work involved backfilling
Tuathail, Co. Kerry). Much of the island is lowland,
the available precipitation records to 1941 using three
partly surrounded by mountains, with a characteristic
methodologies: weighted ratios of nearby stations,
temperate oceanic climate. On average, annual
weighted spatial regression and spatial interpolation
precipitation ranges from 750 to 1000 mm in the drier
of monthly data from nearby stations (Walsh, 2012).
eastern half of the country and > 3000 mm yr−1 in parts
However, in the homogenisation here, we use only
of the western mountains (Rohan, 1986).
the raw datasets with missing values retained, since
both programs have inbuilt functionality to cope with
2.2 Dataset and Quality Control missing values.
Associated with Ireland’s maritime location and the The UK Meteorological Office (UKMO) also supplied
prevailing wind direction, the bulk of precipitation all available monthly precipitation data records data
receipts come primarily from the Atlantic south-west for Northern Ireland (NI) for the period 1941–2010.
quadrant and to a lesser extent from the north-west For the analysis here we latterly included 12 NI station
quadrant, whereas cold and dry weather comes from series selected on the basis that they had the lowest
the east and continental Europe. Rainfall has been number of missing values and somewhat improved the
measured in Ireland since the early 19th century, spatial coherence of the Irish Network (IENet). In total,
with a peak of over 800 rainfall stations in the late UKMO supplied 207 monthly series for NI but, based
1950s, and currently rainfall is recorded at synoptic on experience with previous networks and HOMER’s
and climatological weather stations. In addition, there low tolerance of missing values, and following an audit,
is a wide network of voluntary rainfall observers other candidate series were excluded to avoid any
(Walsh, 2012). The selected stations for this work are complications. Despite these exclusions, with a mean
distributed across the country (Figure 2.1). Based on density of ~0.03 stations per km2, the IENet coverage
an audit and set of quality control procedures, the is considerably more dense than that of HOMER
contiguous intact monthly records for this group of 299 network experiments so far reported elsewhere
stations ranged from ~31 to 70 years for the period (Vertačnik et al., 2015; Gubler et al., 2017).
1941–2010. Station elevations were within the range
of 5–701 m a.s.l., with a mean elevation of ~110 m.
2.3 Data Homogenisation Process
Following initial quality control on the data, an
Both HOMER and ACMANT include the optimal step
exploratory statistical analysis of the data was also
function fitting (optimal segmentation; Caussinus
undertaken to characterise the properties of the series
and Mestre, 2004) with dynamic programming
as well as to identify missing values and outliers.
(Hawkins, 1972, 2001) for break detection and the
Figure A1.1 provides a HOMER-derived summary of
network-wide minimisation of residual variance for
the extent of the intact months and missing records
correcting inhomogeneities [analysis of variance
across all the stations in the network and illustrates
(ANOVA); Caussinus and Mestre, 2004; Mamara et
that most missing data are associated with the pre-
al., 2014; Domonkos, 2015a]. These techniques are
1950s and post mid-1980s. Issues with missing data
known to be the most effective statistical tools in the
in climate time series can be tackled with temporal
homogenisation of climatic time series with multiple
interpolation using data from the same series before
breaks (Domonkos, 2011b, 2013; Caussinus and
and after the gap, or with spatial interpolation using
3HOMERUN: Relative Homogenisation of the Irish Precipitation Network
Figure 2.1. Annotated map of the island of Ireland showing the selected Met Éireann and UKMO
monthly station locations for the network of 299 stations (IENet). Precipitation stations that have been
homogenised by both HOMER and ACMANT are denoted by red circles. Station locations are overlain on
a regular 10 × 10 km grid to give an indication of density.
Mestre, 2004; Domonkos et al., 2011). Both HOMER composite reference series (Peterson and Easterling,
and ACMANT use some derivatives of the Caussinus– 1994; Alexandersson and Moberg, 1997) for the
Lyazrhi criterion (Caussinus and Lyazrhi, 1997) for time series comparison, HOMER applies pairwise
calculating the number of homogeneous segments. comparison (Menne et al., 2009; Dunne et al., 2014),
This criterion is based on information theory and the allowing detailed analysis of individual breaks and
penal term included in it impedes the inclusion of user intervention when it is beneficial. HOMER is
insignificant breaks. best suited for small to medium-sized networks, as
well as for homogenisation with the use of metadata,
In spite of the similarities, some important differences
while ACMANT is a more useful tool for the automatic
exist between HOMER and ACMANT. Perhaps the
homogenisation of large networks.
most important difference is that while ACMANT uses
4J. Coll et al. (2012-CCRP-FS.11)
2.3.1 Homogenisation with HOMER and for some series high numbers of default –999.9
entries may be creating spurious correlations in some
The HOMER package was a key deliverable of the
of the sub-networks identified by HOMER.
COST Action HOME and represents a synthesis of
homogenisation approaches (Mestre et al., 2013), We adopted a three-stage application of HOMER
including some homogenisation routines of PRODIGE to allow greater scrutiny of detected inhomogeneity
(Caussinus and Mestre, 2004), ACMANT (Domonkos, before corrections were applied. First, basic quality
2011a) and the network-wide joint segmentation control and a network analysis were performed.
method of Picard et al. (2011), as well as some Outliers were identified using both HOMER and
common quality control and visualisation routines of visual inspection by defining minimum and maximum
the CLIMATOL homogenisation method (Guijarro, monthly outliers as values exceeding ±1.96 standard
2011). HOMER is an interactive, semi-automatic deviations from the respective series mean. Outliers
method for homogenisation, whereby the user were checked against a number of the nearest
can take advantage of available metadata in the reference stations, as well as metadata, and any
detection and correction of time series (Vertačnik et likely cases were removed. Second, HOMER was run
al., 2015). We deploy HOMER to detect and correct to identify breaks within each time series. Detected
inhomogeneity in the 299 IENet monthly series and to breaks were not corrected automatically; all were
extend all records to a common period (1941–2010). checked for consistency with correlated reference
stations and by scrutiny of metadata. Third, following
In the pairwise comparison, reference series are
confirmation of breaks with available metadata,
treated as sections of the time series between two
HOMER was used to correct series for inhomogeneity
change points. Reference series are compared with
and missing values (Figure 2.2). Following the
all others from the same climate region to produce
recommendations of HOME (2013), we applied
series of differences between the candidate and
annual corrections in PRODIGE with multiplicative
others in a defined network. Difference series are
corrections applied using the amplitude of detected
then tested for change points (Mamara et al., 2014).
breaks. Hence, for an amplitude of say +0.15, data
Once detected breaks have been checked against
before the detected break were multiplied by 1.15
metadata, non-homogeneous series are corrected
(increase in mean of 15%). As a final step, HOMER is
using the ANOVA model.
used to infill missing data for all series back to 1941,
Creation of a reference network for a given candidate based on the corrected values of partner series in the
station is a key step in the homogenisation process. network.
The network can be defined based on geographical
proximity or station correlation. To ensure that
2.3.2 Homogenisation with ACMANT
candidate stations have sufficient reference stations
for each year of the series, it is necessary to set the The development of the ACMANT homogenisation
minimum number of reference stations (Vertačnik et method has been continued after HOME, and a full
al., 2015). Rather than use first difference (increment) description of version 2 of the software (ACMANT2)
correlation options for our wider IENet network of 299 and an application of precipitation homogenisation
stations, for the analysis reported here we chose to with ACMANT2 were recently published (Domonkos,
use the geographical distance selection in HOMER. 2014, 2015a). For the homogenisation of IENet, a
This selection of 15 neighbours for each base series new and refined version of ACMANT was developed
facilitated the homogenisation and extension of (ACMANT3); for more information, the interested
all series to a common period, 1941–2010, while reader is directed to Domonkos and Coll (2016).
avoiding a known limitation of the software to correct
ACMANT is a fully automatic homogenisation
when there are many blocks of missing contiguous
method, and an automatic control of monthly outlier
data distributed across candidate and/or reference
values is provided based on the spatial comparison
series (Coll et al., 2015a). In addition, and as far as
of simultaneous data. Infilling of missing data is a
we are aware, IENet is a novel application of HOMER
part of the ACMANT procedure, and the user may
to such a sizeable precipitation station network,
5HOMERUN: Relative Homogenisation of the Irish Precipitation Network
Figure 2.2. Tasks flow chart of HOMER applied for the precipitation series of IENet. Source: adapted from
Mestre et al. (2013).
choose whether the homogenised output with the the snow precipitation dominates in winter. However,
completed data or the output with the gaps in the as snow precipitation is rare in Ireland, no seasonal
raw data is required. A special feature of precipitation difference was applied for the homogenisation of our
homogenisation with ACMANT is that the year can Irish data (see also discussions about the seasonality
be split seasonally to account for differential receipts of precipitation inhomogeneities in Auer et al., 2005
of precipitation, such as snow and rain and where and Domonkos, 2015a).
63 Results and Discussion
3.1 Homogenisation with HOMER HOMER’s sensitivity to outliers. The series were then
re-processed in HOMER following the removal of
Intact record lengths across the IENet stations range
outliers.
between ~31 and 70 years and the station series have
variable amounts of missing monthly data (Tables A1.1 In total, 256 stations were found to be homogeneous,
and A1.2). Based on the network selection choices but 58 breaks were detected by HOMER across the
available, HOMER identified 15 reference stations other 43 stations (~14%) and multiple breaks were
within the network for each candidate station for found in 12 records (~4%). Metadata scrutiny, where
pairwise comparison and joint detection of possible available, revealed that 24 of the detected breaks
breaks. Figure 3.1 provides a summary of the HOMER coincided with issues such as changes in gauge
sub-networks and shows the overall range of the size and position, station closures and moves. There
geographical distance between each base series is some consistency in timing of break detection
and its neighbours for all of the IENet station series. throughout the network, with most breaks (18)
HOMER was first run on all series with known outliers occurring in the 1960s (Figure 3.2). However, the
included, and the results were then scrutinised. It was number of break detections in the 1950s and 1990s
recognised that this is not good practice, as it can lead (eight in each decade) is perhaps more surprising,
to spurious breaks. However, as a test application to given the lower quantity of data available for these
a dense precipitation network, we wished to explore decades in the network analysis (Figure A1.1),
Figure 3.1. Waisted boxplots summarising the HOMER-derived geographical distance range for the
base series and the corresponding 15 reference series. The plots describe a summary for all 299 IENet
stations and 4485 reference series for each of the HOMER-identified sub-networks. Boxes, interquartile
range; whiskers, 5th and 95th percentiles; black circles, outlying data points.
7HOMERUN: Relative Homogenisation of the Irish Precipitation Network
Figure 3.2. Histogram break detection count summary by HOMER and ACMANT for the 1941–2010 IENet
precipitation series by decade. Black bars denote HOMER break detection counts; grey bars denote
ACMANT break detection counts.
with metadata support available for some of the amplitude applied equally across monthly series.
breaks (Table 3.1). However, overall break detection This decision was made because the COST Action
frequencies are consistent with other studies in Europe HOME found the application of yearly corrections by
(e.g. Domonkos, 2015a and references therein). To PRODIGE to be more stable and accurate, and hence
provide some cross-validation support for the HOMER these are currently recommended for homogenisation
detections, ACMANT detections by year, month and of precipitation networks (HOME, 2013). In a maritime
amplitude are also provided in Table 3.1 where these climate such as Ireland’s, variability of precipitation
occur within ~3 years of the HOMER-detected breaks. from month to month is low enough to allow such
In many cases, these are closely coincident in time, correction; in addition, Auer et al. (2005) and Moisselin
and, with the exceptions of Glenamaddy Gortnagier and Canellas (2005) recommend that the same annual
and Carrigadrohid General Station, the sign and adjustment factor be applied to all months.
magnitude of the corrections are also similar.
Previous work applying HOMER in Ireland reveals
The range of magnitude for the breaks detected by that geographical or correlation distance selections in
HOMER varied. Magnitude provides an indication of HOMER yield overlapping neighbour series, which are
the size of the breaks detected, as well as the amount largely statistically and spatially coherent (Coll et al.,
of adjustment needed to correct the inhomogeneity. 2014). Such relationships should largely be expected
Across all stations and detected breaks the amplitude in a maritime context; when compared with a more
ranges from –0.64 to +0.59. The largest break continental setting, the range of variation in overall
associated with a positive adjustment (amplitude precipitation receipts between stations is lower (Coll et
0.59) was found for Glenvickee (Caragh River Area) in al., 2015a).
1963 and has no metadata support. The largest break
However, compared with previous work, here
associated with a negative adjustment (amplitude
we work on a larger and denser network overall,
–0.67) was found in 1967 also for Glenvickee (Caragh
and there is a higher proportion of missing values
River Area), but with metadata support (faulty gauge
throughout the data in IENet (Table A1.1). A potentially
report; Table 3.1).
important finding in the current analysis, at least for
Detected breaks were corrected annually with such a dataset and in our climatic context, is that a
multiplicative adjustments relative to the break geographical distance selection of neighbours when
8J. Coll et al. (2012-CCRP-FS.11)
Table 3.1. Collated list of HOMER-identified breaks for 44 stations and metadata explanations where
available, or otherwise indicated as none available. ACMANT-identified breaks and amplitudes are
provided for the same or nearby years in brackets. Cases where no approximately corresponding
ACMANT detections were found are denoted (–) for year, month and amplitude
HOMER ID Break year Break Amplitude (%) Station name Metadata explanation
Code month
10040001 1954 (1956) 12 (9) –11.0 (–10.0) Roche’s Point Switch to new station, Dec 1955
10180001 1949 (1949) 12 (11) 9.0 (6.0) Lisacasey GS None available
10420001 2000 (2002) 12 (12) –10.0 (–5.0) Pettigo Lough Derg None available
10900001 1956 (1957) 9 (1) –20.0 (–23.0) Tralee Clash New observer, May 1956
11370001 1948 (–) 1 (–) 16.0 (–) Kilnaleck GS Station moved, Mar 1949
14140001 1966 (–) 12 (–) –43.0 (–) Bagenalstown Fenagh Hse None available
14310001 1962 (1963) 12 (1) –6.0 (–17.0) Mullagh GS Gauge replaced, Jan 1963
15140001 1946 (1948) 3(3) 13.0 (12.0) Edenderry The Tunnel Gauge levelled, Apr 1946
15290001 1965 (1966) 12 (12) –22.0 (–21) Drumsna Albert Lock None available
16050001 1963 (1963) 12 (9) 59.0 (49) Glenvickee Caragh River None available
Area
16100001 1995 (–) 12 (–) 34.0 (–) Brosna Mount Eagle None available
16120001 1962 (1964) 12 (9) 12.0 (10.0) Portlaw Mayfield None available
16190001 1946 (1947) 12 (8) –10.0 (–9.0) Birdhill Parteen Weir None available
17140001 1978 (1978) 12 (9) –7.0 (–3.0) Daingean GS None available
19290001 1958 (1959) 12 (5) –7.0 (–9.0) Athlone OPW None available
22230001 1966 (1966) 3 (4) –16.0 (–13.0) Dún Laoghaire Harbour Yard Defective gauge, Apr 1966
23220001 1980 (1982) 12 (9) 6.0 (4.0) Boora None available
25140001 1949 (1949) 12 (12) 19.0 (22.0) Lullymore Bord na Móna Gauge replaced, Jan 1950
26350001 1976 (1976) 6 (6) 6.0 (4.0) Derryhillagh Gauge dug up and re-levelled, Jul
1976
30140001 1980 (–) 12 (–) 26.0 (–) Stradbally GS None available
30230001 1967 (–) 12 (–) –8.0 (–) Howth Danesfort None available
30350001 1986 (–) 12 (–) –13.0 (–) Castlebar Burren None available
31270001 1967 (1967) 12 (12) –9.0 (6.0) Glenamaddy Gortnagier None available
31350001 1983 (1984) 9 (5) –15.0 (–7.0) Cloonacool Lough Easkey Inner parts of rain recorder replaced,
Oct 1983
32230001 1984 (1980) 12 (9) 12.0 (9.0) Glenbride Lodge New observer and gauge mistakenly
read weekly, Oct 1984
35130001 1972 (1973) 12 (7) 9.0 (6.0) Slieve Bloom Mountains None available
Nealstown
35190001 1982 (1984) 12 (6) –10.0 (–9.0) Cloughjordan GS None available
36040001 1990 (1991) 7 (11) –15.0 (8.0) Carrigadrohid Generating Rain recorder adjusted, Aug 1990
Station
50120001 1997 (1998) 12 (12) –9.0 (–13.0) Bansha Aherlow WW None available
54200001 1960 (1963) 12 (12) –6.0 (–15.0) Greencastle None available
61700001 1949 (1949) 12 (3) 10.0 (9.0) Miltown Malbay GS Broken rain measure, Jan 1950
62600001 1975 (1977) 8 (4) –17.0 (–11.0) Delphi Lodge New site, Sept 1975 (100 yard move)
82000001 1984 (–) 2 (–) 9.0 (–) Moneystown Gauge shaded by tree, Mar 1984
83400001 1943 (1943) 12 (12) –31.0 (–29.0) Keel GS Gauge leaking reported, Oct 1944
84400001 1970 (1970) 4 (10) 18.0 (22.0) Creeslough Brockagh Guard rail broken and too near
gauge, May 1970
89050001 1982 (1985) 8 (12) 19.0 (26.0) M Beenreagh Mountain New observer and new gauge, Sept
1982
92200001 1966 (1966) 12 (3) –17.0 (–21.0) M Duff Hill None available
94030001 1994 (1995) 12 (3) –22.0 (–32.0) M Cummeragh No. 4 None available
9HOMERUN: Relative Homogenisation of the Irish Precipitation Network
Table 3.1. Continued
HOMER ID Break year Break Amplitude (%) Station name Metadata explanation
Code month
95030001 1956 (1954) 5 (9) 13.0 (13.0) M Cummeragh No. 5 Broken rain measure, Jan 1957
95050001 1957 (1955) 12 (8) –10.0 (–16.0) M Torc Mangerton No. 4 None available
98040001 1987 (–) 7 (–) 6.0 (–) M Ballyvourney New observer, Nov 1987
Knockacommeen
99040001 1956 (1955) 5 (12) 8.0 (10.0) M Inchigeelagh Pipe Hill Gauge interfered with, Jun 1956
99380001 1969 (–) 12 (–) –7.0 (–) M Dundalk Ballymakellett None available
GS, Garda Station; M, Mountain; OPW, Office of Public Works; WW, Water Works.
applying HOMER may be more appropriate. While not 3.2 Homogenisation with ACMANT
reported here, previous network configurations and
ACMANT consistently detected more breaks than
the current version of IENet were also processed in
HOMER in all decades, with the biggest disparities
HOMER, using the first difference correlation option for
in break detection rates in the 1950s and 1980s
neighbour selection.
(Figure 3.2). In total, 135 stations were found to be
However, when using the correlation option for homogeneous, but 382 breaks were detected by
22 of the HOMER-selected sub-networks with the ACMANT across the other 164 stations (~55%) and
same station series configuration for a previous multiple breaks were found in 141 records (~47%).
version of IENet reported here (comprising 345
station series), post-processing analysis revealed
spurious correlations related to the distribution of
3.3 Homogenisation Results
–999.9 missing value default entries between some
3.3.1 ACMANT–HOMER results comparison
of the series. In turn, this suggests that HOMER
needs further testing and development on real-world Overall, ACMANT detected more multiple breaks in
precipitation data for medium to large networks with stations across the country than HOMER. A larger
data characteristics analogous to IENet. Alternatively, number of breaks detected with ACMANT than with
geographical distance should be the neighbour HOMER have also been reported in a comparative
selection of choice for climate series in such a study on the homogenisation of temperature data in
maritime context and where a relatively dense network the Spanish Pyrenees (Pérez-Zanón et al., 2015), so
is available; otherwise, the user needs to carefully it seems that this kind of difference is more because of
pre-screen prospective candidate series and their the homogenisation methods themselves rather than
constituent sub-network components to avoid this the data subjected to homogenisation. For instance,
issue arising. in recent work, homogenising precipitation data in
Norway, MASH was found to detect six times more
Based on a substantial number of previous network
breaks than HOMER (Lundstad et al., 2017). This also
experiments with considerably more station series,
could be expected, as MASH and ACMANT share a
but with many more missing values, an interesting
number of features in common, including components
feature of IENet, as reported here, is that our
for applying seasonal adjustments. It is, for example,
operational deployment independently approached
also possible that the seasonal adjustment component
the series selection criteria used by Météo-France.
of ACMANT is more sensitive to shifts in series values
In their homogenisation of shorter time series,
than when applying the HOME-recommended annual
Météo-France apply a 10% missing value tolerance,
corrections in HOMER for precipitation.
which is extended to 15% for longer series (B.
Dubuisson, Météo-France, September 2016, personal Certainly, when testing and refining ACMANT3
communication). With the obvious exception of (Domonkos and Coll, 2016) for application to IENet,
Farranfore (Scartaglin), most of the series in IENet fall it was noted that ACMANT tended to treat wet/dry
within, or are at least close to, the guideline tolerances summer and dry/snowy winter months in the Irish
applied at Météo-France (Table A1.1). records as outliers. It is also worth noting that we
10J. Coll et al. (2012-CCRP-FS.11)
cannot conclude anything about the accuracy of results across all 38 stations and a comparison
homogenisation from the number of breaks detected between them for HOMER and ACMANT.
by both programmes, as the latter does not provide
Figure 3.3 provides a comparison for a regional
any indication of the similarity between the true climate
sub-set of 38 stations based on a previous network
signal and that of the homogenised time series.
homogenisation exercise in which 198 series were
The full inter-comparison of the homogenised results split into four regional sub-sets of data for a period
via HOMER and ACMANT for IENet 299 is still centred on 1950–2010. This was to accommodate the
under way for inclusion in a future publication. In the limitations of ACMANT2 at that development stage,
interests of providing a valid inter-comparison of the where network n had to be fewer than 100 and the
homogenised results both methods provide, Figure 3.3 maximum number of years for processing in a series
provides a comparison for part of a previously was ~60. Nevertheless, the comparisons of the results
published network experiment where the results for are valid and demonstrate that the final homogenised
both HOMER and ACMANT were collated across a end products from both HOMER and ACMANT are
regional sub-network of 38 stations for north-west largely similar. This should not be surprising, as
(NW) Ireland (Coll et al., 2015a). The plots provide a both use some derivatives of the Caussinus–Lyazrhi
summary of the monthly range of the homogenised criterion (Caussinus and Lyazrhi, 1997) for calculating
Figure 3.3. (a) Boxplot summary of the range of HOMER-homogenised monthly values for the 38 series
in the NW network. (b) Boxplot summary of the range of ACMANT-homogenised monthly values for the
38 series in the NW network. (c) Boxplot summary of the range of difference for HOMER- and ACMANT-
homogenised monthly values for the NW network. Boxes, interquartile range; whiskers, 5th and 95th
percentiles; black circles, outlying data points. (d) Histogram comparison of HOMER-homogenised (blue
bars) and ACMANT-homogenised (red bars) mean monthly values for the NW network. All units are in mm.
11HOMERUN: Relative Homogenisation of the Irish Precipitation Network
the number of homogeneous segments, and ANOVA influences homogenised climate series should provide
is the underpinning correction method in both HOMER a better estimation of the true climate signal. As is
and ACMANT. The interested reader is also directed common with trend analysis elsewhere in climatology,
to Table 1 in Domonkos and Coll (2016) for a further some of the inbuilt functionality of HOMER estimates
comparison of similarities and differences between the the pre- and post-homogenisation trend based on the
methods. least squares (LS) method. This estimator is optimal if
the residuals follow a Gaussian distribution, which may
not always be the case (e.g. Trömel and Schönwiese,
3.3.2 HOMER IENet characteristics
2008).
In terms of the HOMER-computed IENet network
Thus, while a Gaussian assumption might be
characteristics, the geographical distance range for
feasible for precipitation accumulated to annual totals
all 299 of the IENet base series and their 15 closest
(e.g. Maraun et al., 2010), on shorter time scales
neighbours are summarised for all the series used
precipitation intensities become more skewed, and
in Figure 2.2. As HOMER processes the data, it is
daily precipitation is commonly modelled with a
clear that the distance (km) between the base and
gamma distribution (e.g. Katz, 1977). Therefore, it
neighbour series steadily increases from neighbours
may be the case that a generalised linear modelling
1 to 15 and that the range of distances between the
(GLM) framework may offer a more flexible extension
neighbours and their associated outliers also increase.
to linear regression by allowing the predictand to follow
As might be expected for a small country, the range
a wider range of distributions. As far as we are aware,
of geographical distances between the neighbours
none of the HOMER development literature or other
constituting the sub-networks within IENet are
published work applying the software has explored the
relatively small, and these are summarised in Table
underpinning assumptions of the LS method. Although
3.2.
beyond the scope of the work reported here, future
research on the application of HOMER to precipitation
3.4 Adjusted Trends for HOMER- could explore whether it would be feasible to modify
corrected Series the code to allow integration of GLM or generalised
additive modelling flexibility to vary the distribution
A key task of statistical climatology is the description
assumptions.
of climate variability, and by removing extraneous
Table 3.2. Summary statistics for the HOMER-derived sub-networks based on geographical distance
selection for the 299 IENet series. The neighbour number refers to the reference neighbour number
selected by HOMER
Neighbour number Mean distance (km) Median distance (km) Neighbour network range
(km)
1 6.91 6.74 0.40–33.88
2 9.63 9.25 0.92–34.13
3 11.82 11.39 1.04–42.47
4 13.62 13.23 0.19–45.72
5 15.41 15.43 1.68–46.87
6 16.99 16.93 2.95–52.63
7 18.38 18.43 4.91–54.39
8 19.78 19.32 5.59–63.08
9 21.07 20.44 0.44–63.08
10 22.30 21.86 2.25–66.05
11 23.54 23.07 2.97–73.39
12 24.62 23.92 0.85–74.79
13 25.78 25.11 2.90–78.15
14 26.79 25.82 0.92–85.74
15 27.93 27.31 1.19–86.75
12J. Coll et al. (2012-CCRP-FS.11)
This more theoretical consideration aside, the pre- and In this application within HOMER, the Mann–Kendal
post-HOMER LS trend estimates and their associated non-parametric test is used to estimate the existence,
two-sided Mann–Kendall test p-values are provided for magnitude and statistical significance of potential
the 44 IENet series adjusted by HOMER (Table 3.3). trends in the raw and corrected time series to assess
Depending on the correction amplitudes applied by the impacts of homogenisation. For IENet overall,
HOMER, it is clear that both the sign and magnitude of the HOMER homogenisation reduces the variability
the pre- and post-trend estimates and their associated of the LS-adjusted trends across all 299 stations
p-values can vary markedly. The Mann–Kendal test (Figure 3.4), and summaries of the pre- and post-
can be stated most generally as a test for whether homogenised LS trend estimates are provided for
the dependent variable values tend to increase or each of the HOMER-corrected series (Table 3.3).
decrease with time, i.e. indicate a monotonic change. However, this reduction in variability should be an
Table 3.3. Summary trend adjustment statistics for the HOMER-corrected series. Raw and HOMER-
corrected LS trend estimates and the associated two-sided Kendall p-values are provided for the 44
series
Met Station name Raw LS trend Raw Kendall p-value Corrected LS trend Corrected
Éireann ID estimate estimate Kendall
p-value
1004 Roche’s Point –2.73 0.30 0.89 0.13
1018 Lisacasey GS –0.22 0.94 1.35 0.26
1042 Pettigo Lough Derg 2.41 0.13 2.90 0.03
109 Tralee Clash 2.77 0.01 1.89 0.02
1137 Kilnaleck GS 2.45 0.13 0.47 0.62
1414 Bagenalstown Fenagh 0.04 0.98 0.49 0.52
House
1431 Mullagh GS –2.68 0.18 0.35 0.46
1514 Edenderry The Tunnel 2.11 0.06 0.65 0.22
1529 Drumsna Albert Lock 1.37 0.23 1.30 0.18
1605 Glenvickee Caragh –6.37 0.33 5.97 0.05
River Area
1610 Brosna Mount Eagle 6.25 0.02 1.06 0.43
1612 Portlaw Mayfield 3.45 0.01 1.13 0.20
1619 Birdhill Parteen Weir 1.32 0.19 1.73 0.03
1714 Daingean GS –1.48 0.43 0.70 0.12
1929 Athlone OPW –2.75 0.07 0.10 0.99
2223 Dún Laoghaire Harbour –2.53 0.14 0.61 0.76
Yard
2322 Boora 1.37 0.08 0.25 0.43
2514 Lullymore Bord na 0.98 0.43 0.47 0.27
Móna
2635 Derryhillagh 0.21 0.97 4.15 0.02
3014 Stradbally GS –0.60 0.57 –2.88 0.00
3023 Howth Danesfort –1.68 0.23 –0.13 0.82
3035 Castlebar Burren 0.62 0.30 3.09 0.00
3127 Glenamaddy Gortnagier –2.08 0.02 0.42 0.32
3135 Cloonacool Lough –1.51 0.41 3.41 0.00
Easkey
3223 Glenbride Lodge 4.26 0.03 1.93 0.09
3513 Slieve Bloom Mountains 2.30 0.04 0.07 0.53
Nealstown
13You can also read


