THE ROLE OF DRIVER DISTRACTION IN TRAFFIC CRASHES
←
→
Page content transcription
If your browser does not render page correctly, please read the page content below
THE ROLE OF DRIVER DISTRACTION
      IN TRAFFIC CRASHES

                  Prepared by
              Jane C. Stutts, Ph.D.
            Donald W. Reinfurt, Ph.D.
              Loren Staplin, Ph.D.
             Eric A. Rodgman, B.S.
          University of North Carolina
         Highway Safety Research Center
                Chapel Hill, NC

                    Prepared for
        AAA Foundation for Traffic Safety
        1440 New York Avenue, N.W., Suite 201
               Washington, DC 20005
                   202/638-5944
             www.aaafoundation.org

                     May 2001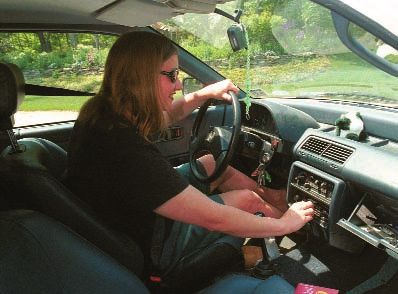
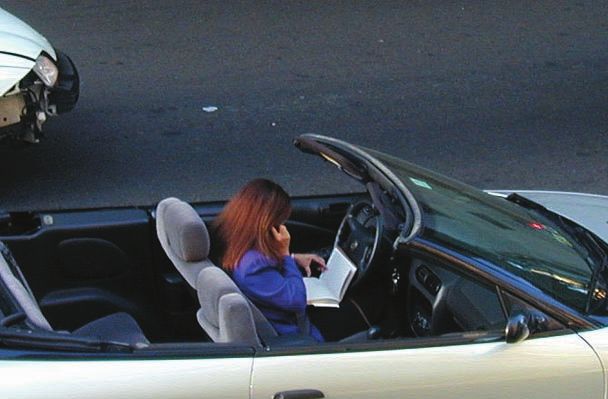
Cover Photos
Top row: Kristin Oguntoyinbo/UNC Highway Safety Research Center
Bottom: J. Scott Osberg/AAA Foundation for Traffic Safety
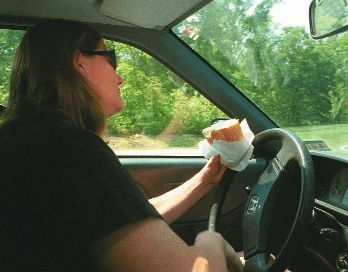
TABLE OF CONTENTS

LIST OF TABLES ............................................................................................ii

LIST OF FIGURES ..........................................................................................iii

FOREWORD....................................................................................................1

ACKNOWLEDGMENTS ..................................................................................2

EXECUTIVE SUMMARY ................................................................................3

INTRODUCTION ............................................................................................6

CDS DATA ANALYSIS ....................................................................................7

       Driver Factors ........................................................................................13
       Other Factors Impacting Driver Distraction ..........................................19
          Roadway Factors ............................................................................19
          Environmental and Vehicle Factors..................................................21
          Crash Factors ..................................................................................23

CDS NARRATIVE ANALYSIS........................................................................25

NORTH CAROLINA NARRATIVE ANALYSIS ..............................................30

SUMMARY AND CONCLUSIONS ................................................................34

REFERENCES ..............................................................................................38

APPENDIX A. CDS Driver Inattention/Distraction Variables ........................39

APPENDIX B. Supporting Graphs................................................................43

APPENDIX C. Sample CDS Narrative Printout ............................................57

APPENDIX D. Sample NC Narrative Printout ..............................................59

                                 i
LIST OF TABLES:

Table 1:      Driver attention status based on the unweighted CDS data ........................8
Table 2:      Driver attention status based on the weighted CDS data ............................9
Table 3:      Yearly trends in specific driving distractions based on
              weighted CDS data ....................................................................................11
Table 4:      Distribution of driver attention status within
              categories of driver age ............................................................................13
Table 5:      Distribution of driver age within categories of
              driver attention status ................................................................................15
Table 6:      Distribution of specific driver distractions within
              categories of driver age ............................................................................16
Table 7:      Distribution of driver attention status for males and females ....................17
Table 8:      Distribution of specific driver distractions for males and females ............18
Table 9:      Roadway effects on driver attention status ..............................................20
Table 10: Roadway effects on specific nature of driver distraction ..........................21
Table 11: Environmental and vehicle effects on driver attention status .................... 22
Table 12: Environmental and vehicle effects on specific nature of
          driver distraction ........................................................................................23
Table 13: Effects of crash characteristics on driver attention status ........................24
Table 14: Effects of crash characteristics on specific nature
          of driver distraction ....................................................................................25
Table 15. Analysis of narrative data from 1997 and 1998 CDS data files ............26-27
Table 16. Results of Narrative Key Word Search for
          Driver Distraction Cases on 1998 N.C. Crash File................................30-31
Table 17. Results of More Restricted Narrative Key Word Search for Driver
          Distraction Cases on 1994 North Carolina Crash File ..............................32

                                                                        ii
LIST OF FIGURES:

Figure 1:      Overall distribution of driver attention status ........................................10
Figure 2:      Overall distribution of specific driver distractions ..................................12
Figure 3:      Percentage of drivers identified as distracted by age group..................14
Figure 4:      Age distribution of drivers identified as distracted ................................14
Figure 5:      Distribution of specific driver distractions for males and females ..........17
Figure 6:      Growth in cell phone use as measured by millions of subscribers........35
Figure B.1: Effect of number of travel lanes on driver attention status ....................44
Figure B.2: Effect of number of travel lanes on specific driver distraction ..............44
Figure B.3: Effect of speed limit on driver attention status ......................................45
Figure B.4: Effect of speed limit on specific driver distraction ..................................45
Figure B.5: Effect of road grade on driver attention status ......................................46
Figure B.6: Effect of road grade on specific driver distraction..................................46
Figure B.7: Effect of intersection status on driver attention status ..........................47
Figure B.8: Effect of intersection status on specific driver distraction ......................47
Figure B.9: Effect of light condition on driver attention status ..................................48
Figure B.10: Effect of light condition on specific driver distraction ............................48
Figure B.11: Effect of weather condition on driver attention status ............................49
Figure B.12: Effect of weather condition on specific driver distraction ......................49
Figure B.13: Effect of vehicle type on driver attention status ....................................50
Figure B.14: Effect of vehicle type on specific driver distraction ................................50
Figure B.15: Effect of other occupants in vehicle on driver attention status ..............51
Figure B.16: Effect of other occupants in vehicle on specific driver distraction ........51
Figure B.17: Effect of number of vehicles on driver attention status ..........................52
Figure B.18: Effect of number of vehicles on specific driver distraction ....................52
Figure B.19: Effect of pre-crash vehicle maneuver on driver attention status............53
Figure B.20: Effect of pre-crash vehicle maneuver on specific driver distraction ......53
Figure B.21: Effect of region of impact on driver attention status ..............................54
Figure B.22: Effect of region of impact on specific driver distraction..........................54
Figure B.23: Effect of driver injury on driver attention status......................................55
Figure B.24: Effect of driver injury on specific driver distraction ................................55

                              iii
iv
FOREWORD

     This study was funded by the AAA Foundation for Traffic Safety.
Founded in 1947, the AAA Foundation is a not-for-profit, publicly supported
charitable research and educational organization dedicated to saving lives
and reducing injuries by preventing traffic crashes.

      This peer-reviewed report documents the relative reported frequency of
serious crashes caused by various forms of driver distraction. It should be of
interest to legislators, licensing agencies, law enforcement, and traffic safety
organizations. It is available in published paper format and as an electronic
file on the AAA Foundation for Traffic Safety’s web site at
http://www.aaafoundation.org.

     Funding for this study was provided by voluntary contributions from the
American Automobile Association and its affiliated motor clubs; from individ-
ual AAA members; and from AAA club-affiliated insurance companies.

     This publication is distributed at no charge as a public service. It may
not be resold or used for commercial purposes without explicit written per-
mission from the AAA Foundation for Traffic Safety. It may, however, be
copied in whole or in part and distributed at no charge via any medium, pro-
vided that the AAA Foundation is given appropriate credit as the source of
the material.

     The opinions, findings, and conclusions expressed in this publication
are those of the authors and are not necessarily those of the AAA
Foundation or of any individual who peer-reviewed the report. The AAA
Foundation for Traffic Safety assumes no liability for the use or misuse of
any information, opinions, findings, or conclusions contained in this report.

© 2001, AAA Foundation for Traffic Safety

                          1
ACKNOWLEDGMENTS
The authors express appreciation to the AAA Foundation for Traffic
Safety for their financial support of this project, and especially to David Willis
and Scott Osberg for their helpful guidance and input. We would also like to
thank Neil Lerner, Robert Scopatz, and Jing Wang for their thoughtful review
and comments on the draft report. Anna Waller at the UNC School of
Medicine provided valuable assistance to the narrative analysis portions of
the project, and Mike Bowling with the UNC Survey Research Unit provided
timely assistance with the statistical analyses.
2EXECUTIVE SUMMARY
Driver inattention is a major contributor to highway crashes. The
National Highway Traffic Safety Administration estimates that at least 25% of
police-reported crashes involve some form of driver inattention. Driver dis-
traction is one form of inattention and is a factor in over half of these crash-
es. Distraction occurs when a driver “is delayed in the recognition of infor-
mation needed to safely accomplish the driving task because some event,
activity, object, or person within or outside the vehicle compels or induces
the driver’s shifting attention away from the driving task.” The presence of a
triggering event distinguishes a distracted driver from one who is simply inat-
tentive or “lost in thought.”
The AAA Foundation for Traffic Safety awarded a contract to the
University of North Carolina Highway Safety Research Center to conduct
research on the role of driver distraction in traffic crashes. The goal of the
project is to identify the major sources of distraction to drivers and the rela-
tive importance of the distractions as potential causes of crashes. This
report presents the results of Phase I of the project. Included is a descrip-
tive analysis of five years of the National Accident Sampling System (NASS)
Crashworthiness Data System (CDS) data, along with an analysis of narra-
tives for two years for both CDS and North Carolina data. The descriptive
analyses and the narrative analysis were done to provide input for develop-
ing a more comprehensive taxonomy of driver distractions; the taxonomy will
guide future field data collection efforts.
The CDS is an annual probability sample of approximately 5,000 police-
reported crashes involving at least one passenger vehicle that has been
towed from the crash scene. Data are collected by trained, professional
crash investigation teams that collect information at the scene of the crash,
from an examination of the crash-involved vehicles, directly from interviews
with the crash victims and other witnesses, as well as from available medical
records. Beginning in 1995, a variable for coding the “Driver’s
Distraction/Inattention to Driving” was added to the CDS. The variable con-
tains codes for attentive, looked but did not see, and sleepy, along with more
than a dozen specific distractions (eating or drinking, other occupants, mov-
ing object in vehicle, talking on cellular phone, etc.).
For the current analyses two variables were defined – one identifying
the attention status of the driver (attentive, distracted, looked but did not see,
sleepy/asleep, or unknown), and the second the specific distracting event for
those drivers identified as distracted. The CDS driver distraction data is
vehicle rather than crash oriented and consequently it underestimates the
role of distraction in actual crashes.
For the overall 1995-1999 CDS data, 48.6% of the drivers were identi-
fied as attentive at the time of their crash; 8.3% were identified as distracted,
5.4% as “looked but did not see,” and 1.8% as sleepy or asleep. The
remaining 35.9% were coded either as unknown or no driver present. This
high percentage of drivers with unknown attention status has the effect of
diluting the percentages in the other categories. Without the unknowns, the
percentage of drivers identified as distracted increases to 12.9%. The per-
centage of actual crashes involving driver distraction would be still higher.
3The specific sources of distraction among distracted drivers were:
Specific Distraction % of Drivers
Outside person, object or event 29.4
Adjusting radio, cassette, CD 11.4
Other occupant in vehicle 10.9
Moving object in vehicle 4.3
Other device/object brought into vehicle 2.9
Adjusting vehicle/climate controls 2.8
Eating or drinking 1.7
Using/dialing cell phone 1.5
Smoking related 0.9
Other distraction 25.6
Unknown distraction 8.6
______
100.0
Percentages for the different types of distractions should be viewed as
preliminary estimates that are likely biased by differential underreporting.
These are research results that will be useful in building a broader under-
standing of driver distraction. The percentages for the different types of dis-
tractions should not be used to guide policy development.
Young drivers (under 20 years of age) were the most likely to be
involved in distraction-related crashes. In addition, certain types of distrac-
tions were more prominent in certain age groups, for example, adjusting the
radio, cassette or CD among the under 20-year-olds; other occupants (e.g.,
young children) among 20-29 year-olds; and outside objects and events
among those age 65 and older. Variations by driver sex were less pro-
nounced, although males were slightly more likely than females to be cate-
gorized as distracted at the time of their crash.
In addition to these driver factors, a number of roadway, environmental,
vehicle, and crash characteristic variables were also examined to determine
their relationship to driver distraction. Although these results were less con-
clusive, they nevertheless underscore the importance of taking into account
specific contextual factors in collecting and analyzing driver distraction data.
A few illustrative examples include the higher proportion of adjusting
radio/cassette/CD events occurring in nighttime crashes, the higher propor-
tion of moving object in vehicle events occurring in crashes on non-level
grade roadways, and the higher proportion of other occupant distractions
occurring at intersection crashes.
To obtain further insight into the specific events falling into each of the
identified CDS categories, two years of narrative CDS data were reviewed.
In addition, a computerized search was made of two years of North Carolina
police-reported crash narratives. Both activities proved helpful in developing
a more complete taxonomy of events distracting drivers.
When interpreting the results of this Phase I analysis, it is important to
keep in mind both the purpose for which it was conducted, and the limita-
4tions inherent in the data. The primary purpose of the analysis was to pro-
vide input for the development of a more comprehensive taxonomy of driver
distractions and to understand important contextual variables. The data limi-
tations are considerable and include potential underreporting of distracted
driving in general as well as differential underreporting of specific distracting
events.
These results suggest that demographic and situational factors are
related to driver distraction. Additional research is needed to quantify the
frequency and intensity of different driver distractions and to understand how
other variables affect distractability and willingness to engage in distracting
behaviors. As roads grow more congested and the demands on drivers
increase, it seems likely that new in-vehicle technologies will add even more
potential distracters.
5INTRODUCTION
Driver inattention is a major contributor to highway crashes. The
National Highway Traffic Safety Administration (NHTSA) estimates that
approximately 25% of police-reported crashes involve some form of driver
inattention – the driver is distracted, asleep or fatigued, or otherwise “lost in
thought” (Wang, Knipling and Goodman, 1996; Ranney, Mazzae, Garrott and
Goodman, 2000). Estimates from other sources are as high as 35-50%
(Sussman, Bishop, Madnick and Walter, 1995; NHTSA, 1997).
The AAA Foundation for Traffic Safety (AAAFTS) is committed to edu-
cating the public about issues affecting safety on the roadway. A contract
was awarded to the University of North Carolina Highway Safety Research
Center to conduct research on “The Role of Driver Distraction in Traffic
Crashes.” The goal of the project is to identify the major sources of distrac-
tion to drivers and the relative importance of different types of distractions in
causing crashes. The project involves a number of distinct yet interrelated
tasks, including: analysis of crash data from the NASS Crashworthiness
Data System (CDS) data file; analysis of narrative data from CDS and North
Carolina crash reports; and collection and analysis of field data to determine
the prevalence and implications of selected driving distractions in real-world
driving.
This report documents the work carried out to date on the project,
focusing on the CDS and North Carolina data analyses.
AAAFTS has chosen to focus its efforts specifically on driver distraction,
rather than the broader category of driver inattention. It defines distraction
as “when a driver is delayed in the recognition of information needed to safe-
ly accomplish the driving task because some event, activity, object, or per-
son within or outside the vehicle compelled or tended to induce the driver’s
shifting attention away from the driving task.” The presence of a triggering
event distinguishes a distracted driver from one who is simply inattentive or
“lost in thought.”
Safety problems related to driver inattention and distraction are expect-
ed to escalate in the future as more technologies become available for use
in personal vehicles. During the summer of 2000, NHTSA hosted an Internet
Forum on the safety implications of driver distraction when using in-vehicle
technologies including cell phones, in-vehicle navigation systems, night
vision systems, and wireless Internet (Llaneras, 2000). The Forum attracted
broad international participation from both the public and private sectors.
While cellular telephones and other in-vehicle technologies have been
the focus of considerable research within the highway safety community,
much less attention has been given to identifying other, non-technological,
distractions within the vehicle and their potential role in causing crashes.
The last in-depth crash causation research was sponsored by NHTSA
and conducted at Indiana University during the mid-1970s (Treat, Tumbas,
McDonald et al., 1979). This study, frequently referred to as the Indiana Tri-
Level Study because of the three levels of crash investigation employed,
examined the human, environmental, and vehicular factors in traffic crashes.
6Study results identified human factors as probable causes in 93% of the
investigated crashes, environmental factors as probable causes in 34%, and
vehicular factors as probable causes in 13%. Internal distraction was cited
as a causal factor in 9% of the crashes and driver inattention in an additional
15%. No information was reported on the frequency of external distractions.
CDS DATA ANALYSIS
The National Highway Traffic Safety Administration initiated the
Crashworthiness Data System (CDS) in 1988. It is intended to complement
the General Estimates System (GES) data, which is based entirely on informa-
tion derived from police crash reports. The CDS collects much more detailed
information on an annual probability sample of approximately 5,000 police-
reported traffic crashes involving at least one passenger vehicle that has been
towed from the crash scene. The CDS employs trained professional crash
investigation teams that collect information at the scene of the crash, from an
examination of the crash-involved vehicles, directly from interviews with the
crash victims and other witnesses, and from available medical records.
The CDS captures information on passenger vehicles, which includes
automobiles, pickup trucks, light vans, and sport utility vehicles, and on a few
non-passenger vehicles whose air bag may have deployed in the crash.
These vehicle types comprise 93% of all crash-involved vehicles and are the
target of the current investigation. Only passenger vehicles damaged serious-
ly enough to require towing from the crash scene are included in the CDS;
about a fourth of all police-reported crashes involve vehicles this seriously
damaged. This towaway selection criterion has the advantage of limiting the
sample to those crashes that have the most serious consequences in terms of
injury and/or property damage: nearly half of the drivers of vehicles reported in
the CDS are injured, compared to a third of drivers in the GES. This criterion
also standardizes the reporting threshold across states rather than requiring
investigators to estimate the cost of vehicle repairs or to make other subjective
judgments about whether a vehicle should be included in the sample.
Both the focus on passenger vehicles and the restriction to more serious
crashes make the CDS a potentially useful source of data for the current proj-
ect. The primary reason for using the CDS, however, is the level of detail con-
tained for each reported crash, including a variable describing the attention
status of the driver – “Driver’s Distraction/Inattention to Driving” (see Appendix
A). The variable was added to the data collection protocol beginning in 1995.
In addition to specific driver distraction and inattention codes, it includes
optional narrative information that gives a fuller picture of an identified distrac-
tion and can be used to record new and unspecified distractions.
The current analysis is based on 1995-1999 CDS data obtained from
the NHTSA National Center for Statistics and Analysis. For this analysis two
variables were created from the original “Driver’s Distraction/Inattention to
Driving” variable shown in Appendix A.
7DRIVER ATTENTION STATUS DRIVER DISTRACTION
has five categories: has 13 categories:
1. Attentive 1. Eating or drinking
2. Distracted 2. Outside person, object or event
3. Looked but didn’t see 3. Adjusting radio, cassette, or CD
4. Sleepy or fell asleep 4. Other occupants in vehicle
5. Unknown or no driver 5. Moving object in vehicle
6. Smoking related
7. Talking or listening on cellular phone
8. Dialing cellular phone
9. Using device/object brought into vehicle
10. Using device/controls integral to vehicle
11. Adjusting climate controls
12. Other distraction
13. Unknown distraction
Table 1. Driver attention status based on the unweighted CDS data1
Driver Attention Status 1995 1996 1997 1998 1999 Total
Attentive 3030 3204 2451 2877 2598 14160
(46.5)2 (48.0) (37.8) (44.5) (42.2) (43.8)
Distracted 557 476 393 468 486 2380
(8.6) (7.1) (6.1) (7.2) (7.9) (7.4)
Looked but didn t see 347 347 288 275 305 1562
(5.3) (5.2) (4.4) (4.3) (5.0) (4.8)
Sleepy or fell asleep 188 195 113 151 150 797
(2.9) (2.9) (1.7) (2.3) (2.4) (2.5)
Unknown/no driver 2390 2457 3247 2691 2619 13404
(36.7) (36.8) (50.0) (41.6) (42.5) (41.5)
TOTAL 6512 6679 6492 6462 6158 32303
1
The unweighted data includes some special study cases (e.g., redesigned air bag and truck underride)
that are not included in the weighted tables that follow.
2
Column percent
8Table 1 shows the recorded attention status of drivers on the unweight-
ed (or raw) data files. The information in Table 1 is vehicle, not crash, orient-
ed. In other words, there is one record for each vehicle that was towed from
the crash scene.
For these unweighted data files involving approximately 6,500 vehi-
cles/drivers annually, instances of driver distraction are coded for 7.4% of the
overall sample. It should also be noted, however, that the attention status of
the driver just prior to the crash is reported as unknown (or no driver pres-
ent) in a large proportion of the vehicles (41.5%), despite the in-depth nature
of the crash investigations.1
Table 2 presents the same percentage distributions of driver attention
status, but based on the weighted CDS data files; instead of 6,500 crash-
involved vehicles per year, the table reflects an average of 3.4 million crash-
involved vehicles annually. The weighting factor assigned to a given case is
determined by (1) the probability of the primary sampling unit being selected,
(2) the probability of the particular police agency being selected, and (3) the
Table 2. Driver attention status based on the weighted CDS data
(column percents and standard errors)
Driver Attention 1995 1996 1997 1998 1999 Overall
Status (N=3.4 M) (N=3.5 M) (N=3.7 M) (N=3.3 M) (N=3.2M) (N=17.1 M)
Attentive 50.9 1 54.4 40.4 51.0 46.9 48.6
2 (3.7) (5.2) (3.6) (2.0) (2.7)
(3.1)
Distracted 9.6 8.0 4.9 11.1 8.2 8.3
(1.1) (0.8) (1.1) (1.4) (1.2) (0.6)
Looked but didn t see 6.4 5.7 3.9 4.4 6.8 5.4
(1.3) (0.9) (0.9) (1.4) (0.8) (0.7)
Sleepy or fell asleep 2.0 2.5 0.9 1.2 2.3 1.8
(0.8) (0.8) (0.3) (0.3) (0.8) (0.4)
Unknown/no driver 31.1 29.4 49.9 32.3 35.9 35.9
(1.8) (2.9) (6.1) (3.5) (2.7) (2.8)
1
Column percent
2
Standard error
probability of the crash being selected for that day. The weighted frequen-
cies reflect the same sampling base as the unweighted frequencies — pas-
senger vehicles involved in towaway crashes. However, the frequencies are
extrapolated to represent the total population of such crash-involved vehicles
in the U.S.
With the weighting factors in place, the percentage of vehicles involving
a distracted driver increases to 8.3%, and the percentage of unknown or no
driver cases drops to 35.9%. Although this table only shows the percentage
distributions, the overall projected numbers of vehicles can be calculated by
multiplying the percentages by the sample sizes shown at the top of the
table. For example, 8.3% of 17.1 million vehicles/drivers is 1.4 million cases
over the 5-year study period, or an annual average of 284,000 distracted
1 The percentage of unknown cases was especially high in 1997, due to fewer occupant interviews and vehicle
inspections being conducted while data collection procedures were being converted to a new electronic system.
9drivers in towed vehicles.
Having such a large proportion of unknown cases in the data dilutes the
overall proportion of drivers identified as distracted at the time of their crash.
Also, the fact that the percentage of unknown cases varies widely across
years (from 29 to almost 50%) makes it difficult to draw comparisons in the
percentage of distraction cases occurring from one year to the next. If one
assumes that the unknown cases are distributed like the known cases2, the
overall percentage of crash-involved vehicles with distracted drivers is
12.9%. The yearly percentages are 13.9% for 1995, 11.3% for 1996, 9.9%
for 1997, 16.5% for 1998, and 12.7% for 1999.
Because the CDS are weighted sample data, each of the percentage
estimates presented in Table 2 has a corresponding standard error.
Percentage estimates and standard errors were calculated using SUDAAN,
a statistical software package that handles multi-level and multi-year sample
data (Shah, Barnwell, and Bieler, 1997). By multiplying the standard error by
1.96 and then adding and subtracting this number from the estimate, one
can obtain upper and lower 95% confidence limits for each of the estimates.
Figure 1 shows the overall estimates of driver attention status contained
in Table 2 along with their associated 95% confidence intervals. Based on
the data, we can conclude with 95% certainty that, if all towaway crashes in
the U.S. were examined following the CDS protocol, 7.1% to 9.4% of the driv-
ers in those vehicles would be identified as distracted. An additional 30.4% to
41.5% would have unknown or not applicable attention status.
As was described earlier, the CDS data also contains more detailed
60
50
% of All Drivers
40
30
20
10
0
Attentive Distracted Looked But Sleepy, Unknown,
Didn t See Asleep No Driver
Figure 1. Overall distribution of driver attention status
based on the weighted 1995-1999 CDS data.
2 Analyses showed unknown cases to be similar to known cases with respect to driver age, gender, and
other important variables. However, unknown cases were more likely to occur at nighttime, and were less
likely to involve occupants other than the driver.
10Table 3. Yearly trends in specific driving distractions based on weighted CDS data
(column percents and standard errors)
Driver Distraction 1995 1996 1997 1998 1999 Overall
(N=322K) (N=279K) (N=182K) (N=371K) (N=265) (N=1,420K)
Outside person, object, 28.11 35.1 35.4 19.8 34.3 29.4
2 (4.7) (6.4) (5.5) (4.1) (2.4)
event (6.9)
Adjusting radio/cassette/CD 14.1 4.7 0.4 23.5 5.7 11.4
(1.6) (1.5) (0.3) (12.5) (2.4) (3.7)
Other occupant 11.8 12.8 10.6 7.5 12.7 10.9
(1.7) (4.3) (5.6) (2.4) (3.0) (1.7)
Moving object in vehicle 3.5 6.2 2.5 2.2 7.6 4.3
(2.5) (3.1) (1.0) (1.0) (4.0) (1.6)
Other device/object --- 3 2.6 4.1 5.3 2.7 2.9
(1.1) (2.5) (3.2) (1.2) (0.8)
Vehicle/climate controls 4 4.1 1.6 3.4 2.4 2.7 2.8
(1.2) (0.9) (1.0) (1.4) (0.8) (0.6)
Eating, drinking 1.8 1.3 0.3 1.6 3.3 1.7
(0.6) (0.5) (0.2) (0.7) (1.8) (0.3)
Using/dialing cell phone 5 1.2 2.8 3.5 0.3 0.8 1.5
(0.6) (1.7) (1.4) (0.1) (0.7) (0.5)
Smoking related 1.6 0.5 1.6 0.01 1.2 0.9
(0.9) (0.4) (0.5) (0.01) (0.7) (0.2)
Other distraction 17.1 19.7 35.0 35.3 21.9 25.6
(6.0) (3.0) (7.2) (9.4) (5.7) (3.1)
Unknown distraction 16.7 12.9 3.0 2.1 7.2 8.6
(7.5) (3.1) (2.0) (0.9) (2.3) (2.7)
1
Column percent
2
Standard error
3
Variable not available in 1995
4
Combination of using device/controls integral to vehicle and adjusting climate controls
5
Combination of talking or listening on cellular phone and dialing cellular phone
information on the specific nature of distracting events. This information is
summarized in Table 3, again based on the weighted data. The total num-
ber of projected crash-involved vehicles with distracted drivers is shown at
the top of each column, and the percentage distribution by type of distraction
is given below, along with their standard errors. Percentages in each col-
umn total 100%. Two of the distraction categories represent combined cate-
gories from the original list of 13: “Using device/controls integral to vehicle”
and “adjusting climate controls” have been combined into a single
“vehicle/climate control” category, and “talking or listening on cellular phone”
and “dialing cellular phone” have been combined into “using/dialing cell
phone.” This was done because of very small numbers of raw cases for the
adjusting climate controls and dialing cell phone categories.
Based on the Table 3 results, the most frequently reported source of dis-
traction for drivers of vehicles in towaway crashes is outside persons, objects,
or events (29.4%), followed by adjusting the radio, cassette or CD (11.4%),
and other occupants in vehicle (10.9%). All other identified distractions – mov-
ing objects in vehicle, objects brought into the vehicle, adjusting vehicle or cli-
mate controls, eating and drinking, using a cellular phone, and smoking – each
11account for only 1% to 4% of the total. In addition, there is a large category of
“other” distracting events (25.6%) and “unknown” distractions (8.6%). More
detailed information on the specific types of events is included in the section
on the CDS Narrative Analysis and Table 15 later in this document.
It should be noted that there is large year-to-year variability in the gen-
erated percentages. This is true even for some categories (such as adjust-
ing the radio, cassette or CD player) that are based on relatively large annu-
al counts. In addition, the weighting process substantially alters some of the
percentages. Consequently, the results contained in this report are primarily
based on the combined, five-year weighted data.
Figure 2 is similar to Figure 1, and shows the overall estimates for the
40
Percent of Distracted Drivers
30
20
10
0
n
ng
n
ls
n
Sm e
t
g
.
ct
ec
tc
io
t
io
io
n
tro
in
an
ki
je
,e
ho
ct
ct
ct
bj
ok
rin
up
on
lim Ob
tra
tra
ra
O
D
lP
D
cc
C
,C
t
is
is
e/
g
is
el
in
g,
D
.D
O
e
D
ic
C
io
at
ov
tin
Ve Dev
de
er
er
ad
nk
M
Ea
th
th
si
R
U
/C
ut
O
O
er
O
h.
th
.
O
Figure 2. Overall distribution of specific driver distractions
based on the weighted 1995-1999 CDS data.
various distractions and their 95% confidence intervals. In many cases the
confidence intervals are quite large, a reflection of the heavily weighted data.
Nevertheless, outside distractions; distractions involving a radio, CD or tape
player; and distractions by other occupants in the vehicle generally stand out
as most important.
The remainder of this section presents tables based on the overall
weighted CDS data, examining the impact on driver distraction of various
driver, roadway, environmental, vehicle, and crash characteristics. In
describing these tables, we have not limited ourselves to only those results
that are statistically significant. In part, this is because each table presents
many possible comparisons. In addition, some results, even though not sta-
tistically significant (such as those pertaining to cell phones or other specific
12Table 4. Distribution of driver attention status within categories of driver age based on
weighted 1995-1999 CDS data (column percents and standard errors)
Driver Attention Status AGE20
15
Percent
10
5
0Table 5. Distribution of driver age within categories of driver attention status based on
weighted 1995-1999 CDS data (row percents and standard errors)
Driver Attention AGE
StatusTable 6. Distribution of specific driver distractions within categories of
driver age based on weighted 1995-1999 CDS data
(column percents and standard errors)
Driver Distraction AGETable 7. Distribution of driver attention status for males and females based on
weighted 1995-1999 CDS data (column percents and standard errors)
Driver Attention Male Female
Status
Attentive 46.6 1 52.6
2
(3.1) (2.7)
Distracted 8.8 7.8
(0.7) (0.6)
Looked but didn t see 4.9 6.2
(0.6) (1.0)
Sleepy or fell asleep 2.7 0.7
(0.8) (0.1)
Unknown/no driver 37.0 32.8
(2.8) (3.3)
OVERALL 56.2 43.8
1
Column percent
2
Standard error
40
30 Male
Female
Percent
20
10
0
.
n
n
n
tc
g
ne
ls
ng
t
t
t
ec
an
ec
io
io
tio
in
ro
,e
ho
ki
ct
ct
ok
bj
bj
up
ac
nt
rin
D
ra
tra
O
lP
O
m
o
,C
r
cc
t
D
t
e/
C
S
is
is
is
g
el
O
ic
io
in
D
g,
.D
D
e
C
ev
at
ad
ov
er
tin
e
er
nk
lim
d
th
D
M
R
Ea
th
si
U
O
er
/C
O
ut
th
O
h.
O
Ve
Figure 5. Distribution of specific driver distractions for males and females
based on weighted 1995-1999 CDS data.
17Table 8. Distribution of specific driver distractions for
males and females based on weighted 1995-1999
CDS data (column percents and standard errors)
Driver Distraction Male Female
Outside person, object, event 28.9 1 30.5
2
(3.7) (2.7)
Adjusting radio/cassette/CD 10.3 13.1
(2.4) (8.4)
Other occupant 11.2 10.6
(2.4) (2.0)
Moving object in vehicle 4.2 4.7
(2.5) (2.0)
Other device/object 2.2 4.1
(0.9) (1.7)
Vehicle/climate controls 2.3 3.6
(0.9) (1.3)
Eating, drinking 2.0 1.3
(0.7) (0.6)
Using/dialing cell phone 1.7 1.2
(0.5) (0.7)
Smoking related 0.9 0.9
(0.2) (0.4)
Other distraction 28.3 22.0
(3.1) (4.1)
Unknown distraction 8.0 8.1
(3.1) (2.9)
OVERALL 63.1 36.9
1
Column percent
2
Standard error
driver oriented, rather than crash oriented. To the extent that young and/or
male drivers are more likely to be “at fault” in their collisions, one might also
anticipate higher incidences of distracted or inattentive driving. The percent-
ages also underestimate the importance of distraction as a contributing fac-
tor to crashes. This is because it is unlikely that more than one of the driv-
ers involved in two (or more) vehicle crashes is distracted at the time of the
crash: if 10 out of 100 two-vehicle crashes are caused by distracted drivers,
then 10% of the crashes involve a distracted driver, but only 5% (10 out of
200) of the vehicles had distracted drivers.
18Other Factors Impacting Driver Distraction
The incidence of driver distractions and their role in crashes may vary
as a function of roadway, environmental, and vehicle conditions. This is
especially true for voluntary distracting behaviors, such as eating, drinking,
smoking, or dialing a cell phone. Drivers may be less likely to engage in
these types of behaviors when driving task demands are high, for example,
when negotiating a busy intersection, driving in poor weather conditions, at
nighttime, or on a busy multi-lane roadway. Distracting events that are less
under the driver’s control, such as moving objects inside the vehicle or
objects or events outside the vehicle, should be less influenced by such
external factors.
The relationship is not straightforward, since factors that decrease the
likelihood of engaging in a behavior may also increase the likelihood of a
crash in the presence of that behavior. Thus, drivers may be less likely to
initiate a phone call while traveling on a busy roadway in traffic, but for those
who do choose to initiate the call, the risk of a crash is likely higher than
under less demanding driving conditions. While there has been some labo-
ratory-based research on the effect of increased driver workload on driving
performance (for example, see Ranney et al., 2000; Tijerina, 2000; and
Martens and van Winsum, 2000; all papers presented at a Summer, 2000
NHTSA-sponsored Internet Forum on the Safety Implications of Driver
Distraction and summarized in Llaneras, 2000), there is little real-world data
to tease out the effects of exposure versus risk.
In the sections that follow, selected roadway, environmental/vehicle,
and crash variables are examined for their relevance to driver distraction.
Each of the variables was examined independently in a multi-level contin-
gency table (e.g., number of travel lanes by driver attention status).
However, to maximize precision and facilitate presentation, the variables
were subsequently dichotomized, and in the tables included with this report
only a single percentage is presented (e.g., percentage of crashes occurring
on roadways with more than two travel lanes for each level of driver attention
status). As in the section on driver factors, results have also been summa-
rized graphically using bar charts with 95% confidence intervals superim-
posed on the point estimates (see Appendix B).
Roadway Factors
Tables 9 and 10 (and Figures B.1-B.8 in Appendix B) summarize
results for selected roadway variables available in the weighted CDS data
file. Table 9 compares cases involving driver distraction to other cases on
the data file, while Table 10 provides the more indepth information for the
specific categories of driver distraction.
Compared to drivers who were judged attentive, those who were dis-
tracted at the time of their crashes were less likely to be traveling on multi-
lane roadways and less likely to have crashed at an intersection or other
road junction. Only a third (37.1%) of the distracted drivers were traveling
on multilane roadways, compared to half (50.1%) of the attentive drivers; half
(50.4%) of the distracted drivers collided at an intersection or other junction,
compared to two-thirds (66.0%) of the attentive drivers. Results with respect
19Table 9. Roadway effects on driver attention status
based on weighted 1995-1999 CDS data
Driver Attention Status Percent of Crashes Involving:
>2 Lanes Speed Limit Non-Level Intersection/
>45 mph Grade Junction
Attentive 50.1 1 24.9 32.6 66.0
2
(2.1) (3.0) (3.0) (1.9)
Distracted 37.1 20.2 36.4 50.4
(3.7) (2.8) (5.9) (2.8)
Looked but didn t see 41.1 15.1 22.3 88.3
(2.6) (2.8) (4.2) (3.4)
Sleepy or fell asleep 34.1 42.8 34.0 14.2
(6.6) (5.7) (7.6) (6.1)
Unknown/no driver 45.6 21.6 31.5 61.1
(2.8) (3.7) (2.2) (1.0)
OVERALL 46.6 23.1 32.0 63.2
1
Percent of crashes
2
Standard error
to the other two roadway variables, speed limit and road profile, were not
significantly different for the distracted versus attentive comparison.
Nevertheless, these results indicate that distracted drivers are crashing
under different roadway conditions than are attentive drivers.
Table 10 (along with the corresponding figures in Appendix B) contains
the same roadway information for each of the various categories of driver
distraction. Keeping in mind that many of the table cells are based on small
sample sizes and have large standard errors, there is considerable variability
in percentages across categories. For example, distractions involving other
occupants in the vehicle were overrepresented on multi-lane roadways and
at intersections or other roadway junctions, while eating and drinking distrac-
tions were overrepresented on higher speed (>45 mph) roadways. Non-level
grade roadways were associated with higher incidences of distractions
involving moving objects in the vehicle, using or reaching for other devices
or objects brought into the vehicle, and manipulating radios, cassettes or
CDs. At the same time, some distraction types were less likely to occur
under various roadway conditions. For example, eating and drinking and
manipulating a radio, cassette or CD were less likely than other distracting
events to occur at intersections, while cell phone distractions were less likely
to occur on higher speed roadways or on non-level grade sections of road-
way. Although these differences suggest different factors at play in the vari-
ous distractions, without more detailed multivariate analyses (e.g., adjusting
for driver age and gender) they must be viewed primarily as descriptive
20Table 10. Roadway effects on specific nature of driver distraction
based on weighted 1995-1999 CDS data
Driver Distraction Percent of Crashes Involving:
>2 Lanes Speed Limit Non-Level Intersection/
>45 mph Grade Junction
Outside person, object, event 34.4 1 24.3 32.0 51.8
2
(3.2) (6.2) (4.2) (4.0)
Adjusting radio/cassette/CD 24.7 18.8 49.1 30.6
(12.5) (2.8) (16.9) (13.1)
Other occupant 49.1 23.3 37.5 61.7
(8.3) (4.4) (14.4) (8.5)
Moving object in vehicle 18.5 9.7 67.8 50.8
(12.2) (5.8) (14.0) (10.9)
Other device/object 41.0 13.7 52.9 43.9
(12.3) (7.0) (16.7) (10.8)
Vehicle/climate controls 37.1 12.8 26.4 46.8
(12.7) (6.6) (8.7) (14.0)
Eating, drinking 24.1 33.0 29.6 27.4
(6.6) (8.0) (11.3) (5.8)
Using/dialing cell phone 42.3 8.9 19.6 56.5
(16.4) (7.0) (8.8) (13.8)
Smoking related 39.6 17.1 36.0 36.3
(18.8) (10.0) (16.8) (7.0)
Other distraction 33.8 20.0 35.5 49.4
(6.8) (3.1) (6.4) (6.3)
Unknown distraction 66.9 14.8 21.8 68.8
(3.1) (3.2) (9.8) (5.3)
OVERALL 37.1 20.2 36.4 50.4
1
Percent of crashes
2
Standard error
rather than explanatory. Also, the reader is reminded that very few of the dif-
ferences are significant from a statistical point of view, as judged by overlap-
ping confidence intervals (see Appendix B graphs).
Environmental and Vehicle Factors
Selected environmental and vehicle factors that may moderate driver
distractions include time of day/light condition, weather condition, vehicle
type, and number of occupants in the vehicle. These variables are summa-
rized in Tables 11 and 12 following the same general layout as for the road-
way factor tables. In addition, results are presented graphically in Appendix
B (Figures B.9 - B.16). Compared to attentive drivers, distracted drivers
were more likely to be driving during non-daylight hours, more likely to be
driving a pickup truck, van, or sport utility vehicle, and more likely to have
other occupants in the vehicle. They were also less likely to be driving under
21Table 11. Environmental and vehicle effects on driver attention status
based on weighted 1995-1999 CDS data
Driver Attention Percent of Crashes Involving:
Status
Non-
Non- Adverse Passenger >1
Daylight Weather Car Occupant
Attentive 30.0 1 21.5 23.7 35.9
2 (1.9) (0.9) (1.2)
(1.3)
Distracted 34.2 15.5 28.0 38.7
(3.9) (3.5) (3.2) (4.8)
Looked but didn t see 22.4 13.2 21.7 33.6
(2.5) (1.4) (4.9) (3.2)
Sleepy or fell asleep 60.5 8.4 38.7 17.1
(8.4) (1.4) (6.7) (2.4)
Unknown/no driver 43.4 20.6 28.0 29.0
(1.5) (1.7) (1.2) (1.3)
OVERALL 35.3 20.0 25.7 33.2
1
Percent of crashes
2
Standard error
adverse weather conditions (rain, sleet, fog, etc.). All differences were rela-
tively small, however, and not significant statistically.
Turning to specific distraction categories (Table 12), almost 90% of driv-
ers who crashed while smoking, two-thirds of those who crashed while
adjusting a radio, cassette or CD, and half of those who crashed while using
a cell phone, were driving during non-daylight hours. Nearly half (46.0%) of
the adjusting radio, cassette or CD crashes also occurred under adverse
weather conditions. Pickups, vans, and sport utility vehicles were associated
with higher incidences of eating and drinking and cell phone collisions,
although the standard error was particularly large for the latter. Finally, while
adjusting the radio, cassette or CD and adjusting vehicle or climate controls
were both more likely to occur when other occupants were present in the
vehicle, other distractions such as moving object in vehicle, eating and drink-
ing, and using a cell phone were less likely to occur. As with the Table 10 on
roadway conditions, large standard errors permit only tentative conclusions
to be drawn from these data. However, the results suggest that driver over-
load may be a factor in some crashes involving driver distraction, and that
having other occupants in the vehicle can be a source of distraction as well
as a moderating force reducing the likelihood of other distractions.
22Table 12. Environmental and vehicle effects on specific nature of driver distraction
based on weighted 1995-1999 CDS data
Driver Distraction Percent of Crashes Involving:
Non-
Non- Adverse Passenger >1
Daylight Weather Car Occupant
Outside person, object, event 29.9 1 16.2 23.7 27.5
2 (4.9) (2.2) (3.1)
(3.5)
Adjusting radio/cassette/CD 63.7 46.0 21.7 63.6
(9.9) (14.3) (5.9) (20.8)
Other occupant 38.9 16.4 24.6 99.8
(9.8) (3.3) (10.3) (0.2)
Moving object in vehicle 40.4 4.0 20.2 5.6
(5.6) (2.6) (10.0) (3.2)
Other device/object 26.4 2.2 26.2 19.1
(9.4) (1.0) (10.2) (11.0)
Vehicle/climate controls 40.6 5.6 23.0 51.7
(11.6) (5.6) (5.1) (14.3)
Eating, drinking 31.2 11.9 46.6 11.3
(9.2) (6.5) (8.2) (4.1)
Using/dialing cell phone 53.0 11.1 45.9 14.0
(12.5) (7.9) (17.4) (8.4)
Smoking related 88.2 0.5 37.9 27.2
(5.3) (0.5) (13.5) (8.6)
Other distraction 25.4 6.7 33.6 25.3
(4.0) (2.5) (4.6) (4.6)
Unknown distraction 19.3 14.1 37.7 37.1
(3.7) (7.0) (12.1) (11.1)
OVERALL 34.2 15.5 28.0 38.7
1
Percent of crashes
2
Standard error
Crash Factors
The crash characteristics summarized in Tables 13 and 14 and
Appendix B (Figures B.17 - B.24) indicate that compared to attentive drivers,
distracted drivers are less likely to be in crashes involving two or more vehi-
cles, and more likely to be involved in frontal impact collisions. Only 57.0%
of distracted drivers were in crashes involving two or more vehicles, and
three-fourths (74.6%) experienced frontal impact. Distracted drivers were no
more or less likely than attentive drivers to be going straight prior to their
crash (as opposed to turning, backing, merging, etc.), and were no more
likely to be seriously or fatally injured.
23Table 13. Effects of crash characteristics on driver attention status
based on weighted 1995-1999 CDS data
Driver Attention Status Percent of Crashes Involving:
Vehicle Serious or
2+ Going Front Fatal
Vehicles Straight Impact Driver Injury
Attentive 77.6 1 53.5 56.8 7.6
2
(1.3) (1.0) (1.4) (3.3)
Distracted 57.0 55.3 74.6 7.9
(5.3) (4.7) (2.7) (2.9)
Looked but didn t see 96.4 36.0 48.4 6.8
(1.5) (4.8) (7.7) (2.7)
Sleepy or fell asleep 18.5 62.8 68.3 29.3
(1.9) (6.9) (4.7) (11.4)
Unknown/no driver 73.5 59.7 64.3 13.9
(1.8) (1.4) (1.1) (5.5)
OVERALL 74.4 55.1 61.4 10.2
1
Percent of crashes
2
Standard error
Crash characteristics varied considerably for the different categories of
driver distraction, especially with regard to single- versus multi-vehicle crash-
es. Drivers distracted by cell phones or by persons, objects, or events out-
side the vehicle were overrepresented in multi-vehicle collisions, while those
distracted by a moving object inside the vehicle or by smoking were under-
represented. Adjusting vehicle/climate controls, using or dialing a cell
phone, and other occupant distractions were all overrepresented in situations
where the vehicle was going straight ahead just prior to crashing, suggesting
that drivers may be less likely to engage in these behaviors when turning,
backing, or otherwise maneuvering their vehicle.
Although some distraction types, including moving object in vehicle and
adjusting radio/cassette/CD, were more likely to result in frontal impact, the
significance of these findings is not clear without additional analyses adjust-
ing for crash type and other related variables. Differences among the vari-
ous distraction categories with respect to percentage of drivers seriously or
fatally injured ranged from less than 2% to almost 14%, but large standard
errors limit the conclusions that can be drawn from the data.
24Table 14. Effects of crash characteristics on specific nature of driver distraction
based on weighted 1995-1999 CDS data
Driver Distraction Percent of Crashes Involving:
Vehicle Serious or
2+ Going Front Fatal
Vehicles Straight Impact Driver Injury
Outside person, object, event 66.1 1 42.7 69.7 5.7
2
(4.0) (4.7) (2.7) (1.8)
Adjusting radio/cassette/CD 37.8 46.5 87.9 1.9
(21.3) (24.7) (7.5) (0.5)
Other occupant 55.9 68.2 59.1 8.3
(7.5) (4.6) (2.1) (2.9)
Moving object in vehicle 17.0 43.9 91.1 11.3
(8.8) (9.1) (5.0) (11.2)
Other device/object 48.8 61.0 81.6 13.7
(11.3) (12.1) (10.5) (7.7)
Vehicle/climate controls 59.6 70.1 85.5 3.4
(11.0) (10.9) (6.7) (1.1)
Eating, drinking 53.4 61.3 79.7 10.3
(8.4) (8.8) (9.3) (3.4)
Using/dialing cell phone 82.9 68.5 68.8 8.4
(11.6) (11.4) (16.4) (4.6)
Smoking related 15.6 59.3 42.7 7.8
(4.9) (7.6) (10.0) (2.0)
Other distraction 53.8 61.8 73.7 12.7
(5.8) (3.5) (4.6) (5.5)
Unknown distraction 85.3 69.0 83.3 6.5
(2.7) (9.9) (10.4) (2.8)
OVERALL 57.0 55.3 74.6 7.9
1
Percent of crashes
2
Standard error
CDS NARRATIVE ANALYSIS
In addition to the coded variables on the CDS data file, the raw CDS
data also contain narrative descriptions that sometimes elaborate on the
coded variables. This information was made available to the project for
years 1997 and 1998 in hard copy (paper) format. A sample of this printout
is contained in Appendix C. These narratives helped to clarify the range
and nature of distracting activities included under each category of distrac-
tion event. As can be seen on the sample pages, the printouts contained
additional text that was sometimes entered along with the distraction code as
well as an overall narrative summary of the crash. Further information on a
particular distraction could appear in one, both, or neither of these locations.
25Table 15. Analysis of narrative data from 1997 and 1998 CDS datafiles
1997 CDS 1998 CDS
Distraction Category Data Data
(N=332 (N=412
narratives) narratives)
Outside person, Object or Event 96 1 125
Outside traffic/vehicle (vehicle swerved, turned in front of, 17 37
changed lanes, slowed or stopped, encroached on lane,
emergency vehicle, bright vehicle lights, etc.)
Police (being chased by police, officer directing traffic, 8 5
thought saw police, police NOS 2 )
Animal in roadway (deer, dog, elk, animal NOS) 3 10
Sunlight, sunset 1 6
People/objects in roadway (child in road, basketball game, 3 5
crowd, broken glass, garbage can, etc.)
Crash scene/leaving scene of crash 3 1
Road construction 3 0
Other (waved ahead by driver, another person or driver, 13 20
parachutes in sky, bicycle, toll booth, brush obstructing
vision, tire blowout, etc.
Outside object, person or event NOS 45 41
Adjusting Radio/Cassette/CD 10 21
Radio 1 9
Cassette 1 0
CD 1 0
Adjusting radio, cassette, CD NOS 7 12
Other Occupant 41 53
Talking, arguing, conversing with passenger 10 22
Passenger doing something (yelling, grabbing, reaching, 5 4
fighting, sleeping)
Child/infant distraction 6 6
Other (looking at passenger, helping buckle seat belt, rear seat 0 4
passenger NOS)
Other occupant NOS 20 17
Moving Object in Vehicle 12 16
Dog (barking, jumping, hitting steering wheel) 1 4
Bee/bug/insect (swatting, flying into window, in vehicle) 4 1
Other (objects falling off seat, spilled groceries, spilled 3 7
beverage, object rolling under brake pedal, sick cat)
Moving object NOS 4 4
Using Other Device Brought into Vehicle 20 30
Reaching for something on floor (cassette, water bottle, purse, 0 6
NOS)
26Table 15 cont...
Other (reaching for candy, dishes falling, object in backseat, 6 8
something in front passenger seat, throwing away trash,
rolling down window, reaching for thermos, getting makeup,
using data terminal)
Using device NOS 14 16
Using Other Device Integral to Vehicle 10 8
Adjusting, fastening seat belt 0 4
Mirrors, lights, wiper, etc. 4 4
Other NOS 6 0
Adjusting Climate Controls NOS 3 0
Eating/Drinking 7 16
Eating (burger, NOS) 0 2
Drinking (tea, coffee, soda, alcohol, juice, NOS) 2 7
Eating or drinking NOS 5 7
Cell Phone 8 10
Answering cell phone/cell phone ringing 1 1
Cell phone use NOS 7 9
Smoking 11 4
Reaching/looking for/getting cigarette 2 1
Lighting cigarette 2 2
Dropped cigarette 1 0
Cigarette blew back into vehicle 2 0
Smoking cigarette NOS 4 1
Other Distraction 66 79
Medical problem (heart attack, blackout, medication, loss of 16 18
consciousness, seizure, blurred vision, etc.)
Looking outside vehicle (in rear veiw mirror, at traffic, at road 8 9
signs, in store window, for gas station, for parking space, for
business, etc.)
Looking inside vehicle (at map, papers, mail, for pen, for 8 3
address on paper, down NOS)
Reaching for object (wallet, pills, inhaler, backseat) 0 4
Other (sun glare, sneezed, tired, sleepy, child playing with 11 18
controls, intoxicated, depressed, etc.)
Other NOS 23 27
Inattentive/Lost in Thought 11 27
Unknown Distraction NOS 37 23
1 2
Number of cases recorded on the unweighted data (N) NOS = Not Otherwise Specified
Table 15 summarizes the results of the CDS narrative analysis. The
numbers in the table represent the actual number of cases reviewed.
Altogether, there were 332 narratives for the 1997 data and 412 for the 1998
data, representing 84-88% of the (raw number of) distraction cases coded
for each year. In a large percentage of the cases (43%), no further informa-
tion that might clarify the nature of the distraction was given. These cases
are simply recorded as “not otherwise specified” or “NOS” (for example, “out-
side object, person or event NOS”). In many instances, however, further
detail was provided and an attempt made to categorize this information.
Under the category of “other occupant,” for example, subcategories were
27You can also read