Tourism satellite account: Year ended March 2020 - The contribution made by tourism to the New Zealand economy - Stats NZ
←
→
Page content transcription
If your browser does not render page correctly, please read the page content below
Tourism satellite account:
  Year ended March 2020

 The contribution made by tourism
      to the New Zealand economy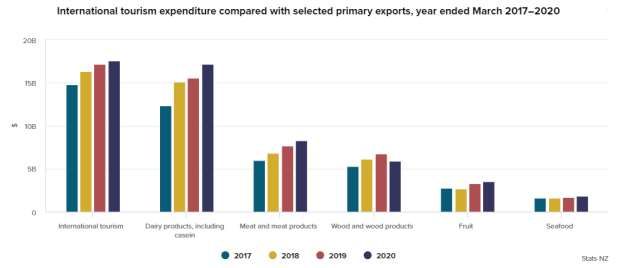
Crown copyright ©
See Copyright and terms of use for our copyright, attribution, and liability statements.

Citation
Stats NZ (2020). Tourism satellite account: Year ended March 2020. Retrieved from www.stats.govt.nz.

ISSN 1177-6226 (online)

Published in December 2020 by
Stats NZ Tatauranga Aotearoa
Wellington, New Zealand

Contact
Stats NZ Information Centre: info@stats.govt.nz
Phone toll-free 0508 525 525
Phone international +64 4 931 4600

www.stats.govt.nz
Tourism satellite account: Year ended March 2020

Contents
List of tables and figures.................................................................................................... 4

Purpose and key provisional estimates .............................................................................. 6
    Purpose .................................................................................................................................. 6
    Key provisional estimates ...................................................................................................... 6
    Revisions ................................................................................................................................ 6

About the tourism satellite account................................................................................... 8
    Value added ........................................................................................................................... 8

Results............................................................................................................................ 10
    Results by topic for the year ended March 2020 ................................................................ 10
    Key events that influenced tourism for year ended March 2020 ........................................ 25
    Key events that influenced tourism for year ended March 2019 ........................................ 26
    Key events that influenced tourism for year ended March 2018 ........................................ 27
    Key events that influenced tourism for year ended March 2017 ........................................ 28

Tourism expenditure ....................................................................................................... 30

Tourism supply ............................................................................................................... 35

Tourism value added ....................................................................................................... 38
    Direct tourism value added ................................................................................................. 38
    Indirect tourism value added and imports .......................................................................... 39

Tourism employment ...................................................................................................... 41

Tourism industry profitability .......................................................................................... 42

Detailed product and industry tables, year ended March 2019 ......................................... 44

Glossary.......................................................................................................................... 53
    National accounts definitions .............................................................................................. 53
    Abbreviations used in this report ........................................................................................ 54

References and data sources ........................................................................................... 55
    References ........................................................................................................................... 55
    Data sources ........................................................................................................................ 55

Appendix 1: Conceptual framework................................................................................. 56
    Definitions ............................................................................................................................ 56
    Valuation basis used in tourism satellite accounts .............................................................. 58

                                                                            3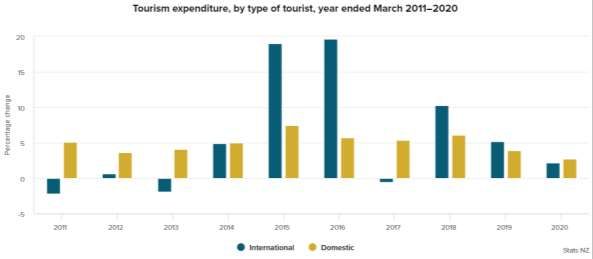
Tourism satellite account: Year ended March 2020

    Tourism products ................................................................................................................. 59
    Industries producing tourism products ............................................................................... 60
    Reference for appendix ....................................................................................................... 62

Appendix 2: Methodology ............................................................................................... 63
    Direct tourism value added ................................................................................................. 63
    Calculating tourism expenditure ......................................................................................... 63
    Production of tourism goods and services .......................................................................... 71
    Balancing tourism expenditure and tourism production .................................................... 71
    Calculating direct tourism value added ............................................................................... 72
    Direct tourism employment ................................................................................................ 73
    Tourism industry profitability .............................................................................................. 74
    Indirect effects of tourism ................................................................................................... 74
    Supply and use framework .................................................................................................. 75
    Employment source data ..................................................................................................... 76
    Special treatments ............................................................................................................... 78
    Appendix 2 references ......................................................................................................... 80

Appendix 3: Tourism product classification ...................................................................... 81

Appendix 4: Tourism industry concordance ..................................................................... 84

List of tables and figures
List of tables
1. Tourism expenditure by component, year ended March 1999–2020 .............................................. 11
2. Tourism expenditure by type of tourist, year ended March 1999–2020 ......................................... 13
3. International tourism expenditure compared with selected primary exports, year ended March
    1999–2020 ....................................................................................................................................... 15
4. International student studying less than 12 months, year ended March 1999–2020 ..................... 17
5. Cruise ship expenditure in New Zealand, year ended June 2017–2020 ........................................... 18
6. Cruise ship expenditure in New Zealand, by regions and ports visited, year ended June
    2017–2020 ....................................................................................................................................... 19
7. Tourism employment, year ended March 2000–2020 ..................................................................... 20
8. Overseas visitor arrivals, year ended March 2017–2020.................................................................. 22
9. Selected overseas visitor arrivals, year ended March 2017–2020 ................................................... 23
10. Guest nights by origin, year ended March 2016–2019 ................................................................... 24
11. Tourism expenditure by type of product, year ended March 2017–2020 ..................................... 30
12. Tourism expenditure, by type of product and type of tourist, year ended March 2017–2020 ..... 32
13. Derivation of tourism supply from total supply, year ended March 2017–2020 ........................... 36
14. Direct tourism value added, year ended March 2017–2020 .......................................................... 38
15. Tourism expenditure by component, year ended March 2017–2020 ............................................ 40
16. Share of tourism expenditure by component, year ended March 2017–2020 .............................. 40

                                                                           4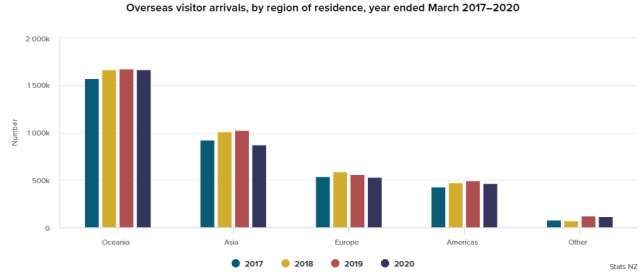
Tourism satellite account: Year ended March 2020

17. Direct tourism employment, year ended March 2017–2020 ......................................................... 41
18. Tourism gross operating surplus and gross mixed income as a percentage of total tourism output,
   year ended March 2015–2019......................................................................................................... 42
19. Tourism expenditure, by type of product and type of tourist, year ended March 2019 ............... 45
20. New Zealand System of National Accounts production accounts, by industry, year ended
   March 2019 ...................................................................................................................................... 46
21. Sales by type of product and industry, year ended March 2019 .................................................... 47
22. Derivation of tourism product ratios, year ended March 2019 ...................................................... 48
23. Derivation of tourism industry ratios, year ended March 2019 ..................................................... 49
24. Derivation of direct tourism value added, year ended March 2019 .............................................. 50
25. Direct tourism employment, by industry, year ended March 2019 ............................................... 51
26. Gross fixed capital formation and net capital stock, by industry, year ended March 2019 ........... 52
27. Tourism product classification ........................................................................................................ 81
28. Tourism industry concordance ....................................................................................................... 84

List of figures
1. Flows of tourism expenditure through the New Zealand economy, year ended March 2020 .......... 7
2. Share of tourism expenditure, by component, year ended March 2020 ......................................... 12
3. Percentage change in tourism expenditure by type of tourist, year ended March 2011–2020 ...... 14
4. International tourism expenditure ($) compared with selected primary exports, year ended March
    2017–2020 ....................................................................................................................................... 16
5. International student (studying less than 12 months) expenditure and international tourism
    expenditure ($), year ended March 2017–2020 .............................................................................. 17
6. Number of people employed in tourism, year ended March 2011–2020 ........................................ 21
7. Overseas visitor arrivals by region of residence, year ended March 2017–2020............................. 22
8. Overseas visitor arrivals by selected countries of residence, year ended March 2017–2020 ......... 23
9. Guest nights by origin, year ended March 2016–2019 ..................................................................... 24
10. Share of tourism expenditure by type of product, year ended March 2020 .................................. 31
11. Share of tourism expenditure by type of product and tourist, year ended March 2020 ............... 34
12. Tourism gross operating surplus and gross mixed income as a percentage of total tourism output,
    year ended March 2015–2019......................................................................................................... 43

                                                                           5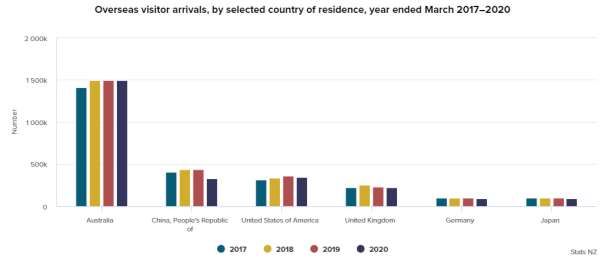
Tourism satellite account: Year ended March 2020

Purpose and key provisional estimates
Purpose
Tourism satellite account: Year ended March 2020 provides a picture of the role tourism plays in
New Zealand, with information on the changing levels and impact of tourism activity. It presents
information on tourism’s contribution to the New Zealand economy in terms of expenditure and
employment. Results cover provisional figures for the year ended March 2020 and detailed results
for 2019.

Key provisional estimates
Note: The March 2020 annual estimates featured capture a very limited period of the initial
emergence and impact of COVID-19 in New Zealand. The extent of COVID-19’s impact will be evident
in Tourism satellite account: Year ended March 2021, to be published in December 2021.

Key provisional estimates for the year ended March 2020:
    •   Total tourism expenditure was $41.9 billion, an increase of 2.4 percent ($1.0 billion) from
        the previous year.
    •   International tourism expenditure increased 2.2 percent ($371 million) to $17.5 billion, and
        contributed 20.1 percent to New Zealand’s total exports of goods and services.
    •   International student expenditure (studying less than 12 months) was $4.2 billion, an
        increase of 7.7 percent.
    •   Domestic tourism expenditure increased 2.7 percent ($629 million) to $24.4 billion.
    •   Tourism generated a direct contribution to GDP of $16.4 billion, or 5.5 percent of GDP.
    •   The indirect value added of industries supporting tourism generated an additional $11.3
        billion, or 3.8 percent of GDP.
    •   225,384 people were directly employed in tourism (8.0 percent of the total number of
        people employed in New Zealand), an increase of 2.5 percent from the previous year.
    •   Tourists generated $3.9 billion in goods and services tax (GST) revenue, with $1.8 billion
        coming from international tourists.
    •   Overseas visitor arrivals to New Zealand decreased 5.6 percent.

Revisions
Tourism satellite account: Year ended March 2020 includes revisions made to both the domestic and
international tourism expenditure series. These revisions cause changes to the value of tourism
expenditure in the New Zealand economy, and affect the official tourism satellite account (TSA) time
series.

Revisions to the expenditure series included:
    •   historic changes to export education source data used to derive international student
        expenditure from 2016
    •   methodological improvements:
            o integrating revised annual enterprise survey (AES) data (2015–2018) and 2019 with
                 Household tourism expenditure estimates (HTEE)
            o updated HTEE supplementary data sources
            o national accounts data, including revised nominal GDP statistics from 2007 to 2019
                 2020 national accounts improvements preview.

Revisions were also made to annual linked employer-employee data and household labour force
survey sources used in determining tourism employment.
                                                  6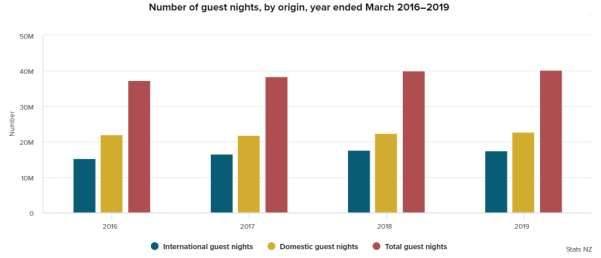
Tourism satellite account: Year ended March 2020

Tourism industry ratios are impacted because of these expenditure revisions. These ratios are the
proportion of an industry’s output that is consumed by tourists and are used to calculate value-
added and tourism employment estimates. As a result of the ratio changes, we revised the historical
value added-time series. Together with the ratio changes, we also revised the tourism employment
time series.

Figure 1 traces the flows of tourism expenditure through the New Zealand economy for the year
ended March 2020. It shows the value tourism adds to the New Zealand economy, both directly and
indirectly, the GST received by government, the imports of goods and services, and direct and
indirect employment.

Figure 1
1. Flows of tourism expenditure through the New Zealand economy, year ended March 2020

                                                                                         7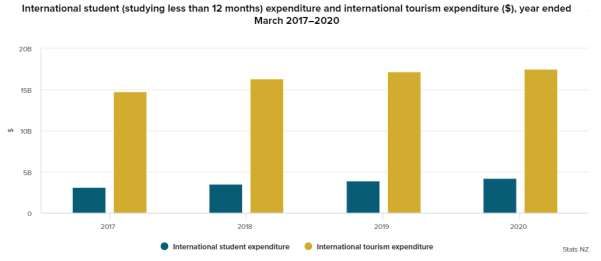
Tourism satellite account: Year ended March 2020

About the tourism satellite account
We develop and publish the tourism satellite account, using a United Nations World Tourism
Organization framework, with funding from the Ministry of Business, Innovation and Employment.
The tourism satellite account is part of a core set of tourism data that provides base information for
understanding and monitoring tourism activity in New Zealand. Other elements of the core dataset
include a survey of spending by international visitors, regional tourism expenditure estimates, visitor
arrival and accommodation statistics, and forecasts of international tourist numbers and
expenditure.

A tourism satellite account integrates data about the supply and use of tourism-related goods and
services into a single format. It summarises the contribution tourism makes to production and
employment, and is consistent and integrated with New Zealand’s official national accounts. This
ensures that the importance of the tourism sector is measured and understood in the context of the
New Zealand economy as a whole. New Zealand’s tourism satellite account (TSA) measures
expenditure in New Zealand by both resident and non-resident tourists, and thus gives a picture of
the overall size of the tourism industry, including its contribution to gross domestic product (GDP)
and employment.

Tourism, unlike ‘conventional’ industries such as agriculture or manufacturing that are classified
according to the goods and services they produce, is defined by the characteristics of the customer
demanding tourism products. Tourism products can cut across standard industry definitions, and
therefore require a different approach.

Satellite accounts are an extension of the core national accounts, and involve rearranging existing
information in the national accounts so that an area of particular economic or social importance can
be analysed more closely. As extensions of the core system of national accounts, satellite accounts
are an important recommendation of the international standard, the System of National Accounts
2008 (Inter-Secretariat Working Group on National Accounts, 2008).

We present both final and provisional estimates in Tourism satellite account: Year ended March
2020. The supply and use framework provides a detailed picture of the economy broken down by
industry, product, primary input, and final demand categories. It is the starting point for deriving
final accounts. To give a more timely picture of the impact of tourism, we prepare provisional TSAs,
using fewer data sources than final year estimates. The provisional estimates are presented in a less
detailed format, and are revised as relevant data sources become available. As balanced supply and
use tables are completed for the relevant years (as part of the ongoing production of the New
Zealand System of National Accounts), we replace provisional results with final year estimates.

Tourism satellite account: Year ended March 2020 presents results for the March 2020 year at the
aggregated provisional estimate level in current prices.

Detailed product and industry tables, year ended March 2019 contains results for the latest final
account year.

Value added
Value added is the ‘value’ businesses add to the goods and services they purchase (intermediate
inputs) and use in producing their own outputs. The measurement of tourism’s direct value added,
also known as tourism’s direct contribution to GDP, is the major focus of the TSA. As direct value
added for tourism is measured on the same basis as that used for industries in the national accounts,
it enables a consistent comparison between the tourism industry’s contribution to GDP and that of
more traditional industries such as agriculture and construction.

                                                   8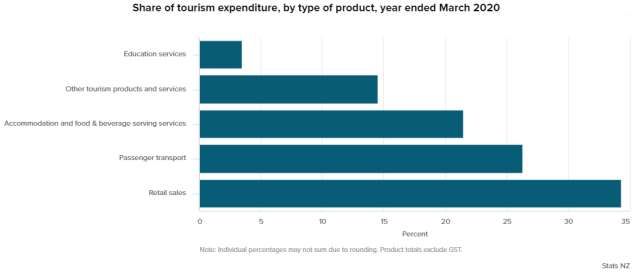
Tourism satellite account: Year ended March 2020

Direct value added does not measure the full impact of tourism on the New Zealand economy
because it is limited to businesses that have a direct relationship with tourists. Additional value
added comes from tourism through producing the intermediate inputs used in producing goods and
services sold to tourists, although there is no direct relationship between the producer of the
intermediate inputs and the tourist. This additional value added is known as indirect value added.

                                                 9
Tourism satellite account: Year ended March 2020
Results
Tourism plays a significant role in the New Zealand economy in terms of producing goods and
services and creating employment opportunities. Tourism expenditure includes spending by all
travellers, whether they are international, resident householders, or business and government
travellers. International tourism expenditure includes spending by foreign students studying in New
Zealand for less than 12 months.
See:
• Results by topic for the year ended March 2020
• Key events that influenced tourism for year ended March 2020
• Key events that influenced tourism for year ended March 2019
• Key events that influenced tourism for year ended March 2018
• Key events that influenced tourism for year ended March 2017
See also section Detailed product and industry tables, year ended March 2019.
Results by topic for the year ended March 2020
Tourism expenditure
Total tourism expenditure increased 2.4 percent to $41.9 billion, following an increase of 4.4 percent
in the March 2019 year.
Tourism expenditure generated $16.4 billion of direct value added, representing a 5.5 percent
contribution to GDP. A further $11.3 billion of indirect value-added activity was recorded (see table
1).
10Tourism satellite account: Year ended March 2020
Table 1
1. Tourism expenditure by component, year ended March 1999–2020
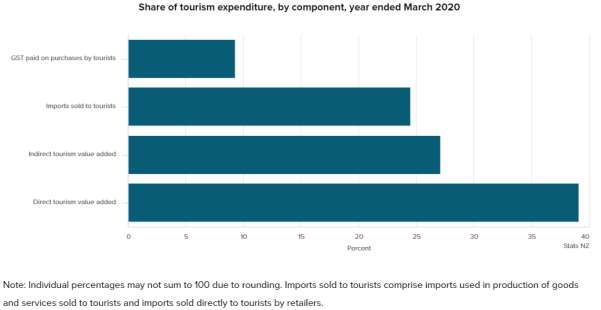
Direct and indirect tourism value added, when combined, accounted for 66.2 cents for every dollar
spent by tourists, while GST accounted for 9.3 cents for every dollar spent by tourists. The remainder
represents imports (see figure 2).
11Tourism satellite account: Year ended March 2020
Figure 2
2. Share of tourism expenditure, by component, year ended March 2020
Tourism expenditure by type of tourist
International tourism expenditure increased 2.2 percent, following a 5.2 percent increase in the
March 2019 year. Domestic tourism expenditure increased 2.7 percent, following a 3.9 percent
increase in the previous year (see table 2 and figure 3).
12Tourism satellite account: Year ended March 2020
Table 2
2. Tourism expenditure by type of tourist, year ended March 1999–2020
13Tourism satellite account: Year ended March 2020
Figure 3
3. Percentage change in tourism expenditure by type of tourist, year ended March 2011–2020
Exports
International tourism continues to be a significant export earner for New Zealand, compared with
other traditional export products (see table 3 and figure 4).
In the year ended March 2020, international tourism’s contribution to total exports was $17.5 billion
(20.1 percent of exports). The export receipts from dairy products, including casein, totalled $17.1
billion (19.7 percent of exports).
Note that international tourism is compared with selected primary exports.
14Tourism satellite account: Year ended March 2020
Table 3
3. International tourism expenditure compared with selected primary exports, year ended March 1999–2020
15Tourism satellite account: Year ended March 2020
Figure 4
4. International tourism expenditure ($) compared with selected primary exports, year ended March 2017–2020
International student expenditure – studying less than 12 months
Included in international tourism expenditure is the component of international students studying in
New Zealand for less than 12 months (consistent with the definition of a tourist). Expenditure by
international students studying for less than 12 months comprises course fees, living costs, and
airfares on resident airlines.
In the year ended March 2020, expenditure reached $4.2 billion, an increase of 7.7 percent (see
table 4 and figure 5). The number of short-term arrivals for education purposes (studying for less
than 12 months) totalled 70,389, up 4.8 percent (see table 8).
Note that the calculation of international students’ expenditure when studying less than 12 months
differs from the calculation of education exports derived from balance of payments data, reflecting
conceptual differences.
16Tourism satellite account: Year ended March 2020
Table 4
4. International student studying less than 12 months, year ended March 1999–2020
Figure 5
5. International student (studying less than 12 months) expenditure and international tourism expenditure ($), year ended March 2017–2020
17Tourism satellite account: Year ended March 2020
Cruise ship expenditure in New Zealand
We present cruise ship expenditure in New Zealand on a year ended June basis (2017–2020) to best
align with the cruise season and cruise traveller statistics (see table 5 and table 6).
Estimates are provided at a national and regional level, by port. Expenditure movements can be
influenced by a range of factors including the number of ship voyages, port visits, a transit versus
exchange cruise, cruise ship capacity, a boutique versus large cruise ship, weather events, economic
conditions, and exchange rates.
Vessel expenditure comprises shipping agents (ship visit logistics), bunkering (providing marine
fuels), and providoring (providing produce and other supplies) sourced from key firms involved.
Visitor expenditure comprises shore excursions (predominantly pre-booked), including overland
tours, and spending ashore. Shore excursions expenditure is sourced from several key firms and
combined with a card transaction-based model to estimate total spending by passengers and crew.
A vessel and visitor expenditure breakdown by region by port is not possible due to the
confidentiality of businesses providing data.
Airfares for international passengers and crew are excluded, as is cruise expenditure by domestic
passengers (New Zealand passport holders). The domestic expenditure undertaken by passengers is
recorded within existing domestic tourism estimates but is not currently separately identifiable.
Cruise ship expenditure by international visitors has additional methodological information.
In the year ended June 2020, cruise ship expenditure in New Zealand totalled $547.1 million, a
decrease of 3.2 percent (see table 5).
Auckland and Tauranga ports recorded the largest total spending. In the year ended June 2020,
Auckland spend totalled $207.6 million, up 9.5 percent, with Tauranga recording $74.3 million, down
16.8 percent (see table 6).
Cruise ship traveller and expenditure statistics: Year ended June 2020 has additional information
surrounding COVID-19’s impact on the sector, as well as cruise traveller statistics.
Table 5
5. Cruise ship expenditure in New Zealand, year ended June 2017–2020
18Tourism satellite account: Year ended March 2020
Table 6
Cruise ship expenditure in New Zealand, by regions and port visited, year ended June 2017–2020
6. Cruise ship expenditure in New Zealand, by regions and ports visited, year ended June 2017–2020
19Tourism satellite account: Year ended March 2020
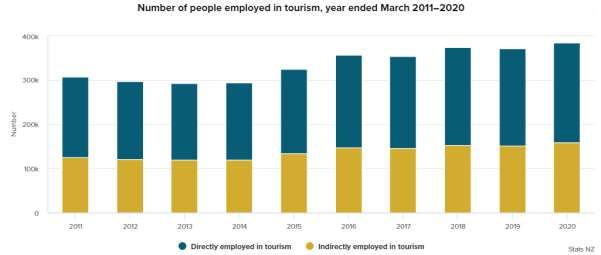
Employment
In the year ended March 2020, tourism directly employed 225,384 people (see table 7 and figure 6).
Tourism activity directly generated 8.0 percent of total employment in New Zealand (see table 7).
This compares with tourism generating 5.5 percent of direct value added to GDP (see table 1). The
fact that tourism contributes more to total employment than it does to direct value added, reflects a
higher level of labour intensity in tourism industries.
A further 158,802 were indirectly employed in tourism generating an additional 5.6 percent share of
total employment.
Table 7
7. Tourism employment, year ended March 2000–2020
20Tourism satellite account: Year ended March 2020
Figure 6
6. Number of people employed in tourism, year ended March 2011–2020
Overseas visitor arrivals
Everyone who completes border clearance, regardless of whether they travel by air or by sea, is
counted in the arrivals/departures of International travel statistics. Transit passengers who do not
complete border clearance are not included in international travel statistics.
With regard to cruise ship travellers, based on analysis covering 2015–2020, about three-quarters of
cruise ship passengers visiting New Zealand are transit passengers. These travellers are not included
in international travel statistics. The remaining one-quarter are passengers who enter or leave New
Zealand by air, before or after travelling by cruise ship. These passengers complete border clearance,
which includes completing arrival cards, and are included in international statistics.
The number of international visitors decreased 5.6 percent (215,789) in the year ended March 2020,
following an increase of 1.3 percent in the previous year. Visitor numbers from Asia and the
Americas experienced their first annual declines following six consecutive years of increases.
The number of visitors from Asia decreased 14.7 percent (149,984), following a 1.2 percent increase
in the previous year. Visitor numbers from the Americas decreased 5.4 percent (26,440), while
visitors from Europe decreased 5.3 percent (29,443).
By purpose of visit, short-term visitor arrivals to New Zealand changes were recorded for the
following categories:
• holiday – down 9.0 percent (180,729 arrivals)
• visiting friends and relatives – down 2.3 percent (24,252)
• conference and conventions – up 6.6 percent (5,042)
• business – up 6.4 percent (19,525)
• education – up 4.8 percent (3,231).
See table 8 and figure 7 for a breakdown of international visitors by region of last permanent
residence and by purpose of visit for the years ended March 2017–2020.
21Tourism satellite account: Year ended March 2020
Table 8
8. Overseas visitor arrivals, year ended March 2017–2020
Figure 7
7. Overseas visitor arrivals by region of residence, year ended March 2017–2020
22Tourism satellite account: Year ended March 2020
Table 9 presents the breakdown of international visitors by selected country of last permanent
residence for the years ended March 2017–2020 (see also figure 8).
Table 9
9. Selected overseas visitor arrivals, year ended March 2017–2020
Figure 8
8. Overseas visitor arrivals by selected countries of residence, year ended March 2017–2020
By country of last permanent residence, the majority of short-term visitor arrivals to New Zealand in
the year ended March 2020 originated from these selected markets:
• Australia – up 0.0 percent (252 arrivals)
• China – down 24.4 percent (106,178)
• United States of America – down 4.1 percent (14,765)
• United Kingdom – down 3.1 percent (7,205)
• Germany – down 10.8 percent (11,040)
• Japan – down 9.0 percent (8,974).
23Tourism satellite account: Year ended March 2020
In the context of the TSA, the term ‘tourist’ includes travellers who might not usually be associated
with the term. For instance, in addition to holiday and leisure travel, it covers other visitor activities,
such as conducting business, attending meetings and conferences, and arriving for short-term
education. Domestic costs incurred by New Zealanders travelling overseas (such as booking fees or
commissions paid to the travel agency) are included in domestic travel expenditure, as well as
tourism-specific consumer durable goods (such as outdoor items and equipment) bought either
before or after the trip.
Table 10 presents the breakdown of guest nights by origin, sourced from Stats NZ’s accommodation
survey, for the years ended March 2016–2019 (see also figure 9).
Note: The accommodation survey is no longer produced by Stats NZ. Results featured are up to the
March 2019 year, with the last results for the September 2019 month published in November 2019.
In the year ended March 2019, 40.2 million guest nights were spent in short-term commercial
accommodation, a 0.6 percent increase compared with the previous year. This follows an increase of
3.9 percent in the year ended March 2018 and an increase of 3.2 percent in the year ended March
2017. For the first time in five years, the percentage change in international guest nights was below
that of domestic.
Table 10
10. Guest nights by origin, year ended March 2016–2019
Figure 9
9. Guest nights by origin, year ended March 2016–2019
24Tourism satellite account: Year ended March 2020
Key events that influenced tourism for year ended March 2020
• Significant events in the year ended March 2020 included:
o The COVID-19 pandemic caused by severe acute respiratory syndrome coronavirus 2
(SARS-CoV-2) was first identified in December 2019 in Wuhan, China.
o The World Health Organization declared the outbreak a public health emergency of
international concern in January 2020 and a pandemic in March 2020.
o New Zealand recorded its first COVID-19 case on 28 February 2020.
o On 14 March, the Government announced anyone entering New Zealand must self-
isolate for 14 days, except those arriving from the Pacific.
o On 19 March, all indoor gatherings of more than 100 people were cancelled, and
borders closed to all but New Zealand citizens and permanent residents.
o On 21 March, the Government introduced a 4-tiered alert level system to help
combat COVID-19 with New Zealand at alert level 2.
o On 23 March, New Zealand moved to alert level 3.
o On 25 March, at 12.21pm, a state of national emergency was declared. At 11:59pm,
New Zealand moved to alert level 4, and the entire nation went into self-isolation.
o A volcanic eruption on Whakaari/White Island in December 2019 resulted in the
death of 22 people, including two who are missing and declared dead, and a further
25 people suffered serious injuries.
o Cathay Pacific took over Air New Zealand’s summer operations of the Hong Kong-
Auckland return service covering the first quarter of 2020. This was in response to
issues encountered with Rolls-Royce engines on its Boeing 787-9 aircraft first
encountered in December 2017.
o Air New Zealand commenced non-stop services between Auckland and Seoul in
November 2019.
o Jetstar withdrew regional services at the end of November 2019 between Auckland
and Napier, Nelson, New Plymouth, and Palmerston North, as well as between
Nelson and Wellington.
o In response to Jetstar’s withdrawal of regional services, Air New Zealand announced
additional services between Auckland and Napier, New Plymouth, Nelson and
Palmerston North, as well as between Nelson and Wellington.
o Air New Zealand commenced a direct scheduled jet service between Auckland and
Invercargill in late August 2019.
o Air New Zealand and Cathay Pacific extended their joint venture alliance for a
further five years.
o Air Chatham’s began an Auckland to Norfolk Island service in September 2019.
o Singapore Airlines increased the number of services on the Wellington-Singapore
route via Melbourne while introducing the A350-900 aircraft.
o Cathay Pacific commenced a third summer season between Christchurch and Hong
Kong featuring additional flights and capacity.
o Korean Air commenced 10 summer seasonal return services between Christchurch
and Seoul Incheon from late December 2019.
o The Easter public holidays occurred in the year ended March 2020, partly in the year
ended March 2019 and 2018, and did not occur in the year ended March 2017.
25Tourism satellite account: Year ended March 2020
Key events that influenced tourism for year ended March 2019
• Significant changes to flights in the year ended March 2019 included:
o Air New Zealand added six additional weekly return services between Auckland and
Dunedin.
o Air New Zealand added 12 additional weekly flights between Palmerston North and
Auckland, and 12 additional weekly flights between Napier and Auckland.
o Air New Zealand increased its service between Queenstown and Wellington to two
return flights daily from November to March.
o Air New Zealand suspended its service between Auckland and the Kāpiti Coast.
o Air New Zealand began non-stop services between Auckland and Taipei.
o Air New Zealand launched services between Auckland and Chicago using a Boeing
787-9 Dreamliner.
o Air New Zealand began two new trans-Tasman routes – services between
Queenstown and Brisbane, and between Wellington and Brisbane.
o Air New Zealand added additional services from Auckland and Christchurch to
Melbourne, Brisbane, and Sydney.
o Air New Zealand added a Monday return service between Auckland and Gold Coast.
o Air New Zealand increased its service between Auckland and Bali to five times a
week during peak times.
o Air New Zealand increased its service between Auckland and Honolulu from April to
October, adding almost 60,000 extra seats.
o Air New Zealand added 16,000 seats on its service between Auckland and Houston
from March to October.
o Air New Zealand increased its capacity on the service between Auckland and
Vancouver during the year.
o Air New Zealand added nearly 6,000 seats to its seasonal service between
Christchurch and Nadi.
o Air New Zealand and Qantas agreed to codeshare on New Zealand and Australia
domestic networks.
o Air New Zealand and Virgin Australia ended their trans-Tasman alliance.
o Air New Zealand and Singapore Airlines increased services to daily between
Auckland and Singapore from October to March.
o Emirates began a new daily service from Auckland to Bali then onto Dubai.
o Air Tahiti began a service between Auckland and Papeete flying three times a week.
o Virgin Australia resumed their winter service between Christchurch and Rarotonga
from June to October.
o Singapore Airlines rerouted the service between Wellington and Singapore through
Melbourne.
o China Southern Airlines commenced a Boeing 787-9 service between Christchurch
and Guangzhou.
26Tourism satellite account: Year ended March 2020
Key events that influenced tourism for year ended March 2018
• Significant changes to flights in the year ended March 2018 included:
o Air New Zealand added 180,000 extra domestic seats across its network between
November 2017 and March 2018.
o Air New Zealand added a Sunday return jet service between Dunedin and Auckland.
o Air New Zealand added nearly 1000 seats to accommodate competitors in the
Hawke’s Bay International Marathon held in May.
o Air New Zealand added more than 7100 extra seats into Auckland and Dunedin to
accommodate fans attending Ed Sheeran’s concerts. Air New Zealand commenced
services between Auckland and Haneda Tokyo.
o Air New Zealand deployed additional capacity between Auckland and Wellington for
the All Whites versus Peru FIFA World Cup Intercontinental Playoff held in
Wellington in November.
o Air New Zealand began Boeing 787-9 Dreamliner services between Auckland and
Adelaide.
o Air New Zealand increased services from Auckland to Houston deploying its Boeing
787-9 Dreamliner aircraft.
o Air New Zealand increased its Auckland to Vancouver services from January 2018.
o Air New Zealand moved to Boeing 787-9 Dreamliner and Boeing 777-200 services at
least twice weekly year-round between Auckland and Apia.
o Air New Zealand leased Airbus 330 and Airbus 340 from Hi Fly to operate some
Auckland–Sydney and Auckland–Perth services.
o Air New Zealand was forced to reschedule international flights and make
cancellations as a result of issues, and the need for early maintenance checks, with
Rolls-Royce engines across some of its Boeing 787-9 Dreamliner aircraft.
o The temporary shut-down of Refining New Zealand’s pipeline into Auckland
impacted airlines operations into and out of Auckland Airport.
o Sunair returned to Whangarei with weekday flights offered to Great Barrier Island,
Hamilton, Tauranga or Rotorua. Sunair was subsequently grounded by the Civil
Aviation Authority.
o Originair commenced flights between Nelson and New Plymouth.
o Sounds Air ceased flights between Blenheim and Kaikoura.
o Sounds Air added new flights on the Wellington to Blenheim route.
o Sichuan Airlines began direct flights from Chengdu to Auckland.
o Cathy Pacific began a new seasonal service on the Airbus A350 between Hong Kong
and Christchurch.
o China Southern Airlines increased its services between Guangzhou and Christchurch
during the summer season.
o Philippine Airlines began Airbus A340 services direct from Manila to Auckland.
o Thai Airways increased its services from Bangkok to Auckland, offering daily flights.
o Nauru Airlines began services from Norfolk Island to Auckland.
o Virgin Australia began after-dark services between Brisbane and Queenstown.
27Tourism satellite account: Year ended March 2020
o Qantas began after-dark services between Sydney and Queenstown.
o Jetstar reintroduced services between Wellington and Queenstown.
• The 2017 British and Irish Lions Rugby Tour generated international and domestic
tourism activity within New Zealand during the year ended March 2018.
Key events that influenced tourism for year ended March 2017
• Significant changes to flights in the year ended March 2017 included:
o Air New Zealand and Jetstar commenced evening flights into Queenstown, following
investment in a series of major airfield infrastructure improvements.
o Air New Zealand began operating an all-jet-schedule between Dunedin and
Wellington on weekdays.
o Air New Zealand increased capacity on several regional routes including Auckland–
Kerikeri, Auckland–Rotorua, Gisborne–Auckland, and Gisborne–Wellington.
o New Zealand suspended services between Whanganui–Auckland and Blenheim–
Christchurch.
o Air New Zealand reinstated seasonal flights between Auckland and Osaka.
o Air New Zealand began services between Auckland and Ho Chi Minh City.
o Air New Zealand began Boeing 787-9 Dreamliner services between Auckland and
Hawaii.
o Air New Zealand began Boeing 787-9 Dreamliner services on the Auckland–Buenos
Aires route.
o Air New Zealand and Singapore Airlines announced the extension of their alliance to
include travel between Wellington and Singapore.
o Air New Zealand began Boeing 787-9 Dreamliner services between Auckland and
Rarotonga.
o Air New Zealand began Boeing 787-9 Dreamliner services on the Auckland–Papeete
route.
o Air New Zealand and Cathay Pacific extended their strategic alliance partnership on
services between New Zealand and Hong Kong through until 2022.
o Air Chathams began scheduled services between Auckland and Whanganui.
o Sounds Air began services between Christchurch and Blenheim.
o Kiwi Regional Airlines ceased operations.
o Qatar Airways began a daily, non-stop service between Auckland and Doha,
becoming the world’s longest commercial passenger flight.
o Emirates introduced the double-decker A380 on its daily Auckland–Dubai service
replacing its Boeing 777-200LR.
o United Airlines began flights between Auckland and San Francisco.
o Hong Kong Airlines began services between Auckland and Hong Kong.
o American Airlines began daily services between Auckland and Los Angeles.
o Tianjin Airlines began flights between Auckland and Tianjin.
o Hainan Airlines began flights between Auckland and Shenzhen.
28Tourism satellite account: Year ended March 2020
o Qantas expanded it seasonal service between Christchurch and Brisbane to an all-
year-round service.
o More than 300 additional return flights were provided direct to Christchurch from
Sydney, Melbourne, and Brisbane during the ski season.
o Asiana Airlines began a summer charter service between Christchurch and Incheon.
o Emirates introduced the A380 on its Christchurch–Sydney–Dubai service.
o Fiji airways began a third service between Christchurch and Nadi.
o China Southern Airlines increased its services into Christchurch over the summer
season.
o Singapore Airlines began the Capital Express service from Singapore via Wellington
via Canberra.
o Jetstar suspended direct flights between Wellington to Melbourne.
• MS Ovation of the Seas, the biggest cruise ship to voyage to New Zealand, visited Milford
Sound, Dunedin, Picton, Wellington, Napier, Tauranga, Auckland, and Bay of Islands.
• A damaging earthquake struck the Kaikoura district and surrounding regions in November
2016. The expenditure implications/impacts of this event are not separately identifiable.
• Air New Zealand disposed of its remaining stake in Virgin Australia.
• Tourism 2020 – Two Years On was published, reaffirming the Tourism 2025 growth
framework and its five themes of Connectivity; Target for value; Visitor Experience;
Productivity; and Insight.
• Tourism New Zealand launched the latest evolution of its 100% Pure New Zealand campaign
across international tourism markets.
29Tourism satellite account: Year ended March 2020
Tourism expenditure
The major focus of the TSA is to identify and measure tourism expenditure on goods and services
produced within the New Zealand economy.
By determining tourism expenditure, tourism’s direct contribution to GDP can be derived and
compared with the contribution of other industries such as agriculture or manufacturing, see table
11.
Table 11
11. Tourism expenditure by type of product, year ended March 2017–2020
Table 11 shows that for the year ended March 2020:
• Total tourism expenditure increased 2.4 percent, following increases of 4.4 percent in 2019
and 7.8 percent in 2018.
• The strongest increases in tourism expenditure were in:
o retail sales – other, increased $313 million (4.0 percent)
o education services, increased $183 million (15.8 percent)
o other tourism products, increased $176 million (5.4 percent).
• The sole decrease in tourism expenditure was in air passenger transport, down $186 million
(3.3 percent).
The main products tourists purchased were retail sales and passenger transport, which contributed
34.3 percent and 26.3 percent, respectively. Tourists spent 21.5 percent of their budget on
accommodation, and food and beverage serving services. They spent 14.5 percent on other tourism
products and services, and 3.5 percent on education services (see figure 10, which presents the
share of tourism expenditure, excluding GST).
30Tourism satellite account: Year ended March 2020
Figure 10
10. Share of tourism expenditure by type of product, year ended March 2020
Table 12 presents tourism expenditure by type of product and by type of tourist for the years ended
March 2017–2020. The tourism product ratio is the proportion of total supply (national production
plus imports) of each product that tourists purchase.
For the year ended March 2020:
• Total household tourism expenditure increased 1.8 percent, following an increase of 0.7
percent the previous year.
• The increase in household tourism expenditure was strongest in retail sales – other, up $256
million. Education services increased $117 million from the previous year, with other
tourism products increasing $112 million.
• Between 2017 and 2020, total household tourism spending increased 9.2 percent. Over the
same period, total household consumption expenditure increased 18.1 percent.
• Total spending by international tourists in New Zealand increased 2.2 percent, following an
increase of 5.2 percent in the March 2019 year, and an increase of 10.3 percent in the March
2018 year.
• The increase in international tourism expenditure was strongest in education services, up
$66 million. Retail sales – other increased $56 million from the previous year, while
accommodation services increased $55 million.
31Tourism satellite account: Year ended March 2020
Table 12
12. Tourism expenditure, by type of product and type of tourist, year ended March 2017–2020
Table continues next page
32Tourism satellite account: Year ended March 2020
Table 12 continued
33Tourism satellite account: Year ended March 2020
The biggest share of domestic demand was retail sales, at 39.7 percent, while international tourism’s
demand of retail represented only 26.6 percent of international spending. International tourists
spent the remainder of their budget primarily on accommodation, and food and beverage serving
services (29.7 percent), and passenger transport (25.1 percent) (see figure 11).
Figure 11
11. Share of tourism expenditure by type of product and tourist, year ended March 2020
34Tourism satellite account: Year ended March 2020
Tourism supply
The tourism supply of an industry is derived by summing the value of tourism products sold by that
industry. The value of tourism product sales is derived by multiplying the total supply (national
production plus imports) by its corresponding tourism product ratio.
In the absence of supply and use tables for the year ended March 2020, we derived an initial value of
supply by product by industry for the same period from a variety of sources (covered in detail in
appendix 2: Methodology). In table 13, supply by product is shown only for tourism-characteristic
industries (see appendix 1: Conceptual framework).
Table 13 shows total supply and tourism supply by product for the years ended March 2017–2020.
Points to note from table 13:
• Goods and services can be consumed/purchased by tourists and non-tourists. The tourism
product ratio indicates the proportion of a product’s supply that is purchased by tourists. In
2020, for example, the tourism product ratio for accommodation services was 0.95. This
means that almost all accommodation available was purchased by tourists. In contrast,
tourists purchased only 0.18 of retail supplies of fuel and other automotive products.
• Tourism supply increased 2.4 percent in the March 2020 year. From 2017 to 2020, tourism
supply increased at a slower rate than total supply (15.4 percent compared with 19.7
percent over this period).
• Imports sold directly to tourists represented 11.7 percent of total tourism supply in the
March 2020 year, compared with 11.2 percent in the year ended March 2017.
35Tourism satellite account: Year ended March 2020
Table 13
13. Derivation of tourism supply from total supply, year ended March 2017–2020
Table continues next page
36Tourism satellite account: Year ended March 2020
Table 13 continued
37Tourism satellite account: Year ended March 2020
Tourism value added
Direct tourism value added
Direct tourism value added calculations are usually made at a finer level of industry detail than is
presented in table 14. For reasons of confidentiality and practicality, we show only the working level
of calculations in this report.
We calculate the tourism industry ratio by dividing tourism supply by industry by the total supply for
that industry. The tourism industry ratio represents the proportion of each industry’s output that is
consumed by tourists.
We multiply tourism industry ratios through each production account for all industries to produce
direct tourism value added, see table 14 for the years ended March 2017–2020.
Table 14
14. Direct tourism value added, year ended March 2017–2020
Point to note from table 14:
• Between 2017 and 2020, direct tourism value added (also referred to as tourism’s direct
contribution to GDP) increased 13.7 percent, a slower rate than the contribution to GDP
from domestic production, which increased 19.3 percent.
As shown in figure 1, total expenditure on goods and services by tourists ($41.9 billion in 2020)
consists of three components:
• Goods and services worth $33.6 billion produced in New Zealand and directly purchased by
tourists. Direct tourism output consisted of $1.8 billion of intermediate inputs, and $16.4
billion of direct tourism value added.
• Imports of $4.5 billion sold directly to tourists by retailers.
• GST of $3.9 billion paid on goods and services purchased by tourists.
38Tourism satellite account: Year ended March 2020
Domestically produced goods are sold directly to tourists by retailers, and only the retail margin
(production value of the turnover of the retailer) of these sold goods is recorded in the direct
tourism value added. The value added in the production of these goods is not part of tourism direct
gross value added, but is to be considered within the indirect effects.
Indirect tourism value added and imports
As well as measuring direct tourism value added, we report on indirect tourism value added (or
tourism’s indirect contribution to GDP). This broader measure goes beyond the value added
generated by producers directly supplying tourism products, and embraces the total value added of
all producers both directly and indirectly.
Measuring indirect tourism value added involves tracing the flow-on effects of businesses’
intermediate purchases that are used directly in producing tourism products (see figure 1) and
measuring the cumulative value added these purchases generate.
For example, the intermediate purchases of the ‘accommodation’ and ‘food and beverage services’
industries include items such as electricity, bedding, and food purchased from other industries or
imports. In turn, these other industries will have made intermediate purchases from other industries
(or from overseas) to produce the items they sell to the accommodation, and food and beverage
services industries. So the sequence continues, until all intermediate purchases can be directly
accounted for, either as value added or imports.
Measuring indirect tourism’s contribution to GDP involves summing the value added of each
industry that is generated throughout this sequence. The New Zealand TSA covers the intermediate
consumption related to direct tourist expenditure. Total tourism expenditure can be explained in
terms of:
• direct tourism value added
• indirect tourism value added
• imports (those directly sold to tourists and those used indirectly in production)
• GST.
Note that some of tourism’s indirect demand for intermediate inputs will not be met by the output
of New Zealand producers, but by imports that provide no direct contribution to New Zealand’s GDP.
For more information, refer to Quarterly gross domestic product: Sources and methods (fifth
edition) (Stats NZ, 2018).
Direct tourism value added does not necessarily show the same movement as tourism expenditure.
This is because changes in expenditure patterns flow through into the composition of industries that
supply products consumed by tourists.
Changing industry composition flows through into other economic aggregates. This can lead to a
result where the different industries that contribute to tourism have varying value added to output
ratios.
Movements in the value of imports sold directly to tourists and in imports used in the production of
goods and services sold to tourists are strongly influenced by exchange rate variations and changes
in the mix of products purchased.
Table 15 summarises the relationships between the various components of tourism expenditure. In
the year ended March 2020, these imports increased 1.9 percent, and direct tourism value added
increased 2.9 percent.
39Tourism satellite account: Year ended March 2020
Table 15
15. Tourism expenditure by component, year ended March 2017–2020
Tourism expenditure can also be presented by the share of each component, as shown in table 16
for the years ended March 2017–2020.
Table 16
16. Share of tourism expenditure by component, year ended March 2017–2020
40You can also read