Quarterly Update of Australia's National Greenhouse Gas Inventory: March 2021 - Australia's National Greenhouse Accounts
←
→
Page content transcription
If your browser does not render page correctly, please read the page content below
Quarterly Update of Australia’s
National Greenhouse Gas
Inventory: March 2021
Incorporating emissions from the NEM up to June 2021

Australia’s National Greenhouse Accounts

Supporting economic growth and job creation for all Australians | industry.gov.au

© Commonwealth of Australia 2021

Ownership of intellectual property rights

Unless otherwise noted, copyright (and any other intellectual property rights, if any) in this
publication is owned by the Commonwealth of Australia.

Creative Commons licence

Attribution

CC BY

All material in this publication is licensed under a Creative Commons Attribution 4.0 International
Licence, save for content supplied by third parties, logos, any material protected by trademark or
otherwise noted in this publication, and the Commonwealth Coat of Arms.

Creative Commons Attribution 4.0 International Licence is a standard form licence agreement that
allows you to copy, distribute, transmit and adapt this publication provided you attribute the work.
A summary of the licence terms is available from https://creativecommons.org/licenses/by/4.0/

The full licence terms are available from https://creativecommons.org/licenses/by/4.0/legalcode

Content contained herein should be attributed as Quarterly Update of Australia’s National
Greenhouse Gas Inventory: March 2021, Australian Government Department of Industry, Science,
Energy and Resources.

Disclaimer
The Australian Government as represented by the Department of Industry, Science, Energy and
Resources has exercised due care and skill in the preparation and compilation of the information and
data in this publication. Notwithstanding, the Commonwealth of Australia, its officers, employees, or
agents disclaim any liability, including liability for negligence, loss howsoever caused, damage, injury,
expense or cost incurred by any person as a result of accessing, using or relying upon any of the
information or data in this publication to the maximum extent permitted by law. No representation
expressed or implied is made as to the currency, accuracy, reliability or completeness of the
information contained in this publication. The reader should rely on their own inquiries to
independently confirm the information and comment on which they intend to act. This publication
does not indicate commitment by the Australian Government to a particular course of action.

Quarterly Update of Australia’s National Greenhouse Gas Inventory: March 2021                          2

Preface
The Quarterly Update provides estimates of Australia’s national inventory of greenhouse gas
emissions up to the March quarter of 2021, and preliminary estimates of emissions for the year-to-
June quarter 2021.

Emissions for the year to March 2021 are estimated to be 494.2 Mt CO2-e, down 5.3% or
27.8 Mt CO2-e on the previous year. This decline in emissions reflects:

                •              ongoing reductions in emissions from electricity (down 5.6%);
                •              reductions in fugitive emissions (down 8.3%) due, in part, to a reduction in coal production
                               and increases in carbon capture and storage over the year (at Chevron’s Gorgon project on
                               Barrow Island, W.A.), despite operational issues in the March quarter; and
                •              the impact of COVID restrictions throughout the year on emissions from transport (down
                               13.2%).

Since their peak in the year to June 2007, Australia’s greenhouse gas emissions have declined 23.4%.
The emissions in the year to March 2021 are the lowest levels recorded in the National Inventory
and were 20.8% below emissions for the year to June 2005 (Figure P1).

Figure P1: Emissions 12, by quarter, March 2000 to March 2021 (including preliminary June 2021)

                             170

                             160

                             150
      Emissions (Mt CO2-e)

                             140

                             130

                             120

                             110

                             100

                               90

                                                                                 Actual emissions                  Trend

Source: Department of Industry, Science, Energy and Resources

On a quarterly basis, national emission levels for the March quarter 2021 increased 0.3% or 0.4 Mt
CO2-e on the previous quarter, in trend terms. Transport emissions increased 5.2% (1.2 Mt CO2-e),
recovering from the deepest impacts of COVID-related restrictions while there were also increases in
Fugitive emissions of 5.8% (0.7 Mt CO2-e) on the last quarter. These increases were offset by

1 ‘Actual’,                  ‘seasonally adjusted, ‘weather normalised’ and ‘trend’ are defined in Section 5 - Technical notes
2
    National emissions levels are inclusive of all sectors of the economy, including Land Use, Land use Change and Forestry (LULUCF) and includes the application
     of the IPCC’s natural disturbance provision.

Quarterly Update of Australia’s National Greenhouse Gas Inventory: March 2021                                                                                  3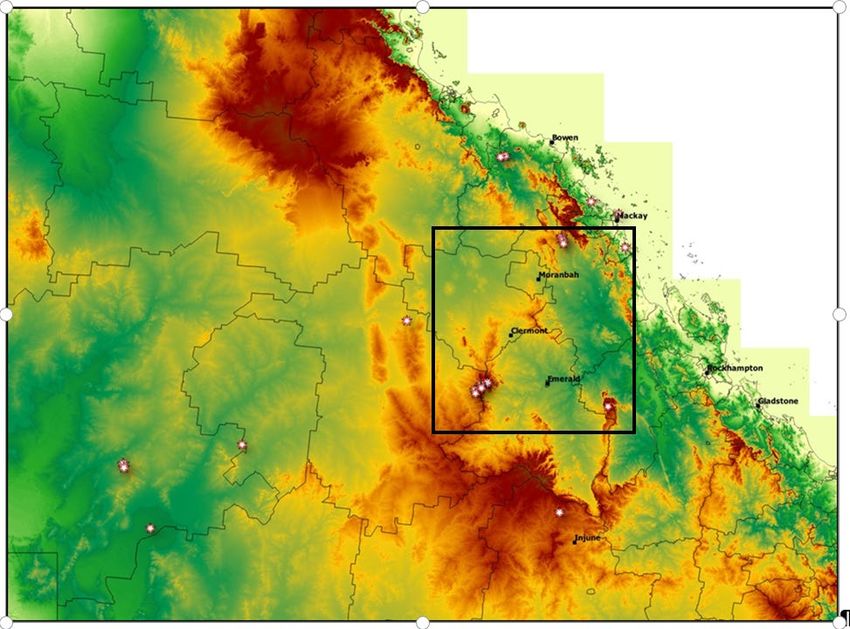
decreases in Electricity (2.0% or 0.8 Mt CO2-e), Industrial Processes and Product Use, Agriculture and
Waste.

In the year to March 2021, emissions per capita and the emissions intensity of the economy were at
their lowest levels in 31 years. Emissions per capita were lower than 1990 by 47.8% while the
emissions intensity of the economy was 66.2% lower than in 1990.

On an annual basis, the consumption-based inventory decreased 2.8% or 12.0 Mt CO2-e to
415.1 Mt CO2-e in the year to March 2021. Emissions associated with production of exports declined
by 12.5 Mt CO2-e (down 5.3%) to 221.9 Mt CO2-e and emissions associated with consumption of
imports increased by 3.2 Mt CO2-e (up 2.3%) to 142.8 Mt CO2-e.

Overall, national emissions are preliminarily estimated to be 500 Mt CO2-e in the year to June 2021,
a decrease of 2% on the previous year.

Quarterly Update of Australia’s National Greenhouse Gas Inventory: March 2021                          4
Contents
Preface .................................................................................................................................................... 3
1.     Overview ......................................................................................................................................... 6
2.     Sectoral Analysis ........................................................................................................................... 11
     2.1.     Energy – Electricity ................................................................................................................. 11
     2.2.     Energy – Stationary energy excluding electricity ................................................................... 13
     2.3.     Energy – Transport ................................................................................................................. 14
     2.4.     Energy – Fugitive emissions.................................................................................................... 16
     2.5.     Industrial processes and product use..................................................................................... 16
     2.6.     Agriculture .............................................................................................................................. 17
     2.7.     Waste...................................................................................................................................... 18
     2.8.     Land Use, Land Use Change and Forestry .............................................................................. 19
3.     Emissions per capita and per dollar of GDP .................................................................................. 20
4.     Consumption-based national greenhouse gas inventory ............................................................. 22
Special Topic - Using new satellite technologies to provide quality assurance for Australia’s national
greenhouse gas inventory..................................................................................................................... 24
Special Topic – Australia’s national inventory for methane and carbon dioxide net emissions: 1860-
2020 ...................................................................................................................................................... 36
5.     Technical notes ............................................................................................................................. 42
6.     Related publications and resources .............................................................................................. 54

Quarterly Update of Australia’s National Greenhouse Gas Inventory: March 2021                                                                               5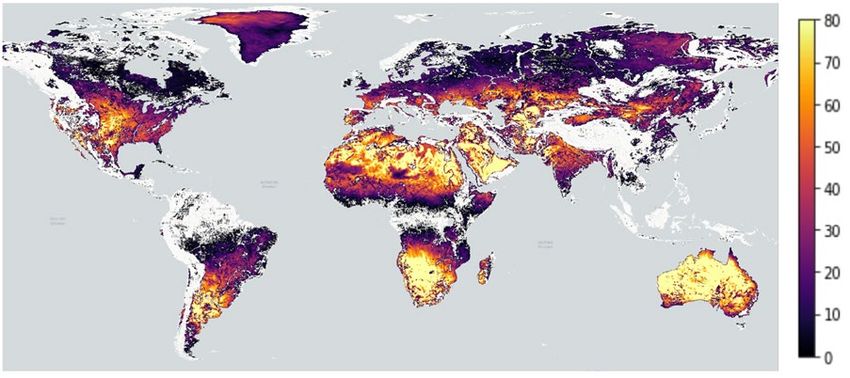
1. Overview
Table 1: National Greenhouse Gas Inventory 3, March quarter 2021, rates of change
                                                                                                                 March quarter            Year to March
                                                                                                                     2021                     2021

    Quarterly change – seasonally adjusted and weather normalised 4                                                   0.7%

    Quarterly change – seasonally adjusted and weather normalised – trend4                                            0.3%

    Annual Change                                                                                                                              -5.3%

Table 2: National Electricity Market (NEM) 5, June quarter 2021, rates of change
                                                                                                                June quarter 2021       Year to June 2021

    Quarterly change – seasonally adjusted and weather normalised4                                                    4.7%

    Quarterly change – seasonally adjusted and weather normalised – trend4                                            0.8%

    Annual Change                                                                                                                               -4.6%

Summary of emissions in the March quarter 2021
National emissions for the March quarter 2021 increased 0.3% or 0.4 Mt CO2-e on the previous
quarter in trend terms. Transport emissions increased in trend terms (5.2% or 1.2 Mt CO2-e),
reflecting the easing of COVID travel restrictions during that period. Stationary energy and fugitive
emissions both increased in trend terms in the March quarter 2021 (0.7% and 5.8% respectively).
Electricity continued its decline (2.0% or 0.8 Mt CO2-e, trend) as a result of rising generation from
renewable energy.

3
    National emissions levels are inclusive of all sectors of the economy, including Land Use, Land Use Change and Forestry (LULUCF).
4   ‘Actual’, ‘seasonally adjusted, weather normalised’ and ‘trend’ are defined in Section 5: Technical notes
5
  The NEM includes grid electricity in the Eastern and South Eastern states and accounts for approximately 83% of total electricity estimates in the year to
March 2021.

Quarterly Update of Australia’s National Greenhouse Gas Inventory: March 2021                                                                                  6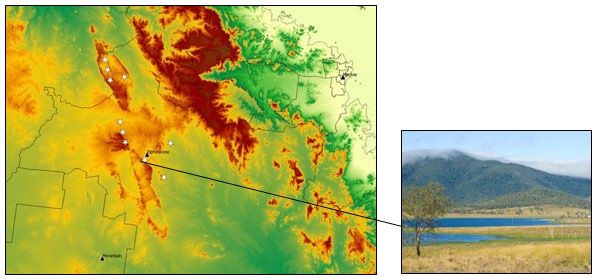
Figure 1: Emissions 6, by quarter, March 2010 to March 2021
                                     160

                                     150
    Emissions (Mt CO2-e)

                                     140

                                     130

                                     120

                                           Actual emissions      Seasonally adjusted and weather normalised           Trend

Source: Department of Industry, Science, Energy and Resources

Figure 2: Change in emissions, by quarter, March 2010 to March 2021
                                    4%

                                    2%
Quarterly change in emissions (%)

                                    0%

                                    -2%

                                    -4%

                                    -6%

                                    -8%

                                                     Seasonally adjusted and weather normalised               Trend

Source: Department of Industry, Science, Energy and Resources

6
       ‘Seasonally adjusted’, ‘weather normalised’, and ‘trend’ are defined in Section 5: Technical notes

Quarterly Update of Australia’s National Greenhouse Gas Inventory: March 2021                                                 7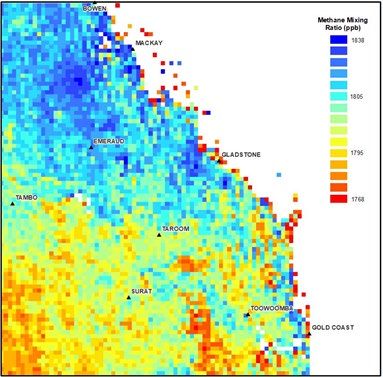
Emissions of individual gases
Carbon dioxide (CO2) emissions contribute the largest share of aggregate emissions in Australia at
approximately 69% of total emissions. Since the peak in September 2008, there has been a 30.0% or
36.2 Mt decline in emissions of carbon dioxide to 84.4 Mt in March 2021 (Figure 3). The most
important factors causing this long term decline in carbon dioxide emissions include the continuing
shift in the generation of electricity towards renewable fuel sources, and away from coal, and
decreasing emissions in the Land sector. Against these downward forces, the long term growth of
emissions from transport activity and the expansion of LNG exports have placed upward pressure on
this time series.
Methane (CH4) emissions contribute approximately 25% aggregate emissions in Australia. Overall
CH4 emissions have declined by 20.2% since the peak in September 1989. Trends in methane
emissions are dominated by events in Agriculture such as drought, Fugitives related to coal, oil and
gas production levels, Land and Waste sectors.
Nitrous oxide (N2O) emissions contribute around 4% of aggregate emissions in Australia. Overall N2O
emissions have declined by 15.0% since the peak in September 2011. Trends in N2O emissions are
sensitive to events in the Agriculture sector such as synthetic fertilizer use and biomass burning in
the Land sector.
Other gases comprising HFC, PFC and SF6 contribute the balance of total aggregate emissions.
Growth in emissions of other gases primarily driven by consumption of refrigerants in refrigeration
and airconditioning equipment.
Figure 3: Emissions, by quarter, by gas, trend, March 2000 to March 2021
CO2 CH4
120.0 1.4
110.0
1.4
100.0
Emissions (Mt CO2)
1.3
90.0
Emissions (Mt CH4)
1.3
80.0
70.0 1.2
60.0
1.2
50.0
1.1
40.0
1.1
30.0
20.0 1.0
March 2000
March 2001
March 2002
March 2003
March 2004
March 2005
March 2006
March 2007
March 2008
March 2009
March 2010
March 2011
March 2012
March 2013
March 2014
March 2015
March 2016
March 2017
March 2018
March 2019
March 2020
March 2021
March 2000
March 2001
March 2002
March 2003
March 2004
March 2005
March 2006
March 2007
March 2008
March 2009
March 2010
March 2011
March 2012
March 2013
March 2014
March 2015
March 2016
March 2017
March 2018
March 2019
March 2020
March 2021
0.03 N2O 3.0 Other (CO2-e)
2.5
0.02
Emissions (Mt CO2-e)
Emissions (Mt N2O)
2.0
0.02
1.5
0.01
1.0
0.01
0.5
- -
March 2000
March 2001
March 2002
March 2003
March 2004
March 2005
March 2006
March 2007
March 2008
March 2009
March 2010
March 2011
March 2012
March 2013
March 2014
March 2015
March 2016
March 2017
March 2018
March 2019
March 2020
March 2021
March 2000
March 2001
March 2002
March 2003
March 2004
March 2005
March 2006
March 2007
March 2008
March 2009
March 2010
March 2011
March 2012
March 2013
March 2014
March 2015
March 2016
March 2017
March 2018
March 2019
March 2020
March 2021
Source: Department of Industry, Science, Energy and Resources
Quarterly Update of Australia’s National Greenhouse Gas Inventory: March 2021 8
Summary of annual GHG emissions
Emissions for the year to March 2021 are estimated to be 494.2 Mt CO2-e. The 5.3% or
27.8 Mt CO2-e decrease in emissions over the year to March reflects annual decreases in emissions
from the electricity, stationary energy (excluding electricity), transport, fugitives, industrial processes
and waste sectors. These decreases in emissions were partially offset by increases in emissions from
the agriculture and land use, land use change and forestry sectors (Table 3).

Table 3: Actual annual emissions, by sector, for the year to March 2020 and 2021

 Sector                                                  Annual emissions (Mt CO2-e)           Annual emissions (Mt CO2-e)
                                                                                                                               Change (%)
                                                            year to March 2020                     year to March 2021

                                                                      173.8                                   164.1                -5.6
 Energy – Electricity

 Energy – Stationary energy excluding                                 102.4                                   100.9                -1.5
 electricity

 Energy – Transport                                                    99.6                                   86.5                -13.2

 Energy – Fugitive emissions                                           54.2                                   49.7                 -8.3

 Industrial processes and product use                                  30.8                                   30.6                 -0.8

 Agriculture                                                           72.4                                   73.6                 1.7

 Waste                                                                 13.4                                   13.2                 -1.3

 Land Use, Land Use Change and Forestry                                -24.7                                  -24.5                1.1

 National Inventory Total                                             521.9                                   494.2                -5.3

Figure 4: Share of total emissions, by sector, for the year to March 2021

  40%
           Electricity
  35%        33.2%

  30%
                          Stationary energy
                         excluding electricity
  25%
                                20.4%
                                                 Transport
  20%
                                                   17.5%                                        Agriculture
                                                                                                  14.9%
  15%
                                                             Fugitive emissions Industrial
                                                                   10.0%       processes and
  10%                                                                           product use
                                                                                   6.2%                               Waste
   5%                                                                                                                 2.7%

   0%

   -5%
                                                                                                                              LULUCF
  -10%                                                                                                                         -4.9%

Source: Department of Industry, Science, Energy and Resources

Quarterly Update of Australia’s National Greenhouse Gas Inventory: March 2021                                                             9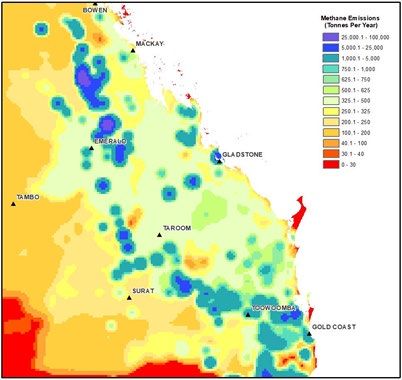
Over the year to March 2021 the 5.6% decrease in emissions from the electricity sector was mainly
due to a 4.4% reduction in coal generation, a 23.9% reduction in gas generation and a corresponding
11.4% increase in supply from renewable sources in the NEM.

Transport emissions decreased 13.2% over the year to March, reflecting an 11.6% decrease in petrol
consumption and a 58.3% decrease in domestic jet fuel consumption related to the COVID
restrictions on movement.

Emissions from the agriculture sector increased 1.7% to 73.6 Mt CO2-e, reflecting improving
conditions in the sector.

Emissions in Australia from export industries decreased 5.4% (10.9 Mt CO2-e).

In the year to June 2021, the preliminary estimate for total emissions is 500 Mt CO2-e. This would be
a decline of 2% or 12 Mt CO2-e on the year to June 2020.

Long term sectoral trends
The most important sectoral drivers of Australia’s long-term emissions trend have been:

    •   Electricity – where emissions have fallen by 22.5% since June 2009, as renewables have
        displaced coal as a fuel source, reversing the long term increases experienced in earlier
        years;
    •   Stationary energy (excluding electricity) – which has shown the largest growth of any sector
        in percentage terms since 1990. Emissions have increased 52.5% or 34.7 Mt CO2-e driven, in
        particular, by recent growth in the export of LNG;
    •   Transport - where emissions have increased 41.0% or 25.2 Mt CO2-e since 1990, despite
        recent volatility due to the impacts of the COVID pandemic;
    •   Fugitives – where emissions have increased 25.9% or 10.2 Mt CO2-e since 1990. Emissions
        were relatively stable until 2015 but have increased strongly as a result of the growth of the
        LNG industry;
    •   Agriculture – where emissions have declined by 20.0% or 18.4 Mt CO2-e since 1990, in line
        with declining cattle and sheep populations; and,
    •   Land Use, Land Use Change and Forestry (LULUCF) – where emissions have decreased by the
        largest margin of any sector since 1990 (112.6% or 218.1 Mt CO2-e) due to reductions in land
        clearing and native forest harvesting and improvements in soil carbon.

The changes in emissions from each sector from the year to June 1990 to 2021 in percentage terms
are presented in Figure 5.

Quarterly Update of Australia’s National Greenhouse Gas Inventory: March 2021                      10
Figure 5: Percentage change in emissions, by sector, since year to March 1990
80% Electricity
60%
Per cent change in emissions on 1990 (%)
Stationary energy
40% excluding
electricity
20% Transport
0%
-20% Fugitive emissions
-40%
Industrial
-60% processes and
product use
-80% Agriculture
-100%
Waste
-120%
-140%
LULUCF
Source: Department of Industry, Science, Energy and Resources
2. Sectoral Analysis
2.1. Energy – Electricity
Electricity generation is the largest source of emissions in the national inventory, accounting for
33.2% of emissions in the year to March 2021 (Figure 4).
Electricity sector emissions are experiencing a long term decline, down 22.5% (47.5 Mt CO2-e) from
the peak recorded in the year to June 2009 (Data Table 1A).
Electricity sector emissions decreased 2.1% in the March quarter of 2021 on a seasonally adjusted
and weather normalised basis 7 (Figure 6). This reflected a 4.4% decline in coal generation and a
consequent increase of 11.4% in renewable generation. The March quarter 2021 saw metered
demand in the NEM higher by 2.2% than in the December quarter 2020.
Over the course of the whole year to March 2021, emissions from electricity decreased 5.6%
compared with the year to March 2020, due to the ongoing substitution of renewable energy
sources for coal-fired power.
7 Two adjustments are made:
a) Seasonal adjustment is a first-order adjustment using Eurostat software that systematically corrects emissions data for average fluctuations in
seasonal conditions which, for example, controls for the effects of two seasonal peaks in electricity demand: one in winter (associated with demand
for heating) and one in summer (associated with demand for cooling); and
b) Weather normalisation is a second-order adjustment that systematically corrects emissions data for atypical temperature effects on electricity
demand within the year which, for example, controls for the effects of unusually cold winters or unusually hot summers.
The weather normalisation methodology is described in detail in ‘Section 7: Special Topic’ of the December 2011 Quarterly Update
Quarterly Update of Australia’s National Greenhouse Gas Inventory: March 2021 11Figure 6: Electricity sector emissions, by quarter, March 2010 to March 2021
56
54
Emissions (Mt CO2-e)
52
50
48
46
44
42
40
38
Actual emissions Seasonally adjusted and weather normalised emissions
Source: Department of Industry, Science, Energy and Resources, Australian Energy Market Operator (AEMO, 2021), obtained using NEM-
Review software
National Electricity Market (NEM) emissions
Emissions in the NEM for the June quarter 2021 increased 4.7 % on a seasonally adjusted and
weather normalised basis compared with the previous quarter (Figure 7).
Figure 7: NEM electricity emissions, by quarter, June 2010 to June 2021
48
46
44
Emissions (Mt CO2-e)
42
40
38
36
34
32
30
Actual emissions Seasonally adjusted and weather normalised emissions
Source: Department of Industry, Science, Energy and Resources, Australian Energy Market Operator (AEMO, 2021), obtained using NEM-
Review software
For the June 2021 quarter, generation from renewables increased 0.1% in trend terms (Figure 8).
Quarterly Update of Australia’s National Greenhouse Gas Inventory: March 2021 12Figure 8: Cumulative change in electricity generation in the NEM, trend, by fuel, by quarter, June
2010 to June 2021
6
4
Electricity Generation (TWh)
2
Coal
0
Gas
-2
-4 Wind
-6
Hydro
-8
Solar
-10
Source: Department of Industry, Science, Energy and Resources, Australian Energy Market Operator (AEMO, 2021), obtained using NEM-
Review software
2.2. Energy – Stationary energy excluding
electricity
Stationary energy excluding electricity includes emissions from direct combustion of fuels,
predominantly from the manufacturing, mining, residential and commercial sub-sectors.
In the year to March 2021, stationary energy excluding electricity accounted for 20.4% of Australia’s
national inventory (Figure 4).
Emissions from stationary energy excluding electricity in the March quarter of 2021 increased 0.7%
(0.2 Mt CO2-e) in trend terms compared with the December quarter. Emissions over the year to
March 2021, decreased 1.5% in trend terms when compared with the previous year (Figure 9).
Quarterly Update of Australia’s National Greenhouse Gas Inventory: March 2021 13Figure 9: Stationary energy excluding electricity emissions, actual and trend, by quarter, March 2010
to March 2021
34
29
Emissions (Mt CO2-e)
24
19
14
9
4
Stationary energy excluding electricity - Actual Stationary energy excluding electricity - Trend
Source: Department of Industry, Science, Energy and Resources
Figure 10: LNG exports, by quarter, March 2010 to March 2021
20
15
Exports (Million tonnes)
10
5
0
Source: Department of Industry, Science, Energy and Resources
2.3. Energy – Transport
The transport sector includes emissions from the direct combustion of fuels in transportation by
road, rail, domestic aviation and domestic shipping. The main fuels used for transport are
automotive gasoline (petrol), diesel oil, liquefied petroleum gas (LPG) and aviation turbine fuel.
In the year to March 2021, transport accounted for 17.5% of Australia’s national inventory (Figure 4).
Emissions in the March 2021 quarter increased 5.2% in trend terms on the December quarter 2020
recovering some of the declines experienced in the March and June quarters of 2020 (Figure 11).
Quarterly Update of Australia’s National Greenhouse Gas Inventory: March 2021 14This result reflects some degree of a return towards normal levels of transport activity following the
most severe impacts from the restrictions on movement imposed in the June quarter 2020.
Emissions from transport over the year to March 2021 decreased 13.2% when compared with the
previous year. This decline in transport emissions was partly the result of an 11.6% annual decline in
petrol consumption associated with the impacts of the COVID pandemic. In contast, diesel
consumption declined by 2.2% over the same period (Figure 12).
Figure 11: Transport emissions, actual and trend, by quarter, March 2010 to March 2021
28
27
26
Emissions (Mt CO2-e)
25
24
23
22
21
20
19
18
Transport - actual Transport - Trend
Source: Department of Industry, Science, Energy and Resources
Figure 12: Consumption of primary liquid fuels, actual and trend, by quarter, March 2010 to March
2021
8,000
7,500
Consumption (Million Litres)
7,000
6,500
6,000
5,500
5,000
4,500
4,000
3,500
3,000
Petrol Diesel Petrol - Trend Diesel - Trend
Source: Department of Industry, Science, Energy and Resources
Quarterly Update of Australia’s National Greenhouse Gas Inventory: March 2021 152.4. Energy – Fugitive emissions
Fugitive emissions occur during the production, processing, transport, storage, transmission and
distribution of fossil fuels. These include coal, crude oil and natural gas. Emissions from
decommissioned underground coal mines are also included in this sector.
Fugitive emissions in the March quarter increased 5.8% in trend terms.
Total gas and LNG production were unchanged in the March 2021 quarter. Reduced underground
carbon dioxide injection at the Gorgon project and the restart of Prelude caused an increase in
fugitive emissions from the crude oil and natural gas sub-sector. Coal production grew by 5.3% in the
March 2021 quarter, contributing to the overall increase in fugitive emissions after the decrease in
December 2020.
Annual emissions in this sector decreased 8.3% in actual terms over the year to March 2021
(Figure 13).
Figure 13: Fugitive emissions, actual and trend, by sub-sector, by quarter March 2010 to March 2021
10
8
Emissions (Mt CO2-e)
6
4
2
0
Coal - actual emissions Crude oil and natural gas - actual emissions
Coal - trend Crude oil and natural gas - trend
Source: Department of Industry, Science, Energy and Resources
2.5. Industrial processes and product use
Emissions from industrial processes and product use occur as the result of by-products of materials
and reactions used in production processes. This sector includes emissions from processes used to
produce chemical, metal, and mineral products. It also includes emissions from the consumption of
synthetic gases.
In the year to March 2021, industrial processes and product use accounted for 6.2% of Australia’s
national inventory (Figure 4). Emissions declined 0.8% or 0.3 Mt CO2-e over the year to March 2021
(Figure 14) partly reflecting declines in emissions from the chemicals sector.
Trend emissions for industrial processes and product use decreased 0.2% in the March quarter on
the previous quarter.
Quarterly Update of Australia’s National Greenhouse Gas Inventory: March 2021 16Figure 14: Industrial processes and product use emissions, actual, by sub-sector, by quarter, March
2010 to March 2021
4.0 Chemical
industry
3.5
3.0
Products
substituted for
Emissions (Mt CO2-e)
2.5 Ozone Depleting
Substances
2.0
Metal industry
1.5
1.0
Mineral industry
0.5
0.0
Other production
and lubricant use
Source: Department of Industry, Science, Energy and Resources
2.6. Agriculture
Emissions from agriculture include methane, nitrous oxide and carbon dioxide. Methane and nitrous
oxide emissions are estimated for enteric fermentation and manure management in livestock. They
are also estimated for rice cultivation, agricultural soils and field burning of agricultural residues.
Carbon dioxide emissions are reported from the application of urea and lime.
In the year to March 2021, agriculture accounted for 14.9% of Australia’s national inventory (Figure
4). Emissions from agriculture increased 2.1% (1.5 Mt CO2-e) in trend terms over the year to March
2021 (Figure 15).
Quarterly Update of Australia’s National Greenhouse Gas Inventory: March 2021 17Figure 15: Agriculture emissions, trend, by quarter, March 2010 to March 2021 8
24
22
Emissions (Mt CO2-e)
20
18
16
14
12
10
8
Source: Department of Industry, Science, Energy and Resources
Drought conditions have eased in the March quarter 2021. More favourable seasonal conditions
have led to herd and flock rebuilding, however, livestock population numbers are yet to fully
recover 9. There has been some rebound in crop production in the March quarter 2021 due to more
favourable climatic conditions. Emissions from crop production should continue to increase in future
quarters, with wheat production forecast to rebound strongly 10.
2.7. Waste
The waste sector includes emissions from landfills, wastewater treatment, waste incineration and
the biological treatment of solid waste. Emissions largely consist of methane, which is generated
when organic matter decays under anaerobic conditions.
In the year to March 2021 2020, waste accounted for 2.7% of Australia’s national inventory
(Figure 4).
Emissions from waste decreased 1.3% (0.2 Mt CO2-e) over the year to March 2021 due to increased
gas capture at solid waste disposal sites (Figure 16).
8
The nature of the data underpinning the agriculture estimates creates an anomaly in the actual quarterly data which is managed through seasonal
adjustment and weather normalisation (Data Tables 1B and 1C).
9
Australian Bureau of Agricultural and Resource Economics and Sciences (2021). Agricultural Commodities Report, June 2021.
10
Australian Bureau of Agricultural and Resource Economics and Sciences (2021). Australian Crop Report, June 2021.
Quarterly Update of Australia’s National Greenhouse Gas Inventory: March 2021 18Figure 16: Waste emissions, actual, by sub-sector, by quarter, March 2010 to March 2021
4.0
3.5
3.0
Emissions (Mt CO2-e)
2.5
2.0
1.5
1.0
0.5
0.0
Solid waste disposal on land Wastewater handling Waste incineration and biological treatment of solid waste
Source: Department of Industry, Science, Energy and Resources
2.8. Land Use, Land Use Change and Forestry
The Land Use, Land Use Change and Forestry (LULUCF) sector of the national inventory includes
estimates of net anthropogenic emissions for forests and agricultural lands and changes in land use.
In the year to March 2021, the LULUCF sector 11 accounted for -4.9% of Australia’s national inventory
– a net sink (Figure 4).
Net emissions for the LULUCF sector in the year to March 2021 are estimated to be -24.5 Mt CO2-e
(Figure 17). This net sink has declined by 1.1% (0.3 Mt CO2-e) on the previous twelve months due to
an increase in emissions from agricultural soils, partially offset by a continuing decline in land
clearing emissions (Figure 17).
11
LULUCF includes Forest converted to other uses, Forest land remaining forest land, Land converted to forest land, Grassland remaining grassland (including
Wetlands and Settlements) and Cropland remaining cropland.
Quarterly Update of Australia’s National Greenhouse Gas Inventory: March 2021 19Figure 17: LULUCF net anthropogenic emissions, by sub-sector, year to March, 1990 to 2021
200
Forest land
remaining forest
land
150
Cropland remaining
Emissions (Mt CO2-e)
100 cropland
50 Grassland remaining
grassland (including
Wetlands and
Settlements)
0
Land converted to
forest
-50
-100 Forest converted to
other uses
Year to March
Source: Department of Industry, Science, Energy and Resources
3. Emissions per capita and per dollar of GDP
In the year to March 2021, emissions per capita, and the emissions intensity of the economy are at
their lowest levels in 31 years 12.
National inventory emissions per capita were 19.2 t CO2-e per person in the year to March 2021. This
represents a 47.8% decline in national inventory emissions per capita from 36.9 t CO2-e per person in
the year to March 1990.
Over the period from March 1990 to March 2021, Australia’s population grew strongly from 17.0
million to around 25.7 million 13,14. This represents a growth of 51.3%.
Australia’s real GDP (chain volume measures) also experienced significant growth over this period,
expanding from $0.8 trillion in the year to March 1990 to around $1.9 trillion in the year to March
2021 15. This represents a growth of 134.9%.
National inventory emissions per dollar of real GDP fell from 0.8 kg CO2-e per dollar in the year to
March 1990 to 0.3 kg CO2-e per dollar in the year to March 2021 (Figure 18). This represents a
decline of 66.2% from the year to March 1990.
12
Emissions per capita and per dollar of real GDP levels are inclusive of all sectors of the economy, including Land Use, Land Use Change and Forestry
(LULUCF)
13
Australian Bureau of Statistics (2021), Australian Demographic Statistics, pub. no. 3101 http://www.abs.gov.au/ausstats/abs@.nsf/mf/3101.0
14
Australian Bureau of Statistics (2021), Population Clock. http://www.abs.gov.au/AUSSTATS/abs@.nsf/Web+Pages/Population+Clock
15
Australian Bureau of Statistics (2021), National Accounts: National Income, Expenditure and Product, Cat. No. 5206.0
http://www.abs.gov.au/ausstats/abs@.nsf/mf/5206.0
Quarterly Update of Australia’s National Greenhouse Gas Inventory: March 2021 20Figure 18: Emissions per capita and per dollar of real GDP, actual year to March 1990 to 2021
38 0.80
36 0.75
34
0.70
32
30 0.65
kg CO2-e per $ of real GDP
28 0.60
t CO2-e per person
26 0.55
24
0.50
22
20 0.45
18 0.40
16 0.35
14
0.30
12
10 0.25
8 0.20
Year to March
Emissions per capita Emissions per dollar of real GDP
Source: Department of Industry, Science, Energy and Resources
Quarterly Update of Australia’s National Greenhouse Gas Inventory: March 2021 214. Consumption-based national greenhouse
gas inventory
Table 4: Consumption-based national greenhouse gas inventory 16, March quarter and year to March
2021, emissions growth rates
March quarter Year to March
2021 2021
Quarterly change – seasonally adjusted 17 -0.4%
Quarterly change – seasonally adjusted– trend -1.3%
Annual Change -2.8%
The consumption account estimates the impacts on emissions in Australia and in other countries due
to Australian consumption or demand.
On an annual basis, the consumption-based inventory decreased 2.8% or 12 Mt CO2-e to
415.1 Mt CO2 e in the year to March 2021, largely as a result of a 27.8 Mt CO2 e decline in national
greenhouse gas inventory emissions (down 5.3%). Emissions associated with production of exports
declined by 12.5 Mt CO2 e (down 5.3%) and emissions associated with consumption of imports
increased by 3.2 Mt CO2 e (up 2.3%).
Emissions in the national greenhouse gas inventory associated with the production of goods for
export are not included in the consumption-based inventory. The national greenhouse gas inventory
is increasingly driven by producing goods for exports. After deducting these emissions, national
greenhouse gas inventory emissions that are associated with domestic consumption declined by
5.3 per cent (16.8 Mt CO2-e).
Emissions generated by Australian consumption are 146.5 Mt CO2-e or 26.1% lower compared to the
year to June 2005. The analysis also shows that the emissions generated to support Australia’s
consumption are less than those reported as the (production-based) national greenhouse gas
inventory by 79.1 Mt CO2-e or 16% in the year to March 2021 (Figure 19).
On a seasonally adjusted basis, Australia’s consumption-based inventory was lower relative to the
previous quarter (0.4% or 0.4 Mt CO2-e).
Consumption-based emissions are approximately 16.2 tonnes per person per year, which is around
3.1 tonnes per person less than the per capita emission calculation using the national greenhouse
gas inventory.
16 National emissions levels are inclusive of all sectors of the economy, including Land Use, Land Use Change and Forestry (LULUCF).
17 ‘Actual’, ‘seasonally adjusted and ‘trend’ are defined in Section 5: Technical notes
Quarterly Update of Australia’s National Greenhouse Gas Inventory: March 2021 22Figure 19: National Greenhouse Gas and Consumption-based inventories, Australia, by quarter, March 2005 to March 2021 Source: Department of Industry, Science, Energy and Resources Figure 20: Global emissions generated during production of Australia’s imports and exports, by quarter, March 1990 to March 2021 Source: Department of Industry, Science, Energy and Resources Quarterly Update of Australia’s National Greenhouse Gas Inventory: March 2021 23
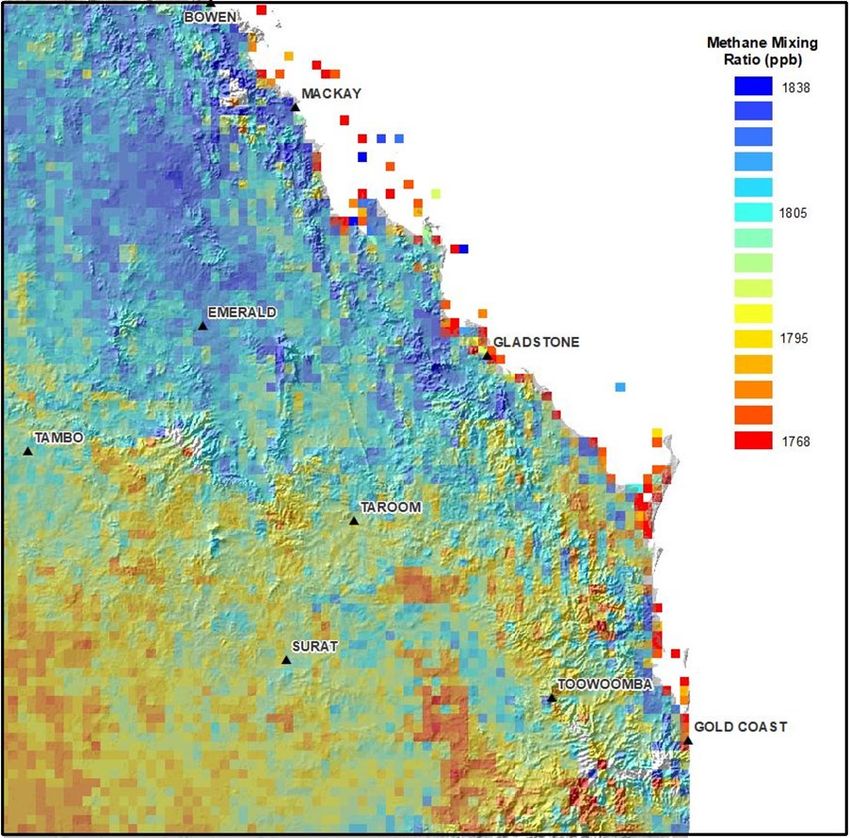
Special Topic - Using new satellite
technologies to provide quality assurance for
Australia’s national greenhouse gas inventory
The newly introduced capacity to monitor and map concentrations of greenhouse gases from space
using instrumentation aboard European Space Agency (2017) and NASA (2014) satellites offers the
prospect of the development of important, new quality-assurance systems in support of the National
Greenhouse Accounts.

Methane
The IPCC observes that data on regional greenhouse gas mixing ratios taken from instruments on
board satellites offers a new approach to provide independent, quality assurance for national
inventories.

Quality assurance systems are especially important for methane emissions since many sources are
difficult to estimate given the highly variable and often diffuse nature of the source.

Major sources of anthropogenic methane include leaks from gas systems, disturbed coal seams, fire,
wetlands, landfills, wastewater and livestock but there are also dispersed, non-anthropogenic
sources such as from natural wetlands, wild animals and termites, natural seeps, and natural
disturbances such as out-of-control bushfire.

The IPCC’s 6th Assessment Report on Climate Change, released on 9 August, provides a map of
estimated methane emissions for regions of the world drawing on satellite data and inverse
modelling techniques.

Figure ST 1: IPCC Assessment of regional methane emissions

Source: IPCC (2021) cross-chapter Box 5.2.

In Australia, the strongest concentration of methane emissions are most likely in the Sydney-Hunter
Valley and Melbourne areas with lesser concentrations in the Bowen Basin and Cooper Basin areas.
More generally, livestock is the biggest source of methane in Australia but, as it is widely dispersed,
it does not show as an intense concentration on these maps. Concentrations of methane emissions
in Melbourne and Sydney could be attributed to the city gas distribution networks – and this is

Quarterly Update of Australia’s National Greenhouse Gas Inventory: March 2021                        24
consistent with the national inventory, which identifies distribution networks as the biggest source
of methane leaks in Australia’s gas supply system. In addition, in the case of Sydney, coal mines in
the Illawarra, which are the gassiest mines in Australia and, to a lesser extent, mines in the Hunter
Valley would be large contributors.

The European Space Agency Sentinel 5P mission houses a measuring instrument, known as
TROPOMI, which is estimating methane mixing ratios (concentrations) in the air column below the
satellite on a 7km by 5km grid as it circulates the globe - around 14 times a day. Data from the
Sentinel 5P mission is shared with Australia under agreement with the Australian Space Agency and
managed by the ESA’s partner in Australia, GeoScience Australia.

As an initial pilot, the Department has accessed this data to the map methane mixing ratios observed
over the Bowen and Surat Basins in Queensland, where methane concentrations might be expected
to occur.

Figure ST 2: Average methane mixing ratios identified from satellite data (ppb) (Panel a) and major
methane emission sources identified in the national inventory (Panel b); Bowen and Surat Basins,
2019-20

 Panel a                                                           Panel b

Source: DISER analysis of Sentinel 5P methane mixing ratios; national greenhouse gas inventory

The national inventory data (Figure ST 2, Panel b) indicate that the largest emission point-sources in
the region relate to the Bowen Basin coal mines, with lesser emission point-sources in the Surat
Basin associated with CSG developments. Significant emissions also arise from wastewater and
landfill. The largest diffuse sources relate to cattle and water.

The Bowen Basin shows more intense methane concentrations than the Surat and this is to be
expected from the national inventory. Almost twice as much methane is emitted from the Bowen
Basin as the Surat Basin, according to data underpinning the national inventory (Table ST 1) and
around 3 times more than the Surat Basin when estimated on a per hectare basis.

Overall, the pattern described by the national inventory aligns reasonably well with the data on the
intensity of methane mixing ratios observed from the Sentinel 5P satellite data.

Conceptually, there will always be a gap between these two sets of data which means that they
should be compared only with caution. (i) Panel a shows methane concentrations whereas Panel b

Quarterly Update of Australia’s National Greenhouse Gas Inventory: March 2021                         25
shows emission sources – to relate the two requires a pollution dispersion model as the emission
plumes will be dispersed depending on meteorological conditions 18. (ii) The timing of the recording
of methane emissions also varies. The satellite will see methane releases instantaneously while the
inventory records estimated methane emissions on an annual basis such that, for a process with
highly variable release profiles, as is the case for many methane sources, the two datasets will differ.
(iii) The inventory data do not show all methane sources – only anthropogenic sources that are
reported in the national inventory – while satellite data in Panel a will reflect all sources of methane,
including non-anthropogenic sources.

Care also needs to be taken in interpreting the datasets since, as explained below, the satellite data
on mixing ratios (Panel a) will be significantly less reliable in certain locations (and this is the case, as
shown in Figure ST 3, in and around parts of the Bowen Basin).

Table ST 1: Estimated methane emissions, Bowen and Surat Basins, 2019, 2020

                                             IPCC Source                                                   Methane emissions
                                                                                                               (tonnes)

     Bowen Basin & coast                                                                                        857,000 +
     National Inventory sources
     Coal mining                                                                                                 525,000
     Gas supply                                                                                                     IE
     Fuel Combustion                                                                                              7,000
     Cattle                                                                                                      260,000
     Feedlots                                                                                                     10,000
     Water                                                                                                        30,000
     Wastewater                                                                                                   4,000
     Landfill                                                                                                     10,000
     Landclearing (fire)                                                                                          3,600
     Prescribed burning and wildfire                                                                              8,900
     Other sources (freshwater, wild animals, termites, natural seeps and disturbances)                      Not estimated
     Surat Basin & coast                                                                                        505,000 +
     National Inventory sources
     coal mining                                                                                                    IE
     Gas supply                                                                                                   85,000
     Fuel Combustion                                                                                              46,000
     Cattle                                                                                                      205,000
     Sheep                                                                                                        10,000
     Pigs                                                                                                         18,000
     Feedlots                                                                                                     35,000
     Water                                                                                                        27,000
     Wastewater                                                                                                   14,000

18
  For example, in calm conditions, the emission plumes will tend to concentrate overhead of the source whereas in breezy conditions the
plume will be dispersed more quickly.

Quarterly Update of Australia’s National Greenhouse Gas Inventory: March 2021                                                       26
IPCC Source Methane emissions
(tonnes)
Landfills 38,000
Landclearing (fire) 5,100
Prescribed burning and wildfire 25,500
Other sources (freshwater, wild animals, termites, natural seeps and disturbances) Not estimated
Source: DISER analysis of national inventory data
NGA Methane Monitoring System
The Department intends to build on this work systematically by establishing a National Greenhouse
Account Methane Monitoring System.
The new quality assurance program will utilise daily methane concentration data across Australia
from the ESA satellite Sentinel 5P to identify emerging methane concentrations and to provide
systematic quality assurance for national inventory estimates.
The satellite system will complement other quality assurance work on methane. In DISER 2021, the
national inventory methods for methane were shown to work well when tested against methane
fluxes recorded by flux towers located in the Surat Basin and analysed by the CSIRO. Methane
emissions in the Surat Basin have also been tested using equipment on board aviation flyovers
(Neininger et al 2021, forthcoming)), in work sponsored by the UN Environment Program, and which
will show that the estimated plume plotted during those flyovers was largely consistent with the
collection of inventory methods used for the Surat Basin.
Inverse modelling of methane emissions
Beyond the purpose of quality assurance systems, some researchers are beginning to explore the
use of satellite data on methane mixing ratios in adjacent locations to make estimates of methane
fluxes.
This new, greenfields (‘top-down’) development work offers the potential for long term benefits to
greenhouse gas inventories – however, in the view of the IPCC 19, the application of the satellite data
to the quantification of emissions from particular point sources is premature at this stage.
Making reliable, ‘top-down’ estimates of emissions from the satellite data on methane mixing ratios
has a high degree of difficulty for a number of reasons, set out below.
The data on methane mixing ratios from the satellite can be unreliable in some locations and under
certain conditions. This is known because the European Space Agency itself discards 80-90% of all
potential observations and does not accept the data over water, over clouds or in cases of very low
albedo. There are other complications as well, relating to the presence of aerosols, light and rough
terrain. For some of these variables, thresholds for acceptance of data are applied to ‘minimise
errors’. For particular locations, data obtained on some orbits will sometimes be valid, and
sometimes the data will not, depending on the conditions. In general, outside the flat, cloud-free,
19
“Use of satellite observations in inverse modelling for anthropogenic emission estimates is still in the experimental stage,
due to multiple technical challenges of producing the high-quality concentration retrievals from the satellite-observed
spectra” (IPCC 2019).
Quarterly Update of Australia’s National Greenhouse Gas Inventory: March 2021 27dust free desert-like landscapes Figure ST 2 in yellow, mainly), there is room for further examination
of the reliability of the data.
Figure ST 3: Count of the number of valid observations, sentinel 5P, methane mixing ratios, for the
year, 2019
Source: Lavaux et al 2021. Sentinel-5P coverage for Level 2 XCH4 data product in 2020. The value of each pixel corresponds to the number
of days for which Sentinel-5P provided at least one valid (after quality filtering) measurement, for the corresponding area during year 2019.
Note that 80 is a hard threshold set for clarity; some pixels exceed this value (Credits: Map tiles by Carto, under CC BY 3.0. Data by 846
OpenStreetMap, under ODbL)
Ground-truthing and lack of precision
The ground-truthing of the core dataset on methane mixing ratios is limited. In Australia, the
TROPOMI algorithm was tested against methane measurements made at two TCCON 20 stations –
Wollongong and Darwin. The small number of ground-truthing stations for the satellite data in
Australia risks biases and a level of imprecision in the instrument estimates.
• Imprecision: - at the TCCON station at Wollongong, the bias in the initial readings from the
TROPOMI instrument was reported to be -19.6ppb with a standard deviation of ±14.9ppb
(Lorente et al 2021).
• Bias corrections: - after 2 years, corrections to the operational data have been applied, as
reported by Lorente et al 2021, but a residual bias of -7.7ppb at the Wollongong station
remains with a standard deviation of ±13.3 ppb.
Instrument and modelling errors
• Instrument errors: – the instrument sometimes produces bias for strips of pixels along the
orbital path that need to be controlled for.
• Topography: – the calculations work best where there is smooth topography. Many local
maxima in the methane mixing ratios appear to coincide with ridge tops, while many areas
of high variability of observations coincide with areas of rough terrain. In Figure ST 4, areas
of high variations in recorded methane mixing ratios from pixel-to-pixel appear as chequer-
board-like areas - these areas tend to coincide with areas of rough terrain. In Figure ST 5 and
Figure ST 6, many of the highest readings appear to coincide with the mountainous peaks in
the region.
20
Total Carbon Column Observatory Network
Quarterly Update of Australia’s National Greenhouse Gas Inventory: March 2021 28• Aerosols: – some high readings appear to coincide with locations of high levels of aerosols.
The presence of dust makes analysis of open-cut coal mines quite different to, for example,
a leak from a gas pipeline, which has been a recurring topic of study by researchers (Lavaux
et al 2021).
• Albedo: – areas of low and high albedo are the ‘most challenging’ for the TROPOMI
instrument (Lorente et al 2021). Both of these types of situation are present in the Bowen
Basin in close proximity – in part due to topography, as the coastal facing mountain range is
lush while the western facing part of the mountain ranges are much drier. Consequently, the
Bowen Basin is one region in the world where the bias correction employed for the
TROPOMI algorithm has had both increased and decreased estimates on different pixels
within the same region – widening the dispersion of estimates in the region – but where
considerable uncertainty remains.
• Scattered light: – heterogeneity of the albedo readings for a given scene or pixel is a
problem for the instrument to assess over the 40km2 of one pixel. As indicated in Hasekamp
2019, the TCCON stations at Wollongong and Darwin have among the widest range of
albedo readings of any station in the TCCON network (in the top 5 in the world) indicating
that this scattering of albedo could be a problem in many coastal and mountainous area of
Australia, like parts of the Bowen Basin, for a satellite with relatively low resolution like
Sentinel 5P.
Sampling errors
• Data selection: – the number of observations made available from the satellite instrument is
restricted in cases of low albedo (over water); low atmospheric quality due to clouds or
aerosols or from rough terrain. Around 80-90% of potential satellite observations are not
usable and restricts the global coverage of this satellite. Within Australia, these limitations
restrict available observations to moments of clear blue skies which is a restriction that
potentially biases the available dataset.
• Sampling errors over time: – extrapolation from a small number of observations, given the
amount of data discarded, could be problematic for such a highly variable source as
methane.
• Sampling errors over space: - at some locations there are less observations available due to
cloud, albedo or aerosol conditions and could be problematic for some under-sampled
locations.
Modelling methane fluxes
• Plume identification: – the identification of a plume is underpinned by the estimation of the
change in the methane mixing ratios across adjacent pixels. The imprecision of the TROPOMI
instrument at Wollongong, however, when applied to flux estimates, leads to a cascading of
uncertainty for estimated changes in the methane mixing ratio from one pixel to another.
This means that a certain, significant level of statistical uncertainty is present around the
detection of any plume.
• Upwind bias: - the estimation of areas upwind from major sources in the Bowen Basin is
complicated by the presence of rough terrain and areas of low albedo, which risks biasing
estimates of upwind methane.
• Understanding of meteorological conditions: – extrapolation of a snapshot in time on wind
conditions throughout the day(s) introduces uncertainties over the extent and origin of
methane detections in a plume.
Quarterly Update of Australia’s National Greenhouse Gas Inventory: March 2021 29• Incomplete modelling of local maxima: – the level of confidence in any proposed explanation
for any identified point source is diminished while there are unexplained methane maxima
more generally in the dataset. Several of the highest maxima for Queensland, for example,
apparently originate from the rugged terrain around the Zamia State Forest (Figure ST 6).
Other maxima occur to the west of Queensland without any obvious source.
• Attribution: – attributing observed plumes to particular point sources is difficult with low
resolution data - every pixel reading covers around 40 square kilometres, which will contain
many sources of methane in most situations: from coal to cattle; from waste to water; and
include many, diffuse non-anthropogenic sources like freshwater, wild animals, termites and
the like.
Figure ST 4: Methane mixing ratios, with topography, 2019-20
Source:
DISER analysis of Sentinel 5P data.
Quarterly Update of Australia’s National Greenhouse Gas Inventory: March 2021 30Figure ST 5: Comparison of satellite data for estimated methane, topography Source: DISER analysis of Sentinel 5P data. Stars are locations of the highest readings December 2019 – June 2020 shows a preponderance of the highest readings on rough terrain. Figure ST 6: Highest methane mixing ratios, 18 July 2020 Source: DISER analysis. https://www.queensland.com/au/en/things-to-do/attractions/p-56b25e9aaeeeaaf773cf0f67-lake-elphinstone. Maximum two per cent readings for methane-mixing ratio, 18 July, (LHS) on the Kerlong range, above Lake Elphinestone (RHS) (the lake is around 7km from the Hail Creek mine). The instrument is known to not work so well with rough terrain and clouds. These issues are not new ones to the inverse modelling community – addressing these questions satisfactorily, however, will take time. Quarterly Update of Australia’s National Greenhouse Gas Inventory: March 2021 31
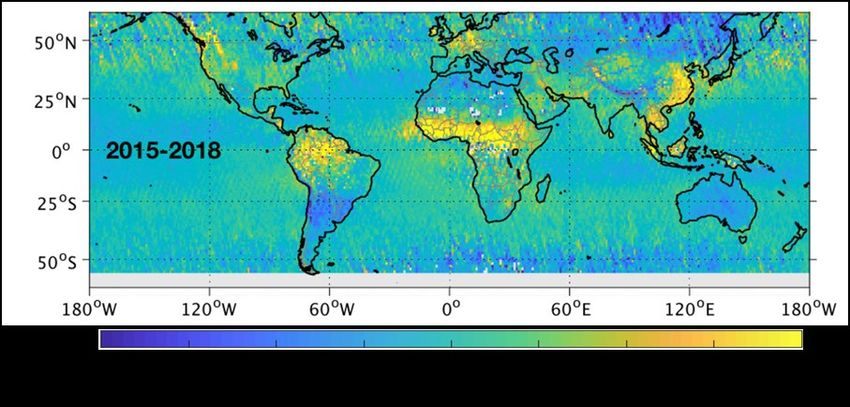
More ground-truthing and verification of the satellite data is necessary to improve precision,
especially in the Southern Hemisphere. This could be done, for example, using aviation flyovers,
which sample the methane plumes more intensely, and which could yield valuable information
about the quality of the satellite data.

More openness about methods applied is necessary. Studies should be repeatable and replicable by
others.

Overall, like the IPCC, the Department believes that it is premature to use satellite data to quantify
emissions from methane sources.

Nevertheless, such methods show enough promise to be developed into quality assurance systems
for methane sources more generally. Developing robust systems will take time, dialogue and
transparency in method development.

While the Department remains cautious about the risks of over-interpretation of the data by
researchers, in light of the new information coming forward the Department intends to review
inventory methods for methane in the coming inventory cycles. In particular, the Department
intends to review methods in relation to the application of default factors for fuel combustion by
reciprocating gas engines; for the estimation of fugitive emissions from open cut coal mines and
from wastewater from industrial sources.

Carbon dioxide
Like methane, regional concentrations of carbon dioxide are being measured from space - in this
case by the NASA OCO-2 mission, launched in 2014. Analysis by NASA indicates that the largest
sources of net carbon dioxide emissions derive from the Amazon, sub-saharan Africa, East and
South-East Asia and Europe (see Figure ST 7, yellow regions). Other regions, like Australia, are blue,
which NASA ascribes to the presence of a strong carbon dioxide sink.

Figure ST 7: NASA OCO-2 mission, regional concentations of carbon dioxide 2015-2018

Source: NASA 2019 https://climate.nasa.gov/news/2915/the-atmosphere-getting-a-handle-on-carbon-dioxide/

The IPCC, in its 6th Assessment Report on Climate Science, surveyed a broader set of instrument data
and, using inverse modelling techniques, presents data that is suggestive of a large land sink in
Australia. Consistent with the IPCC analysis, the Global Carbon Project (Ciais et al 2021), which
estimates the major forces at work in the global carbon cycle, also estimates the sink on Australia’s

Quarterly Update of Australia’s National Greenhouse Gas Inventory: March 2021                             32
lands to be substantial as does Harris et al 2021, applying remote sensing techniques to satellite
imagery to document the greening of many areas of the world.

In the last National Inventory Report, the Department estimated a net sink for the land sector of
around 20Mt of carbon dioxide.

This small estimate reflects historical decisions on inventory development that focussed on
understanding the trend in net emissions across the land caused by explicit management actions
that disturb the forest, or by other disturbances, rather than the precise magnitude of any net sink
on Australia’s lands. On two occasions, due to a lack of information on trends in these sinks, the
Department has taken decisions to set aside from the inventory previously identified sequestration
processes – one relating to the process of vegetation thickening (at the time, estimated at around
12Mt a year) and one relating to the sequestration of carbon by not–yet-mature native forests (at
the time, estimated at around 18Mt a year).

In light of the broad evidence on the size of the carbon sink in Australia provided by the analysis of
the IPCC and from NASA satellite data, new inventory development work is being undertaken now to
revisit the modelling of these sequestration processes in order to improve the reconciliation
between the ‘bottom-up’ inventory modelling and ‘top-down’ science models based on mass
balance approaches.

    ·   Vegetation thickening in Australia’s woodlands – support was provided in the 2019 Budget
        for development of methods for Australia’s woodlands. As part of this initiative, the CSIRO is
        estimating a new approach to the modelling of carbon accumulation in Australia’s
        woodlands that will link biomass to woody canopy cover estimates and which will allow the
        tracking of carbon accumulation for these processes of thickening (and, at times,
        degradation).
    ·   Age structure of Australian harvested forests - in conjunction with the States, new method
        development is focussed on the implementation of spatial estimation systems for stocks in
        harvested native forests in FullCAM, drawing on spatial information on past harvesting rates
        and the spatial determination of the age of trees in native forests, with likely increases in
        carbon sequestration compared with current estimates. An initial specification was reached
        for New South Wales and Victoria in the 2021 NIR submission. The 2022 work program will
        incorporate refinement of the work on New South Wales and Victoria and new estimates for
        Tasmania.
    ·   Forest sinks – the work of the IPCC indicates that forests have been absorbing increased
        amounts of carbon over time (see also Haverd et al 2013). These impacts are not currently
        captured for the Australian inventory, unlike in inventories for the European Union and the
        United States, where there is greater availability of direct measurement approaches in
        forests.

Internationally, there is also greater political acceptance of broader approaches to the estimation of
sinks. In Europe, for example, the EU’s new Climate Neutrality law promotes the use of the complete
range of sinks in the EU’s accounting (Article 4) compared with the more, limited activity-based
approach provided for in the EU’s current KP-style accounting approaches.

In light of the above, the Department intends to undertake method developments to the FullCAM
modelling approach in future inventory cycles to promote greater comparability of the Australian
inventory with the inventory methods utilised by other countries in their reporting, including the
European Union and the United States.

Quarterly Update of Australia’s National Greenhouse Gas Inventory: March 2021                        33
You can also read