Shore Power Technology Assessment at U.S. Ports - Office of Transportation and Air Quality EPA-420-R-17-004
←
→
Page content transcription
If your browser does not render page correctly, please read the page content below
Shore Power Technology
Assessment at
U.S. Ports

 Office of Transportation and Air Quality
 EPA-420-R-17-004
 March 2017
Shore Power Technology
 Assessment at U.S. Ports

 Transportation and Climate Division
 Office of Transportation and Air Quality
 U.S. Environmental Protection Agency

 Prepared for EPA by
 Eastern Research Group, Inc.

 and

 Energy & Environmental Research Associates, LLC

 EPA Contract No. EP-C-11-046
 Work Assignment No. 4-06

NOTICE

This technical report does not necessarily represent final EPA decisions or
positions. It is intended to present technical analysis of issues using data
that are currently available. The purpose in the release of such reports is to
facilitate the exchange of technical information and to inform the public of
technical developments.

 EPA-420-R-17-004
 March 2017
SHORE POWER TECHNOLOGY ASSESSMENT AT U.S. PORTS – OVERVIEW Ports are major centers for movement of goods and passengers from vessels in the United States (U.S.) and are vital to America’s business competitiveness, jobs, and economic prosperity. Goods and passengers moving through ports are projected to grow as are the size of ships due to the opening of the new Panama Canal locks in 2016 and other factors. Some vessel types, such as cruise, container, and refrigeration, can require significant power while at berth. This power is typically generated by diesel auxiliary engines. Emissions from vessels running auxiliary diesel engines at berth can be significant contributors to air pollution. As port traffic grows in certain areas, air pollution may also increase. Exposure to air pollution associated with emissions from ocean going vessels and other diesel engines at ports (including particulate matter, nitrogen oxides, ozone, and air toxics) can contribute to significant health problems—including premature mortality, increased hospital admissions for heart and lung disease, increased cancer risk, and increased respiratory symptoms – especially for children, the elderly, outdoor workers, and other sensitive populations. 1 Many ports and port-related corridors are also located in areas with a high percentage of low income and minority populations who are often disproportionately impacted by higher levels of diesel emissions. 2 Shore power can be used by marine vessels to plug into the local electricity grid and turn off auxiliary engines while at-dock. When using shore power, auxiliary systems, such as lighting, air conditioning, and crew berths use energy from the local electrical grid. Shore power typically produces zero onsite emissions. The power generation plant that supplies electricity to shore power applications may or may not be within the confines of the port and can be located outside the local air shed. While shore power can reduce auxiliary engine emissions at berth, shore power does not address emissions from boilers or other vessel sources. The assessment also describes other alternatives that may capture emissions at berth. This Shore Power Technology Assessment at U.S. Ports reviews the availability of shore power at ports throughout the U.S., and characterizes the technical and operational aspects of shore power systems installed at U.S. ports. Technical information was gathered working in partnership with ports that have installed shore power. The second part of the assessment presents a new methodology for estimating emission reductions from shore power systems for vessels docked and connected to shore power. A calculator tool provided with this report can be used to estimate how harmful air pollutants could be reduced at U.S. ports through the use of shore power systems; benefiting air quality, human health, the economy, and the environment. The estimates can be used in conjunction with EPA’s Diesel Emissions Reduction Act (DERA) program to help evaluate potential shore power projects for grant applications, and for reporting emission reductions from grant projects Additionally, the National Port Strategy Assessment (NPSA), which is a national scale assessment, was released in September of 2016. The NPSA explored the potential of a range of available strategies, including shore power, to 1 Near Roadway Air Pollution and Health: Frequently Asked Questions, EPA, EPA-420-F-14044, August 2014. https://nepis.epa.gov/Exe/ZyPDF.cgi/P100NFFD.PDF?Dockey=P100NFFD.PDF; Third Report to Congress: Highlights from the Diesel Emission Reduction Program, EPA, EPA-420-R-16-004, February 2016. https://nepis.epa.gov/Exe/ZyPDF.cgi?Dockey=P100OHMK.pdf; Health Assessment Document for Diesel Engine Exhaust, prepared by the National Center for Environmental Assessment for EPA, 2002; and Diesel and Gasoline Engine Exhausts and Some Nitroarenes, International Agency for Research on Cancer (IARC), World Health Organization, June 12, 2012. http://monographs.iarc.fr/ENG/Monographs/vol105/ 2 Control of Emissions from New Marine Compression-Ignition Engines at or Above 30 Liters per Cylinder, EPA, 75 FR 24802, April 30, 2010. https://www.epa.gov/regulations-emissions-vehicles-and-engines/final-rule-control-emissions-new marine-compression-0
reduce port-related emissions throughout the U.S. The NPSA report can be found at: https://www.epa.gov/ports initiative/national-port-strategy-assessment. The NPSA and the Shore Power Technology Assessment at U.S. Ports support EPA’s Ports Initiative to improve air quality around ports. Key Findings of the Shore Power Technology Assessment • Shore power can be effective at significantly reducing ship pollutant emissions at dock. Under the right circumstances when a vessel is connected to shore power, overall pollutant emissions can be reduced by up to 98% when utilizing power from the regional electricity grid, (depending on the mix of energy sources). o The potential emission reduction benefits may be estimated for a particular vessel, at berth when connected to shore power. Factors such as the amount of time actually connected, power consumption rate, energy costs and total time at berth are described in the assessment and relate to the overall effectiveness of shore power. Because these factors must be evaluated for each situation, total emission reductions may vary. o The assessment suggests that shore power may be most effective when applied at terminals and ports with a high percentage of frequently returning vessels, typically cruise ships and container ships. • Application of shore power for commercial marine vessels in the United States is relatively new and at present, not commonly available. There are currently ten ports using high voltage systems, serving cruise, container and refrigerated (“reefer”) vessels, and 6 ports using low voltage systems, serving tugs and fishing vessels. Though the technology is relatively new in the commercial sector, shore power has been successfully used by the U.S. Navy for decades, and is included in the Navy’s Incentivized Shipboard Energy Conservation program. • Vessels that frequently call on the same ports and remain at berth for longer times are potentially the best applications for shore power. • Many ports do not have the appropriate infrastructure to connect to vessels with shore power components. Ships can be retrofitted with vessel-side infrastructure to connect to port shore power systems. International shore power standards are in place to make it easier for ports to select the proper equipment. • Barriers to shore power installation include infrastructure and electricity costs. Shore power requires landside infrastructure, electrical grid improvements, and vessel modifications. The relative cost of using shore power instead of a vessel’s own fuel sources is more attractive when fuel costs are greater than electricity costs. • The Shore Power Emissions Calculator (SPEC) developed for this report can be an effective tool to assess environmental benefits of shore power when a vessel is connected. Port authorities can use SPEC to assess the environmental benefits of using shore power by vessel type in an area where shore power is being considered. o SPEC will be helpful for states and port authorities in evaluating potential benefits and in determining whether shore power would be an appropriate means to reduce pollution at a port.
o SPEC quantifies the changes in emissions when switching off engines of vessels and using shore
 power systems. The tool uses vessel and activity inputs, as well as offsetting emissions of
 electrical power use from shore-side power to determine emission changes for most pollutants. To
 analyze the shore-side power, the tool uses emission values from EPA’s Emissions & Generation
 Resource Integrated Database (eGRID). The eGRID contains the environmental characteristics of
 electrical power generation for almost all regions in the United States.

 o While the SPEC is intended to provide consistency in estimating shore power benefits primarily
 for DERA purposes, the SPEC is not appropriate for certain analyses like those performed in
 support of State Implementation Plans (SIPs) and Conformity.

 o SPEC offers users two ways to estimate emissions. The first is a “General Model", for users with
 limited project information to estimate emissions reduction benefits through the use of a set of
 default data and assumptions. The General Model may be updated with more recent information,
 as available and appropriate. Secondly, a “User Input Model” is provided, which can generate
 more accurate estimates through user-defined inputs for the vessel auxiliary power, load factor,
 engine emission factors, and through the selection of specific electric generation facilities and their
 grid emissions mix, if that information is available to users.

 For more information about the Shore Power Technology Assessment
 Web: www.epa.gov/ports-initiative/shore-power-technology-assessment-us-ports
Email: Tech_Center@epa.gov or Arman Tanman at tanman.arman@epa.gov
Contents
Glossary ......................................................................................................................................... iv
Executive Summary........................................................................................................................ 1
1.0 Introduction......................................................................................................................... 2
2.0 Background ......................................................................................................................... 3
3.0 U.S. Shore Power Characteristics ....................................................................................... 6
 3.1 Capacity............................................................................................................................ 6
 3.2 Design............................................................................................................................... 7
 3.3 Standards .......................................................................................................................... 8
 3.4 Technical Specifications .................................................................................................. 8
 3.5 Usage and Price.............................................................................................................. 10
 3.6 Time at Berth.................................................................................................................. 12
 3.7 Costs and Benefits.......................................................................................................... 13
 3.8 United States Navy Shore Power Operations................................................................. 13
 3.9 California Air Resources Board’s Experience with Shore Power.................................. 14
 3.10 Future Shore Power Technologies and Projects ......................................................... 15
4.0 Existing Approaches, Methods, and Tools to Compare Shore Power and Vessel
 Emissions .......................................................................................................................... 16
 4.1 CARB (2007): Emissions Inventory Comparisons Pre- and Post-Shore Power............ 16
 4.1.1 Inputs..................................................................................................................... 16
 4.1.2 Data and Assumptions .......................................................................................... 17
 4.1.3 Equations............................................................................................................... 20
 4.1.4 Outputs.................................................................................................................. 20
 4.2 Corbett and Comer (2013): The Shore Power and Diesel Emissions Model................. 20
 4.2.1 Inputs..................................................................................................................... 20
 4.2.2 Data and Assumptions .......................................................................................... 21
 4.2.3 Shore Power Inputs ............................................................................................... 23
 4.2.4 Equations............................................................................................................... 26
5.0 Recommended Preliminary Approach and Methodology for Comparing Shore Power and
 Vessel Emissions .............................................................................................................. 26
 5.1 Inputs.............................................................................................................................. 27
 5.2 Data and Assumptions.................................................................................................... 27
 5.2.1 Vessel Inputs......................................................................................................... 28

 i
5.2.2 Activity Inputs ...................................................................................................... 30
 5.2.3 Shore Power Inputs ............................................................................................... 30
 5.3 Equations........................................................................................................................ 31
 5.3.1 Vessel Emissions When Operating Auxiliary Engines......................................... 31
 5.3.2 Shore Power Emissions......................................................................................... 32
 5.4 Outputs ........................................................................................................................... 32
 5.4.1 Outputs.................................................................................................................. 32
6.0 Conclusions....................................................................................................................... 33
References..................................................................................................................................... 34

Appendix A: Summary of 13 studies of the Costs and Benefits of Shore Power
Appendix B: Demonstration of Recommended Preliminary Approach and Methodology for
 Comparing Shore Power and Vessel Emissions
Appendix C: Locations of Shore Power Installations at U.S. Ports

Tables
Table 1. Criteria and greenhouse gas estimated emissions reductions from using shore power
over auxiliary engines at the Port of Charleston (Corbett and Comer, 2013)................................. 4
Table 2. United States OPS system installations by capacity and vessel type(s) served................ 6
Table 3. Technical specifications for OPS systems installed at U.S. ports. ................................... 9
Table 4. Vessel activity and service price at OPS facilities in the U.S......................................... 10
Table 5. Vessel activity and service price at OPS facilities in the U.S......................................... 11
Table 6. Average time at berth (hrs) by port and vessel type for select U.S. ports. ..................... 12
Table 7. Average time at berth by vessel type for U.S. ports. ...................................................... 12
Table 8. Average installed auxiliary engine power and load factor by vessel type used in CARB
(2007)............................................................................................................................................ 17
Table 9. Auxiliary engine power, auxiliary to main engine ratio, and hotelling load factor derived
from CARB’s 2005 Ocean Going Vessel Survey and used in EPA (2009). ................................ 18
Table 10. Auxiliary engine emissions factors used in CARB (2007) (g/kWh). ........................... 18
Table 11. Port-specific hotelling times used by CARB (2007). ................................................... 18
Table 12. Vessel-type-specific and port-specific growth rates used by CARB (2007); 2006 base
year................................................................................................................................................ 19
Table 13. Shore power emissions factors used in CARB (2007). ................................................ 19
Table 14. Expected hotelling emissions reductions from shore power (tons/day), as presented in
CARB (2007). ............................................................................................................................... 20
Table 15. Assumptions for 2,000-passenger cruise vessel characteristics and activity in 2013 and
2019 in Corbett and Comer (2013). .............................................................................................. 22
Table 16. Emissions factors (g/kWh) used to calculate 2,000-seat cruise vessel emissions in 2013
in Corbett and Comer (2013). ....................................................................................................... 22
Table 17. Emissions factors (g/kWh) used to calculate 2,000-seat cruise vessel emissions in 2013
in Corbett and Comer (2013). ....................................................................................................... 22
Table 18. Assumptions for 3,500-passenger cruise vessel characteristics and activity in 2019 in
Corbett and Comer (2013). ........................................................................................................... 22

 ii
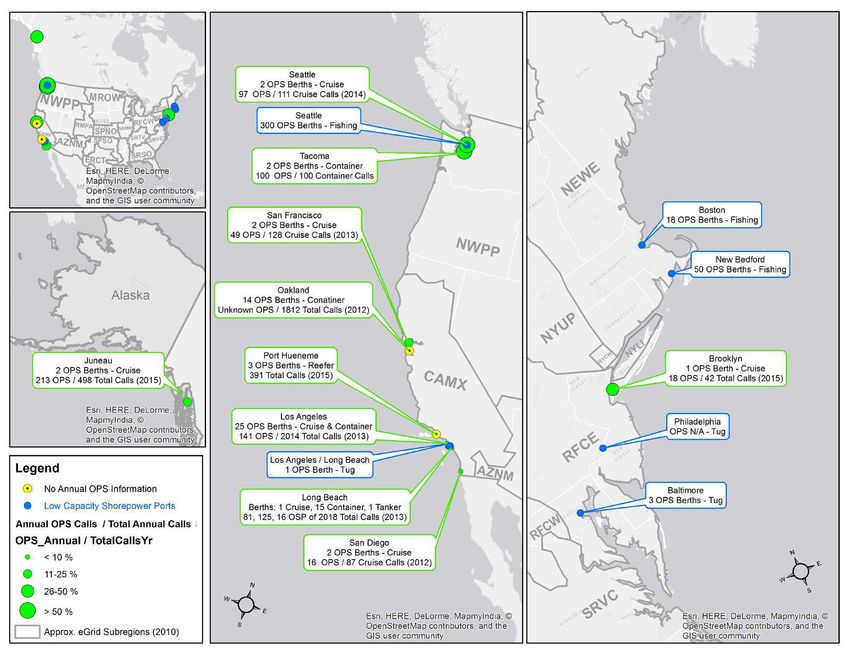
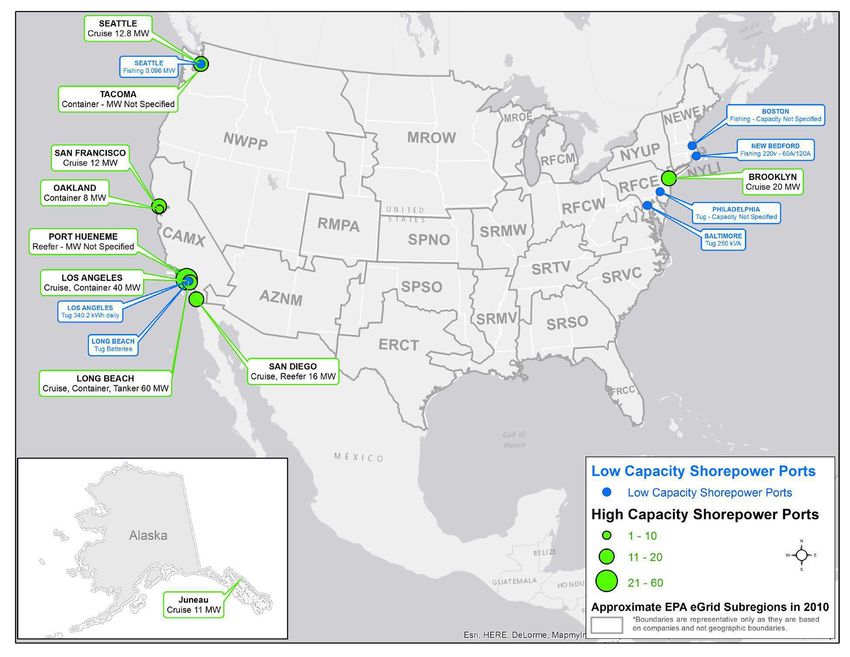
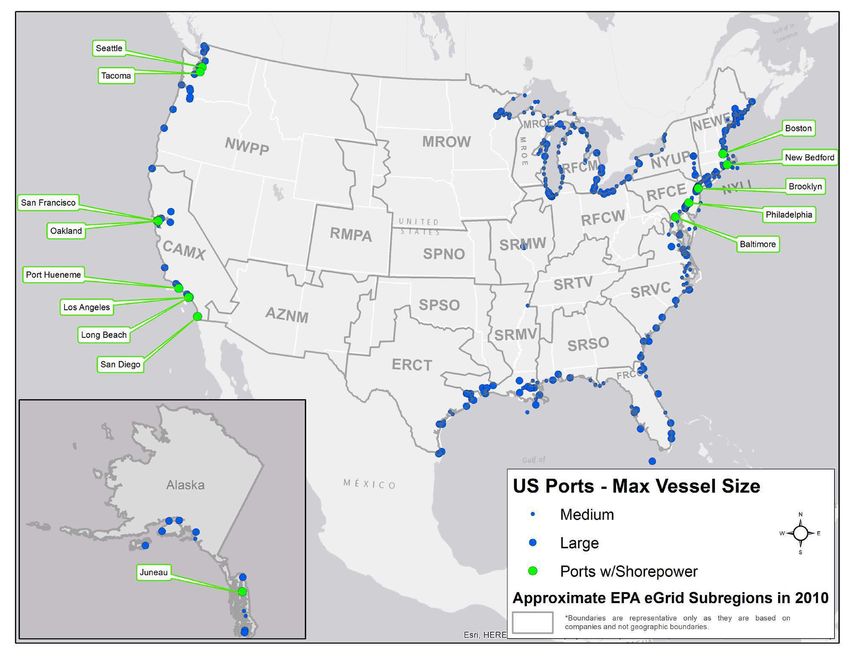
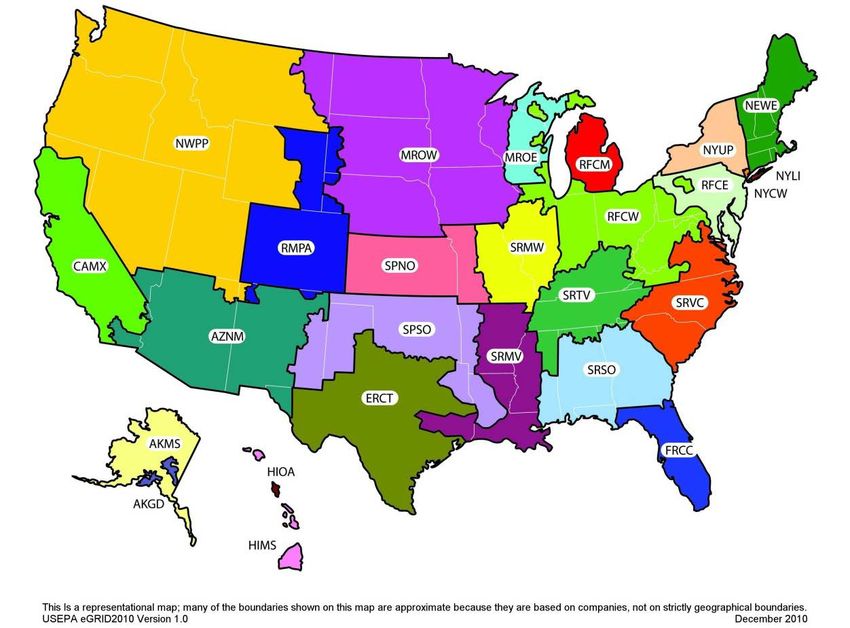
Table 19. Assumptions for 3,500-passenger cruise vessel characteristics and activity in 2019 in
Corbett and Comer (2013). ........................................................................................................... 23
Table 20. Electricity generation and emissions by facilities that would provide shore power, in
Corbett and Comer (2013). ........................................................................................................... 24
Table 21. 2010 eGRID Annual Emissions Rates for Coastal Subregions. ................................... 25
Table 22. Auxiliary engine emissions factors for medium speed engines (g/kWh), as found in
CARB (2011). ............................................................................................................................... 29
Table 23. Potential 2013 emissions (metric tons) generated by the 2,000-passenger cruise vessel
while at berth using shore power compared with onboard engines operating on 1%, 0.5%, and
0.1% S fuel, respectively, in Corbett and Comer (2013). ............................................................. 33
Table 24. Potential 2019 emissions (metric tons) generated by a 2,000 passenger cruise vessel
and a 3,500 passenger cruise vessel while at berth using shore power compared with using
onboard engines operating on 0.1% S fuel, in Corbett and Comer (2013)................................... 33
Table B-1. Shore power emissions calculator using eGRID regional emissions factors............ B-3
Table B-2. Criteria pollutant and CO2 emissions rates for selected eGRID regions with USER
ENTRY specified for the Port of Charleston. USER ENTRY values transferred from
Table 20. ..................................................................................................................................... B-4
Table B-3. Shore power emissions calculator using facility-specific emissions factors in
Table B-2. ................................................................................................................................... B-5

Figures
Figure 1. Existing shore power installations at U.S. ports and U.S. EPA eGRID subregions. ...... 7
Figure 2. U.S. EPA eGRID subregions in 2010. .......................................................................... 25
Figure C-1. Locations of shore power installations in the U.S., their capacity, number of shore
power berths, and vessel calls. .................................................................................................... C-1
Figure C-2. Location of U.S. ports with shore power and other U.S. ports................................ C-2

 iii
GLOSSARY

A Amperes
AIS Automatic Identification System
AMEC Advanced Maritime Emission Control
At-berth When the vessel is stationary at the dock
Auxiliary engines Onboard vessel engines that provide power for ancillary systems including
loading/unloading, refrigeration, heating, cooling, etc.
Barge A non-powered marine vessel that can be pushed or pulled into position by tug boats
Berth A ship’s assigned place at a dock
Bulk vessels Ships that transport bulk cargo such as coal, iron ore, etc.
Bunker fuel Fuel used in marine vessels
CARB California Air Resources Board
CH4 Methane
CO Carbon monoxide
CO2 Carbon dioxide
CO2eq Carbon dioxide equivalent
Container vessels Ships that transport containerized cargo
Cruise vessels Ships that transport passengers to various ports-of-call
ECA Emission Control Area
EERA Energy & Environmental Research Associates, LLC.
eGRID Emissions & Generation Resource Integrated Database
EIA Energy Information Administration
ERG Eastern Research Group
Fishing vessels Commercial fishing vessels
FRCE First Reliability Corporation – East
g Grams
HC Hydrocarbons
HFO Heavy fuel oil
Hotelling Vessel operations while stationary at the dock
hrs Hours
Hz Hertz
IEC International Electrotechnical Commission
IEEE Institute of Electrical and Electronics Engineers
iENCON Incentivized Shipboard Energy Conservation
IMO International Maritime Organization
ISO International Organization for Standardization
kV Kilovolts
kWh Kilowatt-hours
Laker A ship that operates on the North American Great Lakes
LNG Liquefied natural gas
LPG Liquid petroleum gas
LVSC Low voltage shore connection
Main engines The vessel’s propulsion engines
MDO Marine diesel oil
MGO Marine gas oil
MT Metric tons

 iv
MVA Mega volt-ampere
MW Megawatt
MWh Megawatt-hours
N2O Nitrous oxide
nm Nautical miles
NRT Net registered tonnage
NOx Oxides of nitrogen
NY/NJ Port of New York/New Jersey
OPS Onshore Power Supply
OTAQ Office of Transportation and Air Quality
Passenger vessels Ships that transport passengers
PM Particulate matter
PM10 Particulate matter with an aerodynamic diameter less than or equal to 10 microns
PM2.5 Particulate matter with an aerodynamic diameter less than or equal to 2.5 microns
POLA Port of Los Angeles
POLB Port of Long Beach
Quayside Attached to the dock
Reefer vessels Ships that transport refrigerated cargo
RORO Roll-on/roll-off commercial marine vessels that enable freight trucks and vehicles to
drive on and off of the vessel
ROPAX Roll-on/roll-off vessels that are also equipped to transport passengers
S Sulfur
Shore Power Shore-side electrical power that marine vessels can plug into while at berth to
power ancillary systems including on-board electrical systems, loading/unloading equipment,
refrigeration, heating, and cooling
Short ton 2,000 pounds
SO2 Sulfur dioxide
SOx sulfur oxides
SPADE Shore Power and Diesel Emissions
Tanker vessels Ships that transport bulk liquids
TEU Twenty-foot equivalent unit
Tug vessels Ships that assist larger vessels with maneuvering in port
U.S. EPA United States Environmental Protection Agency
U.S. United States
UK United Kingdom
USACE United States Army Corps of Engineers
V Volts
Wharfinger The keeper or owner of a wharf or dock
yr Year

 v
EXECUTIVE SUMMARY

Shore power has the potential to reduce air pollutant emissions associated with energy
consumption from commercial marine vessels at berth. With shore power, the electricity ships
need to power their ancillary systems while at berth may be produced with fewer air pollution
emissions from land-side electricity power sources (e.g., power plants) as compared with
onboard diesel-powered auxiliary engines. However, the magnitude of potential emissions
savings depends on the fuel mix and electricity generation technology mix of the power source.

Given the potential air pollutant emissions reductions from shore power, the United States (U.S.)
Environmental Protection Agency (EPA) is evaluating the feasibility of baseline requirements
for EPA-approved shore power systems through the Shore Power Technology Assessment
project. This project is led by Eastern Research Group (ERG) and Energy & Environmental
Research Associates, LLC (EERA) and provides the EPA Office of Transportation and Air
Quality (OTAQ) with information about the characteristics, benefits, and costs of shore power
systems. This report summarizes the findings and proposed methodology developed by the
EERA team as the Task 3 deliverable of EPA Contract No. EPC-11-046, Work Assignment No.
4-06.

This report characterizes the technical and operational aspects of shore power systems in the U.S.
and also demonstrates an approach for comparing shore power and vessel emissions while at
berth. The report demonstrates that shore power is a relatively new technology in the United
States, with most systems coming into service in the last 10 years. While high capacity shore
power systems in the U.S. have similar technical specifications and meet international operation
and safety standards, the characteristics of low capacity systems in the U.S. vary considerably.
High capacity systems are mainly used by cruise, container, and refrigerated vessels, while low
capacity systems are used by fishing and tug vessels. The time vessels spend at berth, which
affects how much shore power the vessel could potentially use, varies from port-to-port and by
vessel type, with cruise ships and roll-on/roll-off (RORO) vessels hotelling for shorter periods
than container and bulk cargo vessels.

To compare shore power and vessel emissions while at berth, this report recommends an
approach similar to the California Air Resources Board (CARB) (2007) and Corbett and Comer
(2013) as outlined in Section 5. The approach outlined here builds upon previous work as it
enables an analyst to (1) estimate the amount of air pollutants that would be emitted by a vessel
operating its onboard diesel-powered auxiliary engines; (2) estimate the amount of air pollutants
that would be emitted by the regional, land-side electricity grid to provide the same amount of
power to the vessel; and (3) compare those emissions. Additionally, the model presented here
allows for fine tuning through selection of specific generation facilities, and user-defined inputs
for the grid emissions mix, vessel auxiliary power, load factor, and engine emission factors. The
approach outlined in this report can be used to estimate how harmful air pollution emissions
could be reduced at U.S. ports through the use of shore power systems, benefiting air quality,
human health, the economy, and the environment.

Despite these potential benefits, an examination of studies and reports about shoreside power in
13 individual ports suggests that the use of shore power may face a variety of implementation
barriers. Ships must have the necessary vessel-side infrastructure to connect to shore power

 1
systems, requiring a substantial investment. Depending on the relative costs of marine bunker
fuels and shore-side electricity, it may be less expensive to operate auxiliary engines rather than
connect to shore power. However, harmonized international standards for shore power
installations may reduce those costs by reducing uncertainty for fleet owners and operators with
respect to the vessel-side infrastructure needed to enable the ship to connect to shore power. In
addition, states and port authorities may be able to reduce costs through incentive programs.

Finally, these studies suggest that shore power may be most effective when applied at terminals
and ports with a high fraction of frequent callers, which are typically cruise ships and container
ships. For other types of ships and, in particular, for ships that call infrequently, programs should
carefully consider the costs of obtaining and maintaining the equipment, both on ships and on
shore.

Under the right conditions, shore power can be effective at reducing ship NOx, PM2.5 and CO2
emissions. The modeling tools set out in this study will be helpful to states and port authorities in
evaluating and designing shore side power programs.

1.0 INTRODUCTION

The Shore Power Technology Assessment (Assessment) is a project led by ERG and EERA to
provide the EPA OTAQ with information about shore power systems, including their
characteristics, emissions benefits, and costs. This report characterizes the technical and
operational aspects of shore power systems in the U.S., demonstrates an approach for comparing
shore power and vessel emissions while at berth, and summarizes the experience of 13 ports
shore side power programs. The U.S. EPA is evaluating the technical feasibility of baseline
requirements for EPA-approved shore power systems; this report supports that evaluation.

The Assessment was broken down into three tasks:

 • Task 1: Compile shore power information
 • Task 2: Develop a preliminary approach or methodology to calculate ship emissions
 reductions from shore power
 • Task 3: Produce a shore power report that characterizes shore power systems in the U.S.
 and demonstrates a preliminary approach or methodology to calculate ship emissions
 reductions from shore power

EERA delivered this report to EPA to fulfill Task 3 under EPA Contract No. EPC-11-046, Work
Assignment No. 4-06. This report is comprised of six sections. Section 1 introduces the
Assessment project. Section 2 provides a brief background on shore power and its potential
emissions reduction benefits for at-berth vessels. Section 3 evaluates the characteristics of
existing shore power systems in the U.S. Section 4 reviews existing approaches to compare shore
power and vessel emissions while at berth. Section 5 describes a recommended preliminary
approach for comparing shore power and vessel emissions while at berth. Section 6 presents
some conclusions.

 2
There are three appendices to this report. Appendix A summarizes a set of reports that provide
information on shore side power programs at 13 ports, including environmental benefits and
costs of those programs. Appendix B provides a demonstration of the recommended preliminary
approach and methodology for comparing shore power and vessel emissions as outlined in
Section 5 of this report. Appendix C contains maps showing the locations of shore power
installations at U.S. ports.

2.0 BACKGROUND

Ports are the main gateway for U.S. trade and are essential to the economies of many cities and
regions nationwide. In recent years, there has been a growing emphasis on the globalization of
trade and the transportation infrastructure needed to support it. The EPA’s OTAQ recognizes the
economic and environmental significance of the U.S. port industry sector and is developing a
comprehensive Ports Initiative to explore and identify ways to incentivize and evaluate
technologies and strategies to reduce emissions at ports. One way to reduce emissions at ports is
using “shore power” technology. Shore power allows ships to “plug into” electrical power
sources on shore. Turning off ship auxiliary engines at berth would significantly reduce ship
diesel emissions, but these emission savings must be compared to the emissions generated by the
land electrical grid.

More specifically, the basis for emissions reduction claims when using shore power stems from
the potential to produce the electricity ships need to power their ancillary systems with fewer air
pollution emissions from land-side electricity power sources (e.g., power plants) as compared
with onboard diesel-powered auxiliary engines. The potential emissions savings will depend on
the fuel and electricity generation technology mix of the power source.

Typically shore power systems are supplied by the regional electricity grid. Thus, the emissions
associated with producing electricity for shore power will vary depending on the relative shares
of zero/low-emission sources (e.g., hydro, wind, solar, nuclear) and higher emission sources
(e.g., coal- and natural gas-fired power plants). The relative shares of fuel sources can change
over time (and even vary hour-to-hour depending on electricity demand). Shore power
proponents note that as the electricity grid becomes cleaner and more efficient, the potential
emissions reductions compared to auxiliary engines will grow. However, the cost of shore power
electric generation and delivery, for both the vessels and the terminal, can be substantial.

The emissions reduction benefits of shore power have been estimated or reported by a number of
organizations and researchers. For example, CARB (2007) estimated that their At-Berth
Regulation, which is designed to reduce air emissions from diesel auxiliary engines on container
ships, passenger ships, and refrigerated-cargo ships while at-berth (“hotelling”) at California
ports, would reduce localized emissions of particulate matter (PM) by 75% and oxides of
nitrogen (NOx) by 74% in 2020. These emissions reductions are expected to be achieved in one
of two ways. First, fleet operators can use the “limited engine use” compliance approach by
shutting off auxiliary engines (except for three or five hours of total operation), during 80% of
port visits in 2020 and connect to grid-supplied shore power instead. Second, fleet operators can
use the “emissions reduction option” compliance approach by reducing their fleet auxiliary
engine emissions at a port by 80%; this implies that auxiliary power would come from other,
lower emission sources (e.g., fuel cells) or through the use of emissions control technologies.

 3
Note that compliance requirements were 50% in 2014 and will increase to 70% in 2017 and then
80% in 2020. CARB (2007) estimated that the At-Berth Regulation would achieve a net
reduction of 122,000-242,000 metric tons of carbon dioxide (CO2) in 2020 for California ports
through the use of shore power. This is equivalent to a 38-55% net reduction in CO2 emissions,
even after accounting for the emissions associated with producing the power from the regional
electricity grid.

Other studies also suggest the benefits of shore power A study by ENVIRON (2004) estimated
that shore power would reduce emissions of NOx and PM by more than 99% and 83-97%,
respectively, for vessels calling on the Port of Long Beach (POLB), CA. A report by Yorke
Engineering (2007) estimated that shore power could reduce emissions of NOx, CO,
hydrocarbons (HC), PM, and sulfur oxides (SOx) by approximately 80% for cruise vessels and
nearly 97% for refrigerated vessels (“reefers”) that called on the Port of San Diego, CA in 2007.

A 2013 analysis by Corbett and Comer (2013) estimated the potential emissions reductions from
shore power for at-berth cruise vessels at the Port of Charleston, SC. They found that shore
power would greatly reduce air pollution from these ships, as shown in Table 1. Emissions
reductions were estimated to be greater in 2019 as the local power company reduces the share of
coal in its electricity generation portfolio. 1
Table 1. Criteria and greenhouse gas estimated emissions reductions from using shore power over auxiliary
engines at the Port of Charleston (Corbett and Comer, 2013)
 Percent Reduction Using
 Pollutant Shore Power
 Carbon Monoxide (CO) 92%
 Nitrogen Oxides (NOx) 98%
 PM10 59%
 PM2.5 66%
 Sulfur Dioxide (SO2) 73%
 Carbon Dioxide (CO2) 26%

Additional studies have focused on ports outside the United States. Hall (2010) estimated that
shore power would have reduced emissions from at-berth vessels in the United Kingdom in 2005
as follows: NOx (92%); CO (76%); SO2 (46%); and CO2 (25%), assuming power was drawn
from the UK’s national electric grid. Chang and Wang (2012) estimated that shore power would
reduce CO2 and PM emissions by 57% and 39%, respectively, in the Port of Kaohsiung, Taiwan.
Sciberras et al. (2014) estimated that shore power could reduce CO2 emissions by up to 42%,
using a RORO port in Spain as a case study.

It should be noted, particularly with respect to the U.S ports studies, that the North American
Emission Control Area (ECA) had not yet been established at the time the studies were
performed. The ECA entered into force in 2012 and resulted in the use of cleaner, low-sulfur
fuels in commercial marine vessels and will reduce NOx emissions from engines on newer-built
vessels within 200 nautical miles (nm) of the U.S. coast. Under the ECA, fuel sulfur (S) content
was limited to 1.00% S when the ECA entered into force in August 2012 and was further limited

1
 The 2013 electricity grid mix was assumed to be 48% coal, 28% natural gas, 19% nuclear, 3% hydro, and 2%
 biomass. The 2019 grid mix was assumed to be 33% coal, 33% natural gas, and 34% nuclear or hydro.

 4
to 0.10% S on 1 January 2015. Additionally, marine engines installed on vessels built on or after
1 January 2016 and operating within the ECA will be subject to stringent Tier III NOx standards.
These standards reduce NOx emissions by 80% compared with Tier I standards. Despite the
ECA, shore power is still expected to substantially reduce air pollutant emissions (including NOx
and PM) at U.S. ports because of the potential to produce electricity at even lower emissions
rates from land-based sources.

In addition, with respect to U.S. ships, auxiliary engines are subject to the federal Clean Air Act
program. Ship auxiliary engines typically fall under Category 1 (< 5L displacement per cylinder)
or Category 2 (5L to 30L displacement per cylinder), as classified by the U.S. EPA. Tier 3 and 4
exhaust emission standards put forward by EPA require Category 1 and 2 engine manufacturers
to reduce NOx, HC, and PM emissions in newer engines for US-flagged vessels (EPA, 2016).

The combination of the ECA NOx emission requirements and the federal CAA standards for
engines on U.S. ships means that auxiliary engines are getting cleaner. Therefore, the expected
and observed emissions reductions from shore power will vary depending on the fuel mix of the
electricity source. Nevertheless, shore power is expected to reduce air pollutant emissions from
at-berth vessels in nearly all cases.

The studies examined in Appendix A suggest that shore power may be an important way to
reduce in-port and near-port emissions of air pollution, benefiting air quality for communities
located near or adjacent to the port, many of which are non-attainment areas for criteria air
pollutants. 2 A 2004 study commissioned by the POLB (ENVIRON, 2004) found that shore
power is most cost-effective when annual electricity consumption while hotelling is 1.8 million
kWh or more. Shore power becomes more economically attractive when bunker prices are high.
Moreover, improved air quality can improve human health and reduce environmental damages,
resulting in economic benefits from reduced medical costs and environmental remediation
expenses. The Appendix A studies show that many ports have seen reductions in criteria
pollutants of between 60% and 80%. There can also be reduced port noise benefits as auxiliary
engines are turned off. Using shore power also allows for maintenance crews to repair and
maintain machinery that might otherwise be inaccessible if the engines were running.

Shore power is a relatively new technology in the U.S., with most OPS systems coming into
service in the last 10 years. While high capacity OPS systems have similar technical
specifications and meet international standards, low capacity OPS systems vary considerably.
High capacity OPS systems are mainly used by cruise, container, and reefer vessels, while low
capacity systems are used by fishing and tug vessels. The time vessels spend at berth, which
affects how much shore power the vessel could potentially use, varies from port-to-port and by
vessel type, with cruise and RORO ships hotelling for shorter periods than container and bulk
cargo vessels.

2
 A map of counties designated “nonattainment” for the Clean Air Act’s National Ambient Air Quality Standards
 can be found on EPA’s Green Book website: http://www.epa.gov/airquality/greenbook/mapnpoll.html.

 5
3.0 U.S. SHORE POWER CHARACTERISTICS

This section identifies and describes 15 U.S. shore power facilities, also called Onshore Power
Supply (OPS) systems. These systems are owned and managed either by the ports or by
individual terminal tenants.

3.1 Capacity

These OPS systems fall into two main categories:

 • High capacity
 o > 6.6 kilovolts (kV)
 o Typically service large cruise, container, and reefer vessels.
 • Low capacity
 o 220-480 volts (V)
 o Typically service smaller vessels such as fishing vessels and tugs

Table 2 summarizes existing U.S. OPS system installations by capacity and the vessel type(s)
served. The locations of these OPS systems are shown in Figure 1.

 Table 2. United States OPS system installations by capacity and vessel type(s) served.
 Vessel Type(s) OPS Installation
 High Capacity
 Cruise only 4
 Cruise and Container 2
 Cruise and Reefer 1
 Container only 2
 Reefer only 1
 Subtotal 10

 Low Capacity
 Fishing vessels 3
 Tugs 3
 Subtotal 6

 Total 16

 6
Figure 1. Existing shore power installations at U.S. ports and U.S. EPA eGRID subregions.

3.2 Design

Shore power systems can be dock-mounted, containerized, or barge-mounted. Dock-mounted
systems developed by Cochran Marine have been installed at seven U.S. ports. They require
power metering and transformer equipment to be mounted on the dock and have a cable-
positioning device to help at-berth vessels connect to the system.

Containerized shore power systems are also in use. SAM Electronics and Cavotec have
developed containerized shore power solutions that are comprised of a cable reel, switchboard,
transformers, and power monitoring and control systems. Modular containerized systems allow
for flexibility in positioning the shore power connection to accommodate different loading or
berthing arrangements while reducing the need for quayside space as compared to dock-mounted
systems. However, unlike dock-mounted systems, containerized systems are not available for use
on cruise vessels due to constraints in cable handling and the location of the shore power socket
outlet on the lower decks.

Barge-mounted systems require little or no dockside space. These systems are self-contained
power plants that provide power for at-berth vessels. Barge-mounted systems typically use
alternative fuels or technologies such as liquefied natural gas (LNG) and fuel cells.

 7
3.3 Standards

All high capacity OPS installations meet IEC/ISO/IEEE 80005-1:2012 industry standards, 3
mandatory for all cruise vessels (L. Farguson, Port of Halifax, personal communication,
February 6, 2015). In contrast, only some low capacity OPS installations adhere to an
international standard. The IEC/ISO/IEEE 80005-3:2014 standard 4 for low voltage shore
connection (LVSC) systems for shore-to-ship connections, transformers, and associated
equipment for vessels requiring up to 1 mega volt-ampere (MVA, equivalent to 1 megawatt
(MW) at a power factor of 1) was released in December 2014. LVSC systems below 250
amperes (A) or 125 A per cable and not exceeding 300 V to ground are not covered by this
standard. Although some ports outside the U.S. have LVSC systems that adhere to the
IEC/ISO/IEEE 80005-3:2014 standard (e.g., the Port of Bergen, Norway), no U.S. OPS systems
are known to meet the standard currently.

3.4 Technical Specifications

The technical specifications for OPS systems installed at 14 U.S. ports are summarized in Table
3. These specifications were compiled from a number of different sources outlined in the Table 3
footnotes. Information is from the World Ports Climate Initiative shore power database 5 unless
otherwise noted. EERA attempted to fill data gaps by reaching out to ports directly, although
some missing information persists. Nevertheless, one can see that high capacity OPS serve
cruise, container, tanker, and reefer vessels, whereas low capacity systems serve fishing and tug
vessels. All U.S. systems use 60 hertz (Hz) frequency and were installed beginning in the year
2000. High capacity systems use 6.6 kV, 11 kV, or both; low capacity systems use 220-480 V.
Average usage is reported in various ways; watt-hours, electricity cost, or days of usage.

3
 http://www.iso.org/iso/catalogue_detail.htm?csnumber=53588
4
 http://www.iso.org/iso/catalogue_detail.htm?csnumber=64718
5
 http://www.ops.wpci.nl/ops-installed/ports-using-ops/

 8
Table 3. Technical specifications for OPS systems installed at U.S. ports.
 Vessel Types Year of Maximum Frequency Manufacturer
 Port Name using OPS Installation Capacity (MW) Average Usage (Hz) Voltage (kV)
 Juneau 8 Cruise 2001 11.00 4,107 MWh 60 6.6 & 11 Cochran Marine

 Seattle Cruise 2005-2006 12.80 60 6.6 & 11 Cochran Marine

 San Francisco 9 Cruise 2010 12.00 6,720 MWh (2013) 60 6.6 & 11 Cochran Marine
 7,182 MWh (2014)
 Brooklyn Cruise 2015 20 60 6.6 & 11 Cochran Marine

 Los Angeles Container 2004 40.00 19,560 MWh 10 60 6.6 Cavotec
High Capacity Cruise
 Long Beach Cruise 2011 16.00 60 6.6 & 11 Cavotec; Cochran
 Container 2009 Marine
 Tanker 2000
 San Diego Cruise 2010 16.00 12,871 MWh 11 60 6.6 & 11 Cochran Marine
 Reefer 8,004 MWh
 Oakland 12 Container 2012-2013 8 2 MW 60 6.6 Cavotec

 Hueneme Reefer 2014 2,411 MWh (2013) 60

 Tacoma Container 2009 60 6.6 Wood Harbinger
 RORO
 Seattle 13 Fishing 0.096 1 week - 6 months 60 0.4

 Boston 14 Fishing

 New Bedford 15 Fishing 2011 0.0264 5-330 Days 60 0.22
 connection time
Low Capacity ~12,450 MWh
 Philadelphia 16 Tug

 Baltimore Tug 0.250 daily 60 0.480

 Los Angeles / Long Tug 2009 0.3402 340.2 kWh daily 60
 Beach

 8
 Juneau (2011)
 9
 ENVIRON (2015)
 10
 $4.2 million in utilities at an average electricity cost of $0.215/kWh (Port of Los Angeles (POLA), 2014)
 11
 Yorke Engineering (2007)
 12
 Personal Communication: Chris Peterson, Wharfinger, Port of Oakland
 13
 Personal Communication: Ellen Watson, Port of Seattle
 14
 https://www.massport.com/port-of-boston/maritime-properties/boston-fish-pier/
 15
 Personal Communication: Edward Anthes-Washburn, Port of New Bedford. Reduction in diesel consumption of ~310,000 gallons annually (Appendix A). 1 gallon = ~40.15 kWh
 16
 ICF (2009)
 9
3.5 Usage and Price

Vessel activity at OPS terminals in the 13 ports presented in Appendix A and the price for connecting to OPS are summarized in Table 4. Activity was determined from the most
recent publicly available information but complete information was not available for all ports, as indicated by blank cells. Cruise activity at the Ports of Juneau and Brooklyn was
determined by cross-referencing cruise schedules with lists of shore power equipped cruise vessels. Cruse OPS activity for the Port of Seattle was provided to EERA by a port
representative. The number of shore power connections at the Ports of San Francisco (ENVIRON, 2015a), Los Angeles (Starcrest, 2014c), Long Beach (Starcrest, 2014a), San
Diego (ENVIRON, 2015b), and Oakland (ENVIRON, 2013) were estimated based on the most recently available port emissions inventories. Vessel activity for the Ports of Juneau
(CLAA, 2015) and Seattle (Port of Seattle, 2015) were estimated from cruise ship schedules. Port of Hueneme calls were estimated based on the Hueneme Vessel Schedule (Port
of Hueneme, 2015). Service prices for connecting to OPS were available from various sources shown in the associated footnotes.

 Table 4. Vessel activity and service price at OPS facilities in the U.S.

 Vessel Types # OPS # Unique OPS Annual Total Calls on OPS-
 Capacity Port Name using OPS Berths Vessels OPS Calls capable Berths (yr) Service Price
 Juneau Cruise 2 12 213 498 (2015) $4000-5000/day (ENVIRON, 2004)
 Seattle Cruise 2 5 97 111 (2014) P: $0.068/kWh OP: $0.045/kWh 17
 San Francisco Cruise 2 20 49 128 (2013)
 Brooklyn Cruise 1 2 18 18 42 (2015) $0.12/kWh ($0.26/kWh to deliver)
 $150 service charge + $1.33/kW
 High Capacity Container & facilities charge + $0.05910/kWh
 Los Angeles 25 54 141 2014* (2013)
 Cruise energy charge (additional charges may
 be applied - see the source)
 Cruise 1 81 2018* (2013)
 Varies - each SP terminal has its own
 Long Beach Container 15 125 account and rate structure with
 Southern California Edison
 Tanker 1 16

17
 For Port of Seattle electricity rates from Seattle City Light, see http://www.seattle.gov/light/rates/ratedetails.asp. P denotes peak energy rates, OP denotes off-peak energy rates. Additional peak demand charges of
 $2.02/kW, and off-peak demand charges of $0.22/kW also apply. Cruise terminal rates were assumed to fall under the High Demand General Service category for facilities with a maximum monthly demand equal
 to or greater than 10,000 kW.
18
 The Queen Mary 2 and the Caribbean Princess are currently listed as equipped to plug in to shore power at the Brooklyn terminal. Nycruise.com lists the two vessels as visiting the Brooklyn Terminal 18 times in
 2016, up from 15 visits in 2015.
 10
Table 5. Vessel activity and service price at OPS facilities in the U.S.

 Vessel Types # OPS # Unique OPS Annual Total Calls on OPS-
 Capacity Port Name using OPS Berths Vessels OPS Calls capable Berths (yr) Service Price
 San Diego Cruise 2 4 16 87 (2012)
 200
 Oakland Container 14 1812* (2012) $267 per hour 20
 High Capacity commissioned 19
 Hueneme Reefer 3 391*
 Tacoma Container 1 2 100 100

 Seattle Fishing 300 $0.079/kWh 21
 Boston Fishing 18 $0.042/kWh 22
 New Bedford Fishing 50 $0.079/kWh 23
 Low Capacity
 Philadelphia Tug
 Baltimore Tug 3 3 Daily
 Los Angeles /
 Tug 1 2 Daily
 Long Beach
* Denotes total port-wide vessel calls, not specific to OPS-equipped berths or terminals.

19
 See http://goo.gl/entmdD for a list of OPS commissioned vessels at the Port of Oakland.
20
 http://www.portofoakland.com/maritime/shore power.aspx
21
 Shore power hookups at fisherman’s Wharf were assumed to fall under the Medium Standard General Service category for the City of Seattle, covering customers with a maximum monthly demand equal to or
 greater than 50 kW, but less than 1,000 kW. Demand charges of $2.24/kW also apply. Note that this is the publicly offered rate and the port may have negotiated an alternate rate.
22
 Assumed to fall under Rate B2 – General for customers demanding greater than 10 kW but less than 200 kW. Rate given is for June-September, demand charges of $20.22 + $15.95/kW apply along with monthly
 customer charge of $18.19. See source for additional charges (https://www.eversource.com/Content/docs/default-source/rates-tariffs/2015-ema-business-electric-rates-1.pdf?sfvrsn=6).
23
 Massachusetts does not allow for organizations passing through the cost of electricity to impose additional tariffs for services rendered on top of the price of electricity. Vessels using shore power at the Port of
 New Bedford pay market electricity rates, metered and monitored by the Port of New Bedford. Rate was assumed to fall under the General Annual (G1) category for non-residential customers with load not
 exceeding 100 kW. Demand charges of $4.86/kW occur over 10 kW (https://www.eversource.com/Content/docs/default-source/rates-tariffs/2015-ema-business-electric-rates-2.pdf?sfvrsn=6).
 11
3.6 Time at Berth EERA reviewed time at berth at the Port of Long Beach, Port of New York/New Jersey, Seattle/Tacoma, and Port of Los Angeles and found that at-berth time varies from port-to-port and by vessel type (Table 6). Cruise and RORO vessels tend to spend the least amount of time at berth when compared to cargo vessels. POLB reports vessel berthing times ranging from 13 to 121 hours in their Cold-Ironing Cost Effectiveness Summary (ENVIRON, 2004). At the POLB, container vessel dwell times increased as vessel size (i.e., capacity) increased. Similarly, time at berth for container vessels at the Port of New York/New Jersey (NY/NJ) increased from 18 hours for a 1,000 twenty-foot equivalent unit (TEU) vessel, to 40 hours for a 9,000 TEU vessel (Starcrest, 2014b), although the at-berth time was considerably lower than that of POLB. Cruise and container dwell times at Port of Seattle/Tacoma are consistent with those observed at NY/NJ (Starcrest, 2013). Table 6. Average time at berth (hrs) by port and vessel type for select U.S. ports. Vessel Type POLB NY/NJ Seattle/Tacoma POLAa Containerb 68 26 31 48 Tanker 35 29c 21 39 General Cargo 31 14 41 53 RORO 12 12 16 17 Cruise 12 10 10 10 Reefer - 8 - 27 Dry Bulk 54 35 89 70 aStarcrest (2014c); bAverage of all container vessel sizes; cChemical tanker only ERG estimated average time at berth for all U.S. ports by vessel type for a recent, unpublished, analysis of arrival and departure data from the U.S. Army Corps of Engineers’ (USACE) Entrances and Clearances dataset. The data were reported in “days at berth” and converted to hours. The results of this analysis are presented in Table 7. Results exclude domestic (i.e., U.S. flag) vessel activity but still inform estimates of average vessel berthing times at U.S. ports. Table 7. Average time at berth by vessel type for U.S. ports. Vessel type Average time at berth (hrs) Barge 89 Bulk Carrier 91 Bulk Carrier (Laker) 28 Container 33 Crude Oil Tanker 54 Fishing 58 General Cargo 58 LNG Tanker 30 Liquid Petroleum Gas (LPG) Tanker 52 Miscellaneous 37 Cruise/Passenger 27 Reefer 60 RORO 29 Supply 39 Support 75 Tanker 61 Tug 49 12
Vessel type Average time at berth (hrs)
 Vehicle Carrier 33

3.7 Costs and Benefits

This study does not contain a comprehensive analysis of the costs and benefits of shore side
power. However, certain observations from various studies performed for particular ports are
noteworthy. A summary of published studies examining various aspects of the economic and
environmental costs and benefits of shore power for 13 U.S. ports is included as Appendix A.
The following discussion is based on those studies.

A 2004 study commissioned by the POLB (ENVIRON, 2004) found that shore power is most
cost-effective when annual electricity consumption while hotelling is 1.8 million kWh or more,
equivalent to a cruise ship drawing 7 MW of shore power for 260 hours annually. For a smaller
vessel drawing 1.5 MW, this threshold is equivalent to 1,200 hours annually. Cost-effectiveness
for vessels operating above the 1.8 million kWh annual threshold was $9,000 - $15,000/short ton
of combined criteria pollutants (ENVIRON, 2004).

At present, shore power has not been extensively adopted outside of European and North
American ports. However, there is an increase in efforts to encourage ports throughout the world
to adopt shore side power system. In Europe, under Directive 2014/94/EU, the European
Commission mandated the installation of shore power in all ports “unless there is no demand and
the costs are disproportionate to the benefits, including environmental benefits.” In Asia, the Port
of Shenzen offers subsidies for vessels switching to shore power or low-sulfur fuels while at
berth. Additionally, the Port of Shanghai has entered into an “ecopartnership” with the POLA to
facilitate sharing shore power information; Shanghai plans to offer shore power beginning in
2015.

Studies suggest that shore power becomes economically attractive when bunker fuel costs are
high relative to local, land-based, electricity prices. Maersk claims that shore power is not a cost-
effective emission reduction strategy for vessels calling at U.S. ports for short periods of time
(American Shipper, 2014). At current bunker prices, the industry argues shippers are less likely
to use shore power rather than marine gas oil (MGO) due to high up-front vessel commissioning
costs associated with shore power, the cost of purchasing the electricity while in port, and lower
cost options available such as Advanced Maritime Emission Control (AMEC) systems that scrub
exhaust gases and do not require shore power retrofits. However, if distillate oil prices rise
relative to electricity prices, then shore power may become more favorable than switching to
MGO fuel.

3.8 United States Navy Shore Power Operations

The U.S. Navy has used shore power on their large ocean going vessels for decades (where
available) and shore power is included in their Incentivized Shipboard Energy Conservation
(iENCON) program (U.S. Navy, 2015). The iENCON program mainly focuses on energy
reductions while underway, but also includes energy savings at berth. Water and electricity usage
are monitored and reported while in port and the shore power performance of each vessel is used
as part of the evaluation process for the Secretary of the Navy’s Energy Award.

 13
You can also read