State of Kansas Air Quality State Implementation Plan Regional Haze July 31, 2021 Volume 2 - Plan Revision Second Implementation Period 2018 ...
←
→
Page content transcription
If your browser does not render page correctly, please read the page content below
State of Kansas
                            Air Quality
                 State Implementation Plan

                          Regional Haze
                           July 31, 2021
                 Volume 2 – Plan Revision
   Second Implementation Period (2018 – 2028)

Our Vision- Healthier Kansans living in safe and sustainable environments.

       Department of Health and Environment
             Division of Environment
                  Bureau of Air
                 (785) 296-6024
Regional Haze Page 2 Volume 2 – Plan Revision
Table of Contents
Introduction .......................................................................................................................................................... 6
1.      Regional Haze Basics .................................................................................................................................... 7
2.      Historical Setting .......................................................................................................................................... 7
3.      Regulatory Setting ........................................................................................................................................ 8
4.      Regional Haze SIP Requirements ............................................................................................................. 10
     4.1       §51.308(f)(2) Long-term strategy for regional haze............................................................................ 10
        4.1.1         Potentially impacted Class I areas ..............................................................................................................11
        4.1.2         Visibility impairment at potentially impacted Class I areas .......................................................................12
        4.1.3         CenSARA AOI analysis .............................................................................................................................15
        4.1.4         WRAP AOI Analysis .................................................................................................................................20
        4.1.5   §51.308(f)(2)(i) Emission reduction measures for potentially affected anthropogenic source of visibility
        impairment .................................................................................................................................................................20
        4.1.6         §51.308(f)(2)(ii) State consultation ............................................................................................................22
        4.1.7         §51.308(f)(2)(iii) Technical basis for emission reduction measures for reasonable progress .....................22
        4.1.8         §51.308(f)(2)(iv) Additional factors in developing long-term strategy ......................................................32
     4.2       §51.308(f)(3) Reasonable progress goals ............................................................................................ 35
        4.2.1         §51.308(f)(3)(ii)(B) Demonstration of no additional reduction measures ..................................................35
     4.3       §51.308(f)(5) Progress Report .............................................................................................................. 36
     4.4       §51.308(f)(6) Monitoring strategy and other implementation plan requirements............................. 36
        4.4.1         §51.308(f)(6)(iii) Monitoring procedures ...................................................................................................36
        4.4.2         §51.308(f)(6)(v) Statewide inventory .........................................................................................................37
     4.5   §51.308(g) Requirements for periodic reports describing progress towards the reasonable
     progress goals.................................................................................................................................................. 37
        4.5.1         §51.308(g)(1) Status of implementation of measures for achieving reasonable progress goals ..................37
        4.5.2    §51.308(g)(2) Summary of the emissions reductions through implementation of the measures described in
        paragraph (g)(1) .........................................................................................................................................................40
        4.5.3         §51.308(g)(4) Analysis of changes in visibility impairment ......................................................................44
        4.5.4         §51.308(g)(5) Assessment of significant changes in anthropogenic emissions ..........................................46
        4.5.5         §51.308(g)(6) SIP sufficiency ....................................................................................................................46
        4.5.6         §51.308(g)(8) Smoke management program ..............................................................................................47
        4.5.7         §51.308(h) Determination of the adequacy of existing implementation plan .............................................47
        4.5.8         §51.308(i) State and Federal Land Manager coordination..........................................................................47

Regional Haze                                                                                                                                                              Page 3
Volume 2 – Plan Revision
List of Tables Table 1. Mandatory Class I federal areas with total measured AOI visibility impact by all Title V Kansas facilities greater than 1.00% (Kansas-related Class I areas) ................................................................................ 12 Table 2. Annual average haze index, haziest days (dv) for Kansas-related Class I areas ................................... 13 Table 3. Annual average haze index, clearest days (dv) for Kansas-related Class I areas .................................. 13 Table 4. Annual average haze index, 20% most impaired days (dv) for Kansas-related Class I areas (with default adjusted 2064 values)............................................................................................................................... 14 Table 5. Comparison of 2064 haze indices (dv): current unadjusted endpoints, adjusted endpoints, and 2004 (baseline)–2018 projected to 2064, for Kansas-related Class I areas .................................................................. 14 Table 6. Source sector descriptions for legend terms used in Figures 6, 7, 8, and 9 .......................................... 24 Table 7. Kansas NOX emissions for large (>1,000 tons) non-EGU point and nonpoint sectors from the 2011, 2014, and 2017 National Emissions Inventories.................................................................................................. 26 Table 8. 2011 and 2017 NOX emissions from the electricity generation sector for Kansas and neighboring states..................................................................................................................................................................... 27 Table 9. 2011 and 2017 SO2 emissions from the electricity generation sector for Kansas and neighboring states .............................................................................................................................................................................. 31 Table 10. Kansas subject-to-BART and related emission units and their controls and emission limits for the Regional Haze Rule’s first implementation period.............................................................................................. 38 Table 11. Ranked list of sources under the reasonable progress analysis (first implementation period), with current status ........................................................................................................................................................ 39 Table 12. Actual 2002 and 2018 emissions of NOX, SO2, and PM10 for Kansas subject-to-BART and related emission units....................................................................................................................................................... 40 Table 13. Kansas anthropogenic emissions (tons) of NOX, PM2.5, and SO2 for years 2014–2018 (interpolated from NEI and modeling estimates, except ptegu) ................................................................................................ 41 Table 14. 2014–2018 normalized slopes of 20% most impaired days haze index for Kansas-related Class I area and of Kansas anthropogenic emissions of NOX, PM2.5, and SO2 ....................................................................... 45 Table 15. Kansas and neighboring states: coal-fired electric generating unit (EGU) NOx and SO2 emissions and controls (2018) .............................................................................................................................................. 50 Regional Haze Page 4 Volume 2 – Plan Revision
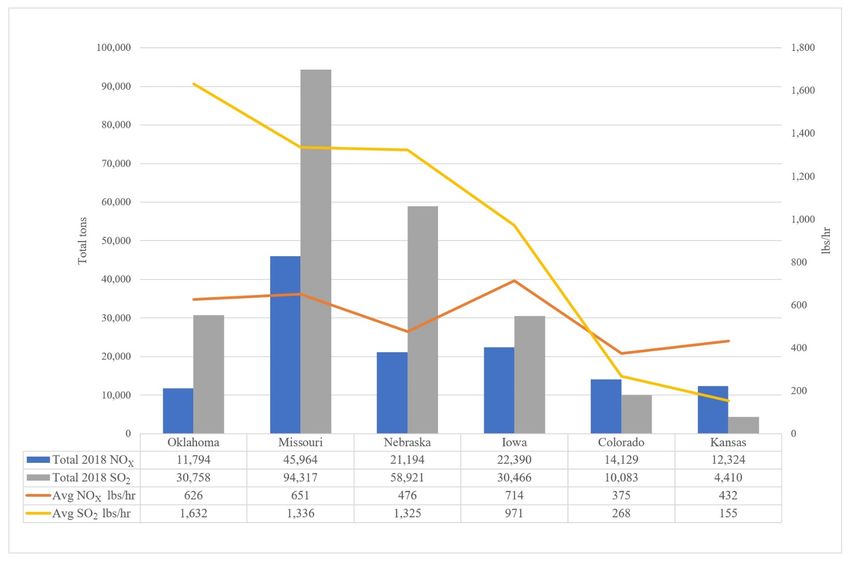
List of Figures
Figure 1: Map of the 156 mandatory Class I federal areas ................................................................................... 9
Figure 2. Total percent visibility percent impact by CenSARA and bordering state facilities at mandatory
Class I federal areas included in the CenSARA AOI study................................................................................. 17
Figure 3. Highest single facility percent visibility percent impact by CenSARA and bordering states at
mandatory Class I federal areas included in the CenSARA AOI study .............................................................. 18
Figure 4. Number of mandatory Class I federal areas for CenSARA and bordering states with total visibility
impact greater than 3.00% ................................................................................................................................... 19
Figure 5. Number of mandatory Class I federal areas for CenSARA and bordering states with a highest single
facility visibility impact greater than 1.00% ........................................................................................................ 19
Figure 6. Kansas NOX emissions (tons) by source sector, 2011–2028 ............................................................... 25
Figure 7. Kansas PM2.5 emissions (tons) by source sector, 2011–2028 ............................................................. 28
Figure 8. Kansas SO2 emissions (tons) by source sector, 2011–2028 ................................................................ 30
Figure 9. Anthropogenic air emissions (tons) of NOX in Kansas by source sector, 2014–2018 ........................ 42
Figure 10. Anthropogenic air emissions (tons) of PM2.5 in Kansas by source sector, 2014–2018 ..................... 43
Figure 11. Anthropogenic air emissions (tons) of SO2 in Kansas by source sector, 2014–2018 ....................... 44
Figure 12. Kansas and neighboring states: coal-fired electric generating unit (EGU) NOx and SO2 emissions
total tons and average annual emission rates (2018) ........................................................................................... 51

Regional Haze                                                                                                                                         Page 5
Volume 2 – Plan Revision
Introduction
In amendments to the Clean Air Act (CAA) in 1977, Congress set a national goal to restore national parks and
wilderness areas to pristine conditions by preventing any future and remedying any existing man-made visibility
impairment. In 1999, the U.S. Environmental Protection Agency (EPA) finalized the federal Regional Haze Rule
(RHR), which aims to fulfill the goals set forth in the CAA by the year 2064. The RHR requires states to submit
revisions to their State Implementation Plans (SIPs) every ten years; the first round of SIPs was due December
2007. For its second ten-year implementation period EPA issued in January 2017 a final rule revision, which
included allowing states to submit their regional haze SIPs by July 31, 2021.
The RHR applies to all states that contribute or potentially contribute to visibility impairment in the
aforementioned national parks and other natural areas (mandatory Class I federal areas), including states such as
Kansas that do not have Class I areas. In the first implementation period, several Kansas sources were identified
by Oklahoma as potential contributors to visibility impairment at the Wichita Mountains Wilderness Class I area.
As a result, the Kansas Department of Health and Environment (KDHE) obtained agreements with the owners
of the largest coal-fired power plants in the state that modeled as contributors to visibility impairment at Wichita
Mountains. The resulting decrease in emissions of the two most important anthropogenic pollutants contributing
to haze, NOx and SO2, has been significant; since 2009, the year KDHE submitted its first RHR SIP to EPA,
Kansas stationary facility emissions of NOx have decreased from 97,967 tons to 50,318 tons (a 49% decrease),
and emissions of SO2 have decreased from 58,497 tons to 7,550 tons (an 87% decrease).
In its latest 2017 rulemaking for the RHR, EPA clarified that all states, including states with no Class I areas, are
required to develop a long-term strategy based on analysis of emission control measures, and demonstrate that
there are no additional emission control measures necessary for reasonable progress. The analysis of emission
control measures, however, cannot be done unless and until states determine which facilities have significant
visibility impact at a given Class I area. To this end, KDHE, along with other member states of the Central States
Air Resource Agencies (CenSARA), employed the modeling and analysis technique called area of influence
(AOI), which provides quantitative estimates of visibility impact at each Class I area studied for every Title V
facility in the state. For the second implementation period, no Kansas facility demonstrated an impact on any of
the Class I areas studied greater than 0.84%. This result, combined with the significantly higher level of impacts
from air sources from neighboring states, leads KDHE to conclude that, for the second implementation period,
there are no additional control measures necessary by Kansas facilities for reasonable progress.

Kansas will continue to coordinate in regional efforts to reduce visibility impairment at Class I areas by
maintaining a visibility monitoring network and emissions inventory program, and by providing periodic
progress reports and SIP revisions as required by the Regional Haze Rule.

Regional Haze                                                                                                 Page 6
Volume 2 – Plan Revision
1.        Regional Haze Basics
Regional haze can obscure the view of what the human eye perceives. Contributors to regional haze can be
natural, such as fog, sea salt, and smoke from wildfires. Other contributors to regional haze are anthropogenic,
that is, of human origin. For example, fossil fuel combustion of all kinds can contribute to regional haze.
Electricity production (especially coal-fired power plants), chemical manufacturing, institutional and residential
heating, and motor vehicle operation are just a few examples of human activities that involve the combustion of
fossil fuels. Agricultural activities, including agricultural fires, can also contribute to regional haze. All these
activities emit pollutants that are considered haze precursors, including nitrogen oxides (NOx); particulate matter,
especially that less than or equal to 2.5 µm in diameter (PM2.5); sulfur dioxide (SO2); and volatile organic
compounds (VOCs). Particulate matter is also released from other human activities including road dust and
agricultural tilling. In addition to these pollutants, ammonia (NH3) is a regional haze precursor. Human activities
that release ammonia include fertilizer application and confined animal feeding operations.

Two important metrics for quantifying visibility impairment due to haze are light extinction and the haze index.
Light extinction is caused by the absorption and scattering of light by gases and particles in the atmosphere,
which reduce the amount of light that is returned from a vista to an observer. The unit of measure for light
extinction is inverse megameters (Mm-1). The haze index is quantified in terms of deciviews (dv) and expresses
change in visibility. Deciviews are unitless, indicated on a logarithmic scale (referenced to light extinction) and
correspond better with human perception. The mathematical relationship between light extinction (bext) and
deciviews (dv) is: deciview index (dv) = 10 ln (bext/10 Mm-1), where bext = the atmospheric light extinction
coefficient, expressed in inverse megameters (Mm-1). 1 Similar to light extinction, higher deciview levels indicate
higher levels of haze or visibility impairment.
Observed haze metrics are calculated from ambient particulate data that is collected and analyzed as part of the
Interagency Monitoring of Protected Visual Environments (IMPROVE) program. 2 The IMPROVE program is
managed by a steering committee consisting of representatives from federal agencies and regional (or multi-
jurisdictional) planning organizations, as well as state and international agencies. IMPROVE operates a network
of more than 100 ambient monitors located at Class I area sites across the U.S., as well as additional protocol
monitors to provide expanded spatial coverage for the network.

2.        Historical Setting
In amendments to the Clean Air Act (CAA) in 1977, Congress set a national goal to restore national parks and
wilderness areas to pristine conditions by preventing any future and remedying any existing man-made visibility
impairment. In 1999, the U.S. Environmental Protection Agency (EPA) finalized the federal Regional Haze Rule
(RHR), which aims to fulfill the goals set forth in the CAA by the year 2064. The RHR requires states to submit

1
    https://www.govinfo.gov/content/pkg/CFR-2019-title40-vol2/pdf/CFR-2019-title40-vol2-sec51-301.pdf
2
    http://vista.cira.colostate.edu/Improve/

Regional Haze                                                                                                Page 7
Volume 2 – Plan Revision
revisions to their State Implementation Plans (SIPs) every ten years; the first round of SIPs was due December
2007. For its second ten-year implementation period EPA issued in January 2017 a final rule revision, which
included allowing states to submit their regional haze SIPs by July 31, 2021.
The RHR addresses the combined effects of several pollution sources over large geographic areas. It is therefore
necessary to use a regional planning approach. For the RHR’s first implementation period EPA designated five
regional planning organizations (RPOs); the Central Regional Air Planning Association (CENRAP) was
designated as the RPO representing the central portion of the United States, including Kansas. Since then,
CENRAP has been superseded by a multi-jurisdictional organization, the Central States Air Resource Agencies
(CenSARA). Through the Kansas Department of Health and Environment (KDHE), the State of Kansas has been
actively involved in CenSARA just as it was in the past with CENRAP. The Kansas Regional Haze Plan
incorporates data analyses, modeling results, and technical support documents prepared for CenSARA member
states by various contractors. In addition, CenSARA has served as a platform for consultation between states,
tribes, federal land managers (FLMs), and stakeholders.
The RHR applies to all states that contribute, or potentially contribute, to visibility impairment, including states
such as Kansas that do not have a Class I area. In the first implementation period Kansas sources were identified
by Oklahoma as potential contributors to visibility impairment at the Wichita Mountains Class I area. As a result,
KDHE obtained agreements with the owners of the largest coal-fired power plants in the state that modeled as
contributors to visibility impairment at Wichita Mountains. Combined with emissions decreases due to other
federal rules (e.g., the Mercury and Air Toxics Standards Rule), plant closures, and significant displacement of
coal-fueled electric generation due to wind farm development in the state, the resulting decrease in emissions of
NOx and SO2 has been very significant. For this second implementation period, no state has consulted with
KDHE concerning any Kansas facility having significant visibility impact at Class I areas within their
boundaries, nor (to the best of KDHE’s knowledge) has any state included any additional long-term strategy
reductions from Kansas facilities in their reasonable progress goals.
3. Regulatory Setting
Section 169A (U.S.C. 7491) of the Clean Air Act (CAA), established in the 1977 Amendments, calls for a
national goal of “the prevention of any future, and the remedying of any existing, impairment of visibility in
mandatory Class I Federal areas which impairment results from manmade air pollution.” 3 Mandatory Class I
federal areas (referenced hereinafter as Class I areas) consist of National Parks greater than 6,000 acres,
wilderness areas, wildlife refuges, and national memorial parks greater than 5,000 acres, and international parks,
all of which were in existence as of August 7, 1977. Visibility was found to be an important value at 156 of these
areas. A map of these 156 areas is shown in Figure 1.
3
https://www.govinfo.gov/content/pkg/USCODE-2018-title42/pdf/USCODE-2018-title42-chap85-subchapI-partC-subpartii.pdf
Regional Haze Page 8
Volume 2 – Plan RevisionFigure 1: Map of the 156 mandatory Class I federal areas Source: 64 FR 126: 35716 (July 1, 1999) The visibility protection provisions of the CAA are implemented by the U.S. Environmental Protection Agency’s (EPA’s) Regional Haze Rule (RHR), which was first promulgated in 1999. The RHR was amended in 2005 and 2017. The overarching goal of the RHR is to achieve natural visibility conditions at Class I areas by 2064. The RHR is codified under 40 CFR §51.308 (referred to hereinafter as §51.308). The full text of the 2017 revised RHR program requirements can be found at https://www.govinfo.gov/content/pkg/CFR-2019-title40-vol2/pdf/CFR- 2019-title40-vol2-sec51-308.pdf The RHR requires states to submit two types of planning documents: regional haze State Implementation Plans (RH SIPs), which cover a 10-year planning period; and progress reports, which are generally submitted at a point within the 10-year RH SIP planning period to cover the first five years of the respective implementation period. The RH SIP outlines how the state is achieving/plans to achieve the goal of natural conditions at Class I areas by 2064. The RH SIP constitutes a formal state SIP revision and therefore requires the requisite public involvement. The progress report documents the progress made towards that goal during the first part of the RH Regional Haze Page 9 Volume 2 – Plan Revision
SIP planning period, identifies any deficiencies in the RH SIP, and makes corrections to the RH SIP as warranted.
Although a state is required to make each progress report available for public review and comment, progress
reports do not constitute a formal SIP revision pursuant to the 2017 RHR revisions.

Historically, EPA published final approval of the State of Kansas Regional Haze Plan on December 27, 2011.
The plan was submitted in November 2009, with supplemental information provided in December 2011. 4 EPA
determined that the plan submitted by Kansas satisfies the requirements of the Clean Air Act for states to prevent
any future and remedy any existing anthropogenic impairment of visibility in mandatory Class I areas caused by
emissions of air pollutants located over a wide geographic area.
The State of Kansas submitted the five-year progress report to EPA on March 10, 2015. EPA published a final
rule in the Federal Register on September 14, 2015 5 approving Kansas’ determination that the existing Regional
Haze SIP is adequate to meet the visibility goals and requires no substantive revisions.

4.        Regional Haze SIP Requirements
Under the 2017 revised Regional Haze Rule (RHR), states are required to submit regional haze state
implementation plan (SIP) revisions (also referred to as plans or plan revisions) by July 31, 2021, July 31, 2028,
and every ten years thereafter. In these plans, states must address visibility at mandatory Class I federal areas
(Class I areas) within the state and Class I areas outside of the state that may be affected by emissions from
within the state. Specific requirements for these plans are given in paragraphs (f) through (i) of §51.308. Note
that certain sections of the RHR, beginning with §51.308(f)(1), Calculations of baseline, current, and natural
visibility conditions; progress to date; and the uniform rate of progress, are not applicable to the State of Kansas,
since it contains no Class I area within its borders.

4.1     §51.308(f)(2) Long-term strategy for regional haze
Section 51.308(f)(2) of the RHR begins: “Each state must submit a long-term strategy that addresses regional
haze visibility impairment for each mandatory Class I Federal area within the state and for each mandatory Class
I Federal area located outside the state that may be affected by emissions from the state.” For the second
implementation period of the RHR, Kansas’ long-term strategy is to continue the strategy set out in its regional
haze (RH) SIP for the first implementation period, including enforceable emissions limitations, compliance
schedules, and other measures that are necessary to make reasonable progress toward reducing visibility
impairment at nearby Class I areas. These measures, together with the rationale for continuing the state’s original
long-term strategy, will be seen as each section of the RHR applicable to Kansas is addressed in the remainder
of this plan revision.

4
    https://www.govinfo.gov/content/pkg/FR-2011-12-27/pdf/2011-32998.pdf
5
    https://www.govinfo.gov/content/pkg/FR-2015-09-14/pdf/2015-23074.pdf

Regional Haze                                                                                                 Page 10
Volume 2 – Plan Revision
Following are explanations of two terms brought up in the first sentence of subsection (f)(2) above as they relate to the state of Kansas: (1) Class I areas that may be affected by emissions from the state, or potentially impacted Class I areas; and (2) visibility impairment at potentially impacted Class I areas. As well, by way of providing information related to how the Kansas Department of Health and Environment (KDHE) determined that Kansas sources had no or insignificant visibility impact to any Class I areas for the second implementation period, the method of analysis used by Kansas—area of influence—will be introduced. 4.1.1 Potentially impacted Class I areas As stated above, Kansas has no mandatory Class I federal area within its borders, and for this second implementation period has not been identified and/or consulted by any other state for Kansas emission sources impacting Class I areas within that state’s borders. In the EPA approved Kansas RH SIP for the first implementation period, KDHE identified nine Class I areas potentially impacted by Kansas sources, based on recommendations by staff at EPA Regions 6 and 7. The areas chosen for the 2009 Kansas RH SIP were Badlands National Park (SD), Caney Creek Wilderness Area (AR), Great Sand Dunes Wilderness Area (CO), Hercules Glades Wilderness Area (MO), Mingo Wilderness Area (MO), Rocky Mountain National Park (CO), Upper Buffalo Wilderness Area (AR), Wichita Mountains Wilderness Area (OK), and Wind Cave National Park (SD). As it turned out, only Oklahoma identified emission sources in Kansas as having visibility impacts at its Class I area, Wichita Mountains, for the first implementation period. For this second implementation period, the Class I areas presented for Kansas (i.e., Kansas-related Class I areas) are based on results of the area of influence (AOI) analysis conducted in 2018 by Ramboll6 for state members of the Central States Air Resource Agencies (CenSARA) 7 multi-jurisdictional organization. AOI is not photochemical modeling; however, it is a back trajectory-based technique that identifies visibility impairment contributions from individual major point sources. Ramboll’s “raw” AOI product, showing individual facilities and their visibility impact values at the respective Class I areas, may be found in Appendix 1, Ramboll AOI results - facilityemis.ewrt.qd2016.alltraj, as well as at https://censara.org/ftpfiles/Ramboll/ under the same name. The results of the analysis made on the Ramboll results will be discussed in part 4.1.3 below. Without going into the details of the AOI analysis, the CenSARA AOI results show that for the 20% most impaired days 8 in base year 2016 analyzed in the study, no Kansas facility had an individual impact greater than 0.84% at any of the Class I areas studied. 0.84% is not a significant level of visibility impact. In order to present a set of Class I areas “that may be affected by emissions from” Kansas, those Class I areas where the total combined percent impact due to Kansas sources exceeded 1.00% were selected, and are shown in Table 1. The resulting six areas will be referred to as “Kansas-related” Class I areas. Note in Table 1 there are 6 https://ramboll.com/services-and-sectors/environment-and-health/air-quality-management 7 Ramboll’s final AOI report for CenSARA may be downloaded from http://www.censara.org/ftpfiles/Ramboll/Ramboll_REPORT- CenSARA-RH.final.docx. 8 The 20% most anthropogenically impaired days are those days with the highest anthropogenic visibility impairment, in deciviews (dv), defined as the overall deciview value for a day minus the natural portion of the deciview value for a day. Regional Haze Page 11 Volume 2 – Plan Revision
two ways the percent visibility impact for combined nitrates and sulfates for the 2016 20% most impaired days
is presented: (1) highest individual facility percent impact; and (2) total impact, or the sum of all individual
Kansas facility percent impacts at a given Class I area. Note also, abbreviations for federal land managers (FLMs)
in Table 1 are: FS = U.S. Forest Service and FWS = U.S. Fish and Wildlife Service.
Table 1. Mandatory Class I federal areas with total measured AOI visibility impact by all Title V Kansas
facilities greater than 1.00% (Kansas-related Class I areas)

                                                                                 Kansas Title V facilities
             Kansas-related Class I area                   IMPROV                Highest
                                                                         State                Number         Total
             (in bold if included in WRAP AOI analysis*)   E site code           single
                                                                                              counted        impact
                                                                                 impact
             Hercules Glades Wilderness Area (FS)          HEGL1         MO      0.61%        155            2.41%
             Salt Creek Wilderness Area (FWS)              SACR1         NM      0.42%        105            1.70%
             Upper Buffalo Wilderness Area (FS)            UPBU1         AR      0.27%        174            1.26%
             Wheeler Peak Wilderness Area (FS)             WHPE1         NM      0.84%        76             2.58%
             White Mountain Wilderness Area (FS)           WHIT1         NM      0.43%        116            1.63%
         Wichita Mountains National Wildlife
                                                          WIMO1            OK     0.19%       344            2.46%
         Reserve (FWS)
* WRAP is the Western Regional Air Partnership; see section 4.1.4 of this document.

4.1.2 Visibility impairment at potentially impacted Class I areas
Regional haze is monitored and monitoring data is stored by the Interagency Monitoring of Protected Visual
Environments network, IMPROVE. 9 At the IMPROVE website, when choosing “RHR Summary Data” on the
“RHR” link, multiple links appear for data tables covering all Class I areas, with multiyear information on
visibility, including haze indices (in dv) for haziest and clearest days, as well as haze budgets (in Mm-1) for
visibility impairment for 20% most impaired days. This last measure (20% most impaired days) has become the
most useful measure of impairment for the second implementation period as it provides what is considered the
closest measure of anthropogenic-only impairment for proper interpretation of RHR goals.

Tables 2, 3, and 4 below are summaries of visibility trends for the six Kansas-related Class I areas listed in Table
1. Table 2 shows the annual average haze index for haziest days (i.e., the 20% of monitored days in a calendar
year with the highest values of the deciview index); Table 3 shows the annual average haze index for clearest
days (i.e., the 20% of monitored days in a calendar year with the lowest values of the deciview index); and Table
4 shows the annual average haze index for 20% most impaired days, i.e., the 20% of monitored days in a calendar
year with the highest values of the deciview index attributed to anthropogenic sources only. The data source for
all years except 2064 in Table 2 and Table 3 is the table at the "Means for Best, Middle, and Worst 20% Visibility
Days" link at http://vista.cira.colostate.edu/Improve/rhr-summary-data/ (Group 90 for Table 2 and Group 10 for

9
    http://vista.cira.colostate.edu/Improve/

Regional Haze                                                                                                         Page 12
Volume 2 – Plan Revision
Table 3). The data source for Table 4 (except year 2064) is the table at the link “Means for Impairment Metric”
(Group 90) at the same RHR Summary Data webpage. Note the entries in tables under the name “Baseline”
(calculated as year 2004) are averages of the haze indices for the period 2000–2004 for each Class I area, as
discussed at 40 CFR §51.308(f)(1)(i) and definitions in 40 CFR §51.301. The entries in Tables 2 and 3 under the
year 2064 are taken from the table at the link “Natural Conditions II Updated April 2020” at the IMPROVE
website’s RHR Summary Data webpage. 10 Note again that in the “Natural Conditions” table, averages for haziest
days are the values listed in Group 90 and for clearest days in Group 10. The entries in Table 4 under the year
2064 are “default adjusted” values (adjusted for total international anthropogenic impact on the 20% most
impaired days, in deciviews), taken from Table E-1 of EPA’s September 19, 2019 Technical Support Document
for EPA’s Updated Regional Haze Modeling (TSD). 11 Unlike the unadjusted 2064 haze index values found in
Tables 2 and 3, the focus on anthropogenic-only sources of haze has led to modelers’ finding ways to “fine-tune”
monitor and modeling results to that end. See pages 31–32 of the TSD for more details.
Tables 2, 3, and 4 are shown with the complete IMPROVE and TSD data values (i.e., with all units to the right
of the decimal point) in Appendix 3, Haze Index and Emission Slope Analysis. Appendix 3 includes the 2000–
2004 haze index values used to compute the (2004) baseline.
Table 2. Annual average haze index, haziest days (dv) for Kansas-related Class I areas
Class I area Baseline 2005 2006 2007 2008 2009 2010 2011 2012 2013 2014 2015 2016 2017 2018 2064
HEGL1 26.8 29.5 25.9 26.2 25.0 23.6 23.6 24.2 21.3 21.8 21.5 19.8 19.3 19.5 20.6 11.3
SACR1 18.0 19.2 17.3 16.9 17.6 15.8 16.9 19.2 16.9 18.4 19.2 16.4 15.8 17.3 16.9 6.8
UPBU1 26.3 30.5 25.4 26.2 24.6 23.2 n/a 23.2 21.6 21.3 20.5 20.0 19.6 19.3 20.0 11.8
WHIT1 13.7 13.7 12.7 12.4 14.3 12.9 12.5 17.7 14.1 13.8 14.8 11.4 12.1 12.5 11.7 6.8
WHPE1 10.6 10.1 9.2 8.8 9.2 8.7 8.1 11.7 10.1 9.3 7.9 8.5 7.0 9.2 6.8 6.1
WIMO1 23.8 25.7 21.8 22.8 21.6 n/a 21.7 22.9 20.2 20.3 21.2 18.8 17.2 17.7 19.3 7.5
Table 3. Annual average haze index, clearest days (dv) for Kansas-related Class I areas
Class I area Baseline 2005 2006 2007 2008 2009 2010 2011 2012 2013 2014 2015 2016 2017 2018 2064
HEGL1 12.8 13.6 13.3 13.0 11.7 11.0 11.6 11.5 11.0 9.8 10.0 9.1 10.2 9.7 9.6 4.7
SACR1 7.9 7.9 8.0 7.1 6.8 6.4 6.1 8.5 8.0 7.8 7.3 6.6 6.8 6.0 6.5 2.1
UPBU1 11.7 13.5 13.0 12.4 10.5 9.4 n/a 11.5 10.3 8.5 8.1 7.5 9.6 8.4 7.4 4.2
WHIT1 3.5 3.0 3.4 3.9 3.0 3.2 3.3 3.4 3.7 3.2 2.8 2.6 2.4 2.5 2.4 0.7
WHPE1 1.2 0.6 1.3 1.2 0.3 0.4 0.5 1.2 0.5 0.1 0.3 0.4 0.4 0.1 0.3 -0.6
WIMO1 9.8 10.6 9.7 9.3 9.8 n/a 9.2 10.3 8.9 8.4 9.3 8.5 8.1 7.7 8.8 3.0
10
http://vista.cira.colostate.edu/Improve/rhr-summary-data/
11
https://www.epa.gov/sites/production/files/2019-10/documents/updated_2028_regional_haze_modeling-tsd-2019_0.pdf
Regional Haze Page 13
Volume 2 – Plan RevisionTable 4. Annual average haze index, 20% most impaired days (dv) for Kansas-related Class I areas
(with default adjusted 2064 values)
Class I area Baseline 2005 2006 2007 2008 2009 2010 2011 2012 2013 2014 2015 2016 2017 2018 2064
HEGL1 25.2 28.0 24.4 24.9 23.9 22.8 22.5 23.1 20.1 19.7 20.3 18.2 18.3 18.3 18.6 11.3
SACR1 16.5 18.0 16.0 16.5 16.1 14.7 15.2 15.3 15.3 15.8 16.5 15.0 13.8 14.5 15.0 9.7
UPBU1 24.2 29.3 23.5 24.0 22.8 21.3 n/a 21.2 20.1 19.3 18.7 17.8 18.3 17.9 17.0 11.8
WHIT1 11.3 12.8 10.6 11.4 10.8 10.4 9.7 11.3 10.6 11.0 10.9 10.2 9.4 9.7 9.6 8.5
WHPE1 7.3 8.1 8.0 7.1 7.1 6.1 5.7 7.2 7.5 7.0 6.5 6.6 5.3 5.7 5.6 n/a
WIMO1 22.1 24.4 20.8 22.4 21.1 n/a 20.9 21.2 19.4 19.5 20.4 18.1 16.4 17.5 18.2 10.2
Although a look at the trends of the deciview indices for the Class I areas in Tables 2, 3, and 4 shows that all the
trends in haze index display negative slopes, it takes some analysis (easily done in Microsoft Excel using the
FORECAST function) to show whether or not the current downward trending in measured haze at these areas
will reach the predicted point of “natural conditions” by 2064. Table 5 shows 2064 values for 20% most impaired
days—again, the measure of visibility impairment that centers on anthropogenic sources—using three measures:
(1) unadjusted, calculated estimates from EPA’s RH TSD Table E-1; (2) 2064 values adjusted by EPA by adding
average impairment due to international anthropogenic sources (shown in Table 4 and also found in the TSD
Table E-1 and discussed at pp. 54–55 in the TSD); and (3) extrapolated measured values of baseline–2018
estimates using the least squares-based FORECAST function in Excel on values in Table 4 (see Appendix 3).
Table 5. Comparison of 2064 haze indices (dv): current unadjusted endpoints, adjusted endpoints, and
2004 (baseline)–2018 projected to 2064, for Kansas-related Class I areas
2064 haze index (dv) - adjusted 2064 haze index (dv) -
2064 haze index
Class I area for international anthropogenic extrapolated from baseline
(dv) unadjusted
impairment to 2018
HEGL1 9.3 11.3 -12.5
SACR1 5.5 9.7 7.1
UPBU1 9.4 11.8 -14.4
WHIT1 4.9 8.5 3.3
WHPE1 n/a n/a -0.8
WIMO1 6.9 10.2 -1.5
Looking at the extrapolated estimates for 2064 haze indices in Table 5 shows that in every case—or in every
case except one using the unadjusted endpoint value for Salt Creek (SACR1)—the current baseline-to-2018
extrapolated values for 2064 are lower than their counterparts. (In terms of Table 5, the extrapolated 2064 values
in the right-hand column are less than the values in the same row in the other two columns, with the exception
Regional Haze Page 14
Volume 2 – Plan Revisionof unadjusted SACR1.) This means that, at least for this second implementation period based on monitored conditions so far, each of the Kansas-related Class I areas can be predicted to reach natural visibility conditions before 2064. Although Salt Creek’s extrapolated haze index for 2064 is somewhat higher than the corresponding unadjusted value (7.1 dv versus 5.5 dv), the discussion by EPA in its TSD indicates that the trend for future estimates for the 2064 endpoints will include additions of not only international anthropogenic factors, but some additions due to prescribed fire contributions as well. 12 For Salt Creek, the adjusted 2064 haze index of 9.7 dv is greater than the extrapolated value by a greater margin than the extrapolated value is above the unadjusted 2064 endpoint, most probably due to this area’s proximity to the U.S.-Mexican border. 4.1.3 CenSARA AOI analysis In 2018 CenSARA, on behalf of its member states Arkansas, Iowa, Kansas, Louisiana, Missouri, Nebraska, Oklahoma, and Texas, contracted with Ramboll to perform an area of influence (AOI) study for Class I areas throughout and nearby the CenSARA region. AOI studies are back trajectory- (and residence time-) based and are considered a “reasonable approach” by EPA for determining visibility impacts.13 The AOI study performed for CenSARA incorporates comprehensive Title V facility emissions inventories of NOX and SO2, visibility data from IMPROVE monitors at Class I areas, and meteorological data for back trajectories using the HYSPLIT model. 14 A complete description of the CenSARA AOI study can be found in the study’s final report at Appendix 4, Ramboll_REPORT-CenSARA-RH.final.docx. For determining relative visibility impact on Class I areas for individual emission sources (facilities), AOI is significantly superior to the simple “total emissions divided by distance” (Q/d) method still used by many states. 15 Unlike AOI, which provides a true surrogate value for visibility impact, accounting for the transport of emissions (including residence time) from specific locations to Class I area receptors via back trajectory analysis, Q/d selects “blindly,” yielding highest ratios for the largest sources at the relatively closest distances. As detailed in the CenSARA AOI final report, source contributions from each facility to visibility impairment at each Class I area were determined by matching the extinction weighted residence time (EWRT) to reach the Class I area receptor at altitudes of 100, 200, 500, and 1,000 m, times 2016 (and 2028) facility-level emissions over distance. The final report explains EWRT as follows: The purpose of this work is to identify the geographic areas and emission sources with a high probability of contributing to anthropogenically impaired visibility at CenSARA Class I areas. Ramboll carried out residence time analysis using back-trajectory modeling and extended the analysis using emission, visibility extinction, and distance weighting approach. …EPA’s previous analysis of contributions of individual PM components to total 12 TSD p 54 13 Final guidance page 8 14 https://ready.arl.noaa.gov/HYSPLIT.php 15 The western states’ Western Regional Air Partnership (WRAP) employed Ramboll to carry out an AOI analysis for western states late in the planning cycle for the second implementation period, so that most if not all those states used Q/d as the basis for selecting facilities for four-factor analysis. AOI-based individual facility visibility impacts were still not available at the end of August 2020. See section 4.1.4 for a reference URL. Regional Haze Page 15 Volume 2 – Plan Revision
extinction on the 20% most anthropogenically impaired days during 2010–2014 showed that sulfate (SO4) and
nitrate (NO3) are two major PM components that account for a large fraction of the anthropogenic visibility
impairment at these Class I areas. To define geographical areas with a high probability of influencing visibility
(i.e., the area of influence) at each of the IMPROVE sites that has impairment due to SO4 and NO3, extinction
weighted residence time (EWRT) plots were generated separately for SO4 and NO3

where       is the extinction coefficient attributed to the pollutant (SO4 or NO3) measured upon arrival of the kth
trajectory at the IMPROVE site. The gridded EWRT values are normalized to display the percentage of the
domain total EWRT.

Arkansas tool: The deliverables provided by Ramboll’s AOI study to CenSARA member states16 were assembled
into a usable format by the Arkansas Department of Environmental Quality (ADEQ). ADEQ staff compiled all
the CenSARA states’ data, including 2016 and 2028 emissions inventories and analytical results for the 23 Class
I areas studied, into a Microsoft Excel spreadsheet tool, aka the Arkansas tool. An edited copy of the revision to
their final version, named AR Screening Method - V3.2_2016_Inventory_6-12-2020.xlsx, is found in Appendix
2 (of the same name). See also Appendix 5, Arkansas DEQ writeup for the Arkansas spreadsheet tool, for a draft
description of the spreadsheet tool by ADEQ staff. Note that due to issues with using future year 2028 analysis
results (since Ramboll’s study employed 2028 inventory values with outdated base year and growth factor data),
CenSARA states (except Texas, which did its own analysis) all elected to utilize 2016 AOI results for their
visibility impact analyses.

Looking over the percent impact results presented in Table 1 (or in the Arkansas tool), it is apparent that no
single Kansas facility had any percent visibility impact greater than 0.84%. In early discussions with other
CenSARA states, those states were considering requiring facilities to perform four-factor analyses at threshold
levels of 3%, 4%, and 5%. While 5% is commonly regarded as level being statistically significant (i.e., 95% of
all visual impacts occur at levels above this value), the level of impact of 1.00% is low enough to say that, at
least for the RHR’s second implementation period and for the purposes of this SIP, Kansas has no air facility
contributing to visibility impairment at any Class I area at any significant level.

This idea is also reflective of EPA's decision to use a 1% threshold for "linking" states as discussed in its
rulemaking for 2015 ozone NAAQS interstate transport: ‘In the CSAPR and the CSAPR Update, the EPA used
a threshold of one percent of the NAAQS to determine whether a given upwind state was ‘linked’ at step 2 of
the four-step framework and would therefore contribute to downwind nonattainment and maintenance sites

16
  https://censara.org/ftpfiles/Ramboll/ is the location at the CenSARA website the Ramboll deliverables are archived. The Arkansas
tool was created using the file facilityemis.ewrt.qd2016.alltraj.xlsx.

Regional Haze                                                                                                              Page 16
Volume 2 – Plan Revision
identified in step 1. If a state's impact did not equal or exceed the one percent threshold, the upwind state was
not ‘linked’ to a downwind air quality problem, and the EPA therefore concluded the state will not significantly
contribute to nonattainment or interfere with maintenance of the NAAQS in the downwind states."17
Multistate comparison: In order to give a clearer picture of how Kansas visibility impacts compare with other
CenSARA and nearby states, the Arkansas tool was used to summarize the same state-level impact information
as conveyed in Table 1, but for all CenSARA states as well as those states sharing a border with CenSARA
states—18 states in all. Impacts for all 23 Class I areas covered in the CenSARA AOI study were included, so
that the total percent impact by any given state (over all Class I areas) may be greater than 100%.
Based on the multistate comparison summary tables found in Appendix 6, AOI % impacts - KS facilities &
CenSARA+neighbor states, the following charts, beginning with Figure 2 and Figure 3, show graphically how
low both total percent visibility impact and facility highest percent visibility impact are, respectively, for Kansas
Title V facilities. Figure 2 displays the state-level totals of combined facility percent impacts over all 23 Class I
areas in the CenSARA AOI study. Note in Figure 2, the numbers of sources included in the study for each of the
states listed are shown in parentheses after the state’s name.

Figure 2. Total percent visibility percent impact by CenSARA and bordering state facilities at mandatory
Class I federal areas included in the CenSARA AOI study

 450%

 400%

 350%

 300%

 250%

 200%

 150%

 100%

     50%

      0%

17
     https://www.govinfo.gov/content/pkg/FR-2020-01-23/pdf/2020-00888.pdf page 3876.

Regional Haze                                                                                                 Page 17
Volume 2 – Plan Revision
Figure 3 shows a state-by-state comparison of the sums of percent impacts of the highest impacting facilities over all the Class I areas showing impact. In this comparison, Kansas’ total of 3.68% (again, over all Class I areas showing impact) is again insignificant. Figure 3. Highest single facility percent visibility percent impact by CenSARA and bordering states at mandatory Class I federal areas included in the CenSARA AOI study 120% 100% 80% 60% 40% 20% 0% Figures 2 and 3 combine to show how extremely low Kansas ranks among its neighboring states in term of visibility impact at Class I areas. In order to give a sense of the scope of visibility impacts by facilities at a statewide level at given minimal percent impacts, Figures 4 and 5 display the numbers of Class I areas impacted (out of the 23 areas in the CenSARA AOI study), as indicated in the figures’ titles. Regional Haze Page 18 Volume 2 – Plan Revision
Figure 4. Number of mandatory Class I federal areas for CenSARA and bordering states with total
visibility impact greater than 3.00%

 10
  9
  8
  7
  6
  5
  4
  3
  2
  1
  0

Figure 5. Number of mandatory Class I federal areas for CenSARA and bordering states with a highest
single facility visibility impact greater than 1.00%

 10
  9
  8
  7
  6
  5
  4
  3
  2
  1
  0

Considered together, Figure 4 and Figure 5 demonstrate the lack of visibility impact by Kansas sources at any
of the Class I areas in the CenSARA AOI study, when compared with impacts generated by sources in

Regional Haze                                                                                         Page 19
Volume 2 – Plan Revision
surrounding states. Unlike any of the 17 other states all around Kansas, Kansas’ combined Title V facilities had
no total visibility impact greater than 3.00% and no single facility impact greater than 1.00%.

4.1.4 WRAP AOI Analysis
Finally, it should be noted that four of the six Kansas-related Class I areas in Table 1 (indicated in the table in
bold text) were included in the AOI analysis carried out in 2019 and 2020 by Ramboll for the Western Regional
Air Partnership (WRAP) states, whose members are all states to the west of Kansas and the Dakotas. The
WRAP’s AOI analysis tools and products can be found starting at https://views.cira.colostate.edu/tssv2/#.

The WRAP has many more member states than CenSARA, and its member states encompass 117 of the 154
Class I areas in the U.S. The WRAP AOI study has not followed the same analytical pathway as the CenSARA
AOI study. Nevertheless, there is one comparable analysis that can be used from the WRAP analysis—extinction
weighted residence time (EWRT)—to show the (very low) impact of the four associated Kansas sources on the
Class I areas of interest in this document, which are Salt Creek (SACR1), Wheeler Peak (WHPE1), White
Mountain (WHIT1), and Wichita Mountains (WIMO1).

Appendix 7, EWRT graphics from the WRAP AOI study, contains eight maps generated at the WRAP webpage
indicated in the appendix. The maps show the geographic distribution of EWRT percentages (relative impacts)
for all sources of nitrates and sulfates for 20% most impaired days at the four Class I areas of interest. Note the
CenSARA AOI analysis is likewise based on EWRT. None of these maps show any relative EWRT-related
impact due to Kansas sources at a level greater than 0.2%.

4.1.5 §51.308(f)(2)(i) Emission reduction measures for potentially affected anthropogenic source of visibility
impairment
In this part of the RHR the rule text reads that (all) states “should consider evaluating major and minor stationary
sources or groups of sources, mobile sources, and area sources. The State must include in its implementation
plan a description of the criteria it used to determine which sources or groups of sources it evaluated and how
the four factors [i.e., costs of compliance, the time necessary for compliance, the energy and non-air quality
environmental impacts of compliance, and remaining useful life] were taken into consideration in selecting the
measures for inclusion in its long-term strategy.” Noting the RHR uses the term “should” and not “must”
regarding the set of source categories to consider, KDHE concludes that, for the second implementation period,
Kansas has no potentially affected anthropogenic source of visibility impairment to consider under this part. This
conclusion is based on arguments made in sections 4.1.1 through 4.1.3 above and on the following points:

    •   For this second implementation period most if not all states are only considering stationary sources of
        NOx and/or SO2, particularly since there are still large stationary sources of these primary haze-causing
        pollutants that will need controls to be installed before lower-emitting, “harder to reach” source
        categories can be scrutinized. Evidence of this fact can be found in EPA’s regional haze TSD in its

Regional Haze                                                                                                Page 20
Volume 2 – Plan Revision
Appendix B, Regional Haze Site Summaries. (The Appendix B graphics for the six Kansas-related Class
I areas can be found in this document’s Appendix 8, EPA regional haze site summary graphics and table
for Kansas-related Class I areas.) In the pie charts provided for each Class I area (except a few missing
charts, including for Wheeler Peak, WHPE1), the modeled percentages of 2028 total anthropogenic light
extinction by top modeling sectors are displayed. For the five Kansas-related Class I areas that are
provided, and considered as a whole over all five areas, the largest sectors responsible for light extinction
are EGUs and non-EGU point. These are the typical large stationary sources of NOX and SO2.
• In its final regional haze guidance document 18 at page 9, EPA states: “[a]ccordingly, it is reasonable and
permissible for a state to distribute its own analytical work, and the compliance expenditures of source
owners, over time by addressing some sources in the second implementation period and other sources in
later periods. For the sources that are not selected for an analysis of control measures for purposes of the
second implementation period, it may be appropriate for a state to consider whether measures for such
sources are necessary to make reasonable progress in later implementation periods.”
• In the preamble to the 2017 revised RHR 19 on page 3090, EPA states: “The revisions require states to
consider certain factors and provide certain information as they develop their regional haze SIPs, but they
do not mandate specific outcomes. Where applicable, the revisions also provide states with significant
flexibility to take state-specific facts and circumstances into account when developing their long-term
strategies.” In this context, Kansas’ efforts toward reducing NOX and SO2 emissions for the RHR’s first
implementation period surpassed its neighboring states. The “flexibility” in the RHR allows Kansas, in
the absence of any significant visibility impact using a reasonable analysis for the present implementation
period, to set aside requiring four-factor analysis for facilities into the next implementation period.
• In the same preamble on p. 3093, EPA states: “One commenter contended that the proposed revisions
would lead to disagreements among states because states might set different RPGs instead of working
jointly toward the downwind state's goals. We disagree. Only downwind states set RPGs for their
mandatory Class I Federal areas, so there is no situation in which there would be different goals for the
same area.” As previously pointed out, no state downwind of Kansas has indicated that a Kansas facility
has shown significant visibility impact at any Class I area within its boundary for the second
implementation period. Kansas concurs with its neighboring Class I states (i.e., that their reasonable
progress goals for this implementation period do not include analysis of any Kansas facilities).
Addressing the RHR text’s use of the word “must” regarding the criteria states use “to determine which
sources or groups of sources it evaluated, and how the four factors were taken into consideration in
selecting the measures for inclusion in its long-term strategy,” are the following points:
18
https://www.epa.gov/sites/production/files/2019-08/documents/8-20-2019_-_regional_haze_guidance_final_guidance.pdf
19
https://www.ecfr.gov/cgi-
bin/retrieveECFR?gp=&SID=ef9cc121ace6199c27f2c20e84589e1d&mc=true&r=SECTION&n=se40.2.51_1308
Regional Haze Page 21
Volume 2 – Plan Revision• The selection of large stationary emission sources (and not other sectors or “groups of sources”) for four-
factor analysis, carried out via ranking of individual sources’ relative impact on visibility, is the driving
mechanism for determining which sources are selected for four-factor analysis. That is the purpose of
using Q/d and AOI. There are still large stationary emission units—apparently uncontrolled—“out there,”
as evidenced by EPA’s own modeling, as just discussed above. Therefore, KDHE determines that just as
in the first implementation period, the emission sources to evaluate for their contribution to visibility
impairment for the second implementation period are large stationary sources.
• The CenSARA AOI study found no Kansas Title V facility with significant visibility impact at any Class
I area in the study.
• With no facility selected for analysis, the question of “taking into consideration” four-factor analysis for
Kansas emission sources in the second implementation period is moot.
4.1.6 §51.308(f)(2)(ii) State consultation
The RHR states in §51.308(f)(2)(ii): “The State must consult with those States that have emissions that are
reasonably anticipated to contribute to visibility impairment in the mandatory Class I Federal area to develop
coordinated emission management strategies containing the emission reductions necessary to make reasonable
progress.” As previously explained, KDHE has received no communication from other states regarding the need
for consultation.
At page 39 of its RH guidance document, EPA states: “Consultation among states during the development of
their SIPs will give states an early understanding of how other states are contemplating making their own
decisions.” In this context, KDHE informed other CenSARA state, regional EPA staff, and FLMs several times
in monthly CenSARA regional haze conference calls throughout 2020 of its facilities’ insignificant visibility
impacts (and logically, not requiring four-factor analysis). CenSARA calls were recorded, and notes from those
conference calls can be found at this location. Federal attendees and Kansas comments from the 2020 conference
calls from January 2020 through July 2020 may be found in Appendix 14, CenSARA Regional Haze Committee
call notes for 2020.
4.1.7 §51.308(f)(2)(iii) Technical basis for emission reduction measures for reasonable progress
This part of the RHR begins: “The State must document the technical basis, including modeling, monitoring,
cost, engineering, and emissions information, on which the State is relying to determine the emission reduction
measures that are necessary to make reasonable progress in each mandatory Class I Federal area it affects.” As
already discussed, area of influence analysis, based on back trajectory modeling of all Kansas Title V sources,
did not show any significant visibility impacts on any Class I area during the 20% most impaired days in 2016,
the base year for the second implementation period (needfully substituting for 2028, the end year for the second
Regional Haze Page 22
Volume 2 – Plan RevisionYou can also read