The Changing Demographic Profile of the United States
←
→
Page content transcription
If your browser does not render page correctly, please read the page content below
The Changing Demographic Profile of the
United States

Laura B. Shrestha
Assistant Director/Senior Specialist in Domestic Social Policy

Elayne J. Heisler
Analyst in Health Services

March 31, 2011

                                                     Congressional Research Service
                                                                           7-5700
                                                                      www.crs.gov
                                                                           RL32701
CRS Report for Congress
Prepared for Members and Committees of Congress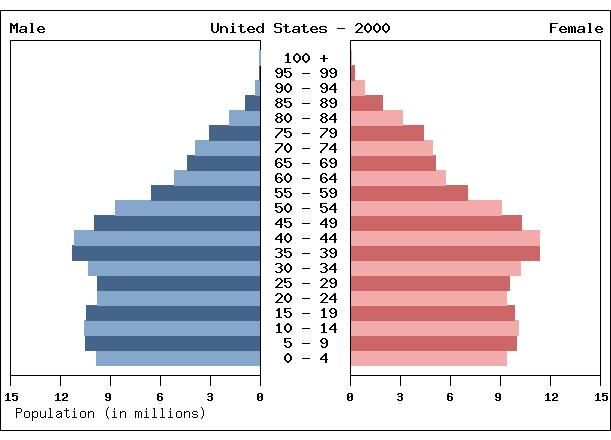
The Changing Demographic Profile of the United States

Summary
The United States, the third most populous country globally, accounts for about 4.5% of the
world’s population. The U.S. population—currently estimated at 308.7 million persons—has
more than doubled since its 1950 level of 152.3 million. More than just being double in size, the
population has become qualitatively different from what it was in 1950. As noted by the
Population Reference Bureau, “The U.S. is getting bigger, older, and more diverse.” The
objective of this report is to highlight some of the demographic changes that have already
occurred since 1950 and to illustrate how these and future trends will reshape the nation in the
decades to come (through 2050).

The United States Is Getting Bigger. U.S. population growth is due to the trends over time in the
interplay of increased births, decreased deaths, and increased net immigration.

The United States Is Getting Older. Aside from the total size, one of the most important
demographic characteristics of a population for public policy is its age and sex structure. This
report illustrates how the United States has been in the midst of a profound demographic change:
the rapid aging of its population, as reflected by an increasing proportion of persons aged 65 and
older, and an increasing median age in the population.

The United States Is Becoming More Racially and Ethnically Diverse, reflecting the major
influence that immigration has had on both the size and the age structure of the U.S. population.
This section considers the changing profile of the five major racial groups in the United States. In
addition, trends in the changing ethnic composition of the Hispanic or Latino Origin population
are discussed.

Although this report will not specifically discuss policy options to address the changing
demographic profile, it is important to recognize that the inexorable demographic momentum will
have important implications for the economic and social forces that will shape future societal
well-being. There is ample reason to believe that the United States will be able to cope with the
current and projected demographic changes if policymakers accelerate efforts to address and
adapt to the changing population profile as it relates to a number of essential domains, such as
work, retirement, and pensions; private wealth and income security; the federal budget and inter-
generational equity; health, healthcare, and health spending; and the health and well-being of the
aging population. These topics, among others, are discussed briefly in the final section of this
report. This report will be updated as needed.

Congressional Research Service
The Changing Demographic Profile of the United States

Contents
     Population Size and Growth—The United States Is Getting Bigger........................................1
        Fertility...........................................................................................................................4
        Mortality.........................................................................................................................7
        Net Immigration............................................................................................................ 10
     The Changing Age Profile—The United States Is Getting Older .......................................... 13
     Race and Ethnicity—The United States Is Becoming More Diverse ..................................... 18
        Race ............................................................................................................................. 18
        Hispanic Origin............................................................................................................. 21
     Some Policy Considerations................................................................................................ 23
        Work, Retirement, and Pensions .................................................................................... 23
        Private Wealth and Income Security .............................................................................. 24
        The Federal Budget and Inter-generational Equity ......................................................... 25
        Health, Healthcare, and Health Spending....................................................................... 26
        The Health and Healthcare Needs of an Aging Population ............................................. 27
        Immigration Policy ....................................................................................................... 28
        America’s Changing Color Lines................................................................................... 28

Figures
Figure 1. U.S. Population, by Sex, 1950-2050, in Millions ..........................................................2
Figure 2. Population Growth, Birth, Death, and Net Immigration Rates: United States,
  1950-2050................................................................................................................................3
Figure 3. Crude and Age-adjusted Death Rates: United States, 1950-2007 ...................................8
Figure 4. Age-Sex Structure of the United States in Years 1950, 2000, and 2050........................ 15
Figure 5. Hispanics and Non-Hispanics as Percentage of U.S. Population: 2000-2050 ............... 23

Tables
Table 1. Trend in Birth Rates Between 2007 and 2008, by Age of Mother....................................6
Table 2. U.S. Immigration and Estimated Emigration, by Decade: 1931-2009............................ 12
Table 3. U.S. Population, by Age Group: 1950-2050.................................................................. 14
Table 4. U.S. Population, by Race: 2009.................................................................................... 20
Table 5. Projected U.S. Population, by Race: 2000-2050 ........................................................... 21
Table 6. The Hispanic and Non-Hispanic Population in the United States, by Race: 2000 .......... 22

Appendixes
Appendix. U.S. Population Growth Rates, Birth Rates, Death Rates, and Net Immigration
 Rates: 1950-2050 ................................................................................................................... 31

Congressional Research Service
The Changing Demographic Profile of the United States Contacts Author Contact Information ...................................................................................................... 32 Congressional Research Service
The Changing Demographic Profile of the United States

T       he United States, the third-largest population globally, accounts for about 4.5% of the
        world’s population. The U.S. population—estimated in the 2010 Census at 308.7 million
        persons1—has more than doubled from its 1950 level of 152.3 million.2 More than just
being double in size, the U.S. population has become qualitatively different from what it was in
1950. As noted by the Population Reference Bureau, “The U.S. is getting bigger, older, and more
diverse.”3 The objective of this report is to highlight some of the demographic changes that have
already occurred since 1950 and to illustrate how these and future trends will reshape the nation
in the decades to come. 4

While this report will not discuss policy options, it is important to recognize that the inexorable
demographic momentum will produce an increasingly older population in the United States.
There is ample reason to believe that the United States will be able to cope with the current and
projected changes if policymakers address and adapt to the changing demographic profile as it
relates to a number of essential domains such as work, retirement, and pensions, private wealth
and income security, transfer systems, and the health and well-being of the aging population. 5
These topics are discussed briefly in the final section of this report.

Population Size and Growth—The United States Is Getting Bigger
The U.S. population has experienced remarkable growth since 1950. From a base of about 152
million Americans in 1950, an additional 156 million persons were added to the population
between 1950 and 2009, with the number of additional women slightly outnumbering additional
men (see Figure 1). This increase (of about 103%) in the size of the U.S. population was
remarkable compared with other industrialized countries. Germany and Italy, for instance, grew
by only 21% and 30% respectively during the same period.6 And, a number of countries, most
notably in Eastern Europe, have recently experienced absolute reductions in the size of their
populations.7

1
  U.S. Census Bureau, 2010 Resident Population at http://www.census.gov/.
2
  U.S. Census Bureau, International Data Base (IDB), at http://www.census.gov/ipc/www/idb/country.php, September
22, 2009.
3
  P. Scommegna, U.S. growing bigger, older, and more diverse. Population Reference Bureau, April 2004, at
http://www.prb.org/.
4
  Through year 2050 is considered in this report.
5
  National Research Council, 2001, Preparing for an Aging World: The Case for Cross-National Research, Panel on a
Research Agenda and New Data for an Aging World, Committee on Population and Committee on National Statistics,
Division of Behavioral and Social Sciences and Education, Washington, DC: National Academy Press (hereinafter
cited as National Research Council, Preparing for an Aging World).
6
  CRS calculations based on data in United Nations, World Population Prospects: the 2008 Revision, Highlights,
United Nations: New York, 2009, available at http://www.un.org/esa/population/publications/wpp2008/
wpp2008_highlights.pdf. These data have not been updated since 2008; therefore, it is not possible to make
comparisons through 2010.
7
  Population Reference Bureau, 2010, World Population Highlights: Key Findings from PRB’s 2010 World Population
Data Sheet available at http://www.prb.org/pdf10/10wpds_eng.pdf.

Congressional Research Service                                                                                  1
The Changing Demographic Profile of the United States
Figure 1. U.S. Population, by Sex, 1950-2050, in Millions
500
450
400
350
300
250 Females Female
200 Male
150
100
Males
50
0
1950 1960 1970 1980 1990 2000 2010 2020 2030 2040 2050
Year
Sources: CRS calculations based on (1) for 1950-2000 estimates, F. Hobbs & N. Stoops, Demographic Trends in
the 20th Century, Census Bureau: CENSR-4, issued November 2002, and (2) for 2010-2050, U.S. Census Bureau
Table 2. Projections of the Population by Selected Age Groups and Sex for the United States: 2010 to 2050
(NP2008-T2),issued August 2008 at http://www.census.gov/population/www/projections/files/nation/summary/
np2008-t2.xls.
Despite the growth of the U.S. population over this period, the United States’ share of the world’s
population has been declining as less developed, higher fertility countries have grown more
rapidly. Pakistan, Bangladesh and Nigeria, for instance, now rank #6, #7 and #8 in total
population size, surpassing more developed countries—such as Germany, France, the United
Kingdom, and Italy—that are no longer among the world’s 10 most populous countries.8
The Census Bureau projects that the U.S. population will continue to grow, to almost 440 million
persons by year 2050,9 albeit at a slower pace than the growth recorded over the past half-century.
Note, however, that population projections, which rely upon assumptions about the future courses
of mortality, fertility, and immigration are uncertain. More pessimistic growth projections are
offered by the United Nations and the Social Security Administration, which estimate that the
U.S. population will be 404 million or 411 million respectively in the same year.10
8
U.S. Census Bureau International Data Base at http://www.census.gov/ipc/www/idb/ranks.php.
9
U.S. Census Bureau, Table 2. Projections of the Population by Selected Age Groups and Sex for the United States:
2010 to 2050 (NP2008-T2), issued August 2008, at http://www.census.gov/population/www/projections/files/nation/
summary/np2008-t2.xls.
10
It is beyond the scope of this report to reconcile these differences. All projections are medium-variant, or what the
agencies consider to be the most likely scenario. See (1) United Nations, World Population Prospects: The 2008
Revision; and (2) The 2010 Annual Report of the Board of Trustees of the Federal Old-Age and Survivor’s Insurance
and Disability Insurance Funds. Washington DC: August 9, 2010, http://www.ssa.gov/OACT/TR/2010/trTOC.html.
Congressional Research Service 2The Changing Demographic Profile of the United States
Figure 2. Population Growth, Birth, Death, and Net Immigration Rates:
United States, 1950-2050
30.0
Estimates Projections
Rates per 1,000 Mid-Year Population
25.0
Birth Rates
20.0
15.0
Growth Rates
10.0
Death Rates
5.0
Net Immigration Rates
0.0
1950 1960 1970 1980 1990 2000 2010 2020 2030 2040 2050
Source: Congressional Research Service (CRS) compilation based on historical and projected figures from the
U.S. Census Bureau and the National Center for Health Statistics (NCHS). See the Appendix for more
information on sources and data used to derive this figure.
Notes: (1) Crude birth rate (CBR): the number of live births per 1,000 total population. Estimates for 1950-58
were adjusted by NCHS to correct for under-registration of births. (2) Crude death rate (CDR): the number of
deaths per 1,000 total population. (3) Net immigration rate: number of immigrants less number of emigrants per
1,000 total population.
Average annual growth rates11 for each 10-year intercensal period between 1950 and 2000 were
positive, but have generally been declining over time (see Figure 2). Expressed as a percentage of
the population at the beginning of the period, the average population growth rate in the 1950s, for
example, was 1.7% per annum while it was only 0.9% per year during the 1980s. The Census
Bureau assumes that the growth rate will remain positive through year 2050, but will fluctuate
over the time period. The current level of 0.8% per annum will increase through 2030 to closer to
0.9% per annum. After 2030 the growth rate is expected to return to 0.8% per annum.
Trends in the size and growth of the U.S. population reflect the interactions of three underlying
determinants:
• The role of human reproduction and the fertility behavior of American couples;
• Trends in disease risk and subsequent mortality, and,
• The net effect of international immigration to and from the United States.
11
Population growth rate: the number of persons added to (or subtracted from) a population in a year due to natural
increase (births minus deaths) and net immigration per 1,000 persons in the population. Alternatively, the measure can
be expressed as the percentage change of the population at the beginning of the time period subtracted from the
population at the end of the time period and then divided by the population at the end of the time period.
Congressional Research Service 3The Changing Demographic Profile of the United States
Figure 2 and the Appendix (at end of this report), in addition to highlighting the estimated and
projected trends in population growth for the period 1950-2050, also highlight trends and
projections for these three underlying components of population change. Characteristics of U.S.
fertility, mortality, and immigration are discussed in the following sections.
Fertility12
Average fertility in the United States reached a post-World War II maximum during the peak of
the “baby boom” in the late 1950s. The highest observed number of annual births (4.3 million)
and birth rates (25.3 births per 1,000 population) since 1950 were recorded in 1957. Steep
declines were observed in the 1960s and early 1970s, a broad trend that was also observed in
Europe, Canada, Japan, Australia, and New Zealand. U.S. birth rates since the early 1970s have
remained remarkably constant,13 mostly fluctuating in the mid-teens, and reached an all-time low
of 13.9 live births per 1,000 population in 2002. In 2008, the most recent year for which final data
are available, there were 14.0 live births per 1,000 in the population and almost 4.25 million
births were recorded. This represents a small decline from 2007 when the largest number of births
were recorded in nearly 4 decades, though the birth rate remains lower than levels seen during the
baby boom. 14
Characteristics of American Fertility
Highlights of American fertility behavior in 2008 include the following:15
• There were approximately 4.25 million live births, a 2% decrease from the 2007
record high.
• The crude birth rate (CBR) was 14.0 live births per 1,000 total population, which
represents a slight decrease since 2007, but is an increase from 2002, the year in
which the lowest U.S. CBR was recorded.
• The general fertility rate (GFR), which relates births to the number of women in
their childbearing ages, was 68.6 live births per 1,000 women aged 15-44 years, a
1% decline from 2007.
• Fertility rates, as measured by the GFR, declined for women below the ages of
40, but increased to the highest levels recorded in more than 40 years for women
ages 40 to 44.
12
The Crude Birth Rate (CBR) is the primary measure of fertility used in this section because of its value in indicating
directly the contribution of fertility to the population growth rate. However, because the age and sex composition of a
population has a strong influence on the level of the CBR, additional measures to understand the underlying fertility
trends are also used.
13
Gregory Spencer, Preface, The Direction of Fertility in the United States. Conference proceedings for a conference
hosted by the Council of Professional Associations on Federal Statistics, Alexandria, VA, October 2-3, 2001.
14
National Vital Statistics Reports (NVSR), Births: Final Data for 2008, DHHS/CDC/ NCHS, vol. 59, no. 1, December
2010 (hereinafter cited as NVSR, Births: Final Data for 2008).
15
NVSR, Births: Final Data for 2008. For information about changes from 2002, see discussion in National Vital
Statistics Reports (NVSR), Births: Final Data for 2006, DHHS/CDC/ NCHS, vol. 57, no. 7, January 7, 2009
(hereinafter cited as NVSR, Births: Final Data for 2006).
Congressional Research Service 4The Changing Demographic Profile of the United States
• Fertility is slightly below “replacement level” in 2008 at 2.08. This rate is in
contrast with the fertility rates recorded in 2006 and 2007, which were above
replacement level for the first time since 1971.16 Although the U.S. fertility rate
in 2008 was below replacement level, it remains higher than the rates observed in
other developed countries. Specifically, the 10 countries with the lowest recorded
fertility rates (Macao SAR, Hong Kong, Bosnia Herzegovina, Republic of Korea,
Malta, Japan, Poland, Singapore, Slovakia, and Belarus) have reached
historically unprecedented fertility rates with rates below 1.3 children per
woman.17
• Teenage childbearing declined by 2% in 2008,18 this is in contrast to increased
rates found in 2006 and 2007. These increases followed a 14-year decline.19
• Childbearing by unmarried women reached record levels in 2008. More than
1.7 million babies or 40.6% of all births were to unmarried women. Beginning in
1980, nonmarital births have become an important factor driving increasing
fertility rates. However, since 1980, the age distribution of nonmarital births has
changed—shifting away from teenager mothers. Recent increases in non-marital
births have been driven by increased rates of non-marital births among women
over the age of 30. There also continues to be wide variation in nonmarital birth
rates by race and Hispanic origin, with the highest rates for black and Hispanic
women.
• The mean age of all first-time mothers in the United States was 25.1 years, which
is slightly higher than the rates observed in 2006 and 2007. This increase is
driven by a decline in births to women under the age of 25. The mean age of first
time mothers, reflects a continuing tendency for women to postpone childbearing
and increased birth rates for women over the age of 35. Mean age at first birth
varies considerably by race and Hispanic origin. Women of Asian and Pacific
Islander descent had the highest age at first birth (28.7 years), whereas American
Indian women had the lowest (21.9 years).
• U.S. fertility rates declined in 2008 for women below the age of 40, a change
from prior years where rates had been increasing steadily (Table 1).
16
The replacement level of fertility measures the level of fertility and mortality in a population at which women will
replace themselves in a generation. It corresponds to a total fertility rate, or completed family size, of about 2.10 births
per woman.
17
United Nations, World Population Prospects: The 2008 Revision.
18
Data from 2009 indicate that the teen birth rate fell to the lowest levels ever recorded. See Stephanie J. Ventura and
Brady E. Hamilton, U.S. Teen Birth Rate Resumes Decline, U.S. Department of Health and Human Services, Centers
for Disease Control and Prevention, National Center for Health Statistics, NCHS Data Brief No. 58, Hyattsville, MD,
February 2011.
19
NVSR, Births: Final Data for 2006 and NVSR, Births: Final Data for 2008.
Congressional Research Service 5The Changing Demographic Profile of the United States
Table 1.Trend in Birth Rates Between 2007 and 2008, by Age of Mother
Rate per 1,000
Age of
Women in Age Trend Between 2007 and 2008
Mother
Category in 2008
10-14 years 0.6 Unchanged, but had declined in prior years
Declined by 2%, a change from the increase observed between 2005 and 2007.
The rise from 2005 to 2007 interrupted a 45% decline in the teenage birth
15-17 years 21.7 rate from 1991 to 2005.
Dropped 4%. The rate had declined by 26% since 1991, but then rose 6% from
18-19 years 70.6 2005 to 2007.
Declined by 3%. The birth rate for this group had generally been declining
20-24 years 103.0 since 1990.
25-29 years 115.1 Declined by 2%. Rates for this age group have fluctuated since 1991.
30-34 years 99.3 Declined by 1%.
35-39 years 46.9 Declined by 1%. This the first decline for this age group in 3 decades.
Increased. Highest rate recorded since 1967; the birth rate for this age group
40-44 years 9.8 increased by 32% since 1999.
45-49 years 0.7 Increased by 4%.
Source: NVSR, Births: Final Data for 2008, vol. 59, no. 1, December 2010.
Beyond the current year estimates presented above, the Census Bureau uses demographic
projection techniques to predict future trends in American fertility. They project that the total
fertility rate will remain at or above replacement level (2.1 births per woman age 15-44) through
2050. This is in contrast to much of Europe and to Canada, where fertility rates are below
replacement level and not expected to increase.20 Experts suggest that these falling fertility rates
are a result of societal changes, such as the increasing costs of raising a child, rising levels of
women’s labor force participation, and delayed childbearing. 21 While the U.S. has experienced
these same societal changes, U.S. fertility remains higher because of societal adaptations such as
increased access to child care and increased male involvement in household labor and
childrearing. Additionally, differences in U.S. fertility rates may be in part driven by differential
fertility rates by racial and ethnic groups. For example, the average fertility rates for women of
Hispanic origin was approximately 2.9 in 2008, while the fertility rate for non-Hispanic whites
was 2.0 or slightly below replacement level.22 Despite these projections, future trends in fertility
are notoriously difficult to predict and specialists continually question the underlying assumptions
of the models.
20
S. P. Morgan and M.G. Taylor, 2006, Low Fertility at the Turn of the Twenty-First Century. Annual Review of
Sociology vol. 32, 2006, pp. 375-399.
21
Ibid. See also: R.R. Rindfuss, “The Young Adult Years: Diversity, Structural Change, and Fertility,” Demography,
vol. 28, pp. 493-512, 1991. S.M. Bianchi, “Maternal Employment and Time with Children: Dramatic Change or
Surprising Continuity?” Demography, vol. 37, pp. 401-14, 2000.
22
NVSR, Births: Final Data for 2008. This is the average for all women of Hispanic origin. Fertility rates differ among
Hispanic groups, with women of Cuban origin on average having lower fertility rates than those of Mexican origin. In
addition, fertility rates vary by generation in the U.S. with immigrant women having higher fertility rates than native
born women.
Congressional Research Service 6The Changing Demographic Profile of the United States
Mortality
As is evident from Figure 2 and Figure 3, crude death rates (CDR) in the United States have
been remarkably constant since 1950, fluctuating within the range of 8.1 to 9.7 deaths per 1,000
persons.23 The record low of 8.0 was attained in 2007, the most recent year for which final data
are available.24
In general, crude death rates are referred to as crude because they are influenced by two
underlying characteristics of a population, making it difficult to interpret trends in the CDR
without disentangling trends in these two underlying components:
• The population’s age structure. An older population generally has higher crude
death rates because a higher proportion of persons are in the older age groups
where death rates are higher.
• Mortality risk, or the likelihood of death at a particular age. The risk of mortality
reflects the health and disease profile of the underlying population, public health
and sanitation, the availability of and access to health care, the education of the
population, and other factors.
Age-adjusted death rates are better indicators (than crude rates) to measure mortality risk across
time or across populations.25 If age-adjusted rates are considered for the United States over time, 26
a striking pattern of the mortality risk emerges (see Figure 3): age-adjusted death rates have
exhibited a dramatic decline since 1950 (rather than being remarkably constant, as suggested by
the crude death rates). Use of the age-adjusted rates has allowed a much more refined evaluation
of trends in American mortality over time. Specifically, they show that, despite the fact that the
U.S. population has been aging over the past half-century, the risk of mortality has actually been
falling.
23
The crude death rate (CDR) is the primary measure of mortality used in this section to show the contribution of
mortality to the population growth rate.
24
See National Vital Statistics Reports (NVSR), Deaths: Final Data for 2007, DHHS/CDC/NCHS, vol. 58, no. 19, May
20, 2010, hereinafter cited as NVSR, Deaths: Final Data for 2007). Note that preliminary data on deaths in 2008
suggests that the CDR has increased to 8.1. See NVSR, Deaths: Preliminary Data for 2008, DHHS/CDC/NCHS, vol.
59, no. 2, December 9, 2010.
25
Note that age-adjusted rates have little meaning in themselves; they are constructs that show what the level of
mortality would be if no changes occurred in the age composition of the population from year to year.
26
The age-adjusted rates are based on the year 2000 standard population. By definition, crude and age-adjusted death
rates converge in this year.
Congressional Research Service 7The Changing Demographic Profile of the United States
Figure 3. Crude and Age-adjusted Death Rates: United States, 1950-2007
16.0
14.0
12.0
Age-Adjusted Rates
10.0
8.0
Crude Rates
6.0
4.0
2.0
0.0
19 0
19 2
19 4
19 6
19 8
19 0
62
19 4
19 6
19 8
19 0
19 2
19 4
19 6
19 8
80
19 2
19 4
19 6
19 8
19 0
19 2
19 4
19 6
20 8
20 0
20 2
20 4
06
5
5
5
5
5
6
6
6
6
7
7
7
7
7
8
8
8
8
9
9
9
9
9
0
0
0
19
19
19
Source: CRS computations using data from the vital statistics system, NCHS.
Notes: CDRs are on an annual basis per 1,000 population; age-adjusted rates per 1,000 U.S. standard population
(year 2000).
Characteristics of American Mortality
Highlights of trends in American mortality in 2007 include the following:27
• More than 2.4 million resident deaths were registered in the United States in
2007.
• The crude death rate was about 7.6 deaths per 1,000 total population, a record
low.
• Life expectancy at birth28 was 77.9 years, this continues a long-term trend of
increasing life expectancy. Record high life expectancy was attained by the total
population, as well as by both the black and white populations. Both males and
females in both of the two major race groups attained record high levels. U.S. life
expectancy continues to fall short of that attained by a number of other countries,
27
NVSR, Deaths: Final Data for 2007.
28
Life expectancy at birth represents the average number of years that a group of infants would live if they were to
experience the current observed age-specific death rates throughout their lives. See CRS Report RL32792, Life
Expectancy in the United States, by Laura B. Shrestha.
Congressional Research Service 8The Changing Demographic Profile of the United States
including Japan (82.7 years), Hong Kong (82.2), Iceland and Switzerland
(81.8).29
• The 10 leading causes of death were (1) heart disease, (2) malignant neoplasms
(cancer), (3) cerebrovascular diseases (stroke), (4) chronic lower respiratory
diseases, (5) accidents (unintentional injuries), (6) Alzheimer’s disease, (7)
diabetes mellitus (8) influenza and pneumonia, (9) nephritis (kidney disease), and
(10) septicemia. Age-adjusted death rates continued to decrease for the three
leading causes. The top 10 causes of death did not change between 2006 and
2007; however, the Alzheimer’s disease and diabetes mellitus changed ranks.
• The infant mortality rate was 6.75 infant deaths per 1,000 live births, a slight
increase from the 2006 rate. U.S. infant mortality rates are higher than many
other developed countries. In 2005, the last year for which comparable
international data was available, the U.S. ranked 30th compared to a number of
developed countries, behind developed countries such as Japan, England, and
Canada.30
• Differences in mortality between men and women increased slightly from 2006
to 2007. In 2007, the age-adjusted death rate for men was 40.8% greater than it
was for women. Life expectancy at birth for females was 80.4 years, while it was
75.4 years for men (both increased from the previous year). The sex gap in life
expectancy is 5.0 years, a very slight decrease from 2006. This gap has narrowed
since its late 1970s peak of 7.8 years.
• Differences in mortality between the black and white populations persist. The
age-adjusted death rate for the black population was 1.3 times greater than for the
white population. This means that the risk of dying is 30% higher for the black
population than for the white population This ratio has remained constant since
1997. In 2006, the infant mortality rate was 2.3 times greater, and maternal
mortality rate was 2.7 times greater for the black population than for the white
population. Average life expectancy is also 4.8 years higher for the white
population than for the black population.
• There are also differences between the white and Hispanic populations with the
Hispanic populations experiencing lower age-specific death rates than the white
population. However, this may be due to underreporting of Hispanic origin on
death certificates. The Asian Pacific Islander population and the American Indian
and Alaska Native population both have age-adjusted death rates that are lower
than the white population, 40% and 20% lower rates respectively. However, the
low death rates of the American Indian and Alaska Native population is likely
attributed to the underreporting of deaths.
As with the data for fertility, demographers use demographic projection techniques to predict the
future trends in American mortality. The Census Bureau projects that (crude) death rates will
29
CRS compilation from data in United Nations, World Population Prospects: the 2008 Revision. Note that in 2008
version of the U.N. lists the U.S. life expectancy for 2005 to 2010 as 79.2. See also, Eileen M. Crimmins, Samuel H.
Preston, and Barney Cohen (Eds), International Differences in Mortality and Older Ages: Dimensions and Sources
(Washington, DC: National Academy Press, 2011).
30
CRS Report R41378, The U.S. Infant Mortality Rate: International Comparisons, Underlying Factors, and Federal
Programs, by Elayne J. Heisler.
Congressional Research Service 9The Changing Demographic Profile of the United States remain low through 2050 in the narrow range of 8.6 to 9.7 deaths per 1,000 persons in the population. The rate will gradually increase, reflecting the Census Bureau’s assumption that the aging of the population will not be fully offset by continued reductions in the risk of dying. As with other demographic variables; however, future mortality and survival are difficult to predict and specialists disagree on not only the level but also the direction of future trends. Research suggests that current models may be too pessimistic in their assumptions about mortality and survival probabilities, i.e., Americans may live longer than currently projected.31 While some assert that life expectancy is approaching its natural limit, there has been a steady increase in life expectancy observed with an increase of three months per year for every year between 1840 and 2000.32 Projections of future life expectancy vary. For example, one optimistic assumption predicts that international life expectancy will increase to 91.6 years for women by 2050.33 Others argue that this projection is too optimistic because it does not take into account that declines in mortality in early life (which increase life expectancy the most) are slowing. Additionally, smoking and obesity-related mortality is slowing life expectancy gains.34 However, there have been gains in life expectancy at the oldest ages and evidence that social and medical interventions are still effective at extending life thereby demonstrating that life expectancy may still be increasing and mortality rates may still be declining.35 Net Immigration Immigration has been an important component of population growth in the United States. The net immigration rate (Figure 2) has been and is projected to be positive (with in-migration exceeding out-migration) for the full century (1950 to 2050). It fluctuated in the low range of 1.5 to 2.4 net migrants per 1,000 resident population between 1950 and 1979. An increasing trend has been noted since 1980, and the annual rates in the 1990s were generally in the range of 3.0 to 3.9. The U.S. Census Bureau projects that net migration will continue to be an important component of population growth in the United States through 2050 with net immigration continuing at higher rates than currently observed. Both gross immigration and gross emigration are important to consider when examining how immigration effects population growth and change. In general, the balance of gross immigration (of persons moving permanently to the United States) has exceeded gross emigration (of persons leaving) over the past century. A notable exception was observed during the Great Depression, when the number of out-migrants exceeded new immigrants (see Table 2). Reflecting fluctuations in economic conditions (in the United States and abroad) and U.S. immigration policies, the volume of immigrants36 flow to the United States has fluctuated over time. Starting in 1915, 31 R. Lee, Report for the Roundtable Discussion of the Mortality Assumption for the Social Security Trustees, note dated September 11, 2002. 32 National Institute on Aging and U.S. Department of State, Why Population Aging Matters: A Global Perspective. March 5, 2007 at http://www.nia.nih.gov/ResearchInformation/ExtramuralPrograms/BehavioralAndSocialResearch/ GlobalAging.htm. This rate is for female life expectancy which is higher than male life expectancy; however, male life expectancy demonstrates similar patterns as female life expectancy. 33 J. Oeppen and J. Vaupel, Broken limits to life expectancy, Science, vol. 296, May 10, 2002, pp. 1029-1030. 34 Bongaart, J. How Long Will We Live? Population and Development Review, Vol. 32, Dec. 2006, p.p. 605-628. F. Pampel, Cigarette Use and the Narrowing Sex Differential in Mortality. Population and Development Review, vol. 28, no.1, March 2002, pp. 77-104 and Eileen M. Crimmins, Samuel H. Preston, and Barney Cohen (Eds), International Differences in Mortality and Older Ages: Dimensions and Sources (Washington, DC: National Academy Press, 2011). 35 Ibid. 36 These figures refer to legal immigrants, or citizens of other countries who have been granted visas that allow them to (continued...) Congressional Research Service 10
The Changing Demographic Profile of the United States

immigration to the United States was curtailed because of World War I, the introduction of
numerical limits (or “quotas”), the economic depression of the 1930s, and World War II.37
Starting in the 1950s, the volume of immigration flows to the United States has been steadily
increasing. The average annual inflow was about 252,000 in the 1950s, about 332,000 in the
1960s, 449,000 in the 1970s, and jumped to 734,000 in the 1980s. More than 9 million foreigners
were admitted as legal immigrants to the United States between 1991 and 2000, an average of
almost 910,000 a year. The number of legal immigrants in the last decade has fluctuated,
surpassing 1 million in 2001 and 2002, falling below 1 million annually for 2003 and 2004 and
rising above 1.1 million for 2005 through 2009.38

There are few timely and reliable estimates of emigration of persons who leave the United States
to permanently take up residence elsewhere (whether native-born or foreign-born Americans).
Partly because of inherent methodological difficulties, the collection of emigration statistics was
discontinued in 1957 and no direct measure has been available since then.39,40 Using indirect
demographic techniques, the Census Bureau estimated that the number of emigrants leaving the
United States has been increasing over the past decades—reaching about 234,000 persons
annually during the 1990s (compared to 910,000 annual immigrants during the same time period)
(see Table 2) and increasing steadily through the first decade of the 21st Century. The Population
Reference Bureau estimates almost 330,000 emigrants in 2009.41

(...continued)
live and work permanently in the United States. It includes (1) relatives of U.S. residents; (2) foreigners who were
admitted for economic or employment reasons; (3) refugees and asylees; and (4) persons in the “diversity” category,
which was created to introduce more variety into the stream of immigrants. It does not include nonimmigrants (visitors,
short-term workers, or students) or illegal immigrants.
37
   The period 1915-1965 has been referred to as one of “immigrant pause.” See P. Martin and E. Midgley, Immigration:
Shaping and Reshaping America, Population Bulletin, vol. 58, no. 2, June 2003.
38
   U.S. Dept. of Homeland Security, Yearbook of Immigration Statistics, 2009, data tables available at
http://www.dhs.gov/files/statistics/publications/yearbook.shtm.
39
   U.S. Immigration and Naturalization Service, Statistical Yearbook of the Immigration and Naturalization Service,
2000, Government Printing Office, Washington, DC, 2002.
40
   For example, the Congressional Budget Office attempted to estimate emigration using Social Security
Administration data These estimates are not comparable with estimates from the Census Bureau because they were not
tracking U.S. citizens who emigrated but only foreign nationals who emigrated. See Schwabish, JA. Identifying Rates
of Emigration in the United States Using Administrative Earnings Records. March 2009 (at http://www.cbo.gov/
ftpdocs/100xx/doc10029/2009-01.pdf).
41
   Phillip Martin and Elizabeth Midgley, Population Bulletin Update: Immigration in American 2010, Population
Reference Bureau, Washington, DC, June 2010, http://www.prb.org/pdf10/immigration-update2010.pdf.

Congressional Research Service                                                                                      11
The Changing Demographic Profile of the United States

         Table 2. U.S. Immigration and Estimated Emigration, by Decade: 1931-2009
                                                                             Estimated Net
                   Immigrants to               Emigrants from                 immigration            Estimated Ratio:
                 the United States            the United States                (thousands,              emigration/
  Period       (thousands, rounded )        (thousands, rounded)                rounded)               immigration

2001-2009                          9,458                        2,802                       6,656                   0.30
1991-2000                          9,081                        2,338                       6,743                   0.26
1981-1990                          7,255                        1,600                       5,655                   0.22
1971-1980                          4,399                        1,176                       3,223                   0.27
1961-1970                          3,322                          900                       2,422                   0.27
1951-1960                          2,515                          425                       2,090                   0.17
1941-1950                          1,035                          281                        754                    0.27
1931-1940                            528                          649                        -121                   1.23

     Sources: For immigration, all years: U.S. Department of Homeland Security, Yearbook of Immigration Statistics,
     2009 data tables available online at http://www.dhs.gov/files/statistics/publications/yearbook.shtm. For emigration,
     years 1931-1990: U.S. Immigration and Naturalization Service, Statistical Yearbook of the Immigration and
     Naturalization Service, 2000, GPO, Washington, DC, 2002. For 1991-2000: U.S. Census Bureau, Net International
     Migration and its Sub-Components for the Vintage 2000 Post-censal National Estimates: 1990 to 2000, Internet release
     date February 8, 2002. For 2001-2005, Population Reference Bureau, Estimates and Projections of Emigration
     from the United States, available at http://www.prb.org/Journalists/FAQ/USEmigration.aspx. For 2005-2009,
     Phillip Martin and Elizabeth Midgley, Population Bulletin Update: Immigration in American 2010, Population Reference
     Bureau, Washington, DC, June 2010, http://www.prb.org/pdf10/immigration-update2010.pdf.

Characteristics of Net Immigration
Highlights of American immigration in FY2009 include the following:42

     •     Current U.S. policy on permanent immigration is based on four principles: the
           reunification of families, the admission of immigrants with special skills, the
           protection of refugees, and the diversity of admissions by country of origin.43
     •     The number of persons granted lawful permanent residence in the United States
           was relatively stable between 2008 and 2009 increasing from 1.11 million to 1.13
           million.
     •     The leading regions of origin of legal immigrants were North America and Asia.
           These regions accounted for 36% and 33%, respectively, of all legal immigrants
           in 2009.
     •     The leading source countries (of birth) for legal immigrants in 2009 were Mexico
           (164,067 persons or 14.6%), followed by China (6.0%), the Philippines (5.3%),
           India (5.1%), Dominican Republic (4.4%), Cuba (3.4%), and Vietnam (2.6%).
     •     The primary destination states in 2009, as in every year since 1971, were
           California, New York, Texas, Florida, Illinois, and New Jersey.44 Sixty-two

42
   U.S. Dept. of Homeland Security, Yearbook of Immigration Statistics, 2009, data tables available online at
http://www.dhs.gov/files/statistics/publications/yearbook.shtm.
43
   CRS Report RL32235, U.S. Immigration Policy on Permanent Admissions, by Ruth Ellen Wasem.

Congressional Research Service                                                                                        12
The Changing Demographic Profile of the United States
percent of all (legal) persons immigrating to the United States in 2009 lived in
these six states.
• In 2009, ten metropolitan areas were the intended residence of 57% of all legal
immigrants. The leading destinations were New York-Northern New Jersey-Long
Island, NY-NJ-PA; Los Angeles-Long Beach-Santa Ana, CA; Miami-Fort
Lauderdale-Pompano Beach, FL; Washington-Arlington-Alexandria, DC-VA-
MD-WV; Chicago-Naperville-Joliet, IL-IN-WI; and the San Francisco-Oakland-
Fremont, CA metro area.
• Unauthorized foreigners, also referred to as illegal aliens, deportable aliens, or
undocumented workers, are persons in the United States in violation of U.S.
immigration laws. Researchers at the Pew Hispanic Center estimated that there
are more than 11.1 million unauthorized foreigners currently living in the United
States which is approximately 4% of the population. The resident unauthorized
foreigner population decreased between March of 2007 and March of 2009, the
first reversal in growth in two decades. 45 These researchers also found that this
decline is driven by fewer unauthorized immigrants coming from Latin
Americans countries other than Mexico, whereas the number of illegal aliens
peaked in 2007 (at 7 million) and has since leveled off.46
The Changing Age Profile—The United States Is Getting Older
Aside from its total size, one of the most important demographic characteristics of a population
for public policy is its age and sex structure. In general, a “young” population structure is seen in
countries experiencing high fertility and rapid population growth, and the relevant policy
considerations are whether there are sufficient schools and, later, enough jobs and housing to
accommodate them. On the other hand, critical policy challenges in countries with “old”
population structures are to develop retirement and health systems to serve the older population,
often with simultaneous reductions in the number of working-age persons to support them.
The population of the United States had been relatively “young” in the first half of the 20th
century, a consequence of a history of three demographic trends acting in concert—relatively high
fertility, declining infant and childhood mortality, and high rates of net immigration to the United
States by young workers and families. Since 1950, the United States has been in the midst of a
profound demographic change: rapid population aging,47 a phenomenon that is replacing the
earlier “young” age-sex structure with that of an older population. As seen in Table 3, the
population aged 65 and older has been increasing as a percentage of the total U.S. population.
The older population represented 8.1% of the total population in year 1950. That percentage
increased to 12.8% in 2009 (not in table), and is projected to reach 20.2% in 2050. Stated another
way, one in five persons in 2050 will be aged 65 or older.
(...continued)
44
There has been some fluctuation in the order within those six states.
45
Jeffrey S. Passel and D’Vera Cohn U.S. Unauthorized Immigration Flows are Down Sharply Since Mid-Decade, Pew
Hispanic Center, September 1, 2010, at http://www.pewhispanic.org.
46
Ibid.
47
Aging (of a population) is a process in which the proportions of adults and elderly increase, while the proportions of
younger persons decrease, resulting in a rise in the median age of the population.
Congressional Research Service 13The Changing Demographic Profile of the United States
Table 3. U.S. Population, by Age Group: 1950-2050
Age/year 1950 1975 2000 2025 2050
Number (in thousands, rounded)
Total 152,272 215,972 282,171 357,452 439,010
0-19 51,673 75,646 80,576 94,254 112,940
20-64 88,202 117,630 166,522 199,290 237,523
65-65+ 12,397 22,696 35,074 63,907 88,547
Percent in Age Group (rounded)
0-19 33.9 35.0 28.6 26.4 25.7
20-64 57.9 54.5 59.0 55.8 54.1
65-65+ 8.1 10.5 12.4 17.9 20.2
Source: CRS computations based on data in the U.S. January 21, 2011 based on the Census Bureau’s December
2010 data release. These data do not include results from the 2010 census.
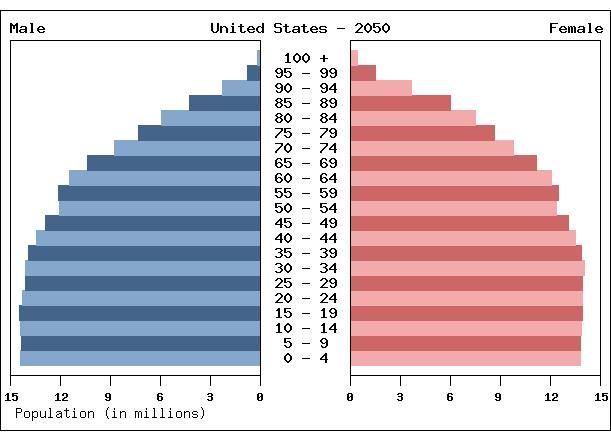
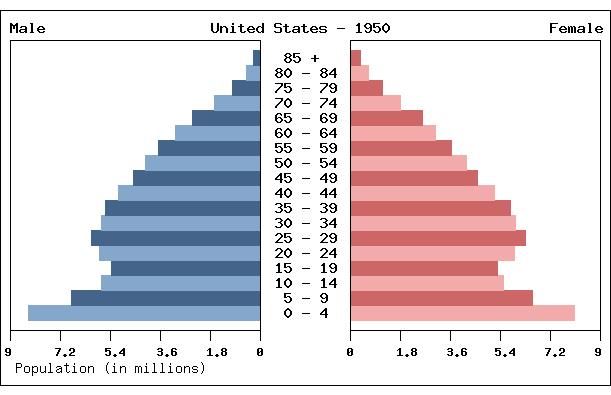
Figure 4 graphically displays three population pyramids48 of the United States population at three
points in time—in census years 1950 and, 2000, and projected to year 2050. The figure shows the
proportion of persons in each five-year age and sex group in these three selected years. Note the
increasing numbers on the x-axis, which highlights the increasing size of the U.S. population over
time.
48
A population pyramid is a bar chart, arranged vertically, that shows the distribution of a population by age and sex.
By convention, the younger ages are at the bottom, with males on the left and females on the right.
Congressional Research Service 14The Changing Demographic Profile of the United States
Figure 4. Age-Sex Structure of the United States in Years 1950, 2000, and 2050
Congressional Research Service 15The Changing Demographic Profile of the United States
Source: CRS extractions from U.S. Census Bureau, International Data Base (IDB), http://www.census.gov/ipc/
www/idb/country.php.
Notes: U.S. data are based on official estimates and projections. Population estimates for 1950-1999 are based
on the resident population plus the armed forces overseas. Population estimates for 2000-2008 are for the
resident population and are based on Census 2000. The estimates are produced using vital statistics through
2007 and survey data on international migration (supplemented with administrative data) through 2007.
Population data in the IDB for 2009-2050 are projections of the resident population. The projections originate
with a base population from Census 2000 and are produced using a cohort-component method—the most
common method used for age structure projections because they take into account potential differences in the
rates of mortality, fertility and migration at different ages . Projections are based on historical trends in vital
statistics data through 2003 and administrative data on legal immigration through 2002. Census 2010 has been
completed and preliminary data were released in December 2010; however, population projections have not yet
been updated with these data. (See http://www.census.gov/ipc/www/idb/country.php).
In 1950, the U.S. population, which numbered 152 million persons, was relatively young and its
population pyramid generally resembled a Christmas tree. The widest portion, representing the
most populous age group, was at the base—where 16.4 million new births and children under age
5 accounted for 10.8% of the total population. Bars representing persons at older ages gradually
narrow as deaths occur. The median age was 30.2 years49 and births outnumbered deaths by a
margin of 2.5 to 1.0.50 Three characteristics of the 1950 pyramid are especially worth noting:
• The only significant departure from a pyramidal shape is notches representing
persons aged 10-24 years. Unusual bulges or bites in population pyramids are
49
Extraction from U.S. Census Bureau, International Data Base.
50
D.G. Fowles, Pyramid Power—Analysis of Demographic Revolution, Aging, winter, 1991.
Congressional Research Service 16The Changing Demographic Profile of the United States
usually caused by short-term fluctuations in birth and death rates that can be
traced to such historical events as wars, epidemics, economic booms, or
depressions. In this case of persons aged 10-24 years in this population pyramid,
these persons were born primarily during the economic depression of the 1930’s
when birth rates were comparatively low.
• Early “baby boom” births are evident in the youngest age group.51
• The number of persons aged 65 and older in the population was still relatively
low—12.4 million persons, representing 8.1% of the U.S. population.
The population pyramid in year 2000, the most recent year in which the U.S. population was
enumerated by the decennial census, 52 is typical of a population experiencing slow growth.
Reflecting lower fertility, fewer people entered the lowest bars of the pyramid, and as life
expectancy has increased, a greater percentage of persons have survived until old age. As a result,
the population has been aging. By 2000, the median age of the population had risen to 35.3 years
while infants and children under the age of five numbered 19.2 million, accounting for only 6.8%
of the population. Important characteristics of the U.S. population in year 2000 included:
• The U.S. population grew by roughly 85% between 1950 and 2000—from 152
million to 282 million persons. The pyramid, which is significantly larger in all
age groups, reflects this fact (see x-axis scaling in Figure 4).
• The bulge of the baby-boom generation, those born between 1946-1964, can be
seen in the pyramid for ages 35-54 years in 2000. After 1964, birth rates moved
downward until the late 1970s. As the last members of the baby boom
approached their childbearing years during the 1980s, the number of births rose
again, peaking in 1990. These children, the youngest generation, are represented
by the slightly widening base of the pyramid. Even though the number of births
per woman had been near an all time low, the population continued to grow in
part because of the children and grandchildren of the huge baby-boom
generation. 53
• The number of persons aged 65 and older had been steadily increasing and
reached 35.1 million persons, representing 12.4% of the U.S. population.
• The fact that female survival chances exceed those of men, especially at the older
ages, becomes noticeably more evident in the 2000 pyramid. About 4.3% of the
total female population was aged 80 and above in 2000 compared to only 2.2%
of men.
By year 2050, projections of the U.S. population suggest that the population “pyramid” will no
longer resemble a Christmas tree; rather, it will be increasingly rectangular.
51
In the post-war years, Americans were marrying and starting families at younger ages and in greater percentages than
they had during the Great Depression. The surge in births in the 19-year period between 1946 and 1964 resulted from a
decline in childlessness combined with larger family sizes (more women had three or more children). See C.L. Himes,
Elderly Americans, Population Bulletin, Washington, DC: Population Reference Bureau, December 2001 (hereinafter
cited as C. Himes, Elderly Americans).
52
Census 2010 has been completed and preliminary data were released in December 2010; however, population
projections have not yet been updated with these data. (See http://www.census.gov/ipc/www/idb/country.php).
53
Population Reference Bureau, Human Population: Fundamentals of Growth: Three Patterns of Population Change, at
http://www.prb.org.
Congressional Research Service 17The Changing Demographic Profile of the United States
• In this population of 439.0 million persons, the most striking feature is the
projected number of people who will be aged 65 and older—88.5 million, just
over one in every five persons in the total U.S. population. To put these figures
into perspective, the “oldest” state in 2009 was Florida with 17.2% of the state’s
population in the age category 65 years and older.54
• By year 2050, the percent elderly in the national population will surpass the
figures observed in the “oldest” states today. The oldest-old, those aged 80 and
above and including the youngest of the baby boomers, will be the most populous
age group—32.5 million persons or 7.4% of the entire U.S. population. The
oldest-old women of the same age will account for 8.5% of all women.
• The “baby boom” generation will have accelerated population aging, but aging
will continue to be one of the most important defining characteristics of the
population, even after the youngest of the “baby boom” population has passed
away. This reflects projections of continuing low fertility coupled with improving
survival in the United States.55
Race and Ethnicity—The United States Is Becoming More Diverse
The U.S. population is becoming more racially and ethnically diverse. This reflects two forces.
First, immigration has been a major influence on both the size and the age structure of the U.S.
population. Although most immigrants tend to be in their young adult ages, when people are most
likely and willing to assume the risks of moving to a new country, U.S. immigration policy has
also favored the entry of parents and other family members of these young immigrants.56 Second,
major racial and ethnic groups are aging at different rates, depending upon fertility, mortality, and
immigration within these groups.
Federal standards for collecting and presenting data on race and Hispanic origin were established
by the Office of Management and Budget (OMB) in 1997.57 Race and Hispanic origin are
considered to be two separate and distinct concepts and are considered separately in this report.
Race
The OMB standards require federal agencies to use a minimum of five race categories in their
data collection and presentation efforts. The new standards were required to be used by the
Census Bureau for the 2000 decennial census and by other federal programs “as soon as possible,
but not later than January 1, 2003.”58
54
The “youngest” state was Alaska with 7.6% of the population over the age of 65. See U.S. Census Bureau,
Geographic Comparison Table, Percent of the Total Population Who are 65 Years and Over (geographic ranked by
estimate), 2009 Population Estimates, http://factfinder.census.gov.
55
See CRS Report RL32981, Age Dependency Ratios and Social Security Solvency, by Laura B. Shrestha.
56
C.L. Himes, Elderly Americans. See also CRS Report RL32235, U.S. Immigration Policy on Permanent Admissions,
by Ruth Ellen Wasem.
57
OMB, “Revisions to the Standards for the Classification of Federal Data on Race and Ethnicity,” Federal Register
Notice, October 30, 1997, at http://www.whitehouse.gov/omb/fedreg/1997standards.html. These revised guidelines
replace and supersede Statistical Policy Directive, no. 15.
58
OMB, ibid.
Congressional Research Service 18You can also read