MUSLIMS SCOTTISH IN NUMBERS - The University of Edinburgh
←
→
Page content transcription
If your browser does not render page correctly, please read the page content below
SCOTTISH
MUSLIMS
IN NUMBERS
Understanding Scotland’s Muslim population
through the 2011 Census
Scottish Muslims in Numbers
Understanding Scotland’s Muslim population
through the 2011 Census

By Dr. Khadijah Elshayyal

© The Alwaleed Centre for the Study of Islam in the Contemporary World,
University of Edinburgh, 16 George Square, Edinburgh EH8 9LD.

With special thanks to:
Alistair Hunter and Tom Lea, The Alwaleed Centre, The Muslim Council of
Scotland (MCS), Stuart Macdonald and Laine Ruus, the Edinburgh Data
Library, and staff at the National Records Scotland (NRS).

Art Director:                        thealwaleedcentre@ed.ac.uk
Salman Farsi
                                     www.alwaleed.ed.ac.uk
Graphic Design:                      @alwaleed_centre
Sadek Ahmed                          /alwaleededinburgh
                                     An online version of this report is available at:
                                     www.alwaleed.ed.ac.uk/scottishmuslims
2
                                                                                         SCOTTISH MUSLIMS IN NUMBERS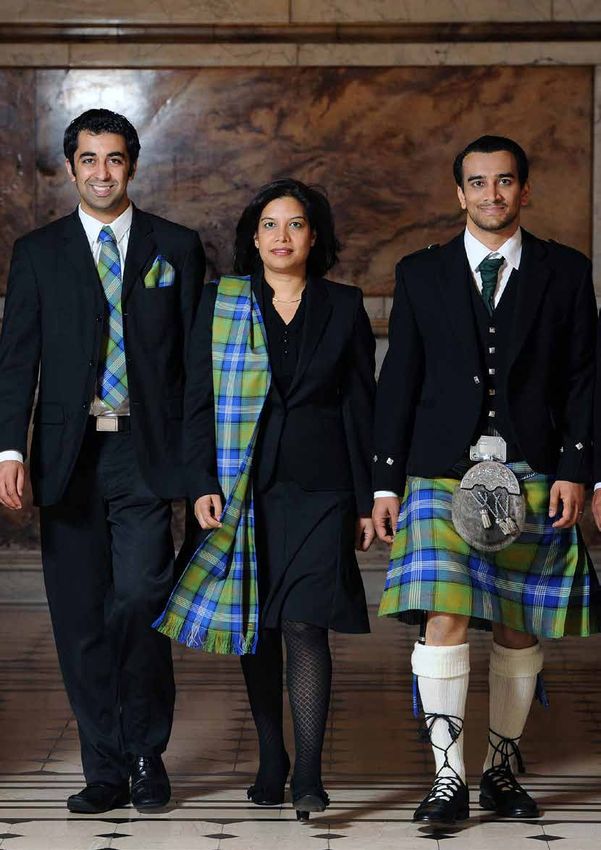
3
SCOTTISH MUSLIMS IN NUMBERS
CONTENTS
               1   INTRODUCTION                                 06

               2   EXECUTIVE SUMMARY                            08

               3   DEMOGRAPHIC DETAIL                           14
                   3.1   Population and Place Of Birth			      14
                   3.2   Ethnic Diversity					15
                   3.3   Geographical Distribution			16
                   3.4   Age Profile					18
                   3.5   Parliamentary Constituency Population 20
                         (Westminster and Scottish)

               4   ISSUES RELATING TO CIVIC LIFE                                   24
                   4.1   National Identity						24
                   4.2   English Language Skills						25
                   4.3   Household Type						26
                   4.4   Focus on Youth							30
                   4.5   Prison and Other Institutionalised Populations			 34

               5   INEQUALITIES
                                36
                   5.1   Deprivation					36
                   5.2   Housing Tenure					38
                   5.3   Health and Disability				39

               6   LABOUR MARKET ISSUES		43
                   6.1   Economic Activity/Inactivity			43
                   6.2   Types of Economic Activity			   44
                   6.3   Education and Qualifications			 45
                   6.4   Focus on Women				50
                   6.5   Socio-economic Classification			52

               7   CONCLUSIONS                                  54

               8   REFERENCES                                   56

4
                                                     SCOTTISH MUSLIMS IN NUMBERS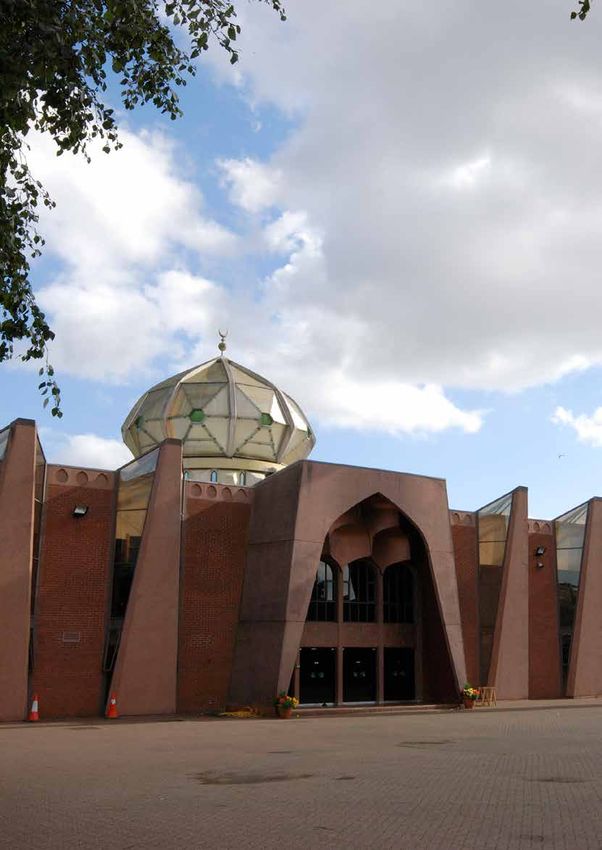
List of Tables & Figures
Tables                                                         Table 38: Council Areas with Highest Muslim Student
                                                               Populations
Table 1: Religion in the 2011 Census
                                                               Table 39: Student population by ethnicity and sex
Table 2: Scottish Muslims as a proportion of British Muslims
                                                               Table 40: Women Looking After Home and Family
Table 3: Country of Birth of Muslim Population
                                                               Table 41: Economically Active Women, aged 16 and over
Table 4: Ethnicity of Muslim Population
                                                               Table 42: Economic inactivity among Muslim men and
Table 5: Muslim Proportions of Ethnic Groups
                                                               women, aged 16 and over
Table 6: Muslim Population by Region
                                                               Table 43: Muslims and National Statistics Socio-
Table 7: Muslim Population Change in cities with               Economic Classification (NS-SeC)
Largest Muslim Population                                      Table 44: Local Council Areas with the largest numbers
                                                               of Muslim ‘high’ and ‘low’ achievers
Table 8: Change in Muslim Population Age Profile 2001-
2011
                                                               Figures
Table 9: Muslims in 55-74 year old age band
                                                               Figures 1: Population Pyramids for Muslim Population
Table 10: UK Constituencies with over 1% Muslim                and Overall Population
population
                                                               Figure 2: Proportion of each ethnic group living in the
Table 11: Scottish Constituencies with over 1% Muslim          most deprived 10 per cent data zones/LSOA,
population                                                     Scotland/England
Table 12: Muslim population in all Scottish Council Areas      Figure 3: Muslims and highest level of educational
                                                               qualification - 2001
Table 13: Muslims and National Identity
                                                               Figure 4: Muslims and highest level of educational
Tables 14 & 15: Muslims and English Language Skills
                                                               qualification - 2011
Table 16: English Language Skills by Religion and Sex
Tables 17 & 18: Muslims and Household Composition (HRPs)
Table 19: Muslims (individuals) and Household Composition
Table 20: Age Profile of Muslim Population
Table 21: Muslims in 0-4 and 5-9 year old Age Bands
Table 22: Young Muslim Population in Glasgow, Dundee
and East Renfrewshire, wards with >5% Muslim population
Table 23: Muslims and Communal Establishments
Table 24: Prison Population by Religion
Table 25: Prison Population by Ethnicity
Table 26: Muslims and Deprivation by Local Authority
Table 27: Muslims and Housing Tenure
Table 28: Ethnicity and Housing Tenure
Table 29: Muslims and Ill Health
Table 30: Health in the over 65 Population by Sex
Table 31: Muslims and Disability
Table 32: Disability in the over 60 Population by Sex
Table 33: Council areas with large Muslim Populations
and over 65s with Disabilities
Table 34: Muslims and Economic Activity
Table 35: Types of Full Time Employment
Table 36: Muslims and Highest Level of Qualification
Table 37: Muslim Students by Age and Sex

                                                                                                                     5
         SCOTTISH MUSLIMS IN NUMBERS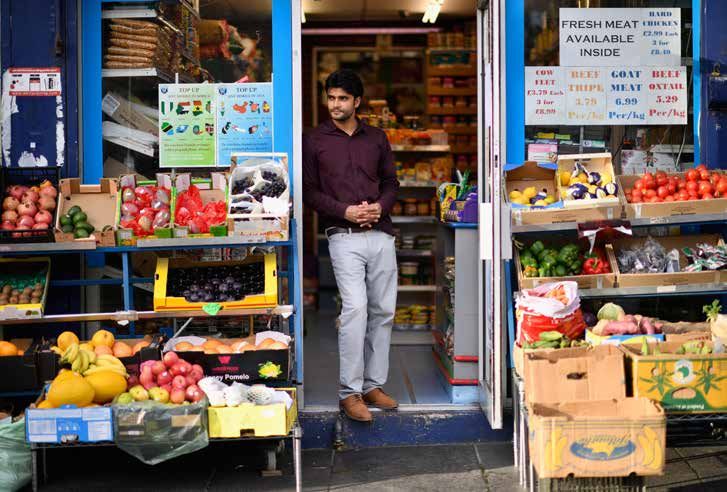
1. Introduction
S
cotland has been home to established Muslim communities since the
early 20th Century. Although records of Muslim presence in Scotland
date back as early as 1504,1 the first substantial Muslim communities
were formed of settlers who arrived from South Asia (Pakistan and India) in
the aftermath of the Second World War. As with post-war immigration to
other parts of Britain and Europe, these settlers were concentrated around
urban areas, in particular the cities of Glasgow, Edinburgh and Dundee.
But in contrast to many of the South Asians who arrived in the northern
towns of England from the villages and towns of rural Mirpur, these Scottish
immigrants tended to hail from comparatively more affluent Pakistani cities
such as Lahore.2
To date, we have no authoritative compilation of scholars of British Islam. With the overwhelming
statistical data pertaining to Scotland’s Muslims, nor majority of British Muslims residing in England (95.5%),
has there been developed any substantial statistically studies of ‘Muslims in Britain’ have very often been
informed demographic picture of Scotland’s essentially studies of Muslims in England. And while,
Muslim population. In part, this has been due to the as this report shows, Scottish Muslims do have much
unavailability of such data until relatively recently. in common with Muslims in other nations of the
The UK national census first introduced a question on UK, there are other areas where distinct differences
religion only in 2001, thus providing us with the first emerge from the data, highlighting what are
accurate population figure for Muslims (and indeed, interesting particularities about the Scottish Muslim
other minority religions) in British history. Another experience.
reason has been a lack of interest, both by Muslim
organisations and individuals, as well as among
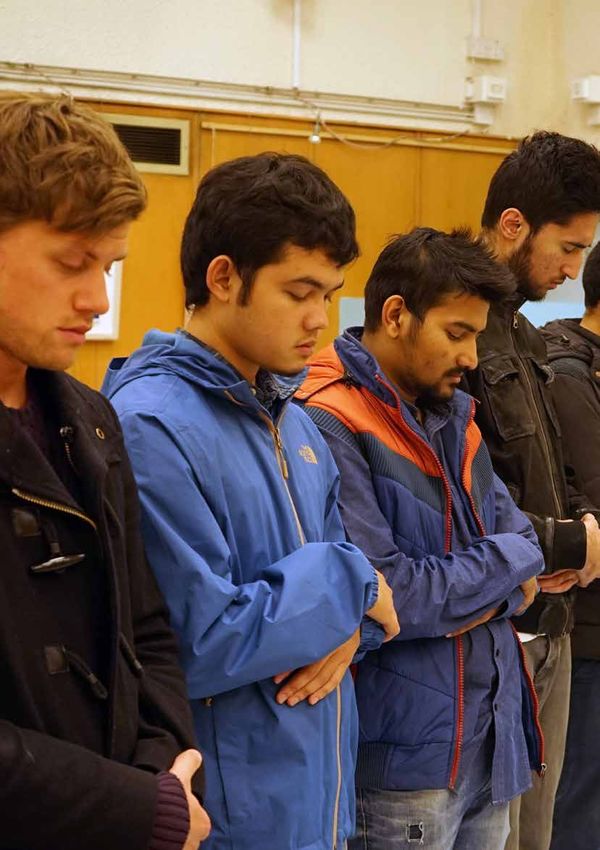
Photo credit: Ian Rutherford/The Scotsman.
The political developments of recent years make it ‘British Muslims in Numbers’ (2015) by Sundas Ali.
all the more important for us to develop a deeper However, there are important differences between
understanding of Scotland’s Muslim population the two reports, both in terms of the way in which
and their communities. The governance of Scotland data has been collected, owing to different census
is becoming increasingly devolved. The Scotland forms used in Scotland, compared with England
Act 2016, introduced in the wake of the post- and Wales, but also differences in the geography
independence referendum Smith Commission, levels used, and other aspects of report presentation.
extended and awarded significant powers to Holyrood. Nonetheless, I have tried to present this report such
The recent result of the EU referendum has raised the that it can be used as coherently as possible alongside
prospect of a second independence referendum for its predecessor, but also as a standalone document.
Scotland, or at the very least, even further devolution, A specific feature of this report relates to the much
as real possibilities. In this context, the importance of smaller population in Scotland as a whole, but also
understanding Scotland’s Muslim populations, their specifically of Muslims in Scotland. This has caused
demographic as well as health, education, and socio- limitations in some areas where population numbers
economic features cannot be understated to those in multivariate categories were so small as to become
who will be developing policies for the nation. As restricted by the National Records of Scotland (NRS),
Scotland’s sense of itself continues to develop in this in the interest of safeguarding and confidentiality.
new and evolving political context, its appreciation Figures have been approximated for some of these
of its minority populations is vital to its evolving self- categories by using microdata samples provided by
understanding. While at 1.45% Muslims constitute the NRS but sometimes this also has not been possible.
only a small minority of Scotland’s population, they
remain the largest religious minority, larger than all Finally, a note about census data. Censuses are an
other religious minorities combined. Furthermore, invaluable tool for providing ‘snapshot’ pictures, and
as the Christian population of Scotland continues to for helping us to understand patterns of change over
decline, and the population of those with ‘no religion’ time. Unlike polling data or data from other surveys
continues to rise,3 Muslims and those of minority faiths relying on sample populations, national census data
occupy an increasingly integral place in 21st Century accounts for every individual – and as such commands
Scotland. a high level of statistical confidence. However, although
the figures in this report provide us with the most up
This report uses the most recent national census data to date, comprehensive picture of Scottish Muslims,
(2011) to develop a statistical overview of the Muslim the data is already five years old and so will not reflect
population of Scotland. It seeks to fulfil two aims: 1) changes and developments that have taken place
to provide the first comprehensive profile of Scotland’s since 2011 – for instance the recent and continuing
Muslim population using the most recent census arrival of Syrian refugees.
data; and 2), to highlight some of the features that are
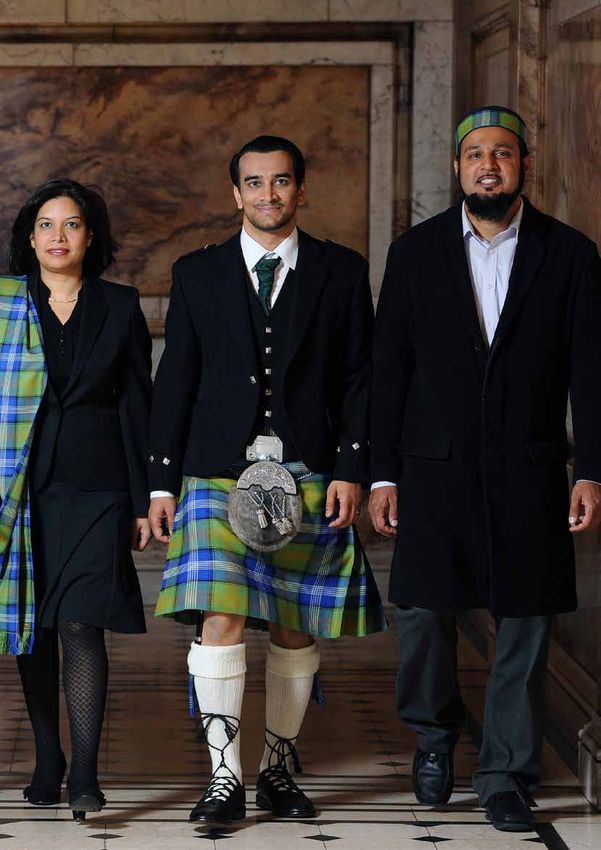
Picture above: MSPs Humza Yousaf and Angela Constance take part
distinctive to Scotland’s Muslim population, and offer in swearing in ceremony at the Scottish Parliament, May 2016. In
some analysis, context and deeper understanding acknowledgment of his Scottish and Pakistani heritage, Yousaf took his
oath in English and Urdu. Jeff J Mitchell/Getty Images
of the issues. For both of these aims, this report can
be used in conjunction with the recently published
1
Bashir Maan, Muslims in Scotland (Argyll, Edinburgh: 2014), p.13.
2
Stefano Bonino, Muslims in Scotland: the making of community in a post-9/11 world (Edinburgh University Press, Edinburgh: forthcoming, 2017).
3
The Christian population went down from 65.1% in 2001 to 52.8% in 2011, and the ‘no religion’ population went up from 27.5% in 2001, to 36.7% in 2011.
See Census 2001 NRS Table KS07 and Census 2011 NRS Table KS209SCb.
7
SCOTTISH MUSLIMS IN NUMBERS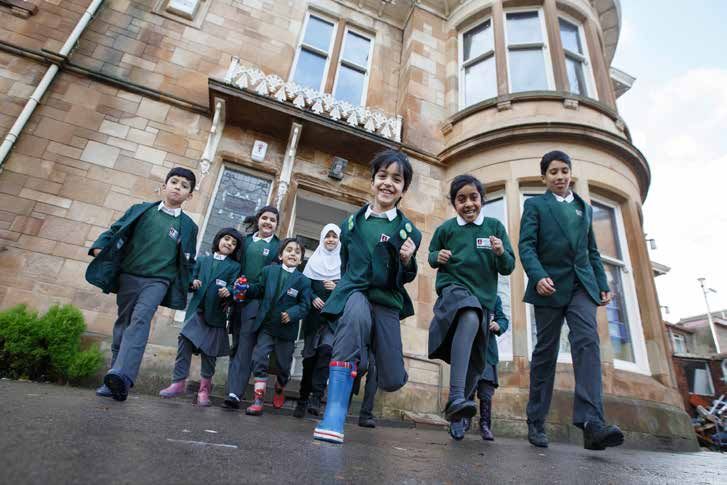
2. Executive Summary
Demographic Detail:                                                   policy makers and civil society groups will be most
                                                                      effective when taking this into account.
Population and Place of Birth:
                                                                  •   In addition to involving women and young people,
    •   Muslims constitute 1.45% of the population in                 Scottish Muslim institutions should remain alert to
        Scotland – there are 76,737 Muslims, 41,241 of them           the importance of reflecting the ethnic diversity
        men, and 35,496 women. Scotland’s Muslims make                of their communities in decision-making and
        up 2.8% of all Muslims in the UK.                             executive roles.

    •   The Muslim population of Scotland is larger than        Geographical Distribution:
        the total population of all the other non-Christian
        faith groups in Scotland.                                 •   75% of Muslims live in the three Scottish
                                                                      parliamentary regions of Glasgow (43.6%), Lothian
    •   44.6% of the Muslim population is UK born, and                (19%) and North East Scotland (11.8%), mainly
        37.3% are born in Scotland.                                   concentrated in the cities of Glasgow, Edinburgh,
                                                                      Dundee and Aberdeen.
Observations:
                                                                  •   While there are Muslims in all of Scotland’s council
    •   The Muslim population increased by over 34,000                areas, and in general, the population is sparsely
        between the 2001 and 2011 Censuses, and Muslims               distributed. The city council with the highest
        remain the largest minority faith population in               concentration of Muslims is Glasgow (5%), and
        Scotland – larger than all the other minority faiths          within Glasgow, Dundee and East Renfrewshire,
        combined.                                                     some wards have significant concentrations of
                                                                      Muslim population. Pollokshields and Southside
    •   Nonetheless, the Muslim population is very small              Central (both in Glasgow) are the wards with the
        in proportion to the overall population. Muslims              highest concentration of Muslim residents – 27.8%
        are about 1 in 70 of the Scottish population. For             and 15.7% respectively.
        comparison, Muslims are just under 1 in 20 of the
        population of the UK as a whole.                        Observations:

    •   Scotland has a growing Muslim population                  •   The widespread and relatively sparse distribution of
        which has a young age profile, and increasingly               the Muslim population across Scotland contradicts
        UK/Scotland-born. Though currently a youthful                 popular notions of clustering and self-segregation.
        population, the proportion falling into the 65+ age
        band is gradually on the rise.                            •   There are only 13 electoral wards with a Muslim
                                                                      population of 5% or more – even the areas where
Ethnic Diversity:                                                     the Muslim population is most concentrated such
                                                                      as Pollokshields ward (27.8%), do not come close
    •   Muslims in Scotland are an ethnically diverse                 to comparing with some of the urban areas in
        population. Although a majority of Muslims are                Blackburn, Bradford and Birmingham, where the
        South Asian (65%), 9.8% or 1 in 10 are Arab, and 7.8%         Muslim population in some wards is over 70%.
        (1 in 12) are White, while 7% are Black.
                                                                Age Profile:
    •   Over one third of the Black and Ethnic Minority
        (BME) population in Scotland is Muslim.                   •   30% of the Muslim population was aged 15 or under
                                                                      in 2011, compared to 17% of the total population.
Observations:                                                         For the 65+ age band, the figure for Muslims is 3.3%,
                                                                      compared with 17% for the population as a whole.
    •   Ethnic diversity among Scottish Muslims reflects a
        wide range of worldwide connections that provide          •   It is estimated that in 2021 there will be 5,076
        opportunities for mutually enriching cultural and             Muslims aged between 65-85, an estimated 6.6%
        economic ties and relationships.                              of the overall population in that age band.

    •   One third of the BME population in Scotland             Observations:
        are Muslim, and 92% of Muslims in Scotland are
        BME – experiences of race, cultural, religious and        •   The youthful demographic profile of the Muslim
        gendered prejudice and discrimination are often               population is distinct from the older profile of the
        intersectional and efforts to address them by                 overall Scottish population.

8
                                                                                     SCOTTISH MUSLIMS IN NUMBERS
•   The growing proportion of Muslims in the elderly       Observation:
      age bands requires relevant care providers to
      address cultural and religious needs for this group      •   Only a small proportion of the Muslim population
      as appropriate.                                              struggles with English, and the patterns for this are
                                                                   not dissimilar to those among the populations of
  •   In implementing provisions for grave re-use in               other religious minorities for whom a significant
      the recently introduced Burial and Cremation Act             number are immigrants.
      (Scotland), Burial Authorities should be obliged to
      consult with religious communities in situations       Household Type:
      where religious sections of cemeteries are affected.
                                                               •   Two figures are particularly reflective of the younger
Parliamentary Constituency Population:                             age profile of the Muslim population: the first is
                                                                   that 12,125, or 50.6% of Muslim households are
  •   Muslim populations are not significant enough                composed of a couple with dependent children,
      in any of Scotland’s Westminster or Holyrood                 almost double the figure (26%) for the overall
      constituencies to be the sole decisive force in the          population. The second, that 39% or 2 in 5 Muslim
      fortunes of an electoral candidate. The Scottish             households have a household reference person
      parliamentary constituency with the highest                  (formerly ‘head of household’) under the age of
      Muslim population is Glasgow Southside, where                35. This is in comparison to a figure of 18% for the
      18.9% of the population is Muslim. Glasgow Central           population as a whole.
      is the UK parliamentary constituency with the
      highest Muslim population, at 12.9%.                     •   10% of Muslim household reference persons report
                                                                   that they are single, with dependent children.
Observation:
                                                             Observation:
  •   Although there are many examples of significant
      political engagement from Scotland’s Muslim              •   The high number of Muslim households with
      communities, there remains a low voter registration          dependent children will have interests in specific
      and turnout rate. Much more can be done to                   policy areas such as the development of facilities
      generate awareness among Muslims of the                      for children and young people, as well as family
      importance of participating in the electoral system.         support networks and initiatives. The latter may be
                                                                   especially useful for single parent households.
Issues Relating to Civic Life:
                                                             Focus on Youth:
National Identity:
                                                               •   2.4% of school-aged children (5-14 year olds) are
  •   71% of Muslims in Scotland consider their only               Muslim. In some Glasgow and Dundee wards where
      national identity to be Scottish or British (or any          Muslim populations are more concentrated the
      combination of UK identities).                               figure is much higher. For instance in Pollokshields,
                                                                   48% of all school-age children are Muslim.
Observations:
                                                               •   By 2021, it is projected that the number of Muslim
  •   Muslims have a strong sense of belonging to                  teenagers aged 15-19 in Scotland will be around
      Scotland in particular and the UK more generally.            7,250, or 9.4% of the overall population for that age
                                                                   band.
  •   Wider research raises questions around ways in
      which Scots who are not Muslims imagine their          Observations:
      Scottishness, and the extent to which this includes
      or excludes Muslims and ethnic minorities. It has        •   Schools and other services for children and families
      also pointed to notable real and perceived barriers          need to be aware of these demographic patterns
      to integration – one of which being divergent                in developing their diversity, equality and inclusion
      understandings of what it means to integrate. This           policies.
      highlights the importance of cross-community and
      cross-cultural conversations and initiatives around      •   Key ways in which the Scottish Government’s
      what is a challenging and often contentious topic.           commitments to diversity and equality can be
                                                                   demonstrated include supporting the teaching of
English Language Skills:                                           Urdu in schools in areas of Glasgow and Dundee,
                                                                   and actively supporting the development of
  •   Only 4.5% of Muslims in Scotland have weak or no             broader religious literacy in schools, to help prepare
      English language skills.                                     children for life in Scotland as part of an increasingly
                                                                   diverse, globalised and interconnected world.

                                                                                                                       9
        SCOTTISH MUSLIMS IN NUMBERS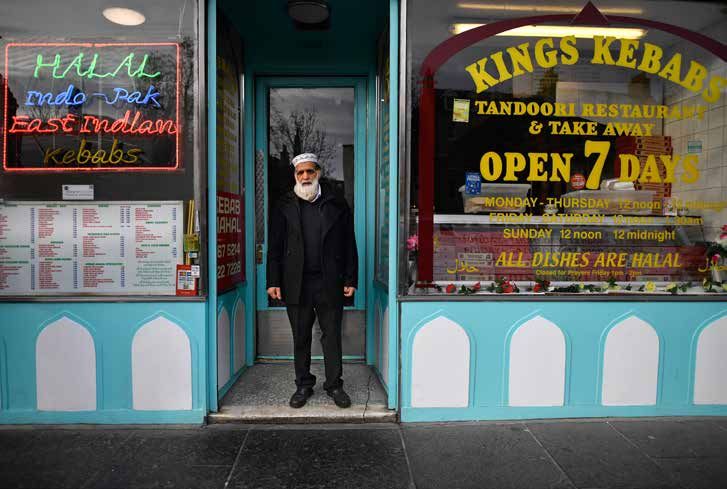
•   Concerns around racism and Islamophobia in the             •   1 in 4 Muslim households are privately rented. This
      education sector and the workplace should be                   figure is especially high among Arab households,
      taken seriously and commitments made towards                   where 46.5% of homes are privately rented. This may
      better public education, and policy development                be related to the high student numbers among the
      around these areas.                                            Arab population.

Prison Population:                                             Observations:

  •   1.8% of the prison population in Scotland is Muslim.       •   The availability of affordable rental properties
      This is broadly in proportion to the 1.45% of Scottish         will be a matter of significant concern for many
      population which is Muslim, and in significant                 Muslims who are privately renting, but particularly
      contrast to the very large figure of 13% for Muslim            so for Arabs, where over 45% fall into this category.
      prisoners in England and Wales.                                Local authorities seeking to designate ‘rent pressure
                                                                     zones’ under the SPRT from 2017 onwards should
Observation:                                                         bear this in mind.

  •   Discussions around the high Muslim prison                  •   Presently, there is no shari’a compliant home
      population in England and Wales should take                    purchase product being offered under the Scottish
      care to point out that Scotland is an exception to             Help to Buy affordable homes scheme. This
      this. Scottish prison and rehabilitation institutions          represents an opportunity for potential lenders to
      should nonetheless take care to be sensitive to                offer a product that may be of significant interest
      cultural and religious needs of Muslim and other               to Muslims.
      minority populations.
                                                               Health and Disability:
Inequalities:
                                                                 •   The proportion of Muslims self-declaring as having
Deprivation:                                                         ‘bad or very bad health’ is 4% - similar to the figure
                                                                     for the overall population of Scotland, which is 5.6%.
  •   Due to the relatively sparse distribution of Muslims
      in Scotland within their cities of settlement, it is       •   For the 65 and over age band, 33% of Muslim
      difficult to assess whether there is any pattern               women are in ‘bad or very bad health’, as compared
      between Scottish Index of Multiple Deprivation                 with only 14% for the overall population.
      (SIMD) scores, and Muslim residents. This may be an
      area of potential future research at data zone level.      •   39% of Muslim women aged 60 and over self-
                                                                     declare a disability that ‘limits their day-to-day
  •   Previous research has found that BME populations               activities a lot’, compared with the smaller figure
      are more likely to live in more deprived areas of              for 25% for the overall population.
      Scotland, and this is most notable with the ‘African’
      category.                                                Observations:

  •   Notably, although Pakistanis and Bangladeshis              •   These patterns mirror similar findings in England
      are still over-represented in more deprived areas              and Wales.
      of Scotland, they are less likely to be living in such
      areas in Scotland than they are in England.                •   Although UK-level research suggests that Muslims
                                                                     and those from South Asian backgrounds
Observations:                                                        experience disadvantage in accessing mental and
                                                                     physical health services.
  •   Solid evidence suggests that BME Scots continue
      to be more likely to reside in more deprived               •   There is potential to develop appropriate initiatives
      areas, despite data suggesting that Pakistanis                 to combat the impacts of loneliness on elderly
      and Bangladeshis are less likely to be living in               Pakistani and Bangladeshi women, as a means
      deprivation in Scotland than they are in England.              of tackling one of the causes of ill-health in this
                                                                     demographic.
  •   There is scope for more research into SIMD scores
      in smaller geographies where there are more                •   Charities and civil society groups have run successful
      concentrated Muslim populations in Scotland.                   health education, awareness and accessibility
                                                                     campaigns on a number of issues – these can be
Housing Tenure:                                                      emulated and expanded where appropriate.

  •   More than half of Muslim households are owner
      occupied and 18% are classed as social housing.

10
                                                                                    SCOTTISH MUSLIMS IN NUMBERS
Labour Market Issues: aged 18 and over. 62% of these are based in either
Glasgow or Edinburgh – where Muslim students
Economic Activity/Inactivity: account for 8.2% and 4.5% (respectively) of the total
student population.
• Almost 1 in 3 (31%) of the Muslim population is
‘economically active’ full-time – whether as an • There is a significant variation in the proportion
employee, or self-employed. For the population of students within predominantly Muslim ethnic
as a whole, the figure is 51%. It is notable that groups. 39% of Arabs aged 18 and over are students,
both of these percentages are higher than the compared with 19.3% for Bangladeshis and 14.4%
corresponding figures for England and Wales for Pakistanis.
which are 19.8% for Muslims and 34.9% for the
overall population. Observations:
• Muslims in Scotland are fast becoming a highly
• Among those who are employed full-time, the educated population – currently exceeding the
figures for Muslims who are self-employed is total population figure for ‘degree level and above’
notably high, at 29% compared with 12.3% for education by 10 percentage points.
the overall population. This is most pronounced for
Muslim men in full-time employment, more than • With 1 in 7 Scottish Muslims being students, there is
1 in 3 of whom are self-employed. For the general a great deal of potential in seeking to harness the
population, the corresponding figure is 15.7%. time and skills that they have to offer, for charitable
and community-based volunteering, for example.
Observations:
Employment Patterns:
• The lower proportion of ‘economically active’
Muslims is offset by the higher proportion of Focus on Women:
Muslims who are students. While unemployment
is clearly an issue among Muslims, at 2.4% higher • 25% of Muslim women aged 16 and over are
than the national percentage, it represents a ‘looking after home or family’, compared with 5.6%
smaller discrepancy than exists in England and for the total population – this figure accounts for 2
Wales (3.2%). in 5 Muslim women who are ‘economically inactive’.
• The proportion of the ‘economically active’ Muslim • Muslim women are less likely to be working full-
population who are self-employed is significantly time (15.6%) than Hindu or Sikh women (33.8% and
high: almost a third of ‘economically active’ 26.1% respectively). This is likely offset by the high
Muslim males. This pattern suggests an ethic for proportion of Muslim women looking after home
entrepreneurship and economic independence, or family. A notable proportion of Muslim women
as well as demonstrating the significant economic work part-time (15.1%), and while unemployment is
contribution that Muslim businesspeople make to slightly higher for Muslim women than for women
Scotland at both local and national levels. It could in the general population (at 5.3% compared with
also be a symptom of labour market discrimination 3.1%), it is similar to the corresponding levels for
that may have been faced by Muslims, leading Hindu and Sikh women, which are 6.1% and 7.5%
them to resort to self-employment. respectively.
Education and Qualifications: Observations:
• Between 2001 to 2011, the proportion of Muslims • There are many factors that explain the lower figures
with no qualifications decreased at a faster pace for ‘economic activity’ among Muslim women,
than it did for the overall population of Scotland – not least the younger age profile of the Muslim
falling from 38.5% to 21.4% population and the higher number of dependent
children in Muslim households.
• The percentage of Muslims holding ‘Level 4
and above’ (degree level) qualifications has also • Other important factors relate to employment
markedly increased during the same period, from barriers – whether linked to discrimination or to a
22.2% to 37.5%. lack of more flexible, non-traditional channels of
employment that could aid mothers in entering or
• Thus, in 2011, the proportion of highly educated re-joining the workforce.
(Level 4 and above) Muslims in Scotland exceeds
the figure for the population as a whole: 37.5%
compared with 27.1%.
• There are 11,054 Muslim students aged 18 and over
– approximately 1 in 7 of the total Muslim population
of Scotland, and 21.3% of the population of Muslims
11
SCOTTISH MUSLIMS IN NUMBERSSocio-economic Classification: Observations:
• The socio-economic picture for Muslims is diverse • Comparisons with the Muslim population in
and varied. Significantly, 12.4% of Muslims are England and Wales suggest that Muslims in
classified as ‘small employers and own account Scotland are somewhat socio-economically better
workers’, supporting findings in previous sections. off.
• While the proportion of Muslims in ‘higher’ • Viewed together with other findings in this report,
level occupations is close to figures for the total the socio-economic profile of Muslims in Scotland
population, a much higher proportion of Muslims suggests an aspirational population with a keen
have never worked. capacity for social mobility.
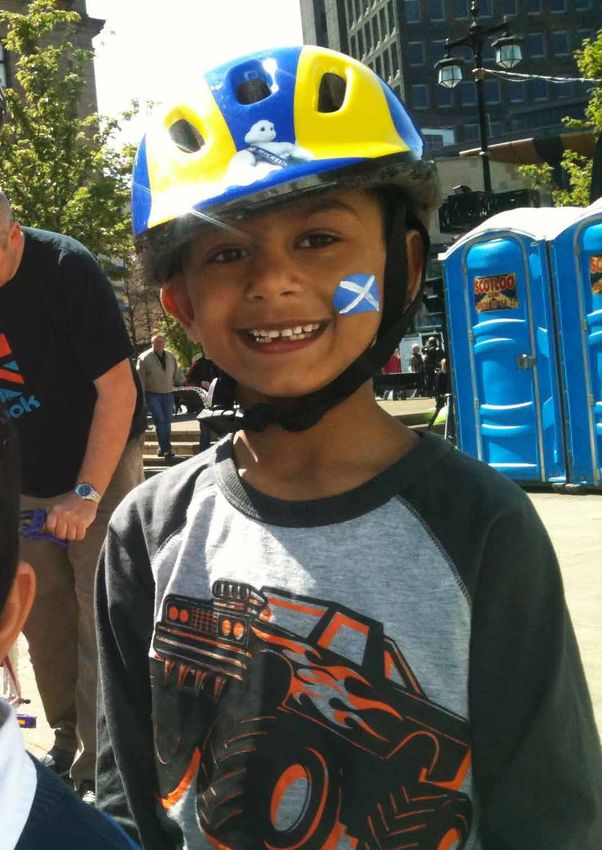
'Salaam', a mural mixing Islamic patterns with Celtic designs by artist Children at the Michelin Junior Bike Ride in Dundee, 2012.
Mohammed Ali, at Edinburgh's Annandale Street Mosque.
A Taste of Scottish Islam event at the City of Edinburgh Methodist Church. Procurator Fiscal at work in Livingston’s Sheriff Court.
‘Salaam’ mural by artist Mohammed Ali.
12
SCOTTISH MUSLIMS IN NUMBERSGlasgow Central Mosque
3. Demographic Detail
3.1       Population and place of birth                                     Table 1: Religion in the 2011 Census

The 2011 Census shows that Muslims make up 1.45% of                                    Religion                  Total Population               %
the population of Scotland. There are 2,706,066 Muslims                      Church of Scotland                             1,717,871           32.44
in England and Wales, and 3,832 in Northern Ireland.
The Muslim population in Scotland has increased from                         Roman Catholic                                   841,053           15.88
42,557 in 2001 to 76,737 in 2011, representing an 80%                        Other Christian                                  291,275            5.50
increase over 10 years. As is the case in England and                        (including Christian related)
Wales, the Muslim population of Scotland is larger than                      Muslim                                             76,737           1.45
the total population of other non-Christian faith groups.
While Scotland remains a majority Christian country, it                      Hindu                                              16,327           0.31
is only just – but this is more due to the large number                      Buddhist                                           12,795           0.24
of those who consider themselves to have no religion,
                                                                             Sikh                                                 9,055          0.17
rather than to the population sizes of other religions.
The figure for this category is over 10 percentage points                    Jewish                                               5,887          0.11
greater than the corresponding figure for England
                                                                             Any other religion                                 15,248           0.29
and Wales – over 1 in 3 people in Scotland ‘have no
religion’, compared to 1 in 4 in England and Wales.                          No religion                                    1,941,116           36.66
Indeed, those describing themselves as having no                             Religion not stated                              368,039            6.95
religion outnumber the largest Christian denomination
(Church of Scotland). This category, combined with                           All                                            5,295,403         100.00
the minority faiths and those who did not state their                       Source: Census 2011, NRS Table KS209SCb
religion comes to a total of 46%.

                                     Table 2: Scottish Muslims as a proportion of British Muslims

The overwhelming majority                                                All              Muslims          % Muslims          % of Muslim Total
of UK Muslims reside in
England (95.5%). Scottish             England                53,012,456                 2,660,116                     5.0                        95.5
Muslims make up only a                Wales                    3,063,456                    45,950                    1.5                          1.6
small proportion of the UK
Muslim population, at 2.8%            Scotland                 5,295,403                    76,737                    1.5                          2.8
of the total.                         N. Ireland               1,810,863                      3,832                   0.2                          0.1
                                      UK                     63,182,178                 2,786,898                     4.4                         100
                                     Source: Census 2011, Office for National Statistics Table KS209EW, NRS Table KS209Cb and Northern Ireland Statistics
                                     and Research Agency (NISRA) Table QS218NI

44.6% of the Scottish Muslim population is UK-born (37.3% in Scotland). As for those born outside of the UK, the
greatest proportion by far was born in Asia, followed in close succession by Africa and then the Middle East.

Table 3: Country of Birth of Muslim Population

 Country of Birth                        Muslims                               Muslim Population Change           % of overall population increase

                           2001              %         2011             %                    2001-2011
 Scotland                17,015         39.98        28,649        37.33                           11,634                                           34
 Rest of UK                4,163         9.78         5,613         7.31                             1,450                                       4.24
 Rest of Europe            1,284         3.02         3,220         4.20                             1,936                                       5.66
 Africa                    2,590         6.09         7,392         9.63                             4,802                                      14.05
 Middle East               3,108         7.30         6.600         8.60                             3,492                                      10.22
 Asia                    14,159         33.27        25,039        32.63                           10,880                                       31.83
 Rest of World               238         0.56            224        0.29                                  -9                                    -0.03
 Total                   42,557       100.00         76,737 100.00                                 34,185
Source: Census 2001 NRS Table CT 0151a and Census 2011 NRS Table CT 0122c

14
                                                                                                       SCOTTISH MUSLIMS IN NUMBERS
3.2 Ethnic Diversity
Scottish Muslims are an ethnically diverse population – and increasingly so. While a majority of Scottish Muslims
are of South Asian ethnic heritage (65%), this proportion is decreasing over time and the figure for Muslims in
other ethnic categories, notably, the ‘Black total’, and specifically the ‘African’ categories, is rising. It is not possible
to track changes in population for some ethnic categories, such as ‘White: Polish’, and ‘Arab’ as these were only
introduced in the 2011 Census, and as such, we do not have figures for 2001. Muslims make up just under 40% of
the Scottish Asian population, 15% of the ‘Black’ category and over 80% of the Arab population. The total Black
and Minority Ethnic (BME) population of Scotland is estimated to number around 211,000. With 70,754 Muslims
falling into these ethnic categories, Muslims make up 33.5% of the BME population – just over 1 in 3. Additionally,
approximately 92% of Scottish Muslims are classified as BME.
Table 4: Ethnicity of Muslim Population
Proportion
Muslim Population
Muslims of overall %
Change
change
2001 % 2011 % 2001- % change
2011
White Total 3,401 8.0 5,983 7.80 2,582 75.92 4.15
White: Scottish 1,151 2.70 2,501 3.26 1,350 117.29 2.17
White: Other British 353 0.83 694 0.90 341 96.60 0.55
White: Irish 35 0.08 61 0.08 26 74.29 0.04
White: Gypsy/Traveller - - 25 0.03 - - -
White: Polish - - 130 0.17 - - -
Other White 1,862 4.38 2,572 3.35 710 38.13 1.14
Any Mixed Background 1,367 3.21 1,342 1.75 -25 -1.83 -0.04
Asian Total 33,626 79.01 54,870 71.50 21,244 63.18 34.17
Indian 892 2.10 1,954 2.55 1,062 119.06 1.71
Pakistani 28,353 66.62 44,858 58.46 16,505 58.21 26.55
Bangladeshi 1,669 3.92 3,053 3.98 1,384 82.92 2.23
Other South Asian 2,674 6.28 4,664 6.08 1,990 74.42 3.20
Chinese 38 0.09 341 0.44 303 797.37 0.49
Black Total 1,059 2.49 5,380 7.01 4,321 408.03 6.95
Caribbean 15 0.04 31 0.04 16 106.67 0.03
African 946 2.22 5,051 6.58 4,105 433.93 6.60
Black Scottish or Other Black 98 0.23 298 0.39 200 204.08 0.32
Other Ethnic Group Total 3,104 7.29 9,162 11.94 6,058 195.17 9.74
Arab - - 7,505 9.78 - - -
Any other ethnic group - - 1,657 2.16 - - -
All people 42,557 76,737 62,172 100.00
Source: Census 2001, NRS Table CT 0151b and Census 2011, NRS Table DC2201SC
15
SCOTTISH MUSLIMS IN NUMBERSTable 5: Muslim Proportions of Ethnic Groups
Muslims as % of all Muslims as % of
Ethnic Group All Muslims population in ethnic overall Muslim
category population
White 5,084,407 5,983 0.1 7.8
Mixed/multiple ethnic group 19,815 1,342 6.8 1.8
Asian/Asian Scottish/Asian British 140,678 54,870 39.0 71.5
Black/African/Caribbean/Black 36,178 5,380 14.9 7.0
Scottish/British
Arab 9,366 7,505 80.1 9.8
Any other ethnic group 4,959 1,657 33.4 2.2
All 5,295,403 76,737 1.5 100.0
Source: Census 2011, NRS Table DC2201SC
Observations:
• Ethnic diversity in the Muslim population is reflective of the increasing diversity in Scottish society in general.
• Muslims constitute over 1 in 3 of the BME population in Scotland, and it is important for local authorities
and service providers to be aware of this when formulating and delivering initiatives to these groups.
Ethnicity and religion are both ‘protected characteristics’ under the Equality Act (2010), and cultural and
religious sensitivity in public services and institutions can help to promote inclusivity and equal access for
all individuals.
• Greater awareness and appreciation of ethnic, cultural and linguistic diversity from Scottish Muslim
institutions and organisations would help them to better reflect the communities that they serve.
3.3 Geographical Distribution
There is a Muslim presence in the population of each of Scotland’s eight parliamentary regions. However, the
Muslim populations of Glasgow, Lothian and North East Scotland account for 75%, or 3 in 4 of the total Muslim
population of Scotland. These three regions include the cities of Glasgow, Edinburgh, Dundee and Aberdeen,
which are home to the largest concentration of Muslims. From among these, Glasgow’s Muslim population is
significantly greater than any of the other cities, with 43.6% of Scotland’s Muslims residing there – constituting 5%
of Glasgow’s total population.
Table 6: Muslim Population by Region
Muslims as % of
Muslims as % of all
Scottish Parliamentary Region All people Muslim overall Muslim
population
population
Glasgow 669,157 33,144 5 43.6
Lothian 729,918 14,753 2 19.0
North East Scotland 753,768 9,273 1.2 11.8
West Scotland 706,719 6,204 0.9 8.3
Central Scotland 658,769 5,951 0.9 7.8
Mid Scotland and Fife 653,539 4,244 0.6 5.1
South Scotland 678,356 1,991 0.3 2.7
Highlands and Islands 445,177 1,177 0.3 1.7
5,295,403 76,737 100
Source: Census 2011, NRS Table KS209SCb
16
SCOTTISH MUSLIMS IN NUMBERSThere are 13 electoral wards with a Muslim population of 5% or more. 11 of these wards are in Glasgow or East
Renfrewshire, and the remaining two are in the city of Dundee. The wards with the highest percentage of Muslim
residents are Pollokshields (27.8%) and Southside Central (15.7%). While these figures do suggest that there are
a handful of areas where the Muslim population is quite concentrated, they also question the popularised notion
that British Muslims are self-segregating, by showing that there is a Muslim presence even in the most remote of
Scottish regions. Moreover, even the areas with the most concentrated Muslim populations do not come close to
comparing to some of the wards in the North of England, that have seen moments of racial tension in the past,
such as those during the summers of 1995 and 2001.
In terms of population change, we see that there has been a steady growth of the Muslim populations in all the
main cities. The two main reasons for this are natural increase (as figure 1 shows the Muslim population of Scotland
has a high birth rate), and immigration. The Muslim population increase for Edinburgh and Glasgow mirrors the
overall Muslim population increase for Scotland. In Dundee and East Renfrewshire, the Muslim population is
steadily increasing, with the lower rate of increase perhaps explained by the lower number of immigrant families
settling in these areas as compared to the two larger cities. The high figure for Aberdeen’s Muslim population
increase (144.9%) is reflective of the transient nature of the population in that city. Conversations with officials at
the Aberdeen Muslim Association (AMA) reveal that mosque attendance and participation in community initiatives
during this period indicated an influx of new Muslim residents in the city.4 However, many of these proved to be
temporary residents who were employed short-term in Aberdeen’s oil industry, or pursuing education or training
in the city for a fixed period of time. The expectation is that by the 2021 Census, especially in light of the recent
North Sea oil crisis and its impact on local jobs, Aberdeen’s Muslim population will have shown a decline from the
figure for 2011.
Table 7: Muslim Population Change in Cities with Largest Muslim Population
Overall
Muslim Population
City All People Population Muslims
Change
Change
2001 2011 2001- % 2001 % of all 2011 % of all 2001- %
2011 population population 2011
Aberdeen 212,125 222,793 10,668 5.0 1,753 0.8 4,293 1.9 2,540 144.9
Dundee 145,663 147,268 1,605 1.1 2,879 2.0 3,875 2.6 996 34.6
East 89,311 90,574 1,263 1.4 1,918 2.1 3,002 3.3 1,084 56.5
Renfrewshire
Edinburgh 448,624 476,626 28,002 6.2 6,759 1.5 12,434 2.6 5,675 84.0
Glasgow 577,869 593,245 15,376 2.7 17,792 3.1 32,117 5.4 14,325 80.5
Source: Census 2001, NRS Table KS07 and Census 2011, NRS Table KS209Ca
4
Author interview with Sumon Hoque, Aberdeen Muslim Association, 21st April 2016.
17
SCOTTISH MUSLIMS IN NUMBERS3.4 Age Profile
Figure 1: Population Pyramids for Muslim Population and Overall Population
Male Overall Population Female
Male Muslim Population Female
Although, as we have just seen, the Muslim population of Scotland is a youthful one, a comparison between the
data for 2001 and 2011 reveals that, on the whole it appears to be very gradually getting older. The proportion
of the Muslim population in the 0-4 age bracket increased only very marginally from 10.3% to 10.8%, suggesting
a relatively stable birth rate. The most significant increase in terms of absolute numbers and share of the total
Muslim population is in the 25-64 age bracket. There is also a notable increase of Muslims aged 65+ (a percentage
change of +110.2%), this age band now accounts for 3.3% of the total Muslim population (up from 2.8% in 2001).
Meanwhile, the younger age bands of 5-14/15 year olds, and 15/16-24 year olds experienced a decrease in their
percentage share of the total Muslim population of Scotland (from 21% to 17.2%, and from 18.2% to 16.9%,
respectively).5
5
The 2001 Census categorised age groups as 5-15 and 16-24, whereas the 2011 Census used the categories 5-14 and 15-24. The comparison I make
between the two sets of results is therefore not precise, and only made in order to illustrate general patterns in population change over time.
18
SCOTTISH MUSLIMS IN NUMBERSTaking a closer look at the older age categories, we can see that by the 2021 census, there will be approximately
5,000 Muslims in the 65-84 age band. This estimate is based on a simple extrapolation of the 55-74 year old
population, and does not take into account mortality or emigration.
Table 8: Change in Muslim Population Age Profile 2001-2011
Muslims Muslim Population Change
Age group 2001 % Age group 2011 % Age group 2001-2011 change %
0 to 4 4,389 10.3 0 to 4 8,283 10.8 0 to 4 3,894 88.7
5 to 15 8,930 21.0 5 to 14 13,191 17.2 5 to 14/15 4,261 47.7
16 to 24 7,733 18.2 15 to 24 13,003 16.9 15/16 to 24 5,270 68.1
25 to 64 20,303 47.7 25 to 64 39,733 51.8 25 to 64 19,430 95.7
65 + 1,202 2.8 65 + 2,527 3.3 65 + 1,325 110.2
Total 42,557 Total 76,737 Total 34,180
Source: Census 2001, NRS Table T26 Census 2011, NRS Table CT0041a
Table 9: Muslims in 55 to 74 year Old Age Band, 2011
Age Group Muslims Muslims as % of overall population
55 to 59 2,130 2.8
60 to 64 1,229 1.6
65 to 69 831 1.1
70 to 74 886 1.2
Total 5,076 6.6
Observations:
• The younger age profile of the Muslim population carries increasing cultural and economic significance,
a feature that resonates beyond Scotland, across the UK and internationally. Muslim millennials, dubbed
'Generation M', have been found to enjoy a growing amount of commercial and cultural influence, not least
for their role in the growth of the 'Muslim pound'.6
• The gradual growth of the older age-band within the Muslim population should alert us to the need to
develop culturally sensitive elderly care services.
• Facilities and provisions for burial are another area of inevitably increasing importance for the Muslim
population, in view of the notable growth of the 65+ age band. A recent overhaul of Scotland’s archaic burial
laws which for the first time allows the re-use of graves, was preceded by a public consultation which made
specific assurances that religious communities would be consulted, and given the right to object, in cases
where it is proposed to reuse graves in cemeteries or sections of cemeteries used by them. As others have
noted, such specific assurances seem to have been dropped by the final text of the Burial and Cremation
Act (Scotland).7 It is hoped that they will be included as requirements in the forthcoming guidance to be
issued to local Burial Authorities, as grave re-use is widely considered by Muslims (as with many Jews) to be
forbidden.
6
Shelina Janmohamed, Generation M: Young Muslims Changing the World (London: IB Tauris, 2016).
7
Alistair Hunter, ‘Grave Concerns about Reuse’, (16th September 2016), Burying our Differences: negotiating faith and space in contexts of death and
diversity, The University of Edinburgh: http://www.bod-project.llc.ed.ac.uk/2016/09/16/grave-concerns-about-reuse/ (accessed on 4th October 2016).
19
SCOTTISH MUSLIMS IN NUMBERS3.5 Parliamentary constituency population
None of the Westminster parliamentary constituencies in Scotland have a Muslim population that can be considered
to be significant enough to decide an election result on its own. Table 10 shows that Glasgow Central and Glasgow
South have the highest Muslim populations, at 12.9% and 7.3% respectively. They are both areas where Muslim
communities have been actively courted by politicians during election campaigns. The Scottish parliamentary
constituency with by far the largest Muslim population is Glasgow Southside, where Nicola Sturgeon is the sitting
MSP, with almost 20% of its population identifying as Muslim. The proportion of Muslims in this constituency is
almost three times as much as the proportion of Muslims in Glasgow Kelvin, the next constituency in Table 11.
Muslims in Scotland have a long tradition of political activism and engagement, both through standing for elected
office, and participating in political parties and civil society campaigns. However, according to analysis conducted
by the Electoral Commission, voter registration among Muslims in Scotland is lower than it is for the populations
of any other religion.8 There is scope for Muslim civil society groups to campaign more strongly in favour of voter
registration. A social media initiative by the Amina Muslim Women’s Resource Centre, encouraging Muslim
women to vote during the 2015 General Election and the EU referendum earlier this year can be highlighted as
an example of good practice in this regard.9
For many Scottish Muslims the Labour Party was historically considered to be the ‘political home’. However, in the
wake of 9/11 and in particular after the start of the Iraq War in 2003, the SNP, with its anti-war and consciously
inclusive rhetoric calling for ‘civic nationalism’, became an increasingly attractive option for many Pakistani
Muslims.10
Observations:
• The lower voter registration figure among Scottish Muslims is a feature that is shared with the Muslim
population in England and Wales. It is also a notable feature among BME communities in general.
• Public awareness campaigns on the importance of voter registration, perhaps by the Electoral Commission
in cooperation with grassroots community bodies might go some way to encouraging a higher voter
registration and turnout rate among Muslims and other minority populations.
Table 10: UK constituencies with over 1% Muslim population
UK Parliamentary Muslims as % of all
All people Muslim
Constituency 2005 population
Glasgow Central 91,257 11,773 12.9
Glasgow South 87,852 6,424 7.3
Glasgow North 71,636 3,423 4.8
Glasgow South West 83,979 3,913 4.7
Glasgow North East 85,854 2,960 3.4
East Renfrewshire 90,574 3,002 3.3
Edinburgh East 95,314 3,081 3.2
Glasgow North West 85,882 2,688 3.1
Edinburgh South West 99,236 2,819 2.8
Dundee West 89,226 2,522 2.8
Edinburgh South 86,184 2,391 2.8
Edinburgh North and Leith 106,183 2,654 2.5
Aberdeen North 99,654 2,305 2.3
Aberdeen South 93,197 1,616 1.7
Dundee East 88,016 1,510 1.7
Edinburgh West 89,709 1,489 1.7
Glasgow East 87,402 974 1.1
Source: Census 2011, NRS Table KS209SCb
20
SCOTTISH MUSLIMS IN NUMBERSTable 11: Scottish Constituencies with over 1% Muslim population
Scottish Parliamentary Constituency 2011 All people Muslim Muslims as % of all population
Glasgow Southside 66,005 12,456 18.9
Glasgow Kelvin 79,334 4,673 5.9
Glasgow Cathcart 74,883 3,881 5.2
Glasgow Pollok 78,356 3,493 4.5
Glasgow Maryhill and Springburn 74,753 2,927 3.9
Edinburgh Eastern 79,883 2,798 3.5
Glasgow Anniesland 74,628 2,347 3.1
Aberdeen Central 83,557 2,508 3.0
Edinburgh Northern and Leith 86,344 2,433 2.8
Dundee City West 75,267 1,990 2.6
Dundee City East 72,001 1,885 2.6
Edinburgh Southern 77,561 2,018 2.6
Edinburgh Pentlands 73,177 1,889 2.6
Edinburgh Central 83,867 2,038 2.4
Edinburgh Western 75,794 1,258 1.7
Glasgow Provan 72,896 1,177 1.6
Glasgow Shettleston 72,390 1,163 1.6
Aberdeen Donside 78,497 1,002 1.3
Aberdeen South and North Kincardine 74,663 822 1.1
Source: Census 2011, NRS Table KS209SCb
8
The Electoral Commission, ‘Electoral registration in 2011’ (Electoral Commission, Office for National Statistics and National Records of Scotland, July 2014).
According to this analysis, Christians in Scotland are most likely (90.1%) to be on the electoral register, and Muslims are the least likely (74.5%).
9
More information on this initiative can be viewed on the Amina MWRC Facebook page: www.facebook.com/amina.mwrc.1 (accessed on 30th August 2016).
10
Asifa Hussain and William Miller, Multicultural Nationalism: Islamophobia, Anglophobia and Devolution (Oxford: OUP, 2006).
21
SCOTTISH MUSLIMS IN NUMBERSTable 12: Muslim population in all Scottish Council Areas
Scottish Council Area 2011 All people Muslim Muslims as % of all population
Glasgow City 593,245 32,117 5.4
East Renfrewshire 90,574 3,002 3.3
Edinburgh, City of 476,626 12,434 2.6
Dundee City 147,268 3,875 2.6
Aberdeen City 222,793 4,293 1.9
North Lanarkshire 337,727 3,315 1.0
West Lothian 175,118 1,746 1.0
East Dunbartonshire 105,026 1,044 1.0
Falkirk 155,990 1,415 0.9
South Lanarkshire 313,830 2,514 0.8
Renfrewshire 174,908 1,313 0.8
Fife 365,198 2,591 0.7
Stirling 90,247 578 0.6
Midlothian 83,187 508 0.6
Clackmannanshire 51,442 334 0.6
Perth & Kinross 146,652 741 0.5
East Lothian 99,717 508 0.5
West Dunbartonshire 90,720 344 0.4
Shetland Islands 23,167 96 0.4
Aberdeenshire 252,973 691 0.3
Highland 232,132 691 0.3
Dumfries & Galloway 151,324 406 0.3
Angus 115,978 395 0.3
East Ayrshire 122,767 374 0.3
Moray 93,295 236 0.3
Scottish Borders 113,870 256 0.2
South Ayrshire 112,799 246 0.2
North Ayrshire 138,146 210 0.2
Inverclyde 81,485 197 0.2
Argyll & Bute 88,166 186 0.2
Eilean Siar 27,684 61 0.2
Orkney Islands 21,349 20 0.1
Source: Census 2011, NRS Table KS209SCb
22
SCOTTISH MUSLIMS IN NUMBERS23 SCOTTISH MUSLIMS IN NUMBERS
4. Issues relating to Civic Life
4.1       National Identity

The proportion of the total Muslim population of Scotland who regard their only identity to be either Scottish,
British, or any combination of UK identities, is almost 71%. This is a significantly higher figure than the proportion
of Muslims in Scotland who are UK-born, which is 45%. If the figure is taken to include those who have another
identity as well as a UK identity, it goes up to 73%. This is notably higher than the comparable figures for other
Scottish religious minority communities of South Asian heritage such as Hindus (37%), but slightly lower than the
figure for Sikhs (80%).

Table 13: Muslims and National Identity
                        National Identity                                   Muslim         Muslims as % of overall Muslim population
 Scottish identity only                                                          18,667                                                         24.3
 British identity only                                                           22,371                                                         29.2
 Scottish and British identities only                                             7,578                                                          9.9
 English identity only                                                               656                                                         0.9
 Scottish and any other identities                                                4,421                                                          5.8
 Any other combination of UK identities (UK only)                                    549                                                         0.7
 Scottish/British combinations                                                   54,242                                                         70.7
 Other identity only *                                                           20,483                                                         26.7
 Other identity and at least one UK identity                                      2,012                                                          2.6
 All people                                                                      76,737
*Includes people with a non-specific national identity such as “citizen of the world”.
Source: Census 2011, NRS Table CT0122a

Observations:

     •   If national identity is taken to be an indicator of integration, then this figure suggests that Muslims have a
         strong sense of belonging to Scotland in particular and the UK more generally. It is a figure that is broadly
         consistent with other religious minority groups. Opinion polls and previous research both also find that
         Muslims in Scotland tend to more readily identify with their Scottishness than Muslims in England do with
         Englishness, and that Scottish Muslims tend to see their national and faith identities in complementary
         terms, rather than in conflict with one another. 11

     •   Notwithstanding the ease with which many Muslims identify with their Scottishness, and the explicit
         promotion by the Scottish National Party of an inclusive and open ‘civic nationalism’, questions remain
         around the extent to which Scotland sees its minorities, and Muslims among them, as peripheral to
         Scottish identity rather than at its core. As others have noted, a reluctance to extend notions of formal
         multilingualism and corporate multifaithism to include ‘migrant’ languages and religions is indicative that
         the place of minorities in today’s evolving Scottish identity. This is at variance with the place of minorities in
         contemporary British identity. 12

     •   Earlier qualitative research on Muslim integration in Scotland found some challenging perspectives among
         both Muslims and non-Muslims. While many Muslims were found to understand integration as a one-way
         process, demanding effort on their part to ‘adapt’, many non-Muslims expressed concerns about the growth
         of the Muslim population, viewing it as a potential threat to Scottish life and identity.13 Viewed together, such
         findings serve to remind us that despite the positive image given by data on national identity, there remain
         significant challenges to the process of integration in the evolving social and political landscape of Scotland.

11
   Peter Hopkins, ‘‘Blue squares’, ‘proper’ Muslims and transnational networks Narratives of national and religious identities amongst young Muslim men
living in Scotland’ Ethnicities 7:1 (2007), pp.61-81.
Hussain and Miller, Multicultural Nationalism (2006).
12
   Nasar Meer ‘Looking up in Scotland? Multinationalism, multiculturalism and political elites’ Ethnic and Racial Studies 38:9 (2015), pp.1477-1496.
13
   Amy Homes et al, ‘Muslim integration in Scotland’ (Ipsos Mori Scotland and the British Council, July 2010), pp.8-9.

24
                                                                                                        SCOTTISH MUSLIMS IN NUMBERS
4.2 English Language Skills
The subject of English language proficiency is one which has received a great deal of recent attention, largely
because of comments made by the former Prime Minister, David Cameron in January 2016. His claim that up
to 22% of Muslim women in England struggled with speaking English was disputed strongly, not least by the
Muslim Council of Britain, who’s ‘British Muslims in Numbers’ report estimated that this figure was closer to 6%.14
In Scotland, the census focused on ‘English language skills’, rather than proficiency, and as such, the categories in
this section differ slightly from those used in the corresponding section on proficiency in the England and Wales
census. The following three tables show the data on English language skills for Muslims in various formats.
Tables 14 and 15 below suggest that the figure for Scottish Muslims who have no English skills, or have difficulty
with English, is 4.5%. Table 16 gives us an overview of English language skills among the population of minority
religions for whom a significant proportion will be first generation immigrants. This is useful as it shows that for
Buddhists, Hindus, Muslims and Sikhs, figures for women in the top categories of English skills lag behind those
for men by a few percentage points, across the board. For the population as a whole – there is no significant
discrepancy between the figures for men and women.
Tables 14 and 15: Muslims and English Language Skills
Speaks
Speaks Reads
Speaks, but Other
All people Understands and reads but does
reads and does not combination No skills
aged 3 spoken but does not speak
writes read or of skills in in English
and over English only not write or write
English write English
English English
English
Muslim 71,715 1,209 62,032 4,924 1,581 117 523 1,329
% 1.7 86.5 6.9 2.2 0.2 0.7 1.9
Source: Census 2011, NRS Table AT058
All people aged 3 and over Muslim %
Top three categories of English skills 68,537 95.6
Bottom three categories of English skills 1,849 2.6
No skills in English 1,329 1.9
All people aged 3 and over 71,715 100.0
Source: Census 2011, NRS Table AT058
14
The large discrepancy between these two figures is due to the fact that they were measuring different variables. The MCB estimate was extrapolated from
the figures for those in the population aged 3 and over, who had been born in Pakistan or Bangladesh. This was because the figures for English language
proficiency for Muslims (or indeed for Muslim women) had not, at the time of the report’s publication, yet been made available. Notwithstanding this, as
Nafeez M Ahmed points out, questions can also be raised about the government’s estimate, which relied on a base population of Muslim women aged
17 and over. If the 16 and under age band was excluded as irrelevant (assumed to be in education rather than in or seeking employment), then why was
the 65+ age band retained? See N M Ahmed, ‘David Cameron’s illiterate proposal to counter-radicalisation by targeting Muslim women’ (18th January
2016) available at: https://medium.com/insurge-intelligence/david-cameron-s-illiterate-proposal-to-counter-radicalisation-by-targeting-muslim-women-
f6069bfee942#.xxsxte2lw (accessed 17th August 2016). In short, both figures have their flaws, and a comparison between the two is not useful.
25
SCOTTISH MUSLIMS IN NUMBERSYou can also read