Gender Differences in the Cost of Corrections in Group Work
←
→
Page content transcription
If your browser does not render page correctly, please read the page content below
Gender Differences in the Cost of Corrections in Group Work
                                               Yuki Takahashi∗

                                     Click here for the latest version

                                               August 23, 2021

                                                    Abstract
       Corrections among colleagues are an integral part of group work, but people may take
       corrections as personal criticism, especially corrections by women. I study whether people
       dislike collaborating with someone who corrects them and more so when that person is a
       woman. People, including those with high productivity, are less willing to collaborate with
       a person who has corrected them even if the correction improves group performance. Yet,
       people respond to corrections by women as negatively as by men. These findings suggest
       that although women do not face a higher hurdle, correcting colleagues is costly and reduces
       group efficiency.

JEL codes: J16, M54, D91, C92
Keywords: correction, collaboration, group work, gender differences

   ∗
     Department of Economics, University of Bologna. Email: yuki.takahashi2@unibo.it. I am grateful to Maria
Bigoni, Siri Isaksson, Bertil Tungodden, Laura Anderlucci, and Natalia Montinari whose feedback was essential
for this project. I am also grateful to participants of the experiment for their participation and cooperation. Sonia
Bhalotra, Francesca Cassanelli, Alessandro Castagnetti, Mónica Costa-Dias, Valeria Ferraro, Lenka Fiala, Ria
Granzier-Nakajima, Silvia Griselda, Annalisa Loviglio, Yoko Okuyama, Monika Pompeo, Øivind Schøyen, Vincenzo
Scrutinio, Erik Ø. Sørensen, Ludovica Spinola, Florian Zimmermann, and PhD students at the NHH and the
University of Bologna all provided many helpful comments. This paper also benefited from participants’ comments
at the Annual Southern PhD Economics Conference, ESA Conference, FROGEE Workshop, Gender Gaps
Conference, PhD-EVS, Stanford Institute for Theoretical Economics, TIBER Symposium, Warwick Economics
PhD Conference, WEAI Conference, Webinar in Gender and Family Economics, and seminars at Ca’ Foscari
University, Catholic University of Brasília, the NHH, Tilburg University, the University of Bologna, and the
University of Copenhagen. Ceren Ay, Tommaso Batistoni, Philipp Chapkovski, Sebastian Fest, Christian König
genannt Kersting, and oTree help & discussion group kindly answered my questions about oTree programming; in
particular, my puzzle code was heavily based on Christian’s code. Michela Boldrini and Boon Han Koh conducted
the quasi-laboratory experiments ahead of me and kindly answered my questions about their implementations.
Lorenzo Golinelli provided excellent technical and administrative assistance. This study was pre-registered with
the OSF registry (https://osf.io/tgyc5) and approved by the IRB at the University of Bologna (#262643).

                                                         1
1    Introduction
Receiving corrections from colleagues is an integral part of group work. Consider academic
research. From the development of ideas to the writing up of the final draft, researchers discuss
their research project with their colleagues, receive criticisms, and refine the ideas and the
analysis. However, people may take the corrections personally. Imagine a researcher presents
their paper for which they spent several years, and someone points out a possible flaw in
their identification assumption or their experimental design. Since the validity of identification
assumptions and experimental designs are debatable, they may take it as a personal criticism.
    Those people may express their discomfort in some way, and a least aggressive way to do so
is not to collaborate. However, not being invited for collaboration could be detrimental to one’s
career success because having collaborations is essential in academia, where people co-author
the majority of papers (Jones 2021; Wuchty, Jones, and Uzzi 2007).
    Women’s corrections may receive stronger negative reactions because people often use double
standards for women and men. Evidence suggests that men undervalue women when they
criticize them (Sinclair and Kunda 2000) and that people punish women more harshly when
they make mistakes (Sarsons 2019) and commit misconduct (Egan, Matvos, and Seru 2021). If
so, women face a higher hurdle in their career success. It is also detrimental to group efficiency
as group members cannot fully benefit from female colleagues.
    This paper studies whether people dislike collaborating with someone who corrects them and
more so when that person is a woman. Answering this question using secondary data poses two
challenges. First, group formation is not random and group corrections are endogenous. Second,
different corrections are not necessarily comparable to each other.
    Thus, I design a quasi-laboratory experiment, a hybrid of physical laboratory and online
experiments, where group formation is randomized and define corrections such that researchers
can track its quality mathematically. Specifically, participants are allocated to a group of eight
and solve one joint task with each group member one by one. Each time participants finish
the task, they state whether they would like to collaborate with the group member with whom
they have just solved the task for the same task in the next stage, which is the main source
of earnings. This gives a strong incentive for participants to select as good a collaborator as
possible. The order of the group members with whom participants solve the task is randomized.
As a joint task, I use Isaksson (2018)’s number-sliding puzzle, which allows me to calculate
an objective measure of each participant’s contribution to the joint task as well as to classify
each move as good or bad. I define a correction as reversing a group member’s move, which is
comparable across different participants and can be classified as either good or bad.
    I find that participants correctly understand the notion of good and bad moves; that is, the
higher your contribution is to solving the puzzle, the more likely it is that you will be asked to
join a team. This is in line with what one would expect and validates my experimental design.
    Nonetheless, after controlling for the contribution, people are significantly less willing to
collaborate with a person who has corrected their moves, even if the corrections move the
puzzle closer to the solution. Although it may not be so costly to correct colleagues if only low
productivity people respond negatively to corrections, high productivity people also respond
negatively to corrections.

                                                2
Yet, people respond to corrections by women as negatively as by men; although I find
suggestive evidence that men respond more negatively to women’s good corrections, the finding
is not robust. These findings are unlikely to be due to people’s belief about differences in women’s
and men’s abilities: women and men contribute equally to the puzzle, and neither women nor
men underestimate women’s contribution.
This paper primarily relates to studies on gender differences in the contribution of ideas in
group work. Coffman (2014) finds that women are less likely to contribute their ideas to the group
in a male task due to self-stereotyping and Gallus and Heikensten (2019) find that debiasing
their self-stereotyping by giving an award for their high ability increases women’s contribution
of their ideas: they put women’s idea further ahead without involving open correction of their
group member. However, on some occasions, the contribution of ideas has to be made openly,
for example, in academic seminars and business meetings. In such cases, group members’
response plays an important role in the effectiveness of the intervention. Coffman, Flikkema,
and Shurchkov (2021) find that group members are less likely to choose women’s answers as a
group answer in male-typed questions. Guo and Recalde (2020) find that group members correct
women’s ideas more often than men’s ideas. Dupas et al. (2021) find that female economists
receive more patronizing and hostile questions during seminars. Isaksson (2018) finds that
men are more likely to correct their group member’s bad moves in the same puzzle used in my
experiment.1 My paper introduces correction in the contribution of ideas and examines its cost
on women and on group efficiency.
More generally, my paper contributes to the literature on gender differences in group work.
Isaksson (2018) finds that women under-claim their contribution compared to men in group
work despite their equal contribution. Haynes and Heilman (2013) find similar results. Sarsons
et al. (2021) find that people attribute less credit to a female economist when she co-authors a
paper with a male economist(s). Born, Ranehill, and Sandberg (2020) and Stoddard, Karpowitz,
and Preece (2020) find that women are less willing to lead a male-majority group. Shan (2020)
finds that female students are more likely to drop out from an introductory economics class
when they are assigned to a male-majority study group. Babcock et al. (2017) find that women
are more likely to volunteer and be asked to do non-promotable tasks. My paper promotes our
understanding of gender differences in group work.
My paper also speaks to the literature on organizational efficiency. Bandiera, Barankay, and
Rasul (2009) find that managers favor workers who have connections with the managers, which
distorts the allocation of talent and reduces firm efficiency as theory predicts (MacLeod 2003;
Prendergast and Topel 1996). Li (2020) finds that this managers’ favoritism not only distorts
the optimal allocation of talent but also reduces non-favored workers’ performance. Cullen
and Perez-Truglia (2021) find that managers favor workers with whom they presumably take a
smoking break together. Fang and Huang (2017) find that institutional investors give positively
biased evaluations for corporate analysts who graduated from the same university, especially
when the analysts are men. Kennedy and Pronin (2008) find that people tend to view others
who disagree with them as biased. Ronayne and Sgroi (2019) find that people often stick to
their decisions rather than accepting decisions suggested by people with higher abilities. My
1. As the puzzle was originally used by Isaksson (2018).
3finding that people are less willing to collaborate with people who have corrected them can be
another source of organizational inefficiency.
2 Experiment
Introducing a quasi-laboratory format I run the experiment in a quasi-laboratory format
where we experimenters connect us to the participants via Zoom throughout the experiment (but
turn off participants’ camera and microphone except at the beginning of the experiment) and
conduct it as we usually do in a physical laboratory, but participants participate remotely using
their computers. Online Appendix section B discusses the pros and cons of the quasi-laboratory
format relative to physical laboratory and standard online experiments.
Group task As the group task, I use Isaksson (2018)’s puzzle, a sliding puzzle with eight
numbered tiles, which should be placed in numerical order within a 3x3 frame (see Figure 1
for an example). To achieve this goal, participants play in pairs, alternating their moves. This
puzzle has nice mathematical properties: I can define the puzzle difficulty and classify a given
move as either good or bad by the Breadth-First Search algorithm. From the number of good
and bad moves one makes, I can calculate individual contributions to the group task; I measure
it by net good moves, the number of good moves minus the number of bad moves an individual
makes in a given puzzle.
I can also determine the quality of corrections of different participants objectively and
comparably.2 Further, the puzzle-solving captures an essential characteristic of teamwork in
which two or more people work towards the same goal (Isaksson 2018), but the quality of each
move and correction is only partially observable to participants (but fully observable to the
experimenter).
At each stage of the puzzle, there is only one best strategy which is to make a good move.3
There can be more than one good and bad move, but different good/bad moves are equal. There
is no path dependence either: the history of the puzzle moves does not matter.
At the beginning of each part, participants must answer a set of comprehension questions to
make sure they understand the instructions.
2.1 Design and procedure
Registration
Upon receiving an invitation email to the experiment, participants register for a session they
want to participate in and upload their ID documents as well as a signed consent form.4
2. The difficulty is defined as the number of moves away from the solution, a good move is defined as a move
that reduces the number of moves away from the solution, and a bad move is defined as a move that increases the
number of moves away from the solution.
3. This is conditional on that both players are trying to solve the puzzle; I show in online Appendix A that the
results are robust to exclusion of puzzles where either player might not be trying to solve the puzzle.
4. I recruit a few more participants than I would need for a given session in case some participants would not
show up to the session.
4Pre-experiment
On the day and the time of the session they have registered for, participants enter the Zoom
waiting room.5 They receive a link to the virtual room for the experiment and enter their first
name, last name, and their email they have used in the registration. They also draw a virtual
coin numbered from 1 to 40 without replacement.
Then I admit participants to the Zoom meeting room one by one and rename them by the
first name they have just entered. This information is necessary to match up their earnings in
this experiment and their payment information stored in the laboratory database, so participants
have a strong incentive to provide their true name and email address. If there is more than one
participant with the same first name, I add a number after their first name (e.g., Giovanni2).
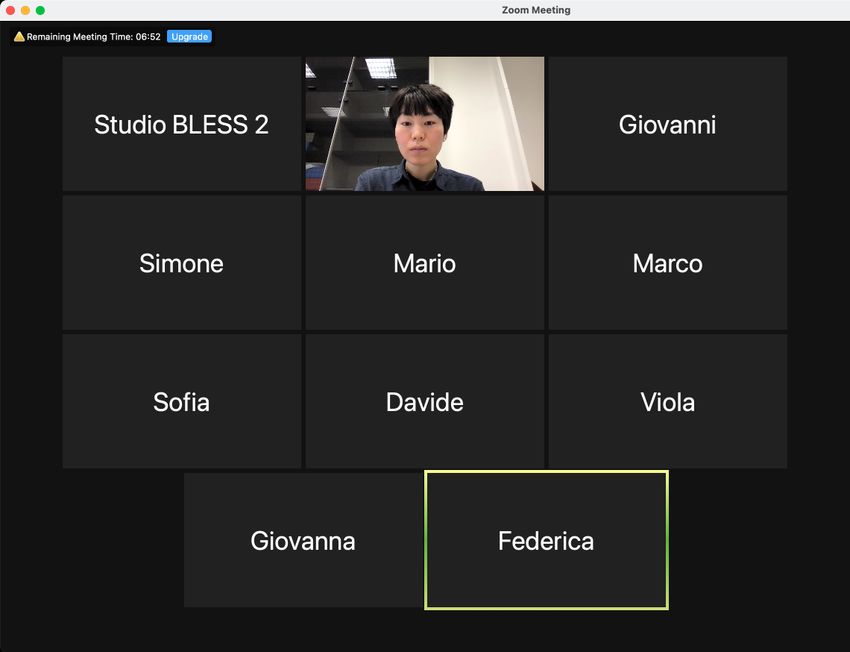
After admitting all the participants to the Zoom meeting room, I do roll call, a way to
reveal participants’ gender to other participants without making gender salient (Bordalo et
al. 2019; Coffman, Flikkema, and Shurchkov 2021). Specifically, I take attendance by calling
each participant’s first name one by one and ask her or him to respond via microphone. This
process ensures other participants that the called participant’s first name corresponds to their
gender. If there are more participants than I would need for the session (I need 16 participants),
I draw random numbers from 1 to 40 and ask those who drew the coins with the same number
to leave.6 Those who leave the session receive the 2€ show-up fee. Online Appendix Figure C1
shows a Zoom screen participants would see during the roll call (the person whose camera is
on is the experimenter; participants would see this screen throughout the experiment, but the
experimenter’s camera may be turned off).
I then read out the instructions about the rules of the experiment and take questions on
Zoom. Once participants start the main part, they can communicate with the experimenter only
via Zoom’s private chat.
Part 1: Individual practice stage
Participants work on the puzzle individually with an incentive (0.2€ for each puzzle they solve).
They can solve as many puzzles as possible with increasing difficulty (maximum 15 puzzles) in 4
minutes. This part familiarizes them with the puzzle and provides us with a measure of their
ability given by the number of puzzles they solve. After the 4 minutes are over, they receive
information on how many puzzles they have solved.
Part 2: Collaborator selection stage
Part 2 contains seven rounds, and participants learn the rules of part 3 before starting part
2. This part is based on Fisman et al. (2006, 2008)’s speed dating experiments and proceeds
as follows: first, participants are allocated to a group of 8 based on their ability similarity as
5. Zoom link is sent with an invitation email; I check that they have indeed registered for a given session before
admitting them to the Zoom meeting room.
6. I draw with replacement a number from 1 to 40 using Google’s random number generator (https://www.
google.com/search?q=random+number). If no participant has a coin with the drawn number, I draw next number
until the number of participants is 16. I share my computer screen so that participants see the numbers are
actually drawn randomly.
5measured in part 1. This is done to reduce ability difference among participants, and participants
do not know this grouping criterion.
Second, participants are paired with another randomly chosen participant in the same group
and solve one puzzle together by alternating their moves. The participant who makes the first
move is drawn at random and both participants know this first-mover selection criterion. If they
cannot solve the puzzle within 2 minutes, they finish the puzzle without solving it. Participants
are allowed to reverse the paired participant’s move.7 Reversing the partner’s move is what
I call correction in this paper. Each participant’s contribution in a given puzzle is measured
by net good moves. Figure 1 shows a sample puzzle screen where a participant is paired with
another participant called Giovanni and waiting for Giovanni to make his move. The paired
participant’s first name is displayed on the computer screen throughout the puzzle and when
participants select their collaborator to subtly inform the paired participant’s gender.
Once they finish the puzzle, participants state whether they would like to collaborate with
the same participant in part 3 (yes/no). At the end of the first round, new pairs are formed, with
a perfect stranger matching procedure, so that every participant is paired with each of the other
seven members of their group once and only once. In each round, participants solve another
puzzle in a pair, then state whether they would like to collaborate with the same participant in
part 3. The sequence of puzzles is the same for all pairs in all sessions. The puzzle difficulty is
kept the same across the seven rounds. The minimum number of moves to solve the puzzles is
set to 8 based on the pilot.
At the end of part 3, participants are paired according to the following algorithm:
1. For every participant, call it i, I count the number of matches; that is, the number of other
participants in the group who were willing to be paired with i and with whom i is willing
to collaborate in part 3.
2. I randomly choose one participant.
3. If the chosen participant has only one match, I pair them and let them work together in
part 3.
4. If the chosen participant has more than one match, I randomly choose one of the matches.
5. I exclude two participants that have been paired and repeat (1)-(3) until no feasible match
is left.
6. If some participants are still left unpaired, I pair them up randomly.
Part 3: Group work stage
The paired participants work together on the puzzles by alternating their moves for 12 minutes
and earn 1€ for each puzzle solved. Which participant makes the first move is randomized at
each puzzle, and this is told to both participants as in part 2. They can solve as many puzzles
as possible with increasing difficulty (maximum 20 puzzles).
7. Solving the puzzle itself is not incentivized, and thus participants who do not want to collaborate with the
paired participant or fear to receive a bad response may not reverse that participant’s move even if they think the
move is wrong. However, since I am interested in the effect of correction on collaborator selection, participants’
intention to correct that does not end up as an actual correction does not confound the analysis.
6Post-experiment
Each participant answers a short questionnaire which consists of (i) the six hostile and benevolent
sexism questions used in Stoddard, Karpowitz, and Preece (2020) with US college students and
(ii) their basic demographic information and what they have thought about the experiment.8
The answer to their demographic information is used to know participants’ characteristics as
well as casually check whether they have anticipated that the experiment is about gender, for
which I do not find any evidence.
After participants answer all the questions, I tell them their earnings and let them leave the
virtual room and Zoom. They receive their earnings via PayPal.
2.2 Implementation
The experiment was programmed with oTree (Chen, Schonger, and Wickens 2016) and conducted
in Italian during November-December 2020. I recruited 464 participants (244 female and 220
male) registered on the Bologna Laboratory for Experiments in Social Science’s ORSEE (Greiner
2015) who (i) were students, (ii) were born in Italy, and (iii) had not participated in gender-
related experiments before (as far as I could check).9 The first two conditions were to reduce
noise coming from differences in socio-demographic backgrounds and race or/and ethnicity that
may be inferred from participants’ first name or/and voice, and the last condition was to reduce
experimenter demand effects. The number of participants was determined by a power simulation
in the pre-analysis plan to achieve 80% power.10 The experiment is pre-registered with the
OSF.11
I ran 29 sessions with 16 participants each. The average duration of a session was 70
minutes. The average total payment per participant was 11.55€ with the maximum 25€ and the
minimum 2€, all including the 2€ show-up fee. Online Appendix Table D1 describes participants’
characteristics. The table shows that female participants are more likely to major in humanities
and male participants are more likely to major in natural sciences and engineering, a tendency
observed in most OECD countries (see, for example, Carrell, Page, and West 2010).12 Also,
most female and male participants are either bachelor or master students (97% of female and
94% of male) and the rest are PhD students.
3 Data description
I use part 2 data in the analysis as part 2 is where we can observe collaborator selection decisions.
I aggregate the move-level data at each puzzle so that we can associate behaviors in the puzzle
8. I was planning to construct a gender bias measure from the hostile and benevolent sexism questions and use
it to show those with higher gender bias respond more negatively to women’s corrections. However, people do not
respond more negatively to women’s corrections and that I could not have enough variation in this gender bias
measure, so decided not to report it. See the pre-analysis plan in the online Appendix section E.
9. The laboratory prohibits deception, so no participant has participated in an experiment with deception.
10. This number includes 16 participants from a pilot session run before the pre-registration where the experi-
mental instructions were slightly different. The results are robust to exclusion of these 16 participants.
11. The pre-registration documents are available at the OSF registry: https://osf.io/tgyc5. The pre-analysis
plan is also in the online Appendix E.
12. Individual fixed effects in the analysis control for one’s major. However, I do not run heterogeneity analysis
by major because major choice is endogenous to one’s gender.
7to the collaborator selection decisions. As shown in online Appendix Figure C2, both mixed
gender and single-gender groups perform equally well (panel A), about 71% of the puzzles are
solved within a minimum number of moves (panel B, the minimum number of moves is 8), and
corrections happen across the moves.
Table 1 describes own (panel A) and partner’s puzzle behaviors (panel B) and puzzle outcomes
(panel C). Panel A shows that there are no gender differences in puzzle-solving ability: both
contribution in part 2 and the number of puzzles solved in part 1, the difference between female
and male participants are statistically insignificant at 5% and quantitatively insignificant.131415
This is consistent with Isaksson (2018), who also finds no gender difference in contribution or
number of puzzles solved alone using the same puzzle, suggesting that any gender difference I
would find is unlikely to come from their ability difference. Panel A also shows that there are no
gender differences in propensity to correct partners, suggesting any gender differences I would
find are not coming from either gender corrects more than the other gender.
Panel A of Figure 2 presents the distribution of contribution by participants gender to further
elaborate panel A of Table 1 that women and men are equally good at puzzle solving: in about
70% of the puzzles, participants’ contribution is 4 (total good moves minus total bad moves),
and women’s and men’s distributions almost overlap.
Panel B shows that puzzle-solving ability as well as propensity to make corrections (both of
a mistake and of a right move) of partners paired with female and male participants is the same,
suggesting random pairing was successful and that any gender differences I would find are not
coming from partners of either gender correct more often. Participants are corrected by their
partner in 15-16% of the total puzzles, of which 12-13% are good corrections, and 5-6% are bad
corrections.16
Panel C shows that participants state they want to collaborate with the partner 71-72%
of the time. Participants spend on average 43-44 seconds for each puzzle (the maximum time
a pair can spend is 120 seconds), and take 11 moves. 85-86% of the puzzles are solved and
participants and the partner correct each other’s move consecutively in 4% of the puzzles.17
There is no gender difference in any of these outcomes, suggesting any gender differences cannot
be attributed to the imbalance in these outcomes.18
13. The number of puzzles solved in part 1 is marginally significant but quantitatively insignificant.
14. I changed the definition of contribution from the one in the pre-analysis plan because there was truncation
in the original contribution measure in more than 10% of the puzzle. Nonetheless, the same results hold when I
use original contribution measure; see online Appendix Table D2. Although the original measure is relative to
one’s pair while the measure I use in this paper is absolute, whether a measure is relative or absolute does not
matter because I add individual fixed effects.
15. The correlation coefficient between contribution and number of puzzles solved in part 1 is 0.1059 and the
p-value is below 0.001 (with standard errors clustered at individual level).
16. The percentage of good corrections and bad corrections do not sum up to the percentage of any correction
means there are puzzles where both good and bad corrections occurred. The results are robust to exclusion of
these overlapping puzzles, as shown in online Appendix Figure C4.
17. Indeed, in puzzles where consecutive correction happens, probability of selecting a paired participant as
collaborator drops from 78.0% to 26.8%.
18. Note that time spent to solve a puzzle is endogenous to correction and not a good control. For example. if
one corrects a mistake, then it takes fewer time to solve the puzzle. If one corrects a right move, on the other
hand, then it takes more time to solve the puzzle.
84 Theoretical framework
I present a simple theoretical framework to provide a benchmark for rational agent’s behaviors.
I consider a participant i who maximizes their expected utility by selecting their collaborator
j from a set of i’s potential collaborators J ≡ {1, 2, 3, 4, 5, 6, 7}. I assume i can partially observe
j’s move quality.
i’s utility depends on their payoff and emotion. The utility is increasing in the payoff, and
the payoff is increasing in i’s belief about j’s ability. Thus, if i would select with whom to play
in part 3, i would face the following problem:
max Eµj [ui (π(µj (ãj , cj , fj )), κi (cj , fj ))|θi , ωi ], ∂ui /∂π > 0, ∂π/∂µj > 0 (1)
j∈J | {z } | {z }
i’s payoff i’s emotion
where each term is defined as follows:
• µj : i’s belief about j’s ability
• ãj : j’s ability perceived by i
• cj : j’s good correction (=1 if j corrected i, =0 if j did not correct i)
• fj : j’s gender (=1 if female, =0 if male)
• θi : i’s belief about their ability relative to other participants (>0 if high, =0 if same, 0 if high, =0 if same, 0
• i’s utility is decreasing in their emotion: ∂ui /∂κi < 0
• emotion is irrelevant if i is fully rational: ui (π, κi ) ∝ ui (π)
If i can fully observe j’s move quality and i is fully rational, then j’s correction, cj , and
gender, fj , do not convey any information about j’s ability and is irrelevant for i’s decision
making. However, since i can only partially observe j’s move quality, j’s correction and gender
convey information about j’s ability even if i is fully rational.19
4.1 When i is fully rational
First, keeping j’s ability perceived by i fixed, the information j’s correction conveys depends on
θi . If i believes they are good at the puzzle, they would consider a correction as a signal of low
ability because i believes their move is correct. On the other hand, if i believes their ability is
low, then they would consider a correction as a signal of high ability. If i believes their ability
is the same as j’s, then a correction would not convey any information. However, since i can
partially observe j’s move quality, i consider a good correction as less negative/more positive
signal than a bad corrections regardless of θi . Thus,
• ∂µj /∂cj |cj is a bad correction < ∂µj /∂cj |cj is a good correction ∀θi .
Similarly, if i believes women is better at the puzzle, they would consider a correction from a
woman as a signal of high ability relative to men’s correction. On the other hand, if i believes
19. I nonparametrically control for j’s gender, but I also examine the effect of interaction term between j’s
correction and j’s gender.
9women is worse at the puzzle, then they would consider a correction from a woman as a signal
of low ability relative to men’s correction. If i believes women and men are equally good at the
puzzle, then a correction from a woman or man is irrelevant. Thus,
• ∂ 2 µj /∂cj ∂fj > 0 ∀θi if ωi > 0,
• ∂ 2 µj /∂cj ∂fj > 0 ∀θi if ωi = 0, and
• ∂ 2 µj /∂cj ∂fj < 0 ∀θi if ωi < 0.
4.2 When i is not fully rational
When i is not fully rational, i’s emotion, κi , enters in their maximization problem. Specifically, I
assume that j’s correction induces i’s negative feeling towards j. Also, I assume corrections by
women induce i’s stronger negative feeling towards j. Thus,
• ∂κi /∂cj < 0 and
• ∂ 2 κi /∂cj ∂fj < 0.
5 Response to corrections
In this section, I document evidence that people – both women and men – understand the notion
of good and bad moves. However, they are less willing to work with a person who corrected
their move after controlling for that person’s contribution to the puzzle, even if that person
makes good corrections.
5.1 Response to corrections: Estimating equation
I estimate the following model with OLS.
Selectij = β1 CorrectedGoodij + β2 CorrectedBadij + β3 F emalej + δContributionj + µi + ij
(2)
where each variable is defined as follows:
• Selectij ∈ {0, 1}: an indicator variable equals 1 if i selects j as their collaborator, 0
otherwise.
• CorrectedGoodij ∈ {0, 1}: an indicator variable equals 1 if j corrected i and moved the
puzzle closer to the solution, 0 otherwise.
• CorrectedBadij ∈ {0, 1}: an indicator variable equals 1 if j corrected i and moved the
puzzle far away from the solution, 0 otherwise.
• F emalej ∈ {0, 1}: an indicator variable equals 1 if j is female, 0 otherwise.
• Contributionj ∈ Z: j’s contribution to a puzzle played with i.
• ij : omitted factors that affect i’s likelihood to select j as their collaborator.
and µi ≡ N k=1 µ 1[i = k] is individual fixed effects, where N is the total number of participants
k
P
in the sample and 1 is the indicator variable. Standard errors are clustered at the individual
level.20
20. This is because the treatment unit is i. Although the same participant appears twice (once as i and once as
j), j is passive in collaborator selection.
10The key identification assumption is that Contributionj fully captures j’s ability perceived
by i (not true ability).21 This assumption is reasonable if we think participants’ willingness to
collaborate is increasing in the partner’s contribution to the puzzle, which is consistent with that
participants can partially observe their partners’ ability and their expected utility is increasing
in their payoff.
5.2 Response to corrections: Results
Columns 1-4 of Table 2 present the regression results of equation 2. Columns 1 and 3 show that
when we do not control for partner’s contribution, the coefficient estimate on bad correction
is negative and very large: the point estimate is -0.550 (p-value < 0.01) for women and -0.457
(p-value < 0.01) for men. That is, participants are 45.7-55.0% less willing to collaborate with
partners who made a bad correction, a correction that moved the puzzle far away from the
solution. Indeed, these coefficient estimates are more negative than the coefficient estimates
on good corrections: 0.281 more negative for women (p-value < 0.01) and 0.259 more negative
for men (p-value < 0.01). This is evidence that my experimental design is valid: participants
correctly understand the notion of good and bad moves and that participants are more willing
to collaborate with partners who contributed more.
Looking at columns 2 and 4, the coefficient estimate on the partner’s contribution is positive
and quantitatively and statistically highly significant: the point estimate is 0.089 (p-value <
0.01) for women and 0.080 (p-value < 0.01) for men. This suggests that participants are 8.0-8.9%
more willing to collaborate with partners who make one more good move.
The coefficient estimates on good correction in columns 2 and 4 are negative and quantitatively
and statistically highly significant with the point estimate -0.229 (p-value < 0.01) and -0.168
(p-value < 0.01). This suggests that people are 16.8-22.9% less willing to collaborate with those
who made a good correction(s), which corresponds to an increase in the contribution by 0.72-0.93
standard deviation.22
The coefficient estimate on bad correction in columns 2, which shows women’s response, is
negative and quantitatively and statistically highly significant with the point estimate of -0.172
(p-value < 0.01). However, the corresponding coefficient estimate for men in column 4 is -0.011
and statistically insignificant even at 10%. This may indicate that there are no emotional factors
associated with bad corrections for men, but the number of good and bad corrections are not
large enough, and I may be picking up some irregularities in the data.
21. By random pairing of participants, the paired participant’s gender is exogenous to participant’s unobservables.
However, correction is not exogenous for two reasons: (i) correction can be correlated with the paired participant’s
ability and paired participant’s ability can affect participant’s collaborator selection; (ii) There is an effect similar
to the reflection effect: participant’s puzzle behavior affects the paired participant’s behavior and vice versa;
for example, a participant’s meanness can increase the paired participant’s correction and can also affect their
collaborator selection. The identification assumption concerns the former point. To address the latter point, I add
individual fixed effects.
22. The standard deviation is taken from panel B of Table 1: 2.73 for partners faced by women 2.87 for and
partners faced by men.
116 Do women’s corrections receive stronger negative reactions?
In this section, I document that neither men nor women underestimate women’s contribution
and that women’s corrections do not receive stronger negative reactions by either women or men.
6.1 Do women’s corrections receive stronger negative reactions? Estimating
equation
I estimate the following model with OLS.
Selectij =β1 CorrectedGoodij + β2 CorrectedBadij + β3 F emalej
+ β4 CorrectedGoodij × F emalej + β5 CorrectedBadij × F emalej (3)
+ δ1 Contributionj + δ2 Contributionj × F emalej + µi + ij
Where each variable is defined as in equation 2.
6.2 Do women’s corrections receive stronger negative reactions? Results
Columns 5-6 of Table 2 present the regression results of equation 3. First, in both columns,
the coefficient estimate on the interaction between partner’s contribution and female partner is
almost 0 and statistically insignificant even at 10%. This suggests that neither women nor men
underestimate women’s contribution when selecting a collaborator.
In column 5, the coefficient estimates on the interaction between good correction and female
partner and bad correction and female partner are all positive although statistically insignificant.
This suggests that, if anything, women respond slightly less negatively to women’s correction. In
column 6, however, the coefficient estimate on the interaction between good correction and female
partner is negative and statistically marginally significant at 10%. Yet, it is not statistically
significant at 5%, and that the coefficient estimate on the interaction between bad correction and
female partner is positive on the contrary, although statistically insignificant. Thus, women’s
corrections do not receive stronger negative reactions from either women or men.
7 Who respond negatively to corrections?
If only low-ability people respond negatively to corrections, then correcting colleagues may not
be very costly. However, in this section, I document that even high-ability people respond
negatively to corrections.
7.1 Who respond negatively to corrections? Estimating equation
I estimate the following model with OLS.
Selectij =β1 CorrectedGoodij + β2 CorrectedBadij + β3 F emalej
+ β4 CorrectedGoodij × HighAbilityi + β5 CorrectedBadij × HighAbilityi (4)
+ δ1 Contributionj + δ2 Contributionj × HighAbilityi + µi + ij
12where each variable is defined as follows:
• HighAbilityi ∈ {0, 1}: an indicator variable equals 1 if i solved the above-median number
of puzzles in part 1 in a session they have participated, 0 otherwise.
Other variables are as defined in equations 2.
7.2 Who respond negatively to corrections? Results
Columns 7-8 of Table 2 present the regression results of equation 4. First, in both columns,
the coefficient estimate on the interaction between partner’s contribution and female partner is
almost 0 and statistically insignificant even at 10%. This may seem counter-intuitive because
high-ability people should be better able to observe move quality. One explanation is that
because high-ability people are paired with high-ability people, so the distribution of contribution
is less dispersed and contribution plays weaker role in willingness to collaborate. Panel B of
Figure 2 shows distribution of contribution of high-ability people is indeed less dispersed.
In column 7, the coefficient estimate on the interaction between good correction and high-
ability is negative and the coefficient estimate on the interaction between bad correction and
high-ability is positive, but they are both statistically insignificant. This suggests that high-ability
women respond as negatively to corrections as low-ability women.
In column 8, the coefficient estimates on the interaction between good correction and high-
ability and bad correction and high-ability are both negative and the former is statistically
significant at 5%. This is hard to interpret – it may be capturing some irregularity in the
data – but the bottom line is that high-ability men also respond as negatively to corrections as
low-ability men.
8 Discussion
This paper demonstrates that people, including those with high productivity, are less willing
to collaborate with a person who has corrected them even if the correction improves group
performance. However, I do not find evidence that people respond more negatively to corrections
by women. Thus, although women do not face a higher hurdle in their career, correcting
colleagues is costly and reduces group efficiency.
While the laboratory setting is different from the real-world, my findings are likely to be
a lower bound because of the following three reasons. First, being corrected is not observed
by others in my experiment: those who have been corrected do not face any reputation cost,
unlike in the real-world. Second, the emotional stake is much smaller: the puzzle ability is not
informative of the ability relevant for their work or study; it is not something people have been
devoting much of their time to, such as university exams, academic research, and corporate
investment projects. Third, participants are equal in my experiment; in the real-world, on the
other hand, there are sometimes senior-junior relationships, and corrections by junior people
may induce stronger negative reactions.
But there are two caveats. The first is that participants are strangers to each other in my
experiments while people know each other in the real-world. Thus, it is possible that repeated
interactions would mitigate people’s negative response to corrections (but they may also magnify
13the negative response due to rivalry, failure to build a good rapport, etc.). The second is that
most participants are bachelor or master students who are supposed to have a weaker gender
bias. Women’s corrections may receive stronger negative reactions if participants are older.
14References
Arechar, Antonio A., Simon Gächter, and Lucas Molleman. 2018. “Conducting interactive
experiments online.” Experimental Economics 21 (1): 99–131.
Babcock, Linda, María P. Recalde, Lise Vesterlund, and Laurie Weingart. 2017. “Gender Differ-
ences in Accepting and Receiving Requests for Tasks with Low Promotability.” American
Economic Review 107 (3): 714–747.
Bandiera, Oriana, Iwan Barankay, and Imran Rasul. 2009. “Social Connections and Incentives
in the Workplace: Evidence From Personnel Data.” Econometrica 77 (4): 1047–1094.
Bordalo, Pedro, Katherine Coffman, Nicola Gennaioli, and Andrei Shleifer. 2019. “Beliefs about
Gender.” American Economic Review 109 (3): 739–773.
Born, Andreas, Eva Ranehill, and Anna Sandberg. 2020. “Gender and Willingness to Lead: Does
the Gender Composition of Teams Matter?” The Review of Economics and Statistics.
Carrell, Scott E., Marianne E. Page, and James E. West. 2010. “Sex and Science: How Professor
Gender Perpetuates the Gender Gap.” The Quarterly Journal of Economics 125 (3): 1101–
1144.
Chen, Daniel L., Martin Schonger, and Chris Wickens. 2016. “oTree—An open-source platform
for laboratory, online, and field experiments.” Journal of Behavioral and Experimental
Finance 9:88–97.
Coffman, Katherine, Clio Bryant Flikkema, and Olga Shurchkov. 2021. “Gender stereotypes in
deliberation and team decisions.” Games and Economic Behavior 129:329–349.
Coffman, Katherine Baldiga. 2014. “Evidence on Self-Stereotyping and the Contribution of
Ideas.” The Quarterly Journal of Economics 129 (4): 1625–1660.
Cullen, Zoë B., and Ricardo Perez-Truglia. 2021. The Old Boys’ Club: Schmoozing and the
Gender Gap. Working Paper.
Dupas, Pascaline, Alicia Sasser Modestino, Muriel Niederle, Justin Wolfers, and Seminar Dy-
namics Collective. 2021. Gender and the Dynamics of Economics Seminars. Working
Paper.
Egan, Mark, Gregor Matvos, and Amit Seru. 2021. “When Harry Fired Sally: The Double
Standard in Punishing Misconduct.” Journal of Political Economy.
Fang, Lily Hua, and Sterling Huang. 2017. “Gender and Connections among Wall Street Analysts.”
The Review of Financial Studies 30 (9): 3305–3335.
Fisman, Raymond, Sheena S. Iyengar, Emir Kamenica, and Itamar Simonson. 2006. “Gender
Differences in Mate Selection: Evidence from a Speed Dating Experiment.” The Quarterly
Journal of Economics 121 (2): 673–697.
. 2008. “Racial Preferences in Dating.” The Review of Economic Studies 75 (1): 117–132.
Gallus, Jana, and Emma Heikensten. 2019. Shine a light on the bright: The effect of awards on
confidence to speak up in gender-typed knowledge work. Working Paper.
Goeschl, Timo, Marcel Oestreich, and Alice Soldà. 2021. Competitive vs. Random Audit Mech-
anisms in Environmental Regulation: Emissions, Self-Reporting, and the Role of Peer
Information. Working Paper 0699. University of Heidelberg, Department of Economics.
15Greiner, Ben. 2015. “Subject pool recruitment procedures: organizing experiments with ORSEE.”
Journal of the Economic Science Association 1 (1): 114–125.
Guo, Joyce, and María P. Recalde. 2020. Overriding in teams: The role of beliefs, social image,
and gender. Working Paper.
Haynes, Michelle C., and Madeline E. Heilman. 2013. “It Had to Be You (Not Me)!: Women’s
Attributional Rationalization of Their Contribution to Successful Joint Work Outcomes.”
Personality and Social Psychology Bulletin 39 (7): 956–969.
Isaksson, Siri. 2018. It Takes Two: Gender Differences in Group Work. Working Paper.
Jones, Benjamin F. 2021. “The Rise of Research Teams: Benefits and Costs in Economics.”
Journal of Economic Perspectives 35 (2): 191–216.
Kennedy, Kathleen A., and Emily Pronin. 2008. “When Disagreement Gets Ugly: Perceptions
of Bias and the Escalation of Conflict.” Personality and Social Psychology Bulletin 34 (6):
833–848.
Li, Xuan. 2020. The Costs of Workplace Favoritism: Evidence from Promotions in Chinese High
Schools. Working Paper.
MacLeod, W. Bentley. 2003. “Optimal Contracting with Subjective Evaluation.” American
Economic Review 93 (1): 216–240.
Prendergast, Canice, and Robert Topel. 1996. “Favoritism in Organizations.” Journal of Political
Economy 104 (5): 958–78.
Ronayne, David, and Daniel Sgroi. 2019. Ignoring Good Advice. Working Paper.
Sarsons, Heather. 2019. Interpreting Signals in the Labor Market: Evidence from Medical Referrals.
Working Paper.
Sarsons, Heather, Klarita Gërxhani, Ernesto Reuben, and Arthur Schram. 2021. “Gender
Differences in Recognition for Group Work.” Journal of Political Economy 129 (1): 101–147.
Shan, Xiaoyue. 2020. Does Minority Status Drive Women Out Of Male-Dominated Fields?
Working Paper.
Sinclair, Lisa, and Ziva Kunda. 2000. “Motivated Stereotyping of Women: She’s Fine if She
Praised Me but Incompetent if She Criticized Me.” Personality and Social Psychology
Bulletin 26 (11): 1329–1342.
Stoddard, Olga, Christopher F. Karpowitz, and Jessica Preece. 2020. Strength in Numbers: A
Field Experiment in Gender, Influence, and Group Dynamics. Working Paper.
Wuchty, Stefan, Benjamin F. Jones, and Brian Uzzi. 2007. “The Increasing Dominance of Teams
in Production of Knowledge.” Science 316 (5827): 1036–1039.
16Figures
4/16/2021 Il puzzle 4 su 7
Figure 1: Puzzle screen
Il puzzle 4 su 7
Tempo rimasto per completare questa pagina: 1 54
Stai risolvendo il puzzle con Giovanni
1 2 3
8 7 5
4 6
Aspetta il tuo partner!
Notes: This shows a sample puzzle screen where a participant is matched with another participant called Giovanni
at the 4th round puzzle and waiting for Giovanni to make his move.
Figure 2: Distribution of contribution
DebugPanel
infoA: By gender Panel B: By ability
vars_for_template
0.6
0.8
otherid
Relative frequency
Relative frequency
None 0.6
0.4
0.4
Basic
0.2
info
0.2
ID in group 2
Group
0.0
−10 −5
50
0 5 10
0.0
−10 −5 0 5 10
Round number 1
ParticipantParticipant's gender
P2
Female Male Participant's ability High Low
Notes: This figure shows the distribution of individual contribution by gender (panel A) and ability (panel B)
Participant label
and shows that most participants contributed to the same degree. Panel A further shows no gender difference in
contribution, and panel B further shows that high-ability higher fraction of people contributes to the puzzles to
Session code
94qyvjr0
the same degree. Contribution is defined as one’s net good moves in a given puzzle (the number of good moves
minus the number of bad moves).
17
localhost:8000/p/wjb8slm5/pt2/Game/3/ 1/1Tables
Table 1: Own and partners’ puzzle behaviors and puzzle outcomes
Female Male Difference
(N=1708) (N=1540) (Female – Male)
Mean SD Mean SD Mean SE P-value
Panel A: Own behaviors
Contribution 2.98 2.93 3.14 2.64 -0.16 0.10 0.11
# puzzles solved in pt. 1 8.36 2.41 8.80 2.34 -0.44 0.22 0.05
Correction 0.15 0.36 0.16 0.36 0.00 0.01 0.85
Good correction 0.12 0.33 0.12 0.33 0.00 0.01 0.90
Bad correction 0.06 0.23 0.05 0.22 0.00 0.01 0.70
Panel B: Partner’s behaviors
Contribution 3.04 2.73 3.07 2.87 -0.03 0.10 0.77
# puzzles solved in pt. 1 8.58 2.35 8.57 2.43 0.01 0.16 0.93
Correction 0.16 0.37 0.15 0.36 0.01 0.01 0.51
Good correction 0.13 0.33 0.12 0.32 0.01 0.01 0.44
Bad correction 0.06 0.23 0.05 0.22 0.01 0.01 0.44
Panel C: Puzzle outcomes
Willing to collaborate (yes=1, no=0) 0.72 0.45 0.71 0.45 0.01 0.02 0.49
Time spent (sec.) 43.74 36.15 42.99 35.76 0.74 1.28 0.56
Total moves 11.18 7.46 11.21 7.70 -0.03 0.28 0.92
Puzzle solved 0.85 0.36 0.86 0.35 -0.01 0.01 0.43
Consecutive correction 0.04 0.20 0.04 0.21 0.00 0.01 0.81
Notes: This table describes own (panel A) and partner’s puzzle behaviors (panel B) and puzzle outcomes (panel
C). P-values of the difference between female and male participants are calculated with standard errors clustered
at the individual level. Contribution is defined as one’s net good moves in a given puzzle (the number of good
moves minus the number of bad moves).
18Table 2: Response to corrections
Outcome: Willing to collaborate (yes=1, no=0)
Sample: Female Male Female Male Female Male
(1) (2) (3) (4) (5) (6) (7) (8)
Good correction -0.269*** -0.229*** -0.197*** -0.168*** -0.248*** -0.104* -0.208*** -0.107***
(0.043) (0.033) (0.040) (0.036) (0.045) (0.053) (0.042) (0.041)
Bad correction -0.550*** -0.172*** -0.457*** -0.011 -0.218*** -0.104 -0.201*** 0.005
(0.044) (0.047) (0.050) (0.052) (0.064) (0.076) (0.064) (0.063)
Female partner -0.009 0.004 0.007 0.016 -0.002 0.003 0.002 0.014
(0.021) (0.018) (0.026) (0.021) (0.032) (0.030) (0.018) (0.021)
Partner’s contribution 0.089*** 0.080*** 0.089*** 0.077*** 0.089*** 0.082***
(0.004) (0.004) (0.006) (0.006) (0.005) (0.004)
Good correction x Female partner 0.035 -0.119*
(0.057) (0.067)
Bad correction x Female partner 0.090 0.168
(0.093) (0.102)
Partner’s contribution x Female partner -0.001 0.006
(0.008) (0.007)
Good correction x High ability -0.048 -0.180**
(0.066) (0.075)
Bad correction x High ability 0.074 -0.061
(0.095) (0.109)
Partner’s contribution x High ability -0.001 -0.003
(0.007) (0.008)
Individual FE 3 3 3 3 3 3 3 3
Good correction 0.281*** -0.057 0.259*** -0.157**
−Bad correction (0.075) (0.061) (0.071) (0.065)
Baseline mean 0.780 0.780 0.778 0.778 0.780 0.778 0.780 0.778
Baseline SD 0.414 0.414 0.416 0.416 0.414 0.416 0.414 0.416
Adj. R-squared 0.111 0.369 0.090 0.306 0.369 0.307 0.368 0.308
Observations 1670 1670 1510 1510 1670 1510 1670 1510
Clusters 244 244 220 220 244 220 244 220
Notes: Columns 1 and 3 presents the regression results of equation 2 without partners’ contribution and shows
that people – both women and men – understand the notion of good and bad moves. Columns 2 and 4 show that
they are less willing to work with a person who corrected their move after controlling for that person’s contribution
to the puzzle, even if that person makes good corrections. Columns 5 and 6 show neither men nor women
underestimate women’s contribution and that women’s corrections do not receive stronger negative reactions by
either women or men. Columns 7 and 8 show even high-ability people respond negatively to corrections. Standard
errors in parentheses are clustered at the individual level. Significance levels: * 10%, ** 5%, and *** 1%.
19Online Appendix
Appendix A Robustness of the findings
There are three concerns that may alter my findings in the main text. First is unsolved puzzles.
Whether participants can solve a puzzle is an outcome of a particular pairing that is random.
However, “a good move is only preferable if you are playing with a partner who is also trying to
solve the puzzle” (Isaksson 2018, p. 25). If a participant is not trying to solve the puzzle, then a
pair is unlikely to solve the puzzle and good and bad corrections may not be meaningful.
Second is rounds 6 and 7. Remember that each participant plays the puzzle for seven rounds
and variables unaffected by treatment (interactions within a randomly-formed pair) must be
balanced. Online Appendix Figure C3 plots average partner gender balance (fraction of female
partners, panel A) and puzzle outcomes (panels B-H) across seven rounds along with their 95%
confidence intervals, separately for female (blue) and male participants (green). We see that in
rounds 6 and 7, participants are less willing to collaborate, experience more corrections, and less
likely to solve the puzzle. Although they are all outcomes of a particular pair so can just be
correlations, one may wonder whether rounds 6 and 7 are driving the results.
Third is puzzles where both good and bad corrections occurred. There are 495 puzzles in
which at least one correction occurred, of which 325 puzzles experienced good corrections only,
110 puzzles bad corrections only, and 60 puzzles experienced both good and bad corrections. In
these 60 puzzles, it is unclear which corrections – good or bad – dominated people’s mind in
determining whether to collaborate with a paired person.
To address these concerns, I re-estimate models in Table 2 of the main text with solved
puzzles only, with rounds 1-5 only, and with puzzles where only good or bad corrections occurred,
and plot the coefficient estimates and 95% confidence intervals of good and bad corrections
of columns 2 and 4 in panels A and B, the coefficient estimates and 95% confidence intervals
of the interaction between good correction and female partner and bad correction and female
partner of columns 5 and 6 in panels C and D, and the coefficient estimates and 95% confidence
intervals of the interaction between good correction and high ability and bad correction and
high ability of columns 7 and 8 in panels E and F of online Appendix Figure C4. The green dots
and lines show estimates with solved puzzles only, the red dots and lines show estimates with
rounds 1-5 only, and the purple dots and lines show estimates with puzzles where only good
or bad corrections occurred. As a reference, I also plot the corresponding baseline estimates of
Table 2 of the main text with blue dots and lines. They show that the findings are robust to all
these concerns.
Appendix B Pros and cons of the quasi-laboratory format
On top of logistical convenience and complying with the COVID pre-caution measures, the
quasi-laboratory format has an additional benefit over physical laboratory experiments in that
participants cannot see each other when they enter the laboratory which adds an additional layer
20of anonymity among participants. A drawback is that participants can potentially be distracted
while participating.
However, unlike standard online experiments such as on MTurk and Prolific where participants’
identity is fully anonymous by the platforms’ rule, we have participants’ personal information and
participants know it as we recruit them from our standard laboratory subject pool. Also, they
are connected to us via Zoom throughout the experiment. These mostly prevent participants’
attrition that can be endogenous to their decisions or treatments and the main problem of
online interactive experiments (Arechar, Gächter, and Molleman 2018) and experiments where
treatments affect the probability of attrition, e.g., experiments with intertemporal decision
making. In my experiment, we experienced no participant attrition. A drawback is that we
could not collect a large number of observations.
Another benefit of quasi-laboratory experiments over standard online experiments is that
we can screen participants based on their participation status in previous experiments. This
allows us to collect cleaner data; in particular, this allows us to screen out participants who have
participated in experiments with deception, which is another problem of online experiments
(Arechar, Gächter, and Molleman 2018).
There are already a few other studies that use a quasi-laboratory format, for example,
Goeschl, Oestreich, and Soldà (2021).
21You can also read