Evaluating the accuracy of gridded population estimates in slums: A case study in Nigeria and Kenya - Preprints.org
←
→
Page content transcription
If your browser does not render page correctly, please read the page content below
Preprints (www.preprints.org) | NOT PEER-REVIEWED | Posted: 23 February 2021 doi:10.20944/preprints202102.0521.v1

 Evaluating the accuracy of gridded population estimates in slums:
 A case study in Nigeria and Kenya
 Dana R. Thomson1*, Andrea E. Gaughan2, Forrest R. Stevens2, Gregory Yetman3, Peter Elias4, Robert
 Chen3
 1. Department of Social Statistics & Demography, University of Southampton, Southampton UK
 2. Department of Geography & Geosciences, University of Louisville, Louisville KY USA
 3. Center for International Earth Science Information Network (CIESIN), Columbia University,
 New York NY USA
 4. Department of Geography & Regional Planning, University of Lagos, Lagos Nigeria
 * Corresponding author: dana.r.thomson@gmail.com

 ABSTRACT

 Low- and middle-income country cities face unprecedented urbanization and growth in slums.
 Gridded population data in small grid squares (e.g., 100x100m) derived from demographic and
 spatial data are a promising source of current population estimates, but face limitations in slums due
 to the dynamic nature of this population as well as modelling assumptions. The efficacy of using
 gridded population data in slum areas remains a question mark especially in the context of UN SDG
 indicator development. In this study, we use field-referenced boundaries and population counts
 from Slum Dwellers International (SDI) in Lagos (Nigeria), Port Harcourt (Nigeria), and Nairobi
 (Kenya) to assess the accuracy of nine gridded population datasets in slums. We also use a modelled
 map of all slums in Lagos to assess use of gridded population dataset for SDG11.1.1 (percent of
 population living in deprived areas). We found that all gridded population estimates vastly under-
 estimated population counts in populous slums, and the calculation of SDG11.1.1 in Lagos was
 impossibly low; gridded population datasets estimated that just 1-3% of the Lagos population lived
 in slums, compared to 56% using the UN-Habitat approach. We outline specific steps that might be
 taken to improve each gridded population dataset in deprived urban areas. While gridded
 population estimates are not yet sufficiently accurate to estimate SDG11.1.1, we are optimistic that
 some datasets could be following updates to their modelling approaches.

 KEYWORDS

 SDG11, urban, deprivation, informal settlement, poverty, mapping

 Page 1 of 39

 © 2021 by the author(s). Distributed under a Creative Commons CC BY license.
Preprints (www.preprints.org) | NOT PEER-REVIEWED | Posted: 23 February 2021 doi:10.20944/preprints202102.0521.v1

 1. INTRODUCTION

 Over the next 30 years, 90% of global population growth is expected to take place in African and
 Asian cities alone, with a majority of those people added in slums, informal settlements, and other
 deprived urban areas [1]. While the rates of population growth in many low- and middle-income
 countries (LMICs) are similar to the rates of high-income countries (HIC) a century ago [2], the
 absolute numbers of people being added to LMIC cities today are unprecedented in human history
 [3]. Over the next decade, Kinshasa (D.R. Congo) is expected to add 757,000 people per year, Lagos
 (Nigeria) 623,000 per year, Cairo (Egypt) 462,000 per year, and Dar es Salaam (Tanzania) 409,000
 people per year [1]. Massive population inflows have left city institutions grappling to respond to
 housing, transportation, services, and basic environmental needs, with citizens living in increasingly
 unequal, dynamic, and precarious circumstances [3]. Major housing crises across LMIC cities have
 left millions of low-income people with no choice but to live in slums, informal tenancies, hostels, at
 their place of work (e.g., shop), or other short-term or non-traditional arrangement [4]. With limited
 updated information about how many people live where, local and national leaders are handicapped
 in their ability to monitor indicators such as local Sustainable Development Goals (SDGs), and
 respond effectively to compounding challenges [3].

 Rapid urbanization in LMIC cities means that traditional modes of population data collection such as
 government administrative records, censuses (conducted roughly every 10 years), and routine
 household surveys (conducted roughly every five years) are increasingly inaccurate, especially with
 respect to the urban poorest [5]. LMIC government data systems such as civil registrations and vital
 statistics have been consistently deprioritized over the last half century by governments and
 international donors which means that only a handful of LMICs today have a reasonably complete
 and updated count of births, deaths, and marriages, with the rural and urban poorest most likely to
 be unregistered [6]. In slums and informal settlements, censuses tend to either omit populations or
 count them in rural family homes [7], and one in ten LMICs has not held a census in the last 15 years
 [8]. These sources of population data can also be inherently political. In Nigeria, all modern censuses
 – 1962/3, 1973, 1991, and 2006 – have been contentious with accusations of undercounts of rural
 populations and women, and over-counts in the north of the country [9–11]. In Nairobi, Kibera slum
 is widely cited as among the most populous in the world [12], yet there is no agreement on how
 many people live there. Although Kibera’s population was estimated to be 200,000 in 2009 official
 and scientific sources [13,14], local and international advocacy groups estimated the population to
 be between 500,000 and 1 million people or more [12,15].

 In the absence of reliable administrative and census data, governments and donors have invested
 heavily in routine household surveys to generate official statistics. Surveys, however, are almost
 always sampled from the last census which means that informal and newly settled areas are likely to
 be under-represented, and survey field methods designed 40 years ago for majority rural settings
 tend to miss urban households living in short-term or atypical accommodation [5]. The dearth of
 data about the location and number of urban poorest in LMICs is of growing concern to
 governments, civil society, development organizations and others working to address housing crises,
 mitigate the effect of natural disasters, meet basic education and health needs, and ensure humane
 conditions for people to pursue a dignified existence [16].

 In the context of these data challenges, another potential source of population information is
 modelled gridded population datasets [17]. New technologies, data, and methods have enabled
 innovate approaches to estimate populations in LMICs. In the last 20 years, very high resolution
 satellite imagery and other Earth Observation data have become widely and freely available [18],
 massive increases in computing power now enable low-cost and free big data processing [19], and
 large-scale investments have been made into volunteered geographic data initiatives such as

 Page 2 of 39
Preprints (www.preprints.org) | NOT PEER-REVIEWED | Posted: 23 February 2021 doi:10.20944/preprints202102.0521.v1

 OpenStreetMap [20]. These technologies and datasets along with traditional population data
 sources, such as census, provide the building blocks to model population counts at fine geographic
 scale. Modeled gridded population datasets with estimates of residents in areas smaller than a city
 block have proven to be a flexible type of data because it can easily be aggregated into any larger
 geographic unit to provide policy relevant knowledge, for example, as denominators to estimate and
 improve vaccination campaign coverage [21], to identify and fill local gaps in maternal health
 services [22], to respond to and recover from disasters [23], or as a survey sample frame in the
 absence of up-to-date census data [24]. As data and technologies improve, so does the accuracy and
 detail of modelled gridded population datasets [25]. However, given that many gridded population
 datasets are derived from censuses, it is unclear if these gains apply equally to all sub-areas and sub-
 populations, particularly vulnerable and mobile populations living in slums and informal settlements.

 The aim of this paper is to assess the accuracy, strengths, and weaknesses of gridded population
 datasets in slums and informal settlements in LMIC cities. Two analyses were performed: (1)
 comparison of gridded population estimates in a selection of field-referenced slums for which
 population counts were reported by slum dwellers in Lagos (Nigeria), Port Harcourt (Nigeria), and
 Nairobi (Kenya) to understand accuracy of gridded population datasets in slums, and (2) comparison
 of total slum population in Lagos as calculated from gridded population datasets and a modelled
 surface of slum areas to understand usability of gridded population datasets to monitor SDG 11.1.1,
 the percent of population living in slums, informal settlements, and other deprived areas [26].

 2. METHODS

 2.1 Setting

 For this study, we selected three diverse cities with unique slum area characteristics: Lagos (Nigeria),
 Port Harcourt (Nigeria), and Nairobi (Kenya) (Figure 1). Lagos is the most populous city in Africa with
 14.3 million residents projected in 2020 and an annual population growth rate of 3.3% [27].
 Constrained by its location on the coast, the city footprint has expanded north, west, and east,
 subsuming formerly rural and peri-urban villages [28]. Millions of in-migrants from rural areas as well
 as newly incorporated residents have been forced into slums and slum-like conditions due to a
 decades-long housing crisis which has left a deficit of at least five million housing units in the city
 [28] and forced-up housing costs [29]. Slum clearance and relocation campaigns by authorities over
 the last two decades have attempted to move the poorest out of sight [28]. However, routine slum
 clearance along with rapid population growth has had the effect of fragmenting the urban poorest
 into many small “pocket slums” throughout the city [30]. Millions more seek residency on water in
 “floating slums” proximate to the city center in the Lagos Lagoon and surrounding marshlands [31].

 Port Harcourt, a secondary city braided by rivers that comprise the Niger Delta, has 3 million
 residents and an annual population growth rate of 5.1% [27]. Like Lagos, the city has expanded
 rapidly in recent decades, subsumed surrounding settlements, and tens of thousands of slum
 residents along the waterfront are displaced each year by government demolitions [32]. The slums in
 Port Harcourt, however, are more consolidated than in Lagos, and these areas have active and
 powerful gangs that both challenge authorities - in some cases halting evictions - but also harass and
 threaten residents [32].

 Nairobi, located in Kenya’s central plateau, is a city of 4.7 million people with an annual population
 growth rate of 3.9% [27]. Many of the city’s more than 100 slums are notoriously dense and
 sprawling [33]. Large deprived areas like Kibera are often thought of as a single slum by outsiders,
 but are considered to be multiple distinct, and contiguous, settlements by residents [34]. With so

 Page 3 of 39
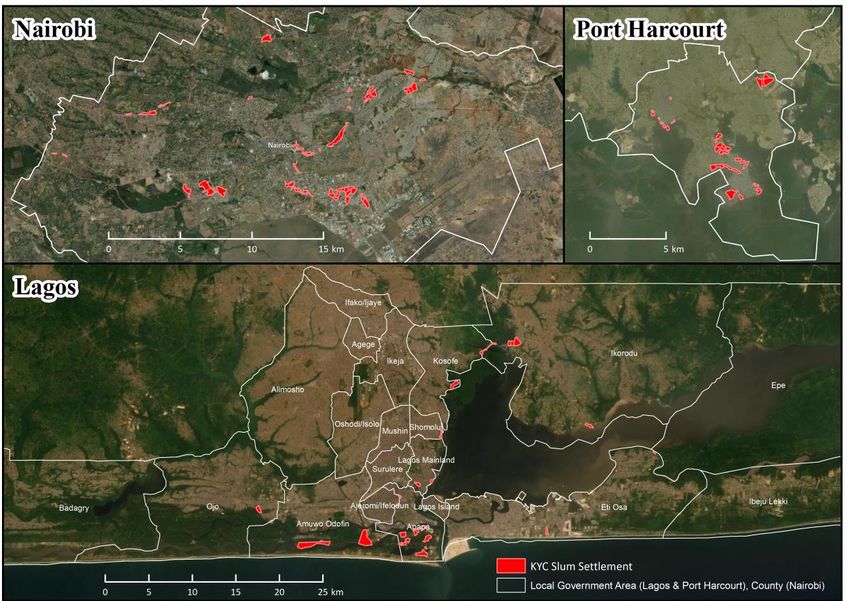
Preprints (www.preprints.org) | NOT PEER-REVIEWED | Posted: 23 February 2021 doi:10.20944/preprints202102.0521.v1

 many well-established and large slums, Nairobi has produced many strong and effective community-
 led initiatives that have succeeded at planning and implementing their own community upgrading
 initiatives, and worked effectively with local government on joint upgrading projects [35]. However,
 the relationships between slum communities and the local government remains fickle; in a push for
 citywide development and without a national land registry, the government commonly forcibly
 evicts residents to make way for roads and industry [36]. In May 2020, city officials made
 international headlines when they forcibly evicted between 5,000 and 8,000 residents with no
 support during Nairobi’s initial COVID-19 curfews and travel restrictions [37,38].

 Figure 1. Map of study cities

 2.2 Data

 Three types of data were used to address the two research objectives: boundaries and population
 counts of field-referenced slums in three cities (section 2.2.1), boundaries of all slum-like
 settlements in Lagos (section 2.2.2), and multiple gridded population datasets (section 2.2.3).

 2.2.1 Know Your City deprived area boundaries and population counts
 Boundaries and field-referenced population estimates in deprived areas were adapted from the
 Know Your City (KYC) Campaign website [39]. The website was launched in 2016 by Slum Dwellers
 International (SDI), a federation of hundreds of slum community advocacy groups across Africa and
 Asia, with support from the United Cities and Local Governments of Africa, Cities Alliance, and other
 partners [40]. At the time of this writing, more than 7,700 settlements in over 220 cities had been
 profiled. Each profile is created by community members themselves and includes a visual of the
 settlement boundary; a brief history; estimated population and structure counts; legal status of the
 settlement; a ranking of community-defined priorities; and summary statistics about sanitation,
 water, infrastructure, community leadership, healthcare, and commercial assets.

 Community profiling serves multiple purposes, foremost, as a vehicle for marginalized people in
 deprived settlements to self-organize and crystallize a community identity, self-worth, needs,
 priorities, and aspirations. The profiling activity, secondarily, results in quantitative and spatial data
 that can be used by community members to plan and upgrade their settlement, as well as to lobby
 civil society and local government for support toward their goals. The compilation of settlement

 Page 4 of 39

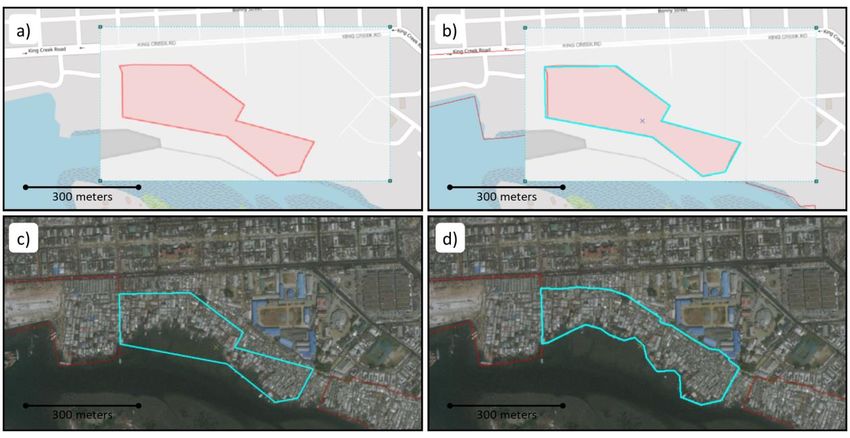
Preprints (www.preprints.org) | NOT PEER-REVIEWED | Posted: 23 February 2021 doi:10.20944/preprints202102.0521.v1

 profiles on the KYC Campaign website builds strength and awareness across communities within the
 SDI federation, while presenting a unified case for respect and investment from city, national, and
 global power-holders [40].

 Although the KYC Campaign website provides a trove of field-referenced data about the world’s
 most deprived communities, the data pose some challenges for research: (1) community profiles are
 presented separately, and cannot be accessed as a single database; (2) many profiles are
 incomplete; (3) community-generated geographic boundaries and population estimates have not
 been verified for accuracy; and (4) spatial boundaries are only visualized over a roads base layer, and
 are not directly downloadable. Settlement boundaries are mapped by collecting GPS coordinates
 around the settlement perimeter. Population estimates are generally derived by physically marking
 and counting all front doors in the settlement, sampling every nth household to estimate average
 household size, and then multiplying number of front doors by the average household size in the
 settlement; this estimated number is then discussed and agreed by consensus in an open
 community forum (personal communication, Andrew Maki, 9 November 2020).

 To prepare data for this analysis, each settlement boundary was retraced in ArcGIS 10.5 by taking
 screenshots from the KYC Campaign website, aligning it was OpenStreetMap roads, and manually
 adjusting boundaries over satellite imagery, sometimes introducing assumptions based on landscape
 patterns about community data collectors’ intended boundaries (Figure 2). The settlement name,
 date of profile creation, and reported population estimate, structure count, and area in acres were
 copied from KYC Campaign profiles into an excel table, and joined to settlement boundaries in
 ArcGIS based on a unique settlement ID created for this study. This resulted in 134 digitized slum
 settlements (32 Lagos, 39 Port Harcourt, 63 Nairobi) with field population estimates collected
 between 2013 and 2020 (Figure 3).

 Figure 2. Process to digitize Know Your City Campaign slum settlement boundaries
 Steps were: a) copy and situate the KYC screenshot in ArcGIS over the OpenStreetMap base layer, b) digitize the KYC
 boundary, c) switch the ArcGIS base layer to satellite imagery, and d) adjust KYC boundaries to match physical features and
 the boundaries of contiguous KYC settlements.

 Page 5 of 39
Preprints (www.preprints.org) | NOT PEER-REVIEWED | Posted: 23 February 2021 doi:10.20944/preprints202102.0521.v1

 Figure 3. Lagos Nigeria (n=32), Port Harcourt Nigeria (n=39), and Nairobi Kenya (n=63) slum settlements in KYC dataset

 2.2.2 Lagos slum map
 A modelled layer of slum settlement locations across Lagos State was obtained from Badmos and
 colleagues (2019) as a proxy for actual slum boundaries [41]. This modelled output was derived using
 logistic regression with a cellular automata-based SLEUTH model, and datasets derived from
 RapidEye and Sentinel-2 satellite imagery, a digital elevation and slope model, and Lagos State
 Government spatial data of water bodies, roads, and land use types [41]. The model was trained and
 validated on a dataset of 242 community locations ranked by neighborhood income level as defined
 by local experts, with 83% accuracy in slums and 79% overall accuracy [41]. The output roughly
 represents the year 2015 and classifies approximately 10x10 meter cells as either slum or non-slum
 (Figure 4). In ArcGIS 10.5, we aggregated this output to approximately 50x50 meter cells, and then
 reclassified non-slum cells surrounded on four sides by slum cells as “slum” so as to create
 contiguous slum areas. Only 24 of the 32 (75%) KYC Campaign slum boundaries in Lagos intersected
 the contiguous slum area defined from the Badmos data, suggesting that this map is a conservative
 representation of Lago’s slums.

 Figure 4. Lagos slum layer (printed with permission from Badmos and team (2019))
 Red = slum, grey = non-slum or unsettled

 Page 6 of 39
Preprints (www.preprints.org) | NOT PEER-REVIEWED | Posted: 23 February 2021 doi:10.20944/preprints202102.0521.v1

 2.2.3 Gridded population estimates
 Nine gridded population datasets in Nigeria and eight datasets in Kenya derived with diverse
 methods were available for analysis, including seven “top-down” and two “bottom-up” datasets
 (Table 1). Top-town gridded population models are based on population counts in census
 enumeration area (EA) or other geographic units that cover the entire population. Generally, top-
 down datasets are dasymetric, meaning that population disaggregation is informed by covariate
 datasets, and that estimates in grid cells sum to the population counts of input geographic units [42].
 Bottom-up models use micro-census counts of the population in a selection of small areas, or
 assumptions about household size, to estimate population in each grid cell directly [24]. Gridded
 population datasets can be further classified by the complexity of their modelling approach (e.g.,
 direct disaggregation versus statistical weighting), by whether the outputs are constrained to settled
 areas, and by the size of the grid cell in which population is estimated [25]. Figure 5 visually
 compares all nine datasets in a small area of Lagos along the lagoon where many informal
 settlements exist. Most of these datasets aim to represent the residential (night-time) population
 with the exception of LandScan, and most are openly available.

 The main un-modelled top-down gridded population dataset is Gridded Population of the World
 (GPW) by Columbia University’s Center for International Earth Science Information Network (CIESIN).
 The current version of this dataset, GPW4v.11, uses the most spatially-detailed, recent census data
 available, and produces estimates of the population in approximately 1x1 kilometer grid cells for 5-
 year increments including 2015 and 2020 [43,44]. The age and scale of the input census data varies
 substantially by country; Nigeria’s gridded estimates are derived from 2006 2nd-level administrative
 units (Local Government Areas – LGAs) while Kenya’s gridded estimates are derived from 2009 5th-
 level administrative units (sublocations) [45]. Only water bodies and protected areas (e.g., game
 parks) are excluded before population disaggregation. Two versions are available which do, and do
 not, adjust for UN population projections; we use the UN-adjusted version in this analysis. While
 GPWv4.11 is not expected to be highly accurate at the grid-cell level because populations are not
 evenly distributed in space, this dataset is useful for multi-country and global analyses, and the
 harmonized census boundaries and population counts behind this dataset serve as the population
 input to all other top-down gridded population datasets except LandScan and WPE (discussed
 below).

 Similarly, lightly modelled datasets disaggregate population counts equally among cells; however,
 disaggregation is constrained to populated places first, as defined by settlement extents or building
 footprints [46–49]. The Global Human Settlement Population Layer (GHS-POP) by the European
 Commission Joint Research Centre (EC-JRC) defines settlements coarsely from publicly available
 30x30 meter Landsat imagery, and produces population estimates in approximately 250x250 meter
 grid cells for 1975, 1990, 2000, and 2015 [46,47]. The High Resolution Settlement Layer (HRSL) by
 the Facebook Connectively Lab and CIESIN constrains population estimates to approximately 30x30
 meter grid cells that contained any building extracted from 0.5x0.5 meter Digital Global imagery for
 the year 2018 [48,49] (Table 1). Both of these data producers are currently working on updates
 based on more refined settlement layers.

 Highly modelled datasets are based on a statistical or geographic algorithm which varies population
 disaggregation based on the presence of human activity as measured with multiple spatial
 covariates. Top-down highly modelled gridded population datasets include LandScan Global
 estimates from the US Government Oak Ridge National Laboratory, World Population Estimates
 from ESRI, the producer of ArcGIS software, and WorldPop estimates from the WorldPop team at
 University of Southampton (Table 1).

 Page 7 of 39
Preprints (www.preprints.org) | NOT PEER-REVIEWED | Posted: 23 February 2021 doi:10.20944/preprints202102.0521.v1

 LandScan Global is an approximately 1x1 kilometer gridded population dataset representing
 ambient population, the 24-hour average of day-time commuter and night-time residential
 populations, and it is updated annually. The probability weights matrix created for population
 disaggregation is generated with co-kriging, a multivariable geographic model, using US Census
 global population estimates and four covariates: roads, slope, land cover, and night-time lights [50].
 To account for economic, physical, and cultural differences that affect the relationship between
 covariates and population density locally, LandScan Global analysts assign weights by location to
 manually adjust population disaggregation. Non-settled areas as defined by a land cover layer are
 set to zero, resulting in constrained estimates. LandScan Global is a commercial dataset that is made
 free to US Government agencies, humanitarian, and educational organizations [51].

 World Population Estimates (WPE) is another commercial dataset available to registered ArcGIS
 users, with gridded population estimates in 162x162 meter grid cells for 2016. Before disaggregating
 population estimates to grid cells, settled areas are identified from a land cover model called
 BaseVue 2013 which is based on 30x30 meter Landsat data. Cells classified as settled are then
 apportioned census population counts collated by ESRI using a geographic algorithm based on
 BaseVue 2013 land cover type, road intersection locations, and settlement point locations [52].

 WorldPop is an approximately 100x100 meter dataset of gridded population estimates derived with
 country-specific models using a Random Forest machine-learning approach, coupled with GPWv4.11
 census-derived inputs, and more than a dozen country-specific spatial covariates including land
 cover, roads, intersections, slope, night-time lights, temperature, and precipitation [53]. All
 WorldPop datasets - including its predecessors AfriPop, AsiaPop, and AmeriPop - were
 unconstrained [54], meaning that population estimates were made in all land areas with tiny
 fractions of a person predicted to live in deserts, forests, and other unsettled grid cells. In 2019,
 WorldPop created global datasets of unconstrained estimates for each year between 2000 and 2020
 which provided a data product with consistent covariates for all countries [55]. In 2020, WorldPop
 also released a single-year version of the global dataset in which population counts were constrained
 to settled areas. In most African countries, settlement boundaries were defined with the highly
 detailed Ecopia building footprints dataset [56], while the Built-Settlement Growth Model was used
 to constrain estimates in other countries [57]. Both of WorldPop’s constrained and unconstrained
 datasets are released with and without UN population adjustments. Only WorldPop’s UN-adjusted
 population estimates were considered for this analysis for both constrained and unconstrained
 datasets.

 Recently, the WorldPop team released an R algorithm and beta web-tool which can be considered
 an un-modelled bottom-up estimate of population. The peanutButter tool applies three parameters
 – average household size, average number of households per building, and percent of buildings that
 are residential – to the Ecopia building footprint layer to estimate total population counts in
 approximately 100x100 meter grid cells [58]. Ecopia building footprints were extracted from 2015
 through 2019 imagery, with most footprints representing 2018 buildings [58]. The tool provides
 default parameter values, which the user can modify. The WorldPop-Peanut Butter datasets
 downloaded for this analysis used default values in Nigeria (4.9 people per urban household, 1.1
 households per building, and 71% of buildings are residential) and Kenya (3.6 people per urban
 household, 1.1 households per building, and 63% of buildings are residential) [58].

 The Geo-Referenced Infrastructure and Demographic Data for Development (GRID3) project
 produces census-independent bottom-up population estimates in select countries while addressing
 barriers to government acceptance and use of gridded population data. The project is managed by
 CIESIN in close collaboration with WorldPop, Flowminder Foundation, and UN Population Fund
 (UNFPA), and has released approximately 100x100 meter gridded population estimates in five

 Page 8 of 39
Preprints (www.preprints.org) | NOT PEER-REVIEWED | Posted: 23 February 2021 doi:10.20944/preprints202102.0521.v1

 countries including Nigeria, but not Kenya [59]. GRID3 models are based on a sample of micro-
 census population counts in small areas (e.g., 3 hectares), as well as two covariates related to the
 settlement type and existing top-down population estimates. In Nigeria, most microcensus counts
 were collected in 2016, and WorldPop-unconstrained 100x100 meter estimates were used as the
 top-down population covariate. A hierarchical Bayesian model is then used to quantify a relationship
 between microcensus population densities and covariates, which the model uses to predict
 population density in each cell outside of the microcensus units [60]. Cells classified as unsettled in
 the settlement layer are set to zero, resulting in a constrained estimate of the population.

 The differing approaches to modelling results in varied outputs across the nine gridded population
 datasets, especially at a local level (Figure 5). Other gridded population datasets not evaluated here
 because they were unavailable to the study team or outdated, including the forthcoming “bottom-
 up” LandScan-HD dataset by Oak Ridge National Laboratory [61], History Database of the Global
 Environment (HYDE) population, and Global Rural Urban Mapping Project (GRUMP) [62].

 Dataset Producer Year Resolution Coverage Method Citation
 Top-down: Un-modelled: Unconstrained
 GPWv4.11 CIESIN, 2015, 30 arc sec Residential Equal allocation of population to [43,44]
 Columbia 2020 (~1km2) cells within census unit (areal
 University weighting on edge cells)
 Top-down: Lightly modelled: Constrained
 GHS-POP European 2015 9 arc sec Residential Binary dasymetric, proportional [46,47]
 Commission, (~250m2) allocation to built-up areas
 Joint Research extracted from 30m Landsat
 Centre (JRC) imagery
 HRSL Facebook 2018 1 arc sec Residential Binary dasymetric, proportional to [49]
 Connectivity (~30m2) houses/settlements extracted
 Lab and CIESIN from 0.5m Digital Globe imagery
 Top-down: Highly modelled: Unconstrained
 WorldPop- WorldPop, 2015, 3 arc sec Residential Random Forrest model with 24 [53,63]
 Unconstrained Univ. of 2018 (~100m2) covariates and dasymetric
 Southampton redistribution
 Top-down: Highly modelled: Constrained
 LandScan Oak Ridge 2015, 30 arc sec Ambient Multivariable dasymetric model [50,51]
 National 2018 (~1km2) (24-hour with 4 covariate types and
 Laboratory average) bespoke weight layer
 WPE ESRI 2016 162m Residential Dasymetric algorithm with 16 [52]
 inputs
 World-Pop- WorldPop, 2020 3 arc sec Residential Random Forrest model with 24 [64,65]
 Constrained Univ. of (~100m2) covariates and dasymetric
 Southampton redistribution constrained to cells
 with buildings in Africa and urban
 extents elsewhere
 Bottom-up: Un-modelled: Constrained
 WorldPop- WorldPop, ~2018 3 arc sec Residential Based on Ecopia building [58]
 PeanutButter Univ. of (~100m2) footprints, average household
 Southampton size, and 2 building parameters
 Bottom-up: Highly modelled: Constrained
 GRID3 CIESIN, 2016 3 arc sec Residential Hierarchical Bayesian model with [60,66]
 (Nigeria v1.2) WorldPop, (~100m2) 6 covariates and trained on a
 Flowminder, sample of 3-hectare microcensus
 UNFPA, DFID population counts
 Table 1. Summary of gridded population datasets evaluated

 Page 9 of 39
Preprints (www.preprints.org) | NOT PEER-REVIEWED | Posted: 23 February 2021 doi:10.20944/preprints202102.0521.v1

 Figure 5. Visual comparison of gridded population datasets in their native resolutions for an area along the Lagos Lagoon
 Dark orange = higher population density, white = zero population estimate

 Page 10 of 39
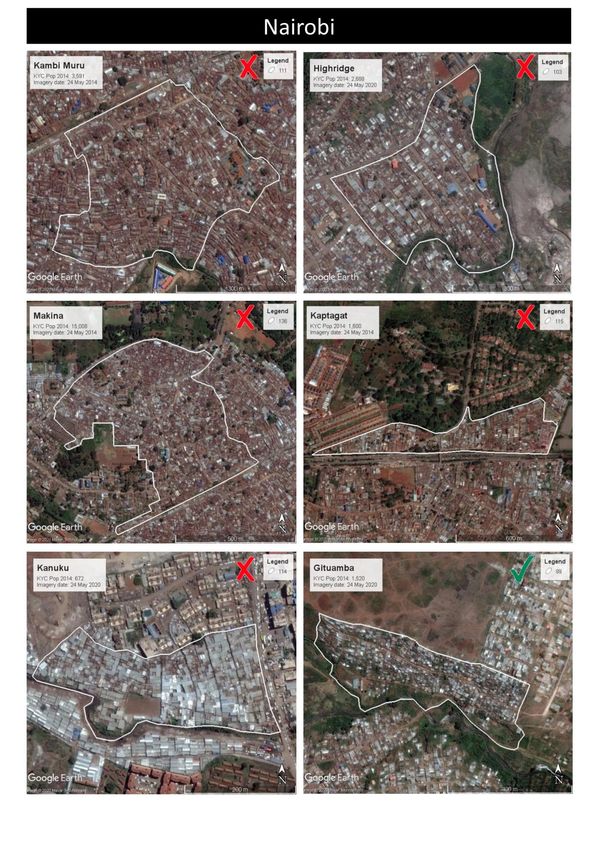
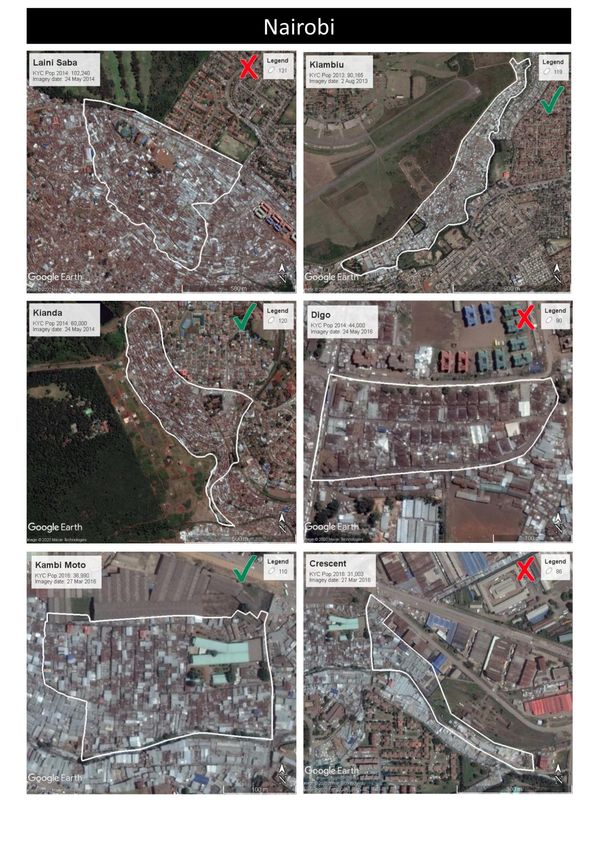
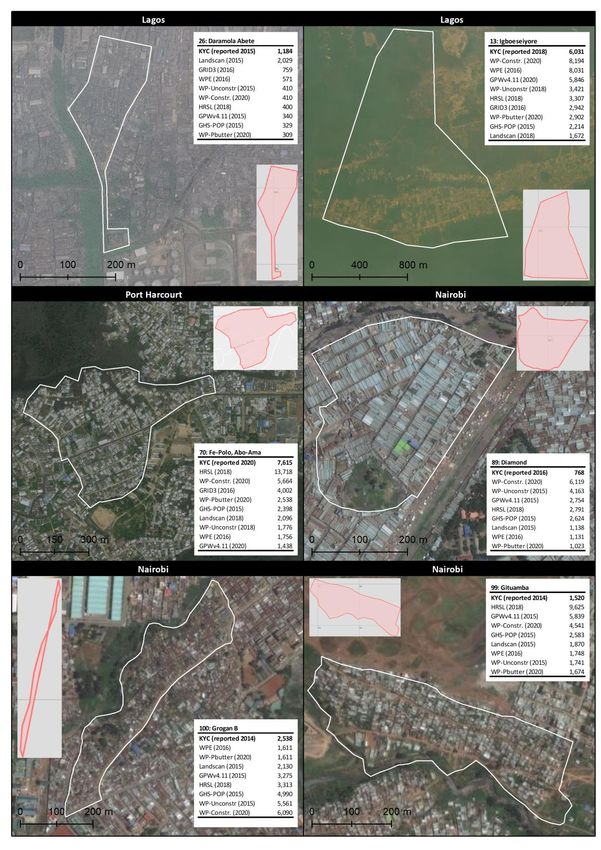
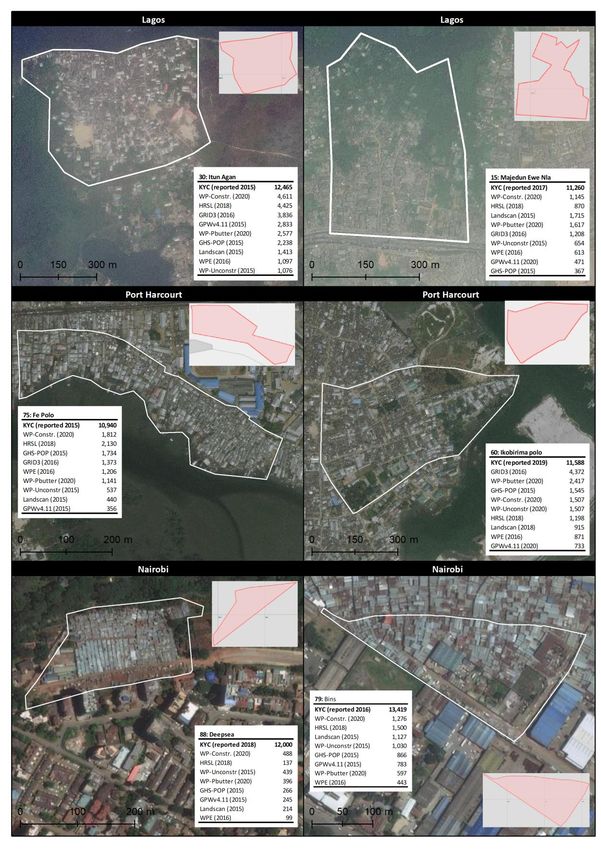
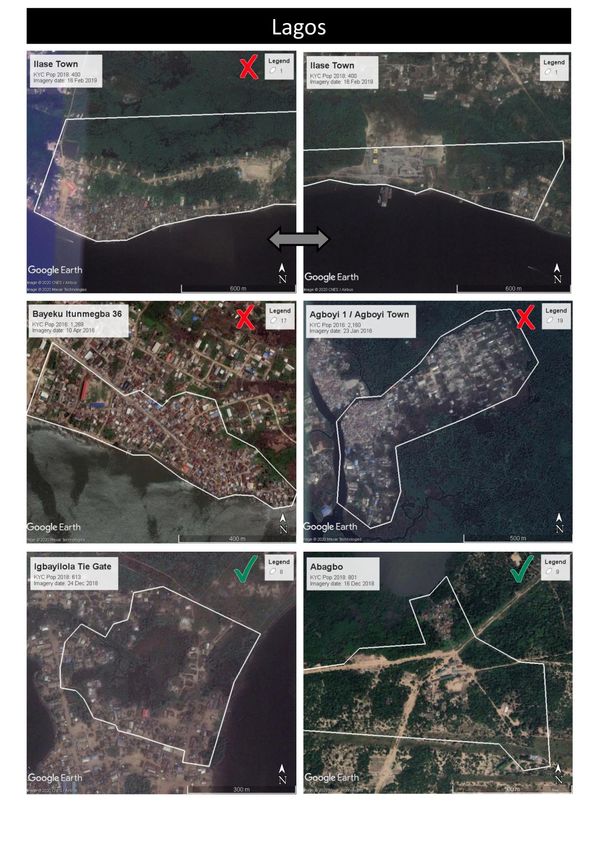
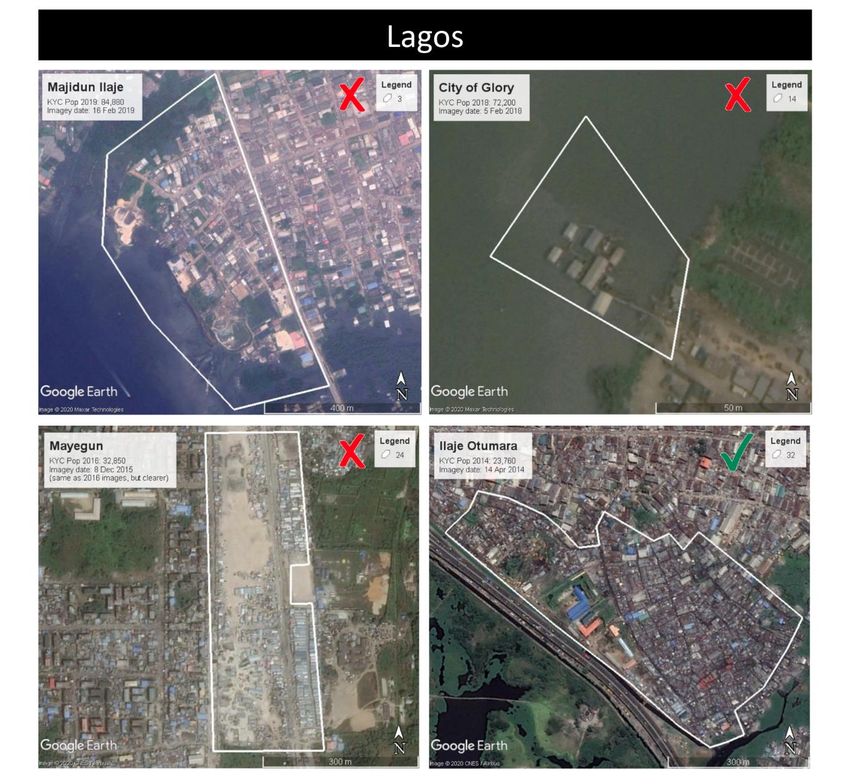
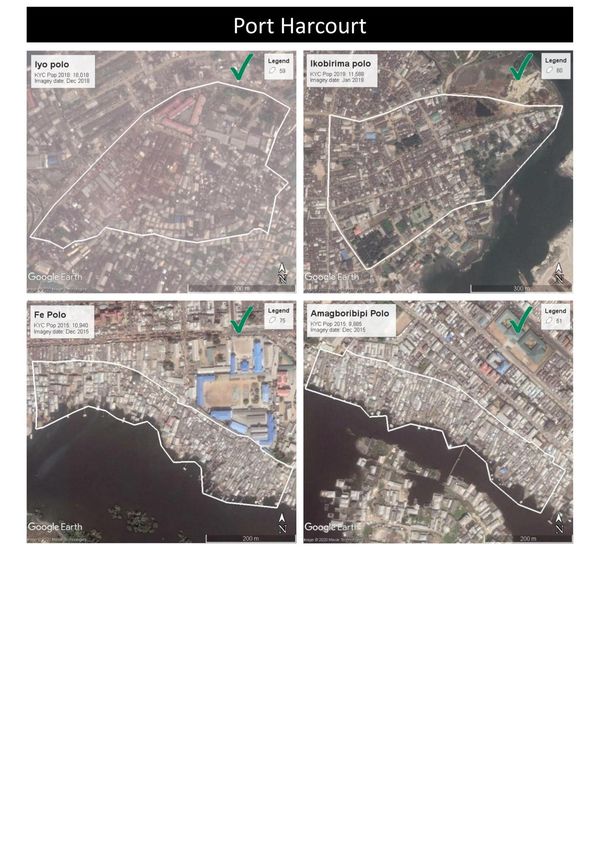
Preprints (www.preprints.org) | NOT PEER-REVIEWED | Posted: 23 February 2021 doi:10.20944/preprints202102.0521.v1

 2.3 Analysis 1: Comparison of gridded population estimates and KYC field reports

 Given the incongruent years of population estimates in the KYC Campaign dataset, as well as among
 gridded population estimates, we aligned data in two time periods: 2013 through 2016, and 2017
 through 2020. Each of the gridded population datasets were downloaded and projected to UTM 31
 in Lagos, UTM 32 in Port Harcourt, and UTM 37 in Kenya. This meant that we downloaded two
 estimates from GWPv4.11, WorldPop-Unconstrained, and LandScan Global which included estimates
 for multiple years. Gridded population estimates were then summed within each settlement
 boundary such that population values from partially covered grid cells were weighted by the fraction
 of area covered by the settlement. As a result, smaller settlements (e.g., settlement 20 in Figure 5)
 were only attributed a portion of a cell’s population from gridded population estimates that had a
 coarse spatial resolution (e.g., 1x1km). A comparison of the three gridded population datasets with
 multiple estimates showed substantial differences in population estimates over just a few years in
 study settlements, underscoring the importance of aligning years (Supplement, Figure S1).

 Data checks were then performed to gauge the quality of KYC Campaign data and our retraced
 settlement boundaries. Settlements with the largest reported populations by KYC were visualized
 over current and historical satellite imagery in Google Earth to evaluate whether the reported
 population estimate seemed plausible. We also checked settlements in which the median gridded
 population estimate was larger than KYC. Settlements judged to have questionable field-referenced
 population estimates were excluded from the analysis (documented in Supplement, Figure S2). In
 settlements for which KYC reported the settlement area, the KYC area and area of digitized
 boundaries were compared (Supplement, Table S1), and we spot checked our digitized boundaries
 that differed substantially from KYC reports. After all data checks, 118 settlements were retained for
 analysis (26 in Lagos, 39 in Port Harcourt, and 53 in Nairobi).

 Differences in KYC reported population and each gridded population estimate were then calculated.
 Only comparisons that fell within the same time period were evaluated. Visual comparisons were
 made using line graphs, and the following accuracy statistics: mean absolute error (MAE), root mean
 square error (RMSE), bias, and median fraction (MF) of the KYC population estimated by each
 gridded population dataset. MAE is a measure of overall precision, RMSE is a measure of overall
 error magnitude which penalizes large errors, and bias and MF indicate the degree of over/under
 estimation by gridded population datasets. These statistics are calculated as follows, where is the
 reported KYC population in settlement i, ̂ is the gridded population estimate in settlement i, and n
 is the count of settlements:

 ∑ =1| ̂ − | (1)
 =

 (2)
 ∑ ( ̂ − )2
 = √ =1

 ∑ =1 ̂ − (3)
 =

 ̂ (4)
 = ( )

 Page 11 of 39
Preprints (www.preprints.org) | NOT PEER-REVIEWED | Posted: 23 February 2021 doi:10.20944/preprints202102.0521.v1

 Finally, a descriptive comparison was made of the mean and maximum population densities per
 200x200 meter area (roughly the average area of KYC slum settlements assessed across the three
 cities). We found KYC population densities by calculating the mean population density per square
 meter in each settlement, then multiplied by 40,000. To calculate population densities for each
 gridded population dataset, we created a 200x200 meter grid over each city, selected only those grid
 cells located entirely within the city boundary, and then summed the gridded population estimate
 within each 200x200 meter unit, applying areal weighting.

 2.4 Analysis 2: Comparison of gridded population estimates for total slum population in Lagos

 In the second analysis, we used the modelled slum/non-slum boundaries in Lagos State derived from
 Badmos and team [41] to calculate the percent of population living in slums according to each
 gridded population dataset. As in Section 2.3, modelled slum boundaries that only partially covered
 a gridded population cell were weighted on the fraction of area covered. For GPWv4.11, WorldPop-
 Unconstrained, and LandScan, only the 2015 estimates were evaluated.

 Although we had no “true” slum population measurement for comparison in this analysis, we used
 the 2018 Nigeria Demographic and Health Survey (DHS) [67] as a reference by calculating the
 percent of households considered to be “slum households” according to UN-Habitat [68]. According
 to UN-Habitat, a “slum household” lacks any of the following: adequate water, adequate sanitation,
 durable floors (and walls and roof), or less than four people per sleeping room; and this definition is
 used widely to estimate SDG 11.1.1 and other slum indicators [3]. Note that durable wall and roof
 materials are not collected in all DHS surveys, so durable floor material alone tends to be used as a
 proxy (e.g., [69]). Furthermore, the UN-Habitat definition defines households without secure tenure
 to be “slum households”, but tenure status is rarely measured in censuses or surveys, and thus this
 part of the definition is omitted in practice [e.g., [70]). To identify Nigeria DHS households in Lagos
 State, we subset all Lagos households as defined in the survey, calculated whether each household
 was considered a “slum household”, and summarized household slum status across Lagos by
 applying household sampling weights. All analyses were performed in R 3.6.0.

 3. RESULTS

 Across all three cities and both time periods, gridded population datasets tended to vastly
 underestimate the total population in populous settlements relative to KYC reported population
 counts (Figure 6). No particular gridded population dataset stands out as consistently producing
 more accurate estimates than the rest. HRSL estimates in Port Harcourt were consistently closer to
 the reported KYC population than other datasets, LandScan had the largest estimate for the largest
 reported slum settlement in Lagos; and GHS-POP and WorldPop-Unconstrained had the largest
 estimates for Nairobi’s most populous reported slum settlement, though all were still substantially
 underestimated (Figure 6). In a handful of settlements, gridded population estimates were
 substantially larger than the reported KYC population (e.g., GPWv4.11 in one Lagos and one Nairobi
 settlement, and HRSL in one Port Harcourt settlement), though no clear pattern in overestimates
 emerged (Figure 6).

 Page 12 of 39
Preprints (www.preprints.org) | NOT PEER-REVIEWED | Posted: 23 February 2021 doi:10.20944/preprints202102.0521.v1

 Figure 6. KYC reported population versus gridded population estimates for 134 slum settlements, collectively, across Lagos
 (Nigeria), Port Harcourt (Nigeria), and Nairobi (Kenya) over two time periods

 Table 2 presents the overall MAE, RMSE, Bias, and MF for each dataset in the 134 slum settlements,
 and datasets are ordered from most-to-least accurate. More accurate datasets included HRSL
 (MAE:3,265; RMSE:4,958), WorldPop-Constrained (MAE:3,491; RMSE:5,001), GRID3 (MAE:3,366;
 RMSE:5,296), and WorldPop-Peanut Butter (MAE:3,586; RMSE:5,073) (Table 2). The remaining
 datasets were nearly twice as inaccurate in slum settlements across the three study cities, including
 WorldPop-Unconstrained (MAE:6,048; RMSE:10,889), GPWv4.11 (MAE:6,189; RMSE:10,889),
 LandScan (MAE:6,087; RMSE:12,121), GHS-POP (MAE:7,079; RMSE:12,854), and WPE (MAE:7,653;
 RMSE:14,422) (Table 2). All datasets were severely biased, underestimating thousands of people per
 settlement on average (Table 2). The best performing dataset, HRSL, only estimated 39% of the KYC
 field-referenced population, on average (Table 2).

 Page 13 of 39
Preprints (www.preprints.org) | NOT PEER-REVIEWED | Posted: 23 February 2021 doi:10.20944/preprints202102.0521.v1

 Dataset MAE RMSE Bias MF Dataset characteristics
 Top-down
 HRSL 3,265 4,958 -2,853 0.39 2018 Constr. ~30x30m
 Lightly modelled
 WorldPop Top-down
 3,491 5,001 -2,942 0.27 2020 Constr. ~100x100m
 Constrained Highly modelled
 GRID3 Bottom-up
 3,366 5,296 -3,366 0.21 2016 Constr. ~100x100m
 (Nigeria only) Highly modelled
 WorldPop Bottom-up
 3,586 5,073 -3,571 0.21 2020 Constr. ~100x100m
 PeanutButter Un-modelled
 WorldPop 2015, Top-down
 6,048 10,889 -5,899 0.11 Unconstr. ~100x100m
 Unconstrained 2018 Highly modelled
 2015, Top-down
 GPW4v.11 6,189 11,482 -5,892 0.12 Unconstr. ~1x1 km
 2020 Un-modelled
 2015, Top-down
 LandScan 6,087 12,121 -6,032 0.12 Constr. ~1x1 km
 2018 Highly modelled
 Top-down
 GHS-POP 7,079 12,854 -7,000 0.15 2015 Constr. ~250x250m
 Lightly modelled
 Top-down
 WPE 7,653 14,422 -7,638 0.09 2016 Constr. 162x162m
 Highly modelled
 Table 2. Error in nine gridded population datasets in Lagos, Port Harcourt, and Nairobi slum settlements

 Several gridded population datasets were likely to underperform in high-density slum settlements
 due to the use of average population densities in input units which limits the highest density value
 that can be assigned to a cell (e.g., GPWv4.11, GHS-POP, WorldPop, WPE). To explore this further,
 Table 3 summarizes citywide gridded population estimates in 200x200 meter grid cells, as well as
 average reported KYC population density per 200x200 meter area. The maximum reported KYC
 population density in Lagos (12,123), Port Harcourt (13,885), and Nairobi (34,760) were well above
 the maximum citywide 200x200 meter estimate of any gridded population dataset (Table 3).
 LandScan, HRSL, WorldPop-Constrained, and GWPv4.11 produced the largest estimate in Lagos with
 between 4,709 and 5,007 people per 200x200 meter area (Table 3). The only gridded population
 dataset to produce a similar population density in Port Harcourt was HRSL (4,175), and all other
 datasets produced an estimate no larger than 1,262 people per 200x200 meter area in Port Harcourt
 (Table 3). Similarly, in Nairobi HRSL produced the largest estimate (14,771), and all other maximum
 population estimates fell below 9,520 people per 200x200 meter area. In the discussion, we deduce
 potential reasons for these underestimates and offer suggestions that might improve gridded
 population estimates in slum areas.

 Page 14 of 39
Preprints (www.preprints.org) | NOT PEER-REVIEWED | Posted: 23 February 2021 doi:10.20944/preprints202102.0521.v1

 Lagos Port Harcourt Nairobi
 Mean Max Mean Max Mean Max
 Slum settlements
 n reported 26 39 53
 Pop. per 200x200m 1,840 12,123 4,232 13,885 9,670 34,760
 Citywide 200x200m grid cells
 n units 88,590 8,803 17,222
 HRSL (2018) 128 4,874 88 4,175 309 14,771
 WP-Constr (2020) 120 4,983 84 1,220 258 8,905
 WP-Unconstr (2018) 110 4,435 60 656 239 9,519
 GHS-POP (2015) 123 3,035 143 1,262 224 9,403
 WP-Unconstr (2015) 102 3,974 55 582 219 9,088
 GPWv4.11 (2020) 128 4,874 44 226 281 6,632
 GPWv4.11 (2015) 117 3,537 38 199 242 5,718
 LandScan (2015) 178 5,007 71 1,165 198 2,782
 LandScan (2018) 177 4,709 75 1,230 209 1,846
 WPE (2016) 119 2,619 134 815 216 1,311
 WP-PeanutB (2020) 58 1,424 48 992 75 866
 GRID3 (2016) 80 3,685 55 1,128 NA NA
 Table 3. Population densities in 200x200m areas in the study slum settlements and citywide in Lagos (Nigeria), Port
 Harcourt (Nigeria), and Nairobi (Kenya)

 In the second analysis in which we calculated the total slum population in Lagos from a modelled
 slum layer, underestimates in each of the gridded population datasets for slum settlements
 compounded to produce extremely low overall estimates of the population living in slums (1.02% -
 2.96% of the overall population) (Table 4). For reference, the survey-based UN-Habitat method for
 estimating slum populations puts 56.0% of the Lagos population living in slum-like conditions (Table
 4). Some of this underestimation might be attributed to a modelled slum map that did not include all
 slum areas in Lagos (e.g., omission of small “pocket” slums). The two gridded population estimates
 that produced the largest percentage of slum population (GRID3: 2.96% and WP-Peanut Butter:
 2.91%) were both “bottom-up” estimates that vastly underestimated the overall population of Lagos
 State compared to census-based “top-down” gridded population estimates, which might explain the
 larger percentages (Table 4). On a whole, it is clear that all gridded population datasets vastly
 underestimate population counts in slum areas in Lagos.

 Page 15 of 39
Preprints (www.preprints.org) | NOT PEER-REVIEWED | Posted: 23 February 2021 doi:10.20944/preprints202102.0521.v1

 Dataset Slum Pop. Total Pop. Dataset characteristics
 n % N
 GRID3 293,858 2.96 9,929,140 2016 Bottom-up Highly Constrained ~100x100m
 modelled
 WorldPop 211,236 2.91 7,257,126 2020 Bottom-up Un- Constrained ~100x100m
 PeanutButter modelled
 LandScan 336,288 1.76 19,108,756 2018 Top-down Highly Constrained ~1x1 km
 modelled
 WorldPop 229,446 1.73 13,254,820 2020 Top-down Highly Constrained ~100x100m
 Constrained modelled
 HRSL 233,618 1.66 14,040,751 2018 Top-down Lightly Constrained ~30x30m
 modelled
 WPE 181,326 1.65 11,021,596 2016 Top-down Highly Constrained 162x162m
 modelled
 GHS-POP 150,059 1.34 11,168,526 2015 Top-down Lightly Constrained ~250x250m
 modelled
 WorldPop 161,865 1.34 12,104,264 2018 Top-down Highly Unconstrained ~100x100m
 Unconstrained modelled
 GPW4v.11 154,742 1.02 15,184,176 2020 Top-down Un- Unconstrained ~1x1 km
 modelled
 UN-Habitat -- 56.0 2018 Calculated from 2018 Nigeria DHS [71] using the UN-
 Habitat “slum household” approach [68]
 Table 4. Count and percent of the Lagos population living in slum settlements as estimated by gridded population datasets

 4. DISCUSSION

 Gridded population data are increasingly used to make consistent comparisons of population and
 demographic data across settings, especially in LMICs where lack of timely, accurate census data is a
 challenge. In this study, we compare nine multi-country gridded population datasets to KYC
 Campaign population estimates reported by slum community profiling teams (Section 2.3) and to a
 survey-based estimate of the percent of population living in slums in Lagos (Section 2.4). We found
 that all of the gridded population datasets evaluated in this analysis severely underestimated
 population counts in slums and informal settlements across three diverse African cities.
 Underestimates were particularly severe in the most populous - and often densest - slums which
 might indicate wider accuracy problems for gridded population datasets in other high-density areas
 (e.g., areas with multi-story apartment buildings). The analysis in section 2.4 highlighted sharp
 discrepancies between gridded population estimates in slum-like areas compared with the 2018
 Nigerian Demographic and Health Survey “slum household” measure; gridded population estimates
 of people living in slums were impossibly low in Lagos. A study of WorldPop-Unconstrained accuracy
 against field-referenced population counts in São Paulo, Brazil similarly found under-estimates in
 slums but to a lesser degree, underestimating the total slum population in that city by 6% [72]. More
 studies are needed to assess the accuracy of gridded population at fine geographic scale, particularly
 in deprived urban areas. In the meantime, gridded population data should be used with caution to
 calculate urban poverty indicators such as SDG 11.1.1. In this section, we discuss potential sources of
 underestimation in each of the gridded population datasets, and offer suggestions that might
 improve their accuracy.

 A challenge that all gridded population datasets face, regardless of method, inputs, or output
 resolution, is that there are currently no global datasets that classify heterogeneous urban areas by
 settlement type (e.g., slum/non-slum) [16]. If (or when) such a dataset becomes available, producers
 of gridded population datasets would have the option of tailoring their methods and inputs in sub-
 sections of cities to reflect what are often very different patterns in building and population density.

 Page 16 of 39
Preprints (www.preprints.org) | NOT PEER-REVIEWED | Posted: 23 February 2021 doi:10.20944/preprints202102.0521.v1

 Until then, however, there are several other potential steps that gridded population producers might
 take to improve the accuracy of their datasets in LMIC city slums.

 4.1 Un-modelled and lightly modelled gridded population datasets

 The key strength of un-modelled and lightly modelled gridded population datasets is that their
 methods are relatively easy to implement, and gridded population outputs are transparent to
 communicate and understand.

 4.1.1 GPWv4.11
 Given that GPWv4.11 is an un-modelled dataset with equal distribution of population across input
 units, we cannot suggest any methods to improve its accuracy aside from continuing to pursue
 access to more detailed and updated census data from national census agencies. This dataset is not
 designed to be accurate at fine geographic scales, and thus is not recommended for estimating
 populations in slums and informal settlements.

 4.1.2 WorldPop-Peanut Butter
 Likewise, the WorldPop-Peanut Butter datasets is not derived from a model, and it only has a few
 parameters. One challenge is that slum and non-slum households vary in terms of average
 household size, average number of households per building, and percent of buildings that are
 residential [73,74]. If city-, district-, or urban-wide average values are used to create this dataset, it is
 no surprise that within household crowding and high-density buildings would be masked and
 underestimated in slums. Another challenge is the building footprints themselves. Contiguous
 rooftops are sometimes identified as a single building in feature extraction algorithms [75]. Many of
 the slum settlements in this study were characterized by high-density and contiguous buildings,
 especially Nairobi where buildings containing multiple one-room dwellings are common [76] (Figure
 7). A likely challenge was that too few buildings were detected in slums which limited the population
 allocated to slums. Building feature extraction algorithms might require further development to
 improve accuracy of building density maps in slums. If, or when, routine maps of deprived urban
 area boundaries become available, then the WP-Peanut Butter tool could enable urban slum- and
 non-slum-specific parameters to improve gridded population estimates in slum areas.

 4.1.3 GHS-POP
 GHS-POP uniformly distributes population within built-up areas of input units defined by their GHS-
 BUILT dataset. While the current GHS-BUILT layer is based on older freely available 30x30 meter
 Landsat imagery, new free building footprint layers such as Ecopia are becoming available. In the
 near future, the producers of GHS-BUILT might refine the definition of built area boundaries with
 new building footprint data, though like GPWv4.11, this dataset is not designed for fine-scale
 accuracy at the grid cell-level, and is not recommended for estimating slum populations.

 4.1.4 HRSL
 The HRSL dataset was more accurate in many settlements compared to the other gridded population
 datasets likely because it allocates population to smaller grid cells, preventing population from being
 spread across unsettled parks, yards, roads, and other areas without buildings. The underestimation
 of population in slums by HRSL, however, was still substantial because population was spread evenly
 across 30x30 meter cells containing buildings. In the future, producers of this dataset might consider
 a highly modelled approach, using covariates and a statistical or geographic model, to more
 accurately allocate population with varying density to cells.

 Page 17 of 39
Preprints (www.preprints.org) | NOT PEER-REVIEWED | Posted: 23 February 2021 doi:10.20944/preprints202102.0521.v1

 4.2 Highly modelled gridded population datasets

 Highly modelled gridded population datasets use statistical or geographic models with multiple
 covariates to vary the disaggregation (“top-down”) or aggregation (“bottom-up”) of population
 counts. The complex methods and multiple input datasets in these datasets provide several
 opportunities to tweak and improve local accuracy of estimates.

 4.2.1 Cross-cutting: fine-scale urban covariates
 A challenge faced by all producers of highly modelled gridded population estimates (i.e., WorldPop,
 LandScan, WPE, and GRID3) is lack of availability of spatially detailed datasets that correlate with the
 variation of population density across small areas within cities. While covariates such as roads,
 elevation, slope, and nighttime lights broadly correlate with the presence or absence of people [77],
 none of these datasets are especially informative about the location of, for example, high-density
 slum neighborhoods versus less-dense middle-class neighborhoods. Arguably night-time lights could
 differentiate areas by population density and/or wealth status, but the resolution of this dataset is
 approximately 1x1km [78,79], which might perform well in LandScan models (~1x1km resolution),
 but leads to a “halo” effect with population allocated near, and not within, high density areas in
 finer-scale WPE (162x162m), WorldPop (~100x100m), and GRID3 (~100x100m) estimates. One might
 imagine use of OpenStreetMap, an ever improving reservoir of open data on building footprints,
 points of interest, multiple types of roads, and many other characteristics, to be a good source of
 high-resolution covariate data; however, OpenStreetMap still remains incomplete in many LMIC
 cities and towns around the world [80], reducing the statistical power and even increasing noise in
 models. For this reason, LandScan and WPE rely on government or propriety data for these
 covariates, and WorldPop uses a limited number of covariates from OpenStreetMap with better
 coverage (e.g., roads, and not building footprints).

 The new Ecopia building footprint layer for Africa [56] or Bing building footprints for Tanzania and
 Uganda [81] are among the first multi-country fine-scale, complete datasets available that are likely
 to correlate with population density at fine scale. While Ecopia building footprint layers are normally
 a paid commercial product for three years before becoming freely available, the Africa building
 footprints were made available to all Bill and Melinda Gates Foundation (BMGF) funded projects,
 and then released publicly during the COVID-19 pandemic to support response [56]. As additional
 Ecopia building footprint datasets become available, the WorldPop team (partially funded by BMGF)
 will publish derived building metrics in approximately 100x100 meter cells including number of
 buildings, total area covered by buildings, average size of buildings, and more [82]. All of the highly
 modelled population producers would likely improve the accuracy of their output in cities, especially
 in slums and informal settlements, if covariates derived from a complete and accurate building
 footprints layer were incorporated. These covariates might include information about the buildings
 within a given cell (e.g., average size of buildings), as well as building characteristics in surrounding
 cells reflecting the area environment (e.g., average size of buildings in a 300 meter buffer around the
 cell). For those gridded population dataset producers with access to raw building footprints, they
 might consider either disaggregating directly to building footprints, and/or further processing the
 building footprints to classify non-residential buildings such as airport, government, university, or
 industrial buildings to prevent population being allocated to non-residential buildings [5].

 4.2.2 WorldPop-Unconstrained
 While WorldPop-Unconstrained data producers have demonstrated that their modelling approach is
 more accurate than some other gridded population methods, their model training and accuracy
 assessments are performed at a much more aggregated scale (e.g., census EA) than the output cells
 (~100x100m) [53]. In the WorldPop workflow, accuracy assessments are performed within the
 Random Forest model by retaining some of the input population data for validation, while the rest of

 Page 18 of 39
Preprints (www.preprints.org) | NOT PEER-REVIEWED | Posted: 23 February 2021 doi:10.20944/preprints202102.0521.v1

 the population data are used to train the model. The input data are typically census population
 counts in EAs, wards, or sub-districts, adjusted by UN population growth rates, and thus cannot
 estimate accuracy within the model at finer geographic scales [53]. Furthermore, because the input
 population data are aggregated, the average population density for each input unit can mask
 enormous spatial variability in population density at the scale of output grid cells. The Random
 Forest model is only able to allocate population density values to cells which appear in the training
 dataset, and will thus always underperform in the densest cells when training data are highly
 aggregated. This problem is highlighted in both Table 3 from Analysis 1, and in Supplement Figures
 4a and 4b, showing maximum WorldPop-Unconstrained population estimates well below KYC
 reported populations.

 One way to address both of these challenges is to incorporate smaller, high-density slum
 settlements into the model training and validation datasets. Slum population counts might come
 from the KYC Campaign website [39], or other sources such as government slum censuses [73]. The
 additional slum training data might overlap with the census data, or be located in cities outside the
 country which share characteristics with cities in the country of interest [53]. However, in the case of
 incomplete slum datasets, such as KYC Campaign, consideration should be given to how to choose
 (sample) a representative set of slums, as spatial correlation within the training dataset can increase
 variance in model residuals [83]. With finer-scale, high-density training data, the model will be able
 to allocate larger population values to 100x100 meter grid cells, and the finer-scale input data will
 result in finer-scale accuracy statistics during the modelling process. However, to explicitly assess
 cell-level accuracy, additional datasets with population counts in small areas should be used after
 modelling, for example, population enumerations taken as part of routine household surveys [24].
 Simulated household-level datasets geo-located in a real-world setting provide another approach to
 evaluate the general accuracy of a modelling approach [84].

 It may seem logical that a source of error in WorldPop-Unconstrained datasets is that population
 which should be allocated to settled cells is misallocated to unsettled cells, thus reducing population
 estimates in settlements. While this does occur, the magnitude of the problem is minimal. In an
 analysis of the WorldPop-Unconstrained model in Khomas Namibia, a region characterized by vast
 unsettled areas and the capital city of Windhoek, more than 99% of the population was allocated to
 cells within 300 meters of populated places [84]. The reason for misallocation to cells just beyond
 populated places was likely a consequence of the “halo” effect due to coarse covariate data (e.g.,
 1x1km resolution night time lights), rather than misallocation to unsettled cells.

 4.2.3 WorldPop-Constrained
 Despite the limited effect of misallocation of population to unsettled cells in the WorldPop-
 Unconstrained dataset, the WorldPop-Constrained dataset overcomes this potential challenge. In
 this analysis, WorldPop-Constrained estimates were more accurate of slum populations across the
 three cities than WorldPop-Unconstrained estimates because the input population densities were
 calculated from smaller constrained areas.

 Page 19 of 39
You can also read


