Broadband albedo of Arctic sea ice from MERIS optical data
←
→
Page content transcription
If your browser does not render page correctly, please read the page content below
The Cryosphere, 14, 165–182, 2020
https://doi.org/10.5194/tc-14-165-2020
© Author(s) 2020. This work is distributed under
the Creative Commons Attribution 4.0 License.

Broadband albedo of Arctic sea ice from MERIS optical data
Christine Pohl1 , Larysa Istomina1 , Steffen Tietsche2 , Evelyn Jäkel3 , Johannes Stapf3 , Gunnar Spreen1 , and
Georg Heygster1
1 Instituteof Environmental Physics, University of Bremen, Otto-Hahn-Allee 1, 28359 Bremen, Germany
2 European  Centre for Medium-Range Weather Forecasts, Shinfield Park, Reading, RG2 9AX, UK
3 Leipzig Institute for Meteorology, University of Leipzig, Stephanstr. 3, 04103 Leipzig, Germany

Correspondence: Christine Pohl (cpohl@iup.physik.uni-bremen.de)

Received: 26 March 2019 – Discussion started: 22 May 2019
Revised: 14 November 2019 – Accepted: 2 December 2019 – Published: 22 January 2020

Abstract. Arctic summer sea ice experiences rapid changes       scales and in temporal patterns. However, consistency in
in its sea-ice concentration, surface albedo, and the melt      point-to-point comparison is rather poor, with differences up
pond fraction. This affects the energy balance of the re-       to 0.20, correlations between 0.69 and 0.79, and RMSDs
gion and demands an accurate knowledge of those surface         in excess of 0.10. Differences in sea-ice concentration and
characteristics in climate models. In this paper, the broad-    cloud-masking uncertainties play a role, but most discrepan-
band albedo (300–3000 nm) of Arctic sea ice is derived from     cies can be attributed to climatological sea-ice albedo values
MEdium Resolution Imaging Spectrometer (MERIS) optical          used in ERA5. They are not adequate and need revising, in
swath data by transforming the spectral albedo as an out-       order to better simulate surface heat fluxes in the Arctic. The
put from the Melt Pond Detector (MPD) algorithm with a          advantage of the resulting broadband albedo data set from
newly developed spectral-to-broadband conversion (STBC).        MERIS over other published data sets is the accompanied
The new STBC replaces the previously applied spectral aver-     data set of available melt pond fraction. Melt ponds are the
aging method to provide a more accurate broadband albedo        main reason for the sea-ice albedo change in summer but are
product, which approaches the accuracy of 0.02–0.05 re-         currently not represented in climate models and atmospheric
quired in climate simulations and allows a direct comparison    reanalysis. Additional information about melt evolution, to-
to broadband albedo values from climate models. The STBC        gether with accurate albedo retrievals, can aid the challeng-
is derived empirically from spectral and broadband albedo       ing representation of sea-ice optical properties in those mod-
measurements over landfast ice. It is validated on a variety    els in summer.
of simultaneous spectral and broadband field measurements
over Arctic sea ice, is compared to existing conversion tech-
niques, and performs better than the currently published al-
gorithms. The root-mean-square deviation (RMSD) between         1   Introduction
broadband albedo that was measured and converted by the
STBC is 0.02. Other conversion techniques, the spectral av-     Broadband albedo of sea ice, including snow-covered sea ice,
eraging method and the linear combination of albedo val-        is a key parameter in Arctic climate studies. It is defined as
ues from four MERIS channels, result in higher RMSDs of         the ratio of reflected to incident irradiance in the waveband
0.09 and 0.05, respectively. The improved MERIS-derived         200–5000 nm (Pedersen and Winther, 2005; Wendisch and
broadband albedo values are validated with airborne mea-        Yang, 2012). The broadband albedo of sea ice determines
surements. Results show a smaller RMSD of 0.04 for land-        the energy budget of the surface and controls the heat and
fast ice than the RMSD of 0.07 for drifting ice. The MERIS-     mass balance of sea-ice cover (Perovich, 1994). Even small
derived broadband albedo is compared to broadband albedo        changes in the broadband albedo at the surface can strongly
from ERA5 reanalysis to examine the albedo parameteriza-        influence the Arctic climate via the albedo feedback mech-
tion used in ERA5. Both albedo products agree over large        anism. As broadband albedo of sea ice decreases, more ra-
                                                                diation is absorbed at the surface, resulting in an increase in

Published by Copernicus Publications on behalf of the European Geosciences Union.
166                                             C. Pohl et al.: Broadband albedo of Arctic sea ice from MERIS optical data

surface temperature and a loss of sea ice, which amplifies the     temporal and spatial resolution of the measurement (Table 1),
albedo reduction (Curry et al., 1995; Perovich et al., 2002;       and the approach to retrieve the broadband albedo (kernel-
Pirazzini, 2008).                                                  driven, bidirectional reflectance distribution function, BRDF,
   For a better understanding of the strong sensitivity of the     methods or anisotropy reflectance correction, ARC, meth-
Arctic climate to surface broadband albedo variations, cli-        ods, both combined with a narrow-to-broadband conversion,
mate studies need surface broadband albedo values that meet        NTBC, direct estimation methods, and methods using radia-
two criteria. Firstly, the surface broadband albedo has to be      tive transfer theory, RTT) (Liang, 2001; Qu et al., 2014). The
comprehensive in space and time to capture its strong vari-        latter dependency is caused by pre-assumed surface and at-
ability, with low albedo over melt ponds and high albedo over      mospheric conditions in most retrieval methods. Their rep-
snow-covered sea ice. Many surface broadband albedo data           resentativeness of the actual conditions determines the ac-
products from different satellite missions are available for       curacy of the retrieved albedo product. Only the algorithm
this purpose. Table 1 provides an overview of the major ones       for MERIS data by Istomina et al. (2015) utilizes a physical
and their specifications. The albedo data from the MODer-          model of sea ice that considers its melting stage and there-
ate resolution Imaging Spectroradiometer (MODIS) onboard           fore does not depend on a priori assumptions of the surface
Terra and Aqua (Lucht et al., 2000; Schaaf et al., 2002)           and atmospheric conditions, which can introduce an error in
have been widely used as a reference for evaluating other          the retrieved albedo product.
albedo products. The Polar Pathfinder-Extended (APP-x) cli-           However, the retrieval algorithm by Istomina et al. (2015)
mate data record from Advanced Very High Resolution Ra-            calculates the broadband albedo from MERIS data by lin-
diometer (AVHRR) measurements onboard various NOAA                 early averaging the MERIS-derived spectral albedo at wave-
POES (U.S. National Oceanic and Atmospheric Administra-            lengths of 400, 500, 600, 700, 800, and 900 nm. Therefore,
tion Polar Operational Environmental Satellites) includes the      the MERIS-derived broadband albedo only covers the wave-
first long time series of consistent surface broadband albedo,     band 400–900 nm. It cannot be used directly in climate stud-
starting from 1982 (Key et al., 2016). MERIS (MEdium Res-          ies, which usually need surface albedo values in the wave-
olution Imaging Spectrometer) onboard ENVISAT (ENVI-               band 300–5000 nm (He et al., 2018b), and is not compara-
ronmental SATellite) provides the surface albedo of Arctic         ble with other satellite-derived broadband albedo products
sea ice on a daily basis (Istomina et al., 2015). VIIRS (Visible   with wavebands larger than 300–3000 nm (Table 1). A com-
Infrared Imaging Radiometer Suite) onboard S-NPP (Suomi            parison of surface broadband albedo products in different
National Polar-orbiting Partnership) belongs to the newest         wavebands reveals significant discrepancies, which can ex-
moderate spatial resolution imaging radiometers generating         ceed the required albedo accuracy in climate simulations (Li
the surface albedo (He et al., 2018b). High spatial resolu-        and Leighton, 1992; Winther et al., 2003; Bourgeois et al.,
tion surface albedo (30 m) at the expense of reduced tem-          2006). The validation of MERIS-derived broadband albedo
poral resolution (16 d) are generated by Operational Land          against airborne measurements showed that over landfast ice
Imager (OLI), Thematic Mapper (TM), and Enhanced The-              the MERIS broadband albedo is higher by 0.06 on average
matic Mapper Plus (ETM+) onboard the Landsat satellites            than respective airborne measurements in the waveband 285–
(He et al., 2018b). A 34-year time series of black-sky sur-        2800 nm because of its lack of radiative information in the
face albedo (SAL), as part of the second edition of the            near infrared spectral region (Istomina et al., 2015).
CLoud, Albedo, and surface RAdiation data set (CLARA-                 In this paper, we introduce a spectral-to-broadband con-
A2), has been derived from AVHRR measurements onboard              version (STBC), which replaces the conversion method pro-
NOAA and Metop (Meteorological Operational) satellites             posed by Istomina et al. (2015) for calculating broadband
(Riihelä et al., 2013; Karlsson et al., 2017). Furthermore,        albedo in the waveband 300–3000 nm from spectral albedo
surface albedo can be retrieved from collaborative observa-        retrieved from MERIS swath observations via the Melt Pond
tions of multiple platforms, e.g., GlobAlbedo (Muller et al.,      Detector (MPD) algorithm (Zege et al., 2015). With these
2012; Lewis et al., 2013) and Global LAnd Surface Satellite        new broadband albedo values, we improve the validation re-
(GLASS, Liu et al., 2013; Liang et al., 2013), or from radia-      sults of the MPD algorithm from Istomina et al. (2015). The
tion budget data sets, e.g., Clouds and the Earth’s Radiant En-    new MERIS broadband albedo can be used to evaluate and
ergy System – Energy Balanced And Filled (CERES-EBAF,              validate other albedo products from different satellite obser-
2014; Loeb et al., 2018) and the International Satellite Cloud     vations and to test albedo parameterizations in climate mod-
Climatology Project (ISCCP, Zhang et al., 1995, 2004).             els and atmospheric reanalyses. As the MPD algorithm ad-
   Secondly, the surface broadband albedo included in cli-         ditionally retrieves the melt pond fraction from MERIS ob-
mate models has to fulfill an absolute accuracy of 0.02–0.05       servations, it is possible for the first time to include simul-
as shown in sensitivity analyses (Henderson-Sellers and Wil-       taneously derived broadband albedo values and melt pond
son, 1983; Jacob and Olioso, 2005; Sellers et al., 1995).          fractions into climate models and atmospheric reanalyses.
However, the satellite-retrieved albedo products underlie un-         After a short description of the MPD algorithm, the empir-
certainties, depending on the number and spectral distribu-        ically derived spectral-to-broadband conversion of the albedo
tion of satellite channels (i.e., narrowbands) available, the      is presented (Sect. 2). It is tested against the conversion tech-

The Cryosphere, 14, 165–182, 2020                                                        www.the-cryosphere.net/14/165/2020/
C. Pohl et al.: Broadband albedo of Arctic sea ice from MERIS optical data                                                                      167

Table 1. Major surface broadband albedo products derived from satellite observations.

    Data set   Instrument    Platform        Spatial        Temporal            Temporal    Waveband      Retrieval method    References
    name                                     resolution     resolution          coverage    (µm)
    –          MODIS         Terra, Aqua     1 km/0.05◦     8d                  2000–now    0.3–5         kernel-driven       Lucht et al. (2000),
                                                                                                          BRDF, NTBC          Schaaf et al. (2002)
    APP-x      AVHRR         NOAA POES       5 km           Twice daily         1982–now    0.28–4        NTBC, ARC           Key et al. (2016)
                                                            (Arctic region)
    –          MERIS         ENVISAT         1 km/0.05◦     1d                  2002–2012   0.4–0.9       Analytic solution   Zege et al. (2015),
                                                                                                          of RTT, STBC        Istomina et al.
                                                                                                                              (2015)
    –          VIIRS         S-NPP           1 km           1 d/16 d            2011–now    0.4–4         Direct estimation   Wang et al. (2013),
                                                                                                                              Zhou et al. (2016)
    –          OLI           Landsat         30 m           16 d                2013–now    0.3–3         Direct estimation   He et al. (2018a, b)
    –          TM/ETM+       Landsat         30 m           16 d                1982–now    0.3–3         Direct estimation   He et al. (2018a, b)
    CLARA-     AVHRR         NOAA,           0.25◦          5 d/1 month         1982–2015   0.25–2.5      NTBC, ARC           Riihelä et al.,
    A2 SAL                   Metop                                                                                            (2013),
                                                                                                                              Karlsson et al.
                                                                                                                              (2017)
    Glob-      VEGETATION,   SPOT,           1 km/0.05◦ ,   16 d/1 month        1998–2011   0.3–3         NTBC, kernel-       Muller et al. (2012),
    Albedo     AATSR,        ENVISAT,        0.5◦                                                         driven BRDF         Lewis et al. (2013)
               MERIS,        Terra, Aqua
               MODIS
    GLASS      MODIS,        Terra, Aqua,    1 km/0.05◦     1 d/8 d             1981–2012   0.3–3         Direct estimation   Liu et al. (2013),
               AVHRR         NOAA                                                                                             Liang et al. (2013)
    CERES-     CERES         Terra, Aqua,    1◦             1 d/1 month         2000–now    0.3–5         RTT                 CERES-EBAF
    EBAF                     S-NPP,                                                                                           (2014), Loeb et al.
                             NOAA                                                                                             (2018)
    ISCCP      VISSR, MIR,   GMS, GOES,      2.5◦           1 month             1983–2009   0.2–5         RTT                 Zhang et al. (1995,
               AVHRR         INSAT,                                                                                           2004), Schiffer and
                             METEOSAT,                                                                                        Rossow (1983)
                             NOAA

niques by Istomina et al. (2015) and Gao et al. (2004) in                 spectral albedo values which are averaged daily afterwards
Sect. 3. Section 4 discusses its uncertainty. The new broad-              (Sect. 2.1). The output is converted into broadband albedo
band albedo of Arctic sea ice retrieved from MERIS obser-                 values (Sect. 2.2).
vations is validated in Sect. 5. In Sect. 6, it is compared
with respective values derived from the fifth generation of               2.1    Melt Pond Detector algorithm
climate atmospheric reanalysis data set ERA5 produced by
the European Centre for Medium-Range Weather Forecasts                    The Melt Pond Detector (MPD) algorithm has been devel-
(ECMWF) (Hersbach et al., 2018) to investigate the consis-                oped by Zege et al. (2015) to retrieve the spectral albedo at
tency of the sea-ice albedo used in a state-of-the-art atmo-              wavelengths λi = 400, 500, 600, 700, 800, and 900 nm and
spheric reanalysis with satellite observations. Section 7 con-            the melt pond fraction over Arctic sea ice. It has been vali-
cludes our findings.                                                      dated by Istomina et al. (2015) and the built-in cloud filtering
   In order to maintain short expressions, the following sec-             has been improved by Marks (2015). The main retrieval steps
tions always refer to albedo products at the surface even if              of the MPD algorithm are given in this section.
they are not explicitly declared as such.                                    The input parameters are Level 1b swath data with a spa-
                                                                          tial resolution of 1 km at nadir from MERIS onboard EN-
                                                                          VISAT, including radiances of channels 1, 2, 3, 4, 8, 10,
2       Method                                                            12, 13, and 14 at center wavelengths 412.5, 442.5, 490, 510,
                                                                          681.25, 753.75, 778.75, 865, and 885 nm, respectively, and
Daily averages of broadband albedo over Arctic sea ice are                solar and observation angles. Additional relevant information
derived from MERIS observations in three steps: MERIS                     about the atmospheric and surface state (atmosphere profile,
swath Level 1b data over Arctic sea ice are used by the Melt              aerosol load, bounds for ice, and pond optical properties) can
Pond Detector (MPD) algorithm to derive time-synchronous                  be entered from a separate input file.

www.the-cryosphere.net/14/165/2020/                                                                    The Cryosphere, 14, 165–182, 2020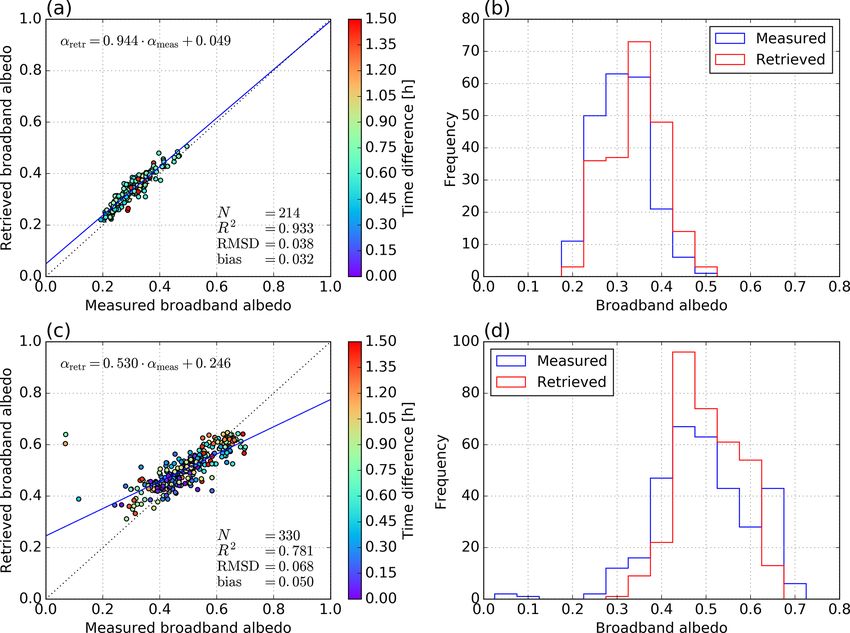
168                                             C. Pohl et al.: Broadband albedo of Arctic sea ice from MERIS optical data

   For each classified sea-ice grid cell, ice and pond parame-     USA (71.366◦ N, 156.542◦ W). The spectral albedo between
ters (optical thickness of pond and ice, scattering coefficient    350 and 2500 nm was derived from upward and downward ir-
of ice, effective ice grain size, and absorption coefficient of    radiance measurements using an Analytical Spectral Devices
yellow pigments), and a pond fraction are initialized. From        (ASD) spectrometer “FieldSpec3” with a diffuse cosine col-
those, the white ice and melt pond BRDF are calculated             lector. The broadband albedo in the waveband 300–3000 nm
based on the asymptotic solution for optically thick layers        was measured by a Kipp&Zonen CM14 albedometer. Each
(Zege et al., 1991). In the case of the melt pond BRDF cal-        of the two optics was mounted on a 1.5 m long arm and was
culation, the optically thick layer is referred to the melt pond   positioned about 1 m above the surface (Polashenski, 2011).
bottom. The reflection and transmission at the air–water in-          Spectral and broadband albedo were measured along a first
terface is determined by Fresnel’s law. The surface BRDF           transect line on 21 d between April and June 2008. Along
is calculated as a linear combination of both BRDF values          the second transect line, measurements were done on 13 d
weighted by the pond fraction. From surface BRDF and the           between May and June 2009 and along the third transect
atmospheric reflectance and transmittance calculated by the        line on 12 d in June 2009. The second and third transect
radiative transfer code RAY (Tynes et al., 2001), the radi-        lines were 1 km apart from each other. The measurements
ances at MERIS channels at the top of the atmosphere are de-       were done once per day (except 14 June 2008 with twice
rived based on the atmospheric correction method by Tanré          per day) in steps of 2.5–5 m under various sky conditions
et al. (1983). In an iterative process based on the Newton–        (clear, cloudy, and overcast skies). The time of spectral and
Raphson method (Press et al., 1992), the difference between        broadband albedo measurements may differ by more than
measured and calculated MERIS radiances is minimized as            1 h because the spectral and broadband albedo samples were
a function of the ice and pond parameters, and of the melt         recorded one after the other.
pond fraction.                                                        After excluding unphysically high and discontinuous
   From resulting ice and pond parameters, the spec-               albedo spectra, 1720 albedo spectra and broadband albedo
tral black-sky albedo (directional hemispherical albedo,           values of various sea-ice surface types are available from
Schaepman-Strub et al., 2006) at wavelengths λi = 400, 500,        optically thick (snow depth & 10 cm) and thin snow sur-
600, 700, 800, and 900 nm are calculated. The output of the        faces (snow depth . 10 cm), bare ice with loose decaying
MPD algorithm is the spectral albedo at the above-mentioned        ice crystals on top and slushy bare ice to frozen and liquid
six wavelengths, the melt pond fraction, and the estimated         melt ponds. Spatially and temporally colocated spectral and
retrieval error for each MERIS swath data grid cell. Daily         broadband albedo measurements were used to derive the co-
averages are created by gridding and averaging the output of       efficients ki in Eq. (1) minimizing the square sum of errors
                                                                                                2
each MERIS swath on a 12.5 km NSIDC (National Snow and

                                                                     αbb − k0 − 6i=1 ki · α(λi ) . The coefficient k0 was preset
                                                                                 P
Ice Data Center) polar stereographic projection. More details
can be found at https://www.seaice.uni-bremen.de/ (last ac-        to 0 in order to warrant the condition αbb = α(λi ) = 0. The
cess: 14 November 2019).                                           resulting coefficients are given in Table 2 and can be used to
                                                                   calculate the broadband albedo in waveband 300–3000 nm.
2.2   Broadband albedo conversion                                  This method is referred to as empirically derived STBC.
                                                                      The daily averages of MERIS-derived broadband albedo
To convert the six spectral albedo values α(λ) at wavelengths      over Arctic sea ice are available at https://seaice.uni-bremen.
λi = 400, 500, 600, 700, 800, and 900 nm to the MERIS              de/data/meris/gridded_cldscr/broadband_albedo/ (last ac-
broadband albedo, we introduce the spectral-to-broadband           cess: 14 November 2019).
conversion (STBC):

             6
             X                                                     3   Results
αbb = k0 +         ki · α(λi ).                             (1)
             i=1                                                   We investigate the performance of the empirically derived
                                                                   STBC (Sect. 3.1) and compare this new conversion to those
The coefficients ki are empirically derived from spectral and      methods proposed in Istomina et al. (2015) and Gao et al.
broadband albedo values measured by Polashenski (2011) on          (2004) (Sect. 3.2). For the evaluation, we used the root-mean-
landfast ice close to Utqiaġvik (formerly Barrow), AK, USA,       square deviation (RMSD), as an estimator for the statisti-
between April and June of 2008 and 2009. The objective of          cal deviation; the mean difference of retrieved and measured
the ground-based measurements was to investigate albedo            albedo (bias), as an estimator for the systematic deviation;
and melt pond evolution during the melt season. The data           and the coefficient of determination (R 2 ), which allows con-
are available at http://chrispolashenski.com/data.php (last ac-    clusions about the quality of correlation. Measurement un-
cess: 14 November 2019).                                           certainties in the considered data sets are neglected as they
   Spectral and broadband albedo were measured along three         are small compared to influences due to time offsets or dif-
transect lines of 200 m length each, oriented west–east and        ferent spatial resolutions of the measurements.
located on first-year sea ice 1 km offshore of Utqiaġvik, AK,

The Cryosphere, 14, 165–182, 2020                                                       www.the-cryosphere.net/14/165/2020/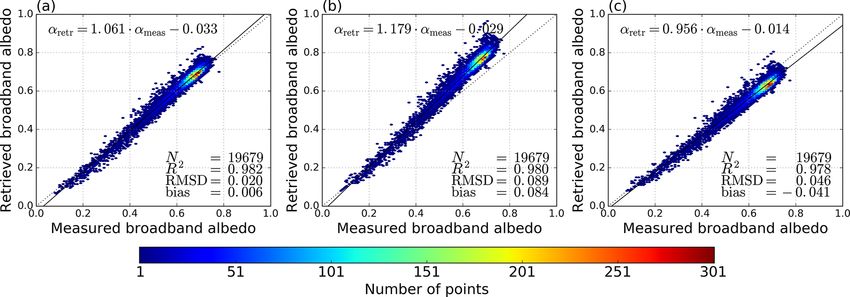
C. Pohl et al.: Broadband albedo of Arctic sea ice from MERIS optical data                                                        169

Table 2. Coefficients ki in Eq. (1) to calculate MERIS broadband albedo from spectral albedo at the six wavelengths 400, 500, 600, 700,
800, and 900 nm (for Gao et al., 2004, from the narrowband albedo at channels with the center wavelengths 490, 560, 665, and 865 nm).

                                                 k0         k1        k2        k3          k4        k5       k6
                     Empirically derived      0.0000   0.9337    −2.0856    2.9125    −1.6231      0.6750   0.0892
                     Istomina et al. (2015)   0.0000   0.1667     0.1667    0.1667     0.1667      0.1667   0.1667
                     Gao et al. (2004)        0.0149   0.1587    −0.2463    0.5442     0.3748      0.0000   0.0000

                                                                      the prevailing illumination can be significantly modified due
                                                                      to changes in the solar zenith angle and cloud conditions. As
                                                                      a result, nonconforming spectral and broadband albedo val-
                                                                      ues were measured.

                                                                      3.2   Comparison to existing conversion methods

                                                                      The empirically derived STBC is compared with the conver-
                                                                      sion methods proposed in Istomina et al. (2015) and Gao
                                                                      et al. (2004). Their coefficients ki are listed in Table 2. Is-
                                                                      tomina et al. (2015) calculated broadband albedo by aver-
                                                                      aging the spectral albedo values. Gao et al. (2004) propose
                                                                      a linear combination method of albedo values from MERIS
                                                                      channels 3, 5, 7, and 13 at the center wavelengths λ∗i = 490,
                                                                      560, 665, and 865 nm instead of λi . The coefficients ki in Gao
                                                                      et al. (2004) were adopted from the narrow-to-broadband
Figure 1. Scatterplot of measured broadband albedo and retrieved
broadband albedo by applying the empirically derived STBC to
                                                                      conversion developed for albedo values from MISR (Multi-
measured spectral albedo. Measurements were done by Polashen-         angle Imaging SpectroRadiometer) onboard Terra satellite by
ski (2011) over landfast ice of different melting stages close to     Liang et al. (1999). This conversion is based on radiative
Utqiaġvik, AK, USA, between April and June of 2008 and 2009.         transfer simulations.
Colors indicate the number density of points. The solid and dotted       For the comparison, an independent test data set of mea-
lines indicate the regression and one-to-one line, respectively.      sured spectral and broadband albedo was obtained during
                                                                      the ACLOUD (Arctic CLoud Observations Using airborne
                                                                      measurements during polar Day) campaign (Wendisch et al.,
3.1   Regression analysis of the empirically derived                  2019). The measured spectral albedo is available in Jäkel
      STBC                                                            et al. (2018); details on measured broadband albedo are given
                                                                      in Jäkel et al. (2019). The meteorological conditions dur-
The performance of the empirically derived STBC is pre-               ing the campaign are documented in Knudsen et al. (2018).
sented in Fig. 1, using the training data set. It shows the           On 25 June 2017, spectral and broadband albedo were mea-
broadband albedo measured by Polashenski (2011) over                  sured on board the Polar 5 aircraft north of Svalbard (80.48–
landfast ice close to Utqiaġvik, AK, USA, between April              81.62◦ N, 11.31–20.36◦ E) over sea-ice floes of different
and June of 2008 and 2009, and the broadband albedo prod-             sizes under cloud-free conditions. The flight altitude during
uct αbb retrieved from the empirically derived STBC using             the selected flight sections was between 50 and 200 m.
respective spectral albedo values measured by Polashenski                Spectral albedo was derived from hemispheric up- and
(2011). The combination of a high determination coefficient           downwelling spectral radiation detected by SMART (Spec-
(R 2 = 0.96) and a low RMSD of 0.05 between the measured              tral Modular Airborne Radiation measurement sysTem) in
and the retrieved broadband albedo indicates the good per-            the wavelength range 350–2200 nm within an accuracy of
formance of the empirically derived STBC. Systematic er-              10 %. SMART was actively stabilized in a horizontal posi-
rors are not found (bias ≈ 0.00). The slope of 0.93 and the           tion (Wendisch et al., 2001; Ehrlich et al., 2008; Bierwirth
intercept of 0.04 of the regression line indicate a slight over-      et al., 2009). The temporal resolution of the spectral mea-
estimation of low albedo values and a slight underestimation          surements was 2 Hz. Broadband albedo in waveband 200–
of high albedo values by the empirically derived STBC.                3600 nm was measured by two Kipp&Zonen CMP-22 pyra-
   Note that the deviations between measured and retrieved            nometers within an error of 3 %, as given by the manufacturer
broadband albedo are not only caused by the empirically de-           for stationary operation. Both pyranometers were mounted in
rived STBC but also by time offsets between the measured              a fixed position at the top and bottom of the aircraft’s fuse-
spectral and broadband albedo. Within this time difference,           lage for a simultaneous detection of the hemispheric down-

www.the-cryosphere.net/14/165/2020/                                                              The Cryosphere, 14, 165–182, 2020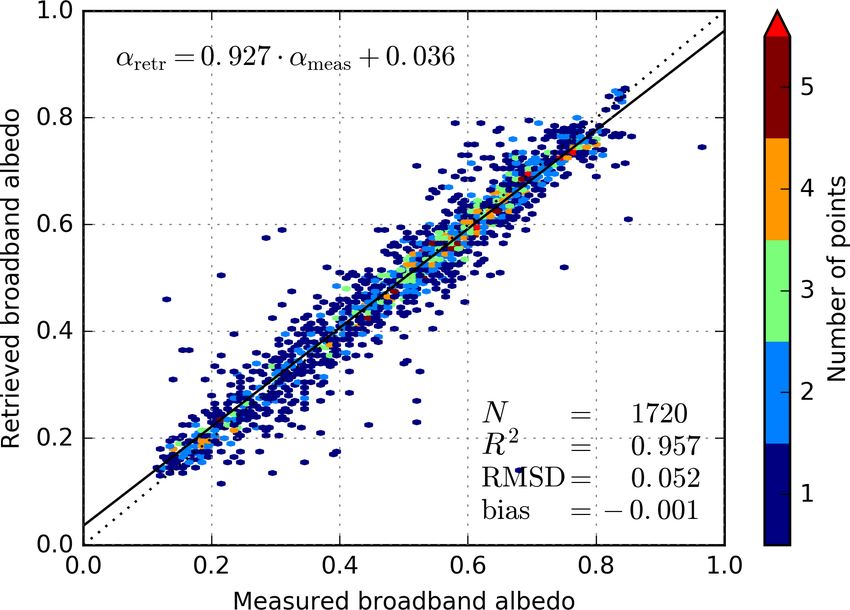
170                                             C. Pohl et al.: Broadband albedo of Arctic sea ice from MERIS optical data

and upwelling radiation. The temporal sampling interval was        fore, the STBC can be used for all Arctic sea-ice surface
increased to 20 Hz via the deconvolution method described          types.
in Ehrlich and Wendisch (2015). For clear-sky conditions,             Moreover, we have tested the performance of a STBC,
the measurements of the upward-facing pyranometer were             when it is derived for each surface type separately. To that
corrected for deviations from horizontal attitude due to mis-      end, we classified the albedo measurements by Polashenski
alignment of the instrument and roll and pitch angles of the       (2011) into “snow surface”, “bare ice”, and “melt pond”.
aircraft based on a method given by Bannehr and Schwiesow          Measurements from 2009 (1194 samples) were used as a
(1993) and described in Lampert et al. (2012). Broadband           training data set to derive the coefficients ki in Eq. (1)
measurements at roll and pitch angles higher than 4◦ are ex-       for each surface class. The surface-specific STBCs were
cluded.                                                            tested with the respective classified albedo measurements
   Spectral and broadband albedo values were temporally ad-        from 2008 (526 samples). The RMSD, bias, and R 2 between
justed. Influences caused by their different sampling intervals    measured and retrieved broadband albedo are 0.05, 0.02,
(2 and 20 Hz) were diminished by convolving the broadband          and 0.96, respectively. Using the albedo measurements from
albedo values by a running average of 10 measurements.             2009, independent of the surface type, as the training data set
   In Fig. 2a, measured broadband albedo is compared to            to derive the coefficients ki in Eq. (1) and applying those to
the broadband albedo αbb retrieved by the empirically de-          all albedo data from 2008, leads to the same RMSD, bias, and
rived STBC using spectral albedo measured by SMART. Re-            R 2 . Therefore, the STBC can be derived independently of the
trieved and measured broadband albedo are highly correlated        Arctic surface type without deterioration of their accuracy.
(R 2 = 0.98). The regression slope of 1.06 is close to 1 and to-      A substantial uncertainty in the derivation of the broad-
gether with the −0.03 intercept causes a small underestima-        band albedo is the sky condition. Most of the albedo mea-
tion of low albedo values. Discrepancies between both broad-       surements used for the empirical development of the STBC
band albedo products (RMSD = 0.02) are caused by uncer-            were influenced by clouds. Those can slightly increase the
tainties in the empirically derived STBC (Fig. 1) as well as       broadband albedo of snow by up to 0.06 (Key et al., 2001;
by measurement uncertainties in the spectral and broadband         Grenfell and Perovich, 1984) and therefore influence the
albedo.                                                            empirical derivation of the STBC. This cloud-influenced
   For comparison, Fig. 2b and c show measured broadband           STBC is applied in Sect. 3.2 to albedo measurements un-
albedo and respective retrieved broadband albedo αbb with          der clear-sky conditions, which can contribute to the discrep-
conversion methods proposed in Istomina et al. (2015) and          ancies shown in Fig. 2a. However, deriving the coefficients
Gao et al. (2004), respectively. Retrieved broadband albedo        in Eq. (1) using only albedo measurements under clear-sky
values of both conversions correlate well with measured            conditions (113 albedo spectra and broadband albedo val-
broadband albedo values (R 2 = 0.98 in both cases). But the        ues) by Polashenski (2011) and an application of those to the
conversion from Istomina et al. (2015) overestimates the           cloud-free albedo measurements during ACLOUD enlarges
broadband albedo (bias = 0.08), while the conversion from          the RMSD and bias given in Fig. 2a by 0.02 and 0.03, re-
Gao et al. (2004) underestimates it (bias = −0.04). Accord-        spectively (not shown).
ingly, RMSD values (0.09 and 0.05) are higher than for the            According to Liang (2001), a wide range of atmospheric
empirically derived STBC.                                          conditions and solar zenith angles are required to develop the
                                                                   STBC generally applicable to any spectral albedo measure-
                                                                   ment in the Arctic. We can confirm a high variability of the
4     Uncertainties due to differing variables along the           former via available aerosol optical depth from AERONET
      spectral-to-broadband conversion                             (Aerosol Robotic Network) data measured in Utqiaġvik, AK,
                                                                   USA, for the days of albedo measurements by Polashenski
Along the path of converting the spectral albedo to broad-         (2011) when the sun disk was visible. However, due to the
band albedo, inconsistencies of physical (state of the sea-        lack of the exact times of albedo measurements, we can-
ice surface, solar zenith angle, waveband, and contrast be-        not determine the actual variability in the solar zenith angle.
tween black- and blue-sky albedo) and meteorological vari-         Since variations in the atmospheric visibility and the solar
ables (sky and atmospheric condition) may influence the ac-        zenith angle influence the broadband albedo (Liang, 2001)
curacy of the derived broadband albedo product. Their pres-        only marginally, they play a minor role in the uncertainties
ence and impact on the albedo is discussed in the following.       of the empirically derived STBC. Additionally, those effects
   The STBC is based on various sea-ice surface types              are overlaid by the cloud effects mentioned above.
in the early season (April–June) mentioned at the end of              Different wavebands of broadband albedo products may
Sect. 2.2. Nevertheless, it can be applied to later seasonal       affect their comparison. Applying the STBC, the de-
(July–September) Arctic surface types as well, as those sur-       rived broadband albedo covers the wavelength range 300–
face types, like snow-covered sea-ice, white ice, and refrozen     3000 nm. In contrast, the broadband albedo at ACLOUD was
surface types, are similar to the surface types included in the    measured in a broader waveband (200–3600 nm). Resulting
training data set (snow layers and frozen melt ponds). There-      discrepancies between both albedo products are estimated by

The Cryosphere, 14, 165–182, 2020                                                       www.the-cryosphere.net/14/165/2020/
C. Pohl et al.: Broadband albedo of Arctic sea ice from MERIS optical data 171
Figure 2. Scatterplot of measured broadband albedo and retrieved broadband albedo by applying the empirically derived STBC method (a),
the conversion method of Istomina et al. (2015) (b), or the conversion method by Gao et al. (2004) (c) to measured spectral albedo. Mea-
surements were done by the Polar 5 aircraft over sea-ice floes on 25 June 2017. Colors indicate the number density of points. The solid and
dotted lines indicate the regression and one-to-one line, respectively.
the radiative transfer model libRadtran (Mayer and Kylling, for Polar and Marine Research (AWI), over the southern
2005) and are lower than 0.01. Those systematic errors are Beaufort Sea between May and June 2008. The goal of the
negligible when comparing both broadband albedo products. campaign was to improve the quantitative understanding of
Although the STBC has been derived for blue-sky albedo the impact of melt ponds on radiation, heat, and momentum
(bihemispherical reflectance, Schaepman-Strub et al., 2006) fluxes over Arctic sea ice (Birnbaum et al., 2009).
in Sect. 2.2, it shall be applied to the MERIS-derived spec- To determine the broadband albedo, two Eppley Preci-
tral albedo, which is referred to as black-sky albedo (direc- sion Spectral Pyranometers were mounted on the Polar 5 air-
tional hemispherical reflectance). Manninen et al. (2012) es- craft in a fixed position measuring simultaneously the hemi-
timated the discrepancy between black- and blue-sky broad- spheric down- and upwelling radiation integrated over the
band albedo for 87 individual surface reflectance spectra waveband from 285 to 2800 nm. Analogous to the broad-
from USGS (U. S. Geological Survey) Spectroscopy Lab band measurements during ACLOUD, the measurements of
data, which includes, among others, snow, ice and water downwelling radiation at clear-sky conditions were corrected
spectra. It is typically lower than 0.05 at solar zenith an- for deviations from horizontal attitude due to misalignment
gles around 60◦ and at aerosol optical depths up to 1 at of the instrument based on the method given by Bannehr and
440 nm. We expect that the aerosol optical depth is consid- Schwiesow (1993).
erably lower in the Arctic such that the difference between On 5 individual days (26 May and 3, 4, 6, and 7 June
black- and blue-sky albedo decreases and seems to be negli- 2008), airborne broadband albedo was measured under al-
gible against the cloud effect. Hence, we decide not to adjust most clear-sky conditions. Measurement times are given in
any albedo measurement for the blue-sky to black-sky dis- Table 3. Maps of flight tracks are shown in Birnbaum et al.
crepancy. (2009). The flight altitude was between 50 and 400 m. On
6 June, broadband albedo was measured over landfast ice, on
the other selected days measurements were performed over
5 Improved Melt Pond Detector validation drifting ice with ice floes of different sizes.
Due to two warming events between 23–24 May and 1–
The MPD algorithm by Zege et al. (2015) is combined 7 June, broadband albedo was measured over sea ice at dif-
with the empirically derived STBC to retrieve more accu- ferent melting stages. On 26 May and 3 June, melt ponds at
rate broadband albedo values of Arctic sea ice from MERIS early stages were overflown. On 4 June, the snow was either
observations compared to the procedure described in Istom- melted away or was very wet and the number and size of
ina et al. (2015). With these new values, we will improve the melt ponds rose. On 6 and 7 June, the observed sea ice was
validation of the MPD algorithm performed in Istomina et al. homogeneously covered by well-developed melt ponds.
(2015). Airborne-measured broadband albedo is colocated with
The new MERIS broadband albedo data product is val- MERIS broadband albedo derived for each grid cell from
idated with measured broadband albedo during the aircraft MERIS swath data at a reduced resolution of 1.2 km. The
campaign MELTEX (impact of melt ponds on energy and MERIS overflight times that correspond to the airborne
momentum fluxes between atmosphere and sea ice) per- flights are also given in Table 3. The time difference between
formed by the Alfred Wegener Institute, Helmholtz Centre the airborne and satellite measurements stays below 2 h ex-
www.the-cryosphere.net/14/165/2020/ The Cryosphere, 14, 165–182, 2020172 C. Pohl et al.: Broadband albedo of Arctic sea ice from MERIS optical data
Table 3. Times of airborne measurements (Polar 5) and satellite overflights (MERIS on ENVISAT) in UTC for selected days during the
MELTEX campaign in 2008.
26 May 2008 3 June 2008 4 June 2008 6 June 2008 7 June 2008
Polar 5 20:45–21:48 17:00–19:46 19:14–23:24 19:01–21:55 17:08–20:17
MERIS 20:46 19:54 21:02 20:00 21:08
cept for 3 and 7 June, with a maximum difference of 3 and togram in Fig. 3d, the coarser spatial resolution of MERIS
4 h, respectively. observations leads to a lower albedo variability compared
For the colocation of airborne and MERIS broadband to the respective airborne measurements. Moreover, the bi-
albedo, the orthodromic distance between each MERIS grid modal albedo distribution shown in the latter is smeared out
cell center and the location of a given airborne measurement in the respective satellite retrievals. For the landfast ice case,
is calculated. Each airborne measurement is allocated to the the surface conditions are more homogeneous, and thus the
satellite grid cell with the smallest orthodromic distance. De- difference in spatial resolution has less influence on the com-
pending on the orientation and location of the flight track, as parison (see Fig. 3b).
well as MERIS grid cell availability, up to 14 airborne broad- In contrast, the validation of MERIS broadband albedo
band albedo measurements are colocated to one MERIS- values derived via the procedure described in Istomina et al.
derived broadband albedo value. The airborne broadband (2015), i.e., the combination of the MPD algorithm and the
albedo values are averaged for each satellite grid cell. spectral averaging method using coefficients given in Ta-
The scatterplots in Fig. 3 show the correlation of the ble 2, results in similar correlation values of R 2 = 0.94 for
MERIS-derived and colocated airborne broadband albedo the landfast ice case and R 2 = 0.78 for the drift ice cases.
for measurements over landfast ice (Fig. 3a) and over drift The RMSDs are 0.06 (landfast ice) and 0.09 (drift ice) and
ice (Fig. 3c), respectively. Colocated airborne and MERIS thus exceed the values found above. This again illustrates the
broadband albedo values are used for validation only if more better performance of the empirically developed STBC com-
than five airborne broadband albedo values are available for pared to the spectral averaging method proposed in Istomina
one MERIS grid cell. Time differences between airborne and et al. (2015).
MERIS measurements up to 1.5 h were allowed.
For the landfast ice case (Fig. 3a), MERIS broadband
albedo is slightly higher at low albedo values than the cor- 6 Comparison between broadband albedo from
responding airborne broadband albedo. For drift ice cases satellite and atmospheric reanalysis
(Fig. 3c), the respective overestimation is higher but at
During the melt season in Arctic summer, the Arctic sea ice
high albedo values an underestimation occurs (slope = 0.53,
experiences rapid changes in the albedo mainly caused by
intercept = 0.25).
the melt pond development (Eicken et al., 2002; Polashenski,
The highest correlation and lowest RMSD value is found
2011). As the melt pond fraction on sea ice evolves according
for broadband albedo values over landfast ice on 6 June 2008
to the sequence of melt stages (Eicken et al., 2002), the melt
(R 2 = 0.93, RMSD = 0.04, Fig. 3a). Compared to landfast
pond fraction and the melt evolution are beneficial informa-
ice, the RMSD = 0.07 for the drifting ice cases (Fig. 3c) is
tion in the representation of the summer energy balance in
nearly twice as high and the correlation is lower (R 2 = 0.78).
atmospheric reanalyses, especially in above-mentioned situ-
Correlation and RMSD values depend on weather conditions,
ations where accurate albedo representation is challenging.
ice concentration, surface inhomogeneity, time differences
Although a vast amount of satellite and in situ observations
between satellite overflight and airborne measurements, and
are assimilated into every atmospheric reanalysis, there is no
spatial resolution of the observation. As landfast ice is sta-
published reference about assimilation of melt ponds in those
tionary over long periods of time, airborne measurements are
models at the time of writing. Instead, the sea-ice surface is
not displaced relative to satellite measurements during the
characterized by a parameterized surface albedo. We test the
time lag between both observations. Over drifting ice floes
albedo parameterization used for the atmospheric reanalysis
at lower sea-ice concentrations, a higher sea-ice drift can be
data set ERA5 by comparing ERA5 and MERIS broadband
expected (free drift conditions). Therefore, the surface condi-
albedo values.
tions observed by the aircraft and satellite can become more
ERA5 is the fifth generation of climate reanalysis data set
different (see the three outliers at low measured albedo val-
produced by ECMWF. It provides hourly values of atmo-
ues in Fig. 3c). The discrepancies between MERIS-derived
spheric and land variables from 1950 onwards, with a spatial
and airborne broadband albedo values are increased by their
resolution of 31 km, obtained by an ensemble 4D-Var data as-
different spatial resolution, which depends on observation
similation system (Hersbach et al., 2018). The sea-ice albedo
heights and instrument optics. As clearly seen in the his-
is simply prescribed as constants following the albedo values
The Cryosphere, 14, 165–182, 2020 www.the-cryosphere.net/14/165/2020/C. Pohl et al.: Broadband albedo of Arctic sea ice from MERIS optical data 173
Figure 3. Scatterplot and histogram of airborne-measured and satellite-derived broadband albedo on 6 June 2008 over landfast ice (no
drift) (a, b) and on 26 May and 3, 4, and 7 June 2008 over sea-ice floes (possible sea-ice drift contamination) (c, d). The colors of the points
define the time difference between airborne measurement and satellite overflight. The regression line and one-to-one line are shown as solid
blue and dotted black lines, respectively.
given in Ebert and Curry (1993) and considers the spectral The effective grid cell broadband albedo of ERA5 can be
variation. It is representative for dry snow during the months calculated from hourly averaged ERA5 net and downward
September to May, representative for melting snow in June, irradiances, Fnet (h) and Fdn (h), at surface in the waveband
and representative for bare sea ice in July and August. Melt 200–4000 nm. Thus, daily averaged ERA5 grid cell broad-
ponds are not represented at any time. The Ebert and Curry band albedo is given by
values are taken to be valid on the 15th day of the month,
and the values for all other days are obtained by linear in- Fnet (h)
αERA5 = 1 − . (3)
terpolation. The grid cell albedo for ERA5 is then a linear Fdn (h)
combination between the sea-ice albedo and the open-water The bars illustrate the averaging of the hourly (h) irradiances
albedo: per day at which the sun is above the horizon. Fnet and Fdn
were generated by using Copernicus Climate Change Service
αERA5 = c · αseaice + (1 − c) · αwater , (2)
(2017).
with c representing the sea-ice concentration from ERA5 Analogously, the MERIS grid cell broadband albedo for
generated by Copernicus Climate Change Service (2017). It sea-ice grid cells can be expressed as follows:
has been developed under the Ocean and Sea Ice Satellite αMERIS = (1 − s) · αice + s · αpond , (4)
Application Facilities (OSI-SAF) using passive microwave
satellite data from SSMIS (Special Sensor Microwave Im- since the STBC is linear. The parameters αice and αpond rep-
ager Sounder) at 10 km resolution (Tonboe et al., 2017). The resent the broadband albedo of ice and melt pond, and s rep-
open-water albedo αwater is calculated in dependence of the resents the melt pond fraction.
solar zenith angle according to Taylor et al. (1996) for the Although the structure of Eqs. (2) and (4) is identical,
clear-sky case and is equal to αwater = 0.06 for diffuse irradi- the single variables cannot be compared directly. Accord-
ation (ECMWF, 2016). ing to the MPD algorithm, MERIS-derived albedo αMERIS
is only available at 100 % sea-ice concentration (Sect. 2.1)
www.the-cryosphere.net/14/165/2020/ The Cryosphere, 14, 165–182, 2020174 C. Pohl et al.: Broadband albedo of Arctic sea ice from MERIS optical data
irradiances at the surface (Eq. 3). Varying amounts of water
vapor above the ice cause variations in the spectral composi-
tion of downwelling irradiance Fdn , and the spectral depen-
dence of the ERA5 albedo values then leads to an apparently
varying broadband albedo.
The corresponding averaged MERIS broadband albedo
αMERIS and melt pond fraction s are comparably shown in
Fig. 4a. The averaged MERIS albedo αMERIS possesses a
similar seasonal development compared to the ERA5 albedo
αERA5 . However, the MERIS albedo is lower in May and the
beginning of June by up to 0.06 and from the end of August
to September by up to 0.11. Between 10 June and 22 Au-
gust, the MERIS albedo is up to 0.11 higher compared to the
ERA5 albedo. The averaged melt pond fraction from MERIS
is between 0.06 (May, September) and 0.21 (July, begin of
August). The MERIS products offer a higher variability than
the ERA5 broadband albedo, indicated by a higher standard
deviation and stronger day to day variations. It is highest in
July and August when the Arctic surface exhibits the highest
Figure 4. (a) Grid cell broadband albedo from ERA5 (red) and heterogeneity due to melting processes.
MERIS (blue), as well as MERIS melt pond fraction (cyan), at grid In May, the melt pond fraction is overestimated since
cells of 100 % sea-ice concentration according to ERA5 and at dis- the temperatures are below the melting point (Fig. 4b). Un-
tances more than 50 km from coastlines. (b) Respective 2 m temper-
screened clouds that are darker than the surface are treated as
ature from ERA5. Points and the black line show the values between
2003 and 2011, which are averaged spatially and yearly. Error bars
melt ponds by the MPD algorithm (Sect. 2.1), leading to melt
represent their standard deviations. pond fractions between 0.02 and 0.15 and a reduced MERIS
broadband albedo αMERIS . After melt onset in June, the Arc-
tic surface is darker than clouds and therefore distinguishable
and is simultaneously derived by the melt pond fraction s from those. Thus, the derived melt pond fractions in July and
and albedo portions αice and αpond . Consequently, all three August are reliable. The conflicting ERA5 sea-ice concentra-
components are influenced by the reflection properties of un- tion of c = 1 might be due to different spatial resolutions in
detected small cracks and leads (oceanic water). In contrast, the input data set (1 km for MERIS, 10 km for SSMIS): small
the ERA5 albedo αERA5 does not consider melt ponds, and total melt pond areas, e.g., 0.1 km2 , are equal to a melt pond
its components c, αseaice , and αwater are determined inde- fraction of s = 0.1 in a MERIS grid cell but only s = 0.001
pendently. Thus, unconsidered melt ponds influence the sea- in a SSMIS grid cell and cannot be detected by SSMIS. Ad-
ice concentration c only, via a nonlinear relationship. How- ditionally, values of c = 1 in July are questionable, as the 2 m
ever, both equations can explain variations and differences temperature is above the freezing point (Fig. 4b), implicating
between the ERA5 and MERIS grid cell broadband albedo wet surfaces that are detected immediately as water by pas-
that are considered below. sive microwave instruments. The modified signals result only
in a retrieved sea-ice concentration of c = 1 if the deviation
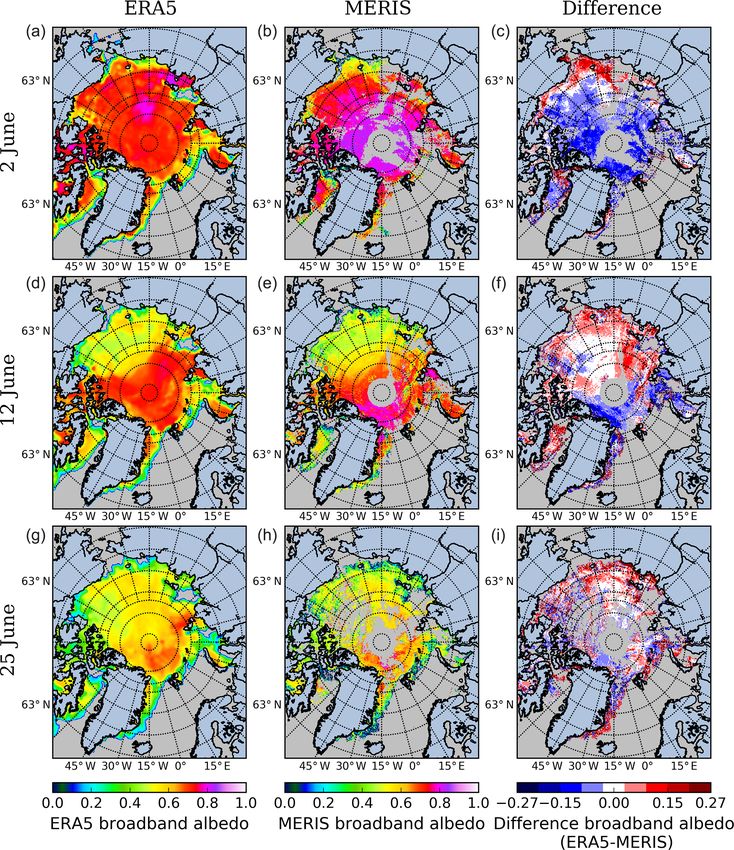
6.1 Temporal differences over pure sea ice of the sea-ice emissivity in the observed grid cell is outside
the assumed variability around the tie point in the retrieval
To understand the sea-ice albedo parameterization in ERA5, algorithm.
we illustrate the seasonal variability of the broadband albedo Despite existing melt ponds in a grid cell from the end of
αERA5 at an ERA5 sea-ice concentration of c = 1 in Fig. 4a. June to the end of August, the MERIS-derived albedo αMERIS
Thus, Eq. (2) modifies to αERA5 = αseaice . Only grid cells can be higher than the broadband albedo from ERA5 αERA5 .
with a minimum distance of 50 km from coastlines are taken However, the latter remains within the standard deviation
into account. The ERA5 values are averaged spatially and of αMERIS , implying that the literature-based albedo value
yearly over the years 2003 to 2011. The literature-based val- of bare ice αseaice is reasonable but slightly negatively bi-
ues for dry snow on 15 May and 15 September (0.84–0.85), ased for surface types consisting of a mixture of melt ponds,
for melting snow on 15 June (0.7) and for bare sea ice be- wet snow, and bare ice. From mid-September, after the re-
tween 15 July and 15 August (0.55–0.57) can be clearly iden- freezing onset, the passive microwave instrument (SSMIS)
tified. Intermediate values are linearly interpolated. Small retrieving the ERA5 sea-ice concentration cannot detect any
fluctuations of the ERA5 albedo of up to 0.05 around the wet surfaces, whereas the optical instrument (MERIS) iden-
prescribed constant values are most likely a consequence of tifies optically darker frozen melt ponds (s ≈ 0.06). Conse-
diagnosing the broadband albedo from net and downwelling quently, the grid cell broadband albedo from ERA5 is only
The Cryosphere, 14, 165–182, 2020 www.the-cryosphere.net/14/165/2020/C. Pohl et al.: Broadband albedo of Arctic sea ice from MERIS optical data 175
determined by the dry snow albedo and is therefore overes- 2007, whereas in the 9-year average the increase in the melt
timated. Due to the temporal linear interpolation, the ERA5 pond fraction leads to up to 0.1 smaller MERIS grid cell
broadband albedo αERA5 overestimation already begins from broadband albedo values in June. Starting from July 2007,
the end of August. melting processes lead to strong variations in the MERIS
products, seen especially from two peaks on 23 July and
6.2 Temporal differences over first-year and multiyear 8 August (Fig. 5a). At both times, the ERA5 grid cell broad-
ice band albedo follows the MERIS grid cell broadband albedo
but its variation stays low. When the complement of ERA5
Figure 5a and b show the time series of the broadband albedo sea-ice concentration reaches 1 starting from the end of Au-
of MERIS αMERIS and ERA5 αERA5 , as well as the melt pond gust 2007, MERIS products are not available because the
fraction s and the complement of the sea-ice fraction c, for a MPD algorithm does not detect any sea ice. In the 9-year
first-year ice area in the Beaufort Sea close to Utqiaġvik, AK, average, ERA5 grid cell broadband albedo is higher than
USA (75◦ N, 155◦ W), and for a multiyear ice area north of MERIS grid cell broadband albedo over first-year ice be-
Greenland (84.5◦ N, 35◦ W) in summer 2007, respectively. tween mid-July and mid-September. Its minimum albedo
Each area is composed of five grid cells. The seasonal vari- is limited to 0.2 due to the literature-based ERA5 bare ice
ability of the four products in both areas averaged over the albedo αseaice and prevailing averaged ERA5 sea-ice concen-
years 2003 to 2011 is shown in Fig. 5c and d. The MERIS tration c. MERIS grid cell broadband albedo can be even
and ERA5 grid cell broadband albedo agree in their seasonal lower despite low melt pond fractions, as melting sea ice can
pattern, and the albedo decreases with increasing melt pond be very dark. Starting from mid-September, both averaged
fraction and complement of sea-ice fraction and vice versa, grid cell broadband albedo products increase due to refreez-
seen especially clearly in the area over multiyear ice (Fig. 5b ing processes. As the ERA5 albedo αERA5 is only tuned via
and d) and for the short melt and refreeze event on first-year the ERA5 sea-ice concentration (compare with Fig. 4a), its
ice around 9 June 2007 (Fig. 5a). However, temporal differ- increase is weaker than those from MERIS broadband albedo
ences between MERIS and ERA5 grid cell broadband albedo αMERIS .
occur, which are highest over first-year ice starting from mid- In contrast to first-year ice, the grid cell broadband albedo
August with values up to 0.2 and over multiyear ice between from MERIS over multiyear ice is mostly higher (by up to
June and August with values around 0.1. 0.1) than from ERA5 between mid-June and the end of Au-
The overestimation of the melt pond fraction in May, gust (Fig. 5b and d). Two reasons can be identified for this
likely caused by clouds, is higher over first-year ice than effect. Firstly, the ERA5 sea-ice albedo αseaice is lower than
over multiyear ice resulting in a MERIS grid cell broadband the MERIS albedo αMERIS (Fig. 4a). Secondly, water albedo
albedo underestimation over first-year ice in 2007 (Fig. 5a) αwater is much lower than albedo of melt ponds αpond , such
and in the 9-year average (Fig. 5c), whereas over multi- that even lower values of the complement of ERA5 sea-ice
year ice both grid cell broadband albedo products coincide concentration than of the melt pond fraction cannot compen-
(Fig. 5b and d). Between the end of May and mid-June, sate for the low ERA5 water albedo. Contrary to the small
the ERA5 grid cell broadband albedo is underestimated over variations in the complement of the ERA5 sea-ice concen-
multiyear ice by up to 0.1 (Fig. 5b and d), due to the (at tration at 6 June, its abrupt changes on 1 July and 7 August
this time) prevailing ERA5 sea-ice albedo αseaice reduction 2007 are reproduced in the ERA5 albedo αERA5 (Fig. 5b), as
(Fig. 4a). This reduction is strong enough to obliterate grid the variation in the complement of the sea-ice concentration
cell albedo effects from small variations in the complement is stronger and, in case of 7 August, the ERA5 sea-ice albedo
of ERA5 sea-ice concentration at 6 June (Fig. 5b). In con- αseaice keeps constant (Fig. 4a). However, the strong variabil-
trast, the ERA5 sea-ice albedo αseaice reduction is unremark- ity in MERIS broadband albedo αMERIS at the beginning of
able in comparisons between the ERA5 and MERIS grid cell August 2007 is not reflected in the ERA5 broadband albedo
broadband albedo over first-year ice because it is overlaid by αERA5 .
strong variations in the complement of ERA5 sea-ice con- Towards the beginning of September, the ERA5 sea-ice
centration at the beginning of June and the underestimation concentration c and sea-ice albedo αseaice of multiyear ice in-
of the MERIS grid cell broadband albedo product in May. crease, which compensates for the difference between ERA5
As a result, both grid cell broadband albedo products agree and MERIS grid cell broadband albedo. However, in the 9-
over first-year ice in 2007 and in the 9-year average at the be- year average, lower MERIS grid cell broadband albedo is ob-
ginning of June. The high correlation between the melt pond served as frozen surfaces can be optically darker (Sect. 6.1).
fraction from MERIS and the complement of the ERA5 sea- In the second half of September, MERIS products are no
ice concentration, e.g., over first-year and multiyear ice in longer available because of clouds and solar zenith angles
June 2007, shows the influence of melt ponds on the sea-ice that are too low.
concentration in ERA5.
From mid-June to mid-July, both grid cell broadband
albedo products coincide well over first-year ice in the year
www.the-cryosphere.net/14/165/2020/ The Cryosphere, 14, 165–182, 2020176 C. Pohl et al.: Broadband albedo of Arctic sea ice from MERIS optical data
Figure 5. Grid cell broadband albedo from ERA5 (red) and MERIS (blue), the complement of ERA5 sea-ice fraction (green), and the MERIS
melt pond fraction (cyan) over a first-year ice area in the Beaufort Sea near Utqiaġvik (75◦ N, 155◦ W) (a, c) and a multiyear ice area north
of Greenland (84.5◦ N, 35◦ W) (b, d). Panels (a) and (b) show the values between May and September 2007. Panels (c) and (d) show the
values that were averaged over the years from 2003 to 2011 (points) and their standard deviations (error bars).
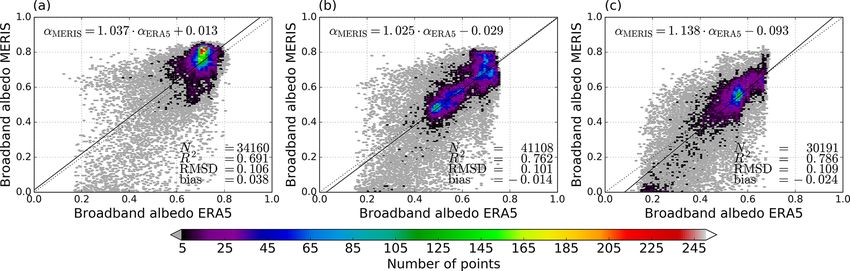
6.3 Spatial differences during melt onset are too low (compare with Fig. 5d). Positive differences are
caused by the melt ponds, which reduce the MERIS broad-
Figure 6 compares daily averaged ERA5 and MERIS grid band albedo αMERIS (compare with Fig. 5c). The differences
cell broadband albedo of Arctic sea ice on 3 individual days between ERA5 and MERIS grid cell broadband albedo are
in June 2007 during melt onset. Cloud-contaminated grid lower on 25 June 2007 (±0.10), after melting has started in
cells in MERIS data are flagged by MPD algorithm and are the whole Arctic.
removed. On 2 June 2007, just a few days before melt on- Scatterplots of both grid cell broadband albedo products
set, ERA5 albedo αERA5 is mostly smaller than the MERIS for the selected days are shown in Fig. 7. To mitigate impacts
albedo αMERIS by up to 0.1 except in the Chukchi Sea, East on differences between both albedo products due to sea-ice
Siberian Sea, and southern Beaufort Sea. As discussed in edge effects, we consider only data at ERA5 sea-ice con-
Sect. 6.2, the ERA5 albedo parameterization with sea-ice centrations c > 0.15 and at distances more than 50 km from
albedo values, αseaice , that are too low, is responsible for coastlines. The correlation of MERIS and ERA5 grid cell
these differences (compare with Fig. 5d). In the Chukchi broadband albedo varies between 0.69 and 0.79. The point
Sea, East Siberian Sea, and southern Beaufort Sea, the melt clusters indicate that in most of the cases high grid cell broad-
pond fraction is higher (0.2 ≤ s ≤ 0.37) than in other Arc- band albedo values from ERA5 are lower than respective
tic regions (s < 0.13, not shown), which leads to MERIS values from MERIS observations. According to Eq. (2), the
albedo αMERIS smaller by up to 0.27 than respective ERA5 highest achievable grid cell broadband albedo is restricted to
albedo values αERA5 . On 12 June 2007, the melting season the albedo of sea ice αseaice at c = 1. This restriction is clearly
started between 120◦ W and 120◦ E, which is clearly visible visible at the cluster borders at high ERA5 grid cell broad-
from the lower ERA5 and MERIS grid cell broadband albedo band albedo values on 12 and 25 June. In contrast, medium
values (0.30–0.60). Although the decrease in the albedo is grid cell broadband albedo values from ERA5 and MERIS
mainly regulated by different parameters (Eqs. 2 and 4), the observations are similar, although the RMSD ≈ 0.10 is more
resulting albedo values are similar. North of Greenland, the than twice as high as the accuracy required for climate stud-
Fram Strait, and Svalbard, ERA5 grid cell broadband albedo ies (0.02–0.05) (Henderson-Sellers and Wilson, 1983; Jacob
remains lower compared to MERIS by values up to 0.19, and Olioso, 2005; Sellers et al., 1995). Low grid cell broad-
whereas it is the opposite between 105 and 160◦ E, as well band albedo values from MERIS are lower than respective
as in the Chukchi Sea, East Siberian Sea, and southern Beau- values from ERA5. However, the small cluster at MERIS
fort Sea. Negative differences are caused by the combination albedo αMERIS ≈ 0 can be incorrectly caused by very high
of ERA5 albedo values of sea ice αseaice and water αwater that
The Cryosphere, 14, 165–182, 2020 www.the-cryosphere.net/14/165/2020/You can also read