Web application for user acquisition through Search Engine Optimization - Department of Computer Science and Engineering
←
→
Page content transcription
If your browser does not render page correctly, please read the page content below

Web application for user
acquisition through Search Engine
Optimization
Department of Computer Science and Engineering
C HALMERS U NIVERSITY OF T ECHNOLOGY
Gothenburg, Sweden 2018
Bachelor’s thesis 2018

Web application for user acquisition
through Search Engine Optimization

           Melina Andersson
             Kristoffer Ek
           Adrian Lindberg
             Long Nguyen
            Alex Sundbäck
          Jonathan Sundkvist
           David Söderberg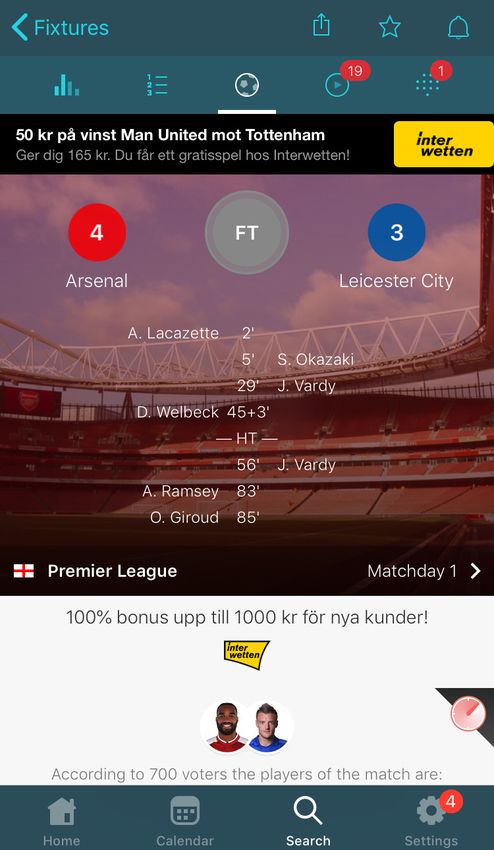
Web application for user acquisition through Search Engine Optimization

©   Melina Andersson, 2018
©   Kristoffer Ek, 2018
©   Adrian Lindberg, 2018
©   Long Nguyen, 2018
©   Alex Sundbäck, 2018
©   Jonathan Sundkvist, 2018
©   David Söderberg, 2018

Supervisor: Olof Torgersson
Associate professor, Interaction Design division, Department of Computer Science
and Engineering.

Examiner: Morten Fjeld
Professor, Interaction Design division, Department of Computer Science and Engi-
neering.

Bachelor’s thesis DATX02-18-18
Department of Computer Science and Engineering
Chalmers University of Technology
SE-412 96 Gothenburg
Telephone +46 31 772 1000

Gothenburg, Sweden 2018

                                                                              iii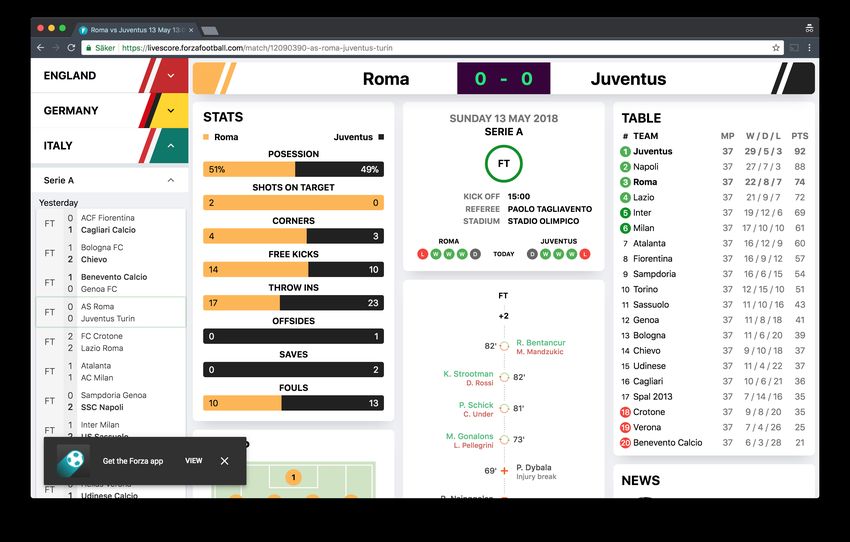
Web application for user acquisition through Search Engine Optimization
Bachelor thesis 2018

Department of Computer Science and Engineering
Chalmers University of Technology

Abstract
The project this theses is based upon aims to develop a web application in order
to study how one can utilize it to acquire new users to a mobile application. This
problem can further be divided into two main areas of investigation. First of all,
how to maximize the incoming traffic to the web application by optimizing the visi-
bility online. Secondly, how to convert visitors into users of the mobile application.
In order to evaluate this in practice, the development of the web application was
done in close collaboration with Forza Football, a company that provides world wide
live coverage and statistics of football leagues with over 2 million monthly mobile
application users. Techniques in the fields of User Acquisition and Search Engine
Optimization were implemented to examine the effectiveness of the strategies re-
searched. Tracking the difference in incoming traffic and user interactions showed
that one of the most important additions to the application was the introduction of
keywords and meta descriptions. Factors such as page loading speed, quality con-
tent and engaging design proved to be successful for both page views and bounce
rate. Even though the deployed application was in an early stage when the results
were measured, the visitors that did visit were from all around the world and had
a sport interest which indicates that the right type of users were attracted. The
results showed that a web application that acquires users to a mobile application is
a promising strategy for a company to grow.

Keywords: user acquisition, SEO, web application, tracking, football, live data, UX

                                                                                    iv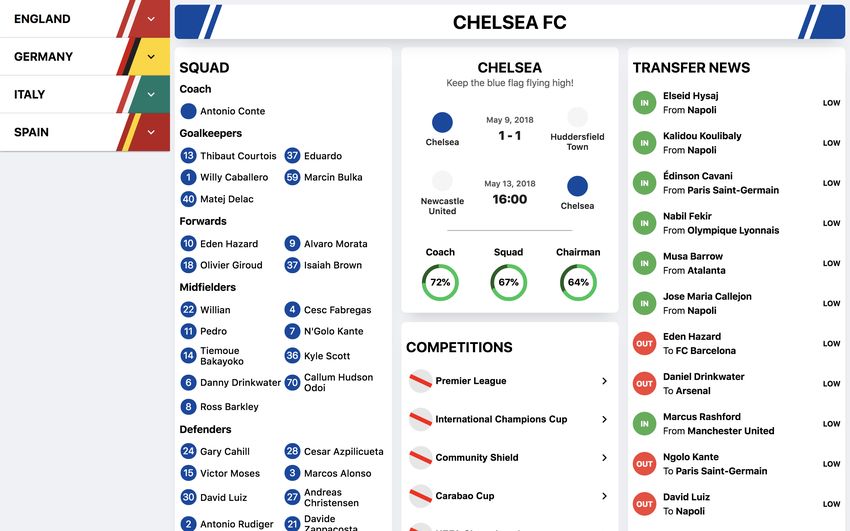
Acknowledgements
We want to thank Forza Football for giving us this opportunity and a special thanks
to Andreas Rolén, Head of Growth at Forza Football, for his contribution.

                                                                                 v
List of Abbreviations
SEO Search Engine Optimization
JSON JavaScript Object Notation
HTML HyperText Markup Language
AWS Amazon Web Services
CSV Comma Separated Values
SQL Structured Query Language
DOM Document Object Model
JSX JavaScript XML
XML EXtensible Markup Language
IDE Integrated Development Environment
SSL Secure Sockets Layer
URL Uniform Resource Locator
UX User eXperience design
REST REpresentational State Transfer
Contents

1 Introduction                                                                                                      1
  1.1 Background . . . . . . . . . . . . . . . . . .       .   .   .   .   .   .   .   .   .   .   .   .   .   .    1
  1.2 Purpose . . . . . . . . . . . . . . . . . . . .      .   .   .   .   .   .   .   .   .   .   .   .   .   .    2
  1.3 Problem Statement . . . . . . . . . . . . . .        .   .   .   .   .   .   .   .   .   .   .   .   .   .    2
       1.3.1 Incoming traffic . . . . . . . . . . . .      .   .   .   .   .   .   .   .   .   .   .   .   .   .    2
       1.3.2 Converting visitors . . . . . . . . . .       .   .   .   .   .   .   .   .   .   .   .   .   .   .    2
       1.3.3 Handling the data . . . . . . . . . . .       .   .   .   .   .   .   .   .   .   .   .   .   .   .    2
       1.3.4 Frameworks, Libraries & Techniques            .   .   .   .   .   .   .   .   .   .   .   .   .   .    3
  1.4 Goals . . . . . . . . . . . . . . . . . . . . . .    .   .   .   .   .   .   .   .   .   .   .   .   .   .    3
  1.5 Delimitations . . . . . . . . . . . . . . . . .      .   .   .   .   .   .   .   .   .   .   .   .   .   .    3
  1.6 Ethical Aspects . . . . . . . . . . . . . . . .      .   .   .   .   .   .   .   .   .   .   .   .   .   .    4

2 Theory                                                                                                            5
  2.1 User acquisition . . . . . . . . . . . . . . .   .   .   .   .   .   .   .   .   .   .   .   .   .   .   .    5
  2.2 User acquisition online . . . . . . . . . . .    .   .   .   .   .   .   .   .   .   .   .   .   .   .   .    5
  2.3 Online strategies for gaining customers . .      .   .   .   .   .   .   .   .   .   .   .   .   .   .   .    6
  2.4 Search Engine Optimization fundamentals          .   .   .   .   .   .   .   .   .   .   .   .   .   .   .    6
      2.4.1 Relevant content . . . . . . . . . .       .   .   .   .   .   .   .   .   .   .   .   .   .   .   .    7
      2.4.2 Outbound and inbound links . . . .         .   .   .   .   .   .   .   .   .   .   .   .   .   .   .    7
      2.4.3 Meta descriptions and title tags . .       .   .   .   .   .   .   .   .   .   .   .   .   .   .   .    7
      2.4.4 Fast page loading speed . . . . . .        .   .   .   .   .   .   .   .   .   .   .   .   .   .   .    7
      2.4.5 Security . . . . . . . . . . . . . . .     .   .   .   .   .   .   .   .   .   .   .   .   .   .   .    8
      2.4.6 Sitemap . . . . . . . . . . . . . . .      .   .   .   .   .   .   .   .   .   .   .   .   .   .   .    8
      2.4.7 Responsiveness . . . . . . . . . . .       .   .   .   .   .   .   .   .   .   .   .   .   .   .   .    8
  2.5 User Experience . . . . . . . . . . . . . . .    .   .   .   .   .   .   .   .   .   .   .   .   .   .   .    8
      2.5.1 Layout . . . . . . . . . . . . . . . .     .   .   .   .   .   .   .   .   .   .   .   .   .   .   .    9
      2.5.2 Mobile Layout . . . . . . . . . . . .      .   .   .   .   .   .   .   .   .   .   .   .   .   .   .    9
      2.5.3 Chunking . . . . . . . . . . . . . .       .   .   .   .   .   .   .   .   .   .   .   .   .   .   .    9
      2.5.4 Mental models . . . . . . . . . . .        .   .   .   .   .   .   .   .   .   .   .   .   .   .   .   10
      2.5.5 Entry points . . . . . . . . . . . . .     .   .   .   .   .   .   .   .   .   .   .   .   .   .   .   10
      2.5.6 Response times . . . . . . . . . . .       .   .   .   .   .   .   .   .   .   .   .   .   .   .   .   10

3 Method                                                                         11
  3.1 Workflow . . . . . . . . . . . . . . . . . . . . . . . . . . . . . . . . . 11

4 Libraries and Tools                                                                                              12

                                                                                                                   vii
Contents

   4.1   Libraries . . . . . . . . . . . .   .   .   .   .   .   .   .   .   .   .   .   .   .   .   .   .   .   .   .   .   .   .    12
         4.1.1 React . . . . . . . . .       .   .   .   .   .   .   .   .   .   .   .   .   .   .   .   .   .   .   .   .   .   .    12
         4.1.2 Next.js . . . . . . . . .     .   .   .   .   .   .   .   .   .   .   .   .   .   .   .   .   .   .   .   .   .   .    12
         4.1.3 Node.js . . . . . . . .       .   .   .   .   .   .   .   .   .   .   .   .   .   .   .   .   .   .   .   .   .   .    12
   4.2   Tools . . . . . . . . . . . . . .   .   .   .   .   .   .   .   .   .   .   .   .   .   .   .   .   .   .   .   .   .   .    13
         4.2.1 Google Analytics . . .        .   .   .   .   .   .   .   .   .   .   .   .   .   .   .   .   .   .   .   .   .   .    13
         4.2.2 MySQL . . . . . . . .         .   .   .   .   .   .   .   .   .   .   .   .   .   .   .   .   .   .   .   .   .   .    13
         4.2.3 GraphQL . . . . . . .         .   .   .   .   .   .   .   .   .   .   .   .   .   .   .   .   .   .   .   .   .   .    13
         4.2.4 Docker . . . . . . . . .      .   .   .   .   .   .   .   .   .   .   .   .   .   .   .   .   .   .   .   .   .   .    14
         4.2.5 Amazon Web Services           .   .   .   .   .   .   .   .   .   .   .   .   .   .   .   .   .   .   .   .   .   .    14
         4.2.6 Service Worker . . . .        .   .   .   .   .   .   .   .   .   .   .   .   .   .   .   .   .   .   .   .   .   .    15

5 Implementation                                                                                                                     16
  5.1 First Iteration . . . . . . . . . . . . . . . . .                      . . . . .           .   .   .   .   .   .   .   .   .   16
      5.1.1 Setting up the database . . . . . . .                            . . . . .           .   .   .   .   .   .   .   .   .   16
      5.1.2 Design 1.0 . . . . . . . . . . . . . . .                         . . . . .           .   .   .   .   .   .   .   .   .   16
      5.1.3 Snackbar . . . . . . . . . . . . . . . .                         . . . . .           .   .   .   .   .   .   .   .   .   18
      5.1.4 Optimizing SEO . . . . . . . . . . .                             . . . . .           .   .   .   .   .   .   .   .   .   19
      5.1.5 Optimizing performance . . . . . . .                             . . . . .           .   .   .   .   .   .   .   .   .   19
      5.1.6 Deploying . . . . . . . . . . . . . . .                          . . . . .           .   .   .   .   .   .   .   .   .   19
  5.2 Second Iteration . . . . . . . . . . . . . . . .                       . . . . .           .   .   .   .   .   .   .   .   .   20
      5.2.1 Design 2.0 . . . . . . . . . . . . . . .                         . . . . .           .   .   .   .   .   .   .   .   .   20
      5.2.2 Fetching live data . . . . . . . . . . .                         . . . . .           .   .   .   .   .   .   .   .   .   21
      5.2.3 Optimizing the GraphQL-wrapper by                                caching             .   .   .   .   .   .   .   .   .   22

6 Result                                                                                                                             24
  6.1 User Interface . . . . . . . . . . . . . . . . . . . . . . . . . . . . . . .                                                   24
      6.1.1 Sidebar . . . . . . . . . . . . . . . . . . . . . . . . . . . . . .                                                      24
      6.1.2 Match view . . . . . . . . . . . . . . . . . . . . . . . . . . . .                                                       25
      6.1.3 Team view . . . . . . . . . . . . . . . . . . . . . . . . . . . . .                                                      27
  6.2 Visibility and Incoming Traffic . . . . . . . . . . . . . . . . . . . . . .                                                    28
      6.2.1 Did it rank highly for core themes and target phrases? . . . .                                                           28
      6.2.2 How much traffic was driven to the site? . . . . . . . . . . . .                                                         30
      6.2.3 Did it attract the target audience? . . . . . . . . . . . . . . .                                                        31
  6.3 Content and User Interactions . . . . . . . . . . . . . . . . . . . . . .                                                      32
      6.3.1 Did the visitors bounce or did they find the content engaging
              and interacted with it? . . . . . . . . . . . . . . . . . . . . . .                                                     32
      6.3.2 Did the content fuel goal completions/conversions or drive sales?                                                         33
      6.3.3 Did the web application perform well enough? . . . . . . . . .                                                            33

7 Discussion                                                                         35
  7.1 User Interface . . . . . . . . . . . . . . . . . . . . . . . . . . . . . . . 35
  7.2 Visibility . . . . . . . . . . . . . . . . . . . . . . . . . . . . . . . . . . 35
  7.3 Handling the Data . . . . . . . . . . . . . . . . . . . . . . . . . . . . 36

8 Conclusion                                                                                                                         38

                                                                                                                                     viii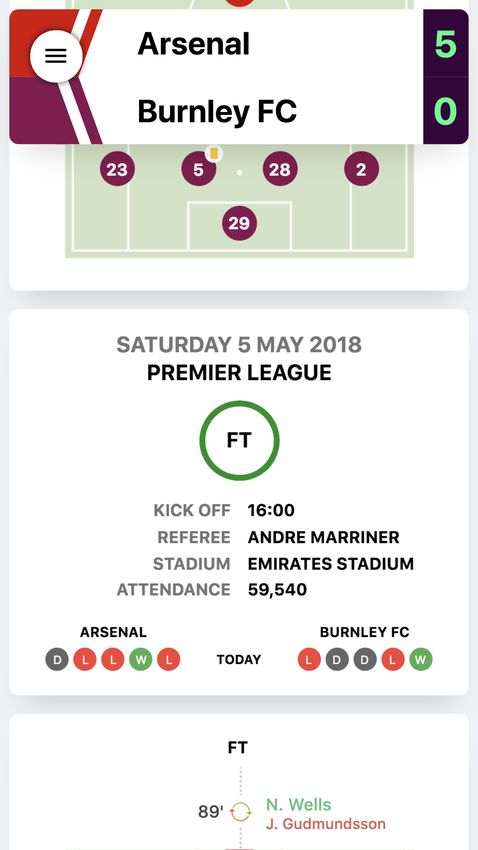
Contents

Bibliography                                                                                                                                      39

A Appendix 1                                                                                                                                        I
  A.1 Feature Branch      .   .   .   .   .   .   .   .   .   .   .   .   .   .   .   .   .   .   .   .   .   .   .   .   .   .   .   .   .   .     I
  A.2 MySQL . . . .       .   .   .   .   .   .   .   .   .   .   .   .   .   .   .   .   .   .   .   .   .   .   .   .   .   .   .   .   .   .     I
  A.3 GraphQL . . .       .   .   .   .   .   .   .   .   .   .   .   .   .   .   .   .   .   .   .   .   .   .   .   .   .   .   .   .   .   .    II
  A.4 Docker . . . . .    .   .   .   .   .   .   .   .   .   .   .   .   .   .   .   .   .   .   .   .   .   .   .   .   .   .   .   .   .   .    II
  A.5 Figures . . . . .   .   .   .   .   .   .   .   .   .   .   .   .   .   .   .   .   .   .   .   .   .   .   .   .   .   .   .   .   .   .   III

                                                                                                                                                  ix
1
Introduction
Nowadays, football fans have a wide variety of mobile applications to choose from
in order to keep track of results, upcoming matches and statistics. When not being
able to follow games from the stands or on TV they instead rely on mobile devices to
keep track of real-time events and statistics. These applications are in general free
of charge but expose the user to advertisements from which the companies generate
income. Therefore, the companies rely on not only a stable user base but also on the
acquisition of new users in order to increase their revenue. One of the methods used
to gain new users is to provide a web application with some of the functionality
found in the mobile application. The companies can then increase their revenue
by the use of advertisements on the web application or by encouraging the user to
download the application.
1.1 Background
Gothenburg based company Forza Football provides one of many options when it
comes to mobile applications providing football related statistics. They started out
in 2012 with a web-based product but quickly shifted to only having mobile appli-
cations for iOS and Android. The reason was the tougher competition on the web
and a faster-growing user base on mobile. Today, they have over ten mobile appli-
cations with the application called Forza being the most popular one providing live
coverage and statistics for more than 800 different tournaments around the world[1].
Despite already having a large number of users they, like most companies, strive
for growth. One of the methods for acquiring users is the use of web applications.
With over four billion active internet users worldwide[2], a company with no dig-
ital presence is close to non-existent. Forza Football’s current website only serves
a branding and marketing purpose. In other words, none of their data concern-
ing football is available on the web which implies that valuable internet traffic and
searches regarding football are missed out on.
Forza Football has realized that one way to grow their user base is by extend-
ing their web presence with a web application containing some of the functionality
found in their mobile application. Thus, when a user searches on a search engine for
a key-phrase like “Arsenal vs. Manchester United”, the web application in question
should appear as an alternative among the result. Intrigued by the functionality
and experience, the ultimate goal is that the user downloads and starts using the
11. Introduction
mobile application.
This thesis will cover the development of such a web application. The develop-
ment was done in close collaboration with Forza Football who provided the data
necessary and technical advice when required.
1.2 Purpose
The purpose of this thesis is to investigate how a web application can be utilized to
acquire new users to a mobile application. In order to achieve this, the implemen-
tation of the web application will focus on two different areas. First of all, having
a widespread visibility online so that new users will find the web application. Sec-
ondly, providing content and a user experience that encourages users to download
the mobile application.
1.3 Problem Statement
The main problem is how to construct a web application to acquire new users to
a mobile application in the most efficient way. This problem can be derived into
several sub-problems.
1.3.1 Incoming traffic
A high amount of incoming traffic is beneficial for a web application of this project’s
purpose. Thus, questions like "how does one rank high in a search engine" and "which
keywords/key-phrases does one want to focus on" need to be further investigated.
The basic functionality of search engines and especially how they index pages have
to be taken into consideration throughout the whole development process.
1.3.2 Converting visitors
Converting visitors to become users of the mobile application is crucial in order to
fulfill the purpose of the project. How does one construct a web application to make
the user want to download the mobile application? Further investigation has to be
put into what key factors are important in order to convert the users.
1.3.3 Handling the data
The data provided from Forza Football contains information about the four greatest
football leagues in Europe, namely Premier League (England), Bundesliga (Ger-
many), Serie A (Italy) and La Liga (Spain). All information about the matches,
players and teams are covered in the data. How does this data gets converted to a
fully working web application?
21. Introduction
1.3.4 Frameworks, Libraries & Techniques
Today, there are thousands of frameworks and libraries that can be used in the con-
text of a web application. Many of them solve the same problem but with different
approaches. Which approaches are best suited for this particular case?
Another problem with the implementation of the web application is how to approach
the difficulties with real-time data. Are there any libraries which can be helpful?
How will the page update itself when it receives new data? What is considered best
practice when dealing with real-time systems?
1.4 Goals
Together with our supervisor at Forza Football, six goals were stated at the start of
the project. These goals were based on research and experience from our supervisor,
whose main area is company growth.
• Web application appears on at least the 2nd page when searching for a random
match (within the scope of the project) on Google
• Web application appears on at least the 3rd page when searching for a random
team (within the scope of the project) on Google
• Web application appears on at least the 3rd page when searching for a random
player (within the scope of the project) on Google
• Web application appears on at least the 4th page when searching for a random
tournament (within the scope of the project) on Google
• 3% of the visitors of the page go to the App Store page for the Forza applica-
tion.
• 25% that goes to App Store downloads the Forza application.
1.5 Delimitations
The web application will focus on matches, teams, players and tournaments. The
search queries considered relevant to the problem statement, and ultimately the
result, are restrained to these areas only, and not for queries concerning e.g. football
related news. Further delimitations have been made when it comes to the web
application’s rank on said target queries. Depending on the search query the goal
has been to appear on one of the four first result pages. This is motivated by
the fact that there are plenty of well-established companies and media houses that
already provide the same services as this particular web application. Therefore, it’s
unreasonable to expect to outrank these within the time-frame of this project. Due
to Google’s market dominance, the web application will be developed with their
guidelines in mind. Furthermore, all queries made for the sake of analyzing the web
application’s progress and result concerning SEO will be using their search engine.
31. Introduction
1.6 Ethical Aspects
In order to gather data on for example how many visitors arrive to the web app
or on how many stay, tracking analytics is used. The collected tracking data is
anonymized and the analytics service does not save IP-addresses (Internet Protocol
address) or MAC-addresses (Media Access Control address) so there is no direct
connection with data to an individual.
42
Theory
The result of the project is dependant on choices made in terms of how to ap-
proach User Acquisition as well as Search Engine Optimization. Therefore, studies
is required in these areas. This chapter will cover the theory found relevant to the
purpose of the project.
2.1 User acquisition
Every business requires customers in order to survive, this involves acquiring new
customers as well as ensuring the return of current customers. This is often referred
to as “customer acquisition”, or in this case user acquisition, since the customers of
the web application are not paying for a product or service directly[3]. Instead, their
usage of the application, in this case the downloading and usage of the Forza mobile
application through the web application, generates income from advertisements.
What makes customer acquisition relevant is that it is one of the most cost-effective
ways to increase growth rapidly[3].
2.2 User acquisition online
In order for a business to be found by customers, marketing is often required in
some way. Marketing is commonly divided into two categories: inbound and out-
bound. Outbound marketing consists of trying to gain new customers by paying for
advertisements on different channels such as TV, newspapers or websites in order
to “push” a product or service onto people. Inbound marketing, on the other hand,
is focusing on the quality of the content to be satisfying enough to acquire the cus-
tomers on its own[4]. If this can be done, the customer is more likely to remain a
customer to a lower cost than traditional marketing such as advertisements. There-
fore, the focus in this project will be on this form of marketing.
Focusing on inbound marketing, the main question is how the customers are sup-
posed to find quality content when they are not aware of its existence. Today, search
engines are used around the world in order to find content online for specific key-
words. Around 3.5 billion searches are made every day on Google, the most used
search engine online[5]. The problem for today’s businesses is that there might be
billions of results for every search, making it difficult to be found by the customers.
52. Theory
This is where SEO comes into play. The search engines organize the results accord-
ing to the content on websites in order to display the most relevant pages first. SEO
are techniques for optimizing the content on a website to reach the top of that list
of results, and by that acquire visits from the users searching[6].
2.3 Online strategies for gaining customers
SEO can be utilized to gain new customers, but how should the optimization be done
on a website in order for it to be considered relevant by the search engines? How
do search engines work and what do their algorithms take into consideration when
indexing millions of sites? These are not easy questions since the answer varies from
search engine to search engine, and also changes over time. Another thing to consider
when optimizing a site for search engines is that the terms searched for by the users
are unknown. It is possible to look at statistics over common search terms but they
will be historical, users will not necessarily search in the same patterns in the future.
Knowing that these search terms are changing continuously and how crucial they
are, SEO becomes one key to success in gaining new customers. However, it does
not ensure any loyalty of the customers visiting the website. After all, the goal of
this project is to acquire more users to Forza’s mobile application. Therefore, the
quality of the content is important, and a tool to find out if the content on a website
is good or not is the use of tracking. Tracking, in this case, means collecting data
on the user’s actions while using the page, but also before entering and leaving it[7].
The tracking data might contain anything from what the keywords searched for
was, what nationality the user had, how the user navigated the application as well
as how long the user stayed on the page. Gathering information like this helps to
improve the content and layout, due to the possibility to see the result from various
theories and techniques. As a result, the improved content helps to create satisfied
and thereby loyal customers.
2.4 Search Engine Optimization fundamentals
As mentioned earlier, the best practices regarding SEO are not consistent. Since
different algorithms are used by different search engines and they often change, the
implementation of SEO in this project is focused on the guidelines from Google the
dominating search engine with almost 92% of the world’s market share[8]. Due to
this Google has a great impact on the practices of SEO and should therefore be
taken into consideration.
The most general guidelines[9] that have been taken into account in this project
are:
• Relevant content
• Relevant keywords in URL, titles and text
• Outbound and inbound links
• Meta tags and meta descriptions
• Fast page loading speed
62. Theory
• Responsiveness
2.4.1 Relevant content
What defines relevant content and keywords in URL, titles and text? Instead of
asking every user whether or not they found the content relevant, measuring the
time a visitor spent on a web page gives an indication. If users stay on a web page
longer this indicates that they find the content engaging and valuable which in turn
indicates to the search engine that the page should be ranked higher. Since search
engines mainly generate profit by selling advertisements and promoting results[10],
the more traffic they receive, the more money they make. Hence, they strive to
optimize the search results for users in order for them to continue using their service.
Analyzing the time spent on a web page is one way to measure how relevant a web
page is, another is to measure bounce rates. The bounce rate is the percentage of
single-page sessions in which there was no interaction with the page[11].
2.4.2 Outbound and inbound links
Outbound, inbound and internal links are also part of the ranking system. This can
be thought of as a graph, where each node is a website and each edge is a link to
that website from another website. A link from a website to another is called an
inbound link. Each edge has a value representing its importance, for example, a
link from a highly visited site like www.bbc.com is valued more than a link from a
less visited site like a blog or a company’s homepage. Many links from quality sites
will increase the ranking of the site being linked to[12]. Furthermore, links from a
website to other websites, so called outbound links, is profitable for SEO. A search
engine will interpret a website as a source of information and will rank it higher
than websites that lack outbound links.
2.4.3 Meta descriptions and title tags
When a search engine crawls (analyzes the content of a web page) it uses its meta
description and title tags in order to decide if the content is of relevance or not
for the user[13]. The former describe and summarize the data on a specific page
as accurately as possible with the aid of keywords and relevant phrases[14]. If the
content on separate pages varies on a website, the meta descriptions should be
dynamic and vary accordingly. Title tags, one of the most important components
of good SEO are also meta descriptions that won’t appear on the actual page[15].
However, they can be seen at the result page of a Google search and at the top of
the browser if the page is entered.
2.4.4 Fast page loading speed
In 2010 Google announced that they take page loading speed into account when
ranking websites, making a slow website being valued lower than a faster one[16].
According to Google’s internal studies, a visitor spends less time on a website if it is
72. Theory
responding slowly, so by promoting websites that respond faster search engines will
increase the satisfaction of their users and in turn also their own revenue.
2.4.5 Security
SEO can be boosted by making sure the web page is safe and encrypted. This
reduces the chance that a leak would occur, and if it did, no registered users would
be affected. This is done by SSL (Secure Sockets Layer) which encrypts all traffic
from and to a website. In 2014 Google posted on their online security blog that
they started taking SSL usage in their ranking algorithm which will actively worsen
non-SSL websites rankings[17].
2.4.6 Sitemap
A sitemap is a file, usually written in XML-format, which specifies the structure of
a web application. This makes sure that search engines do not forget to crawl any
of its pages, which is helpful when there is not a lot of external links referring to the
site[18].
2.4.7 Responsiveness
Google themselves has, in their developer pages, explained that they prefer respon-
sive design rather than web pages designed for mobile with another URL[19]. Non-
responsive web pages usually have a URL similar to m.example.com, which is a
mobile designed version of the web page. The benefits of responsive design, accord-
ing to Google, is that it helps their algorithms with indexing properties of the page
and saves time when the crawler does not have to visit a mobile version as well[19].
A responsive design combined with a fast page loading speed provides an improved
user experience.
2.5 User Experience
Even though there is no exact definition of User Experience (UX), the consensus is
that it is the process of designing a product with the user in mind with the ultimate
goal to provide a pleasant experience[20][21]. This experience should be in line with
the user’s expectations of the web application when it comes to both content and
behavior. In this case, it is reasonable to assume that a visitor is looking for live
updates or statistics on a match, scheduled for a specific team, info about a tourna-
ment or similar. With this in mind, the challenge is how to present this information
in an intuitive way.
A term often used when talking about the user experience is the cognitive load
which refers to the amount of brain power a user have to utilize in order to process
the presented information[22]. The cognitive load imposed on the user should be
minimized and there are plenty of techniques one can use to achieve this. With
the nature of the proposed web application in mind, especially its vast amount of
82. Theory
data, there were certain aspects of the UX that would be of special importance:
organization of the data and simple navigation between entities.
2.5.1 Layout
With the events, positions and statistics being the most important components of an
entity within the web application it was desired to put most of the visual emphasis
on these elements when designing the layout. But when lacking data on what
content that would be of most interest to the users it is important not to create an
imbalance in the way the content is presented and highlighted. Two common design
patterns that can be utilized in such situations are Center Stage and Grid of Equals.
Center Stage is used when some content is central to the interface. It is implemented
by dedicating a majority of the available space to its most significant content and
placed in such a way that it cannot be missed. Grid of Equals, on the contrary, is
implemented by organizing content in a grid layout and giving every item the same
visual weight, indicating that they have the same importance[23]. Combining these
by putting a Grid of Equals within a Center Stage communicates to the user that
the centred items are important but at the same time of equal importance relative
to each other. However, Centre Stage and a grid with multiple columns is only
fitting when the browser or screens size allows it. When visiting the web application
with a smaller browser size or on a mobile device the layout would have to adjust
dynamically to the screen size (see section 2.5.6).
2.5.2 Mobile Layout
If a user visits the web application on a mobile device, or just wish to scale down
their web browser, the web application should have to adjust accordingly. With
limited screen size, the design will have to be presented with remembrance. A
common design pattern to use when dealing with narrow screen widths is Vertical
Stack where content, otherwise placed side by side, is stacked vertically[23]. The
content should be placed in a logical order so that the most interesting items are
placed at the beginning of the stack. If a sidebar is included in the design it should be
hidden until actively called into view by the user in order to keep focus on the main
content. However, it is important to somehow indicate that the sidebar actually is
available to the user[24].
2.5.3 Chunking
Chunking is the concept of splitting up the content of the graphical interface into
smaller pieces. This makes it easier for the users to process the content since they
will not have to memorize all of it at the same time. By chunking and grouping
specific content in a logical way the user can focus on the most interesting parts
momentarily[25]. In this web application, this could mean that statistics and line-
ups for a match are grouped separately within a match page since they are not
directly connected but both still important aspects of a match.
92. Theory
2.5.4 Mental models
One of the most important aspects to consider when designing an interface is the
users’ preexisting mental models. Mental models can be described as how the users
believe and/or expect a web page to behave when interacting with it. These mental
models are formed from previous experiences with other websites[26]. For example,
web shops often use the design pattern Feature, Search, Browse which includes a
sidebar, a header with a search field and a centred main view with the product[23].
Since many web shops use this layout, deviating from it is likely to go against the
user’s mental model and therefore increase the cognitive load.
2.5.5 Entry points
For someone unfamiliar with the web application it is desirable to make the layout as
intuitive and easy to use as possible. This is of special importance when presenting
the user with a lot of information and options[23]. In these cases, it should be obvious
to the user what every choice will result in and how to reach their objective. A visitor
to this particular web application is likely to be interested in a specific match, but
might also want to get updates on a related one. Therefore it’s important to design
the layout in a way that follows the users mental model as accurately as possible to
minimize cognitive load when navigating to another match or entity entirely.
2.5.6 Response times
With broadband and fast internet connection being common, internet users are used
to short load time and seamless navigation. Thus, having a web application that
forces the user to wait longer than even just a few seconds for its content to load is
likely to cause disruption and frustration[27]. In order to keep the waiting short, it
is important to not overload the interface with for example unnecessary animations
or large image files.
103
Method
3.1 Workflow
During the entire thesis, the team worked agile in weekly sprints with every week
starting with a meeting at Forza Football to discuss the progress. Since the purpose
of the project was to acquire new users to the mobile application, an important step
in the process was to retrieve data early on for benchmarking purpose. Therefore,
an initial decision that the development of the web application should be divided
into two larger iterations was made. The first iteration would present a simple initial
sketch of the web application given the first data provided by Forza Football. Since
the data did not include any live score or recent information, the focus was instead
put on building a good infrastructure and start tracking, as well as measuring the
website traffic. With that in place, the second iteration would shift focus to devel-
oping and implementing a new design with better and richer content including live
result and current news. This would be built on top of the infrastructure from the
first iteration.
As mentioned above, the team carrying out this project has worked according to an
agile working method called Scrum. Agile workflow is about dividing the project
into multiple smaller steps so there can be a continuous delivery from the start in-
stead of delivering everything in the end. Moreover, Scrum is an approach where
the team works in sprints that are set to a given length that suits the projects time
plan, in the case of this project the sprints is set to one week. Each sprint, in
this case each week, starts with a meeting where the team together with a Scrum
leader plans the following week by prioritizing which tasks that needs and can be
implemented[28]. Additionally, to facilitate the development process, a workflow
called Feature Branch has been used continuously throughout the project. This
workflow is further explained in Appendix A.2.
114
Libraries and Tools
This chapter describes how libraries and tools were used to benefit the develop-
ment of the web application. Using libraries saves time when one does not need to
reinvent the wheel. The tools helped with organizing data and creating a uniform
environment for the developers.
4.1 Libraries
4.1.1 React
One of the frameworks used were React that is developed by Facebook Open Source[29].
React compiles JavaScript code into HTML on the client. The usage of React in
this project was partly because of its capabilities for scalable web applications, but
also because it is one of the fastest web frameworks with its use of Virtual DOM.
DOM, which stands for Document Object Model, is a programming interface that
represents the structure of a web page as nodes and objects[30]. Virtual DOM is a
copy of the DOM in a browser. Basically, when a change is made React checks the
difference between the Virtual and the real DOM and only updates the elements
in the latter that have been updated in Virtual DOM. This makes React very fast
compared to other frameworks that update the whole page every time a change
is made. As mentioned earlier, fast page loading speed is one of the factors that
improve user satisfaction which made React suitable for this project.
4.1.2 Next.js
Another technique that decreases the page loading time is server-side rendering.
Server-side rendering is when the code gets executed on the server and sends the
result back to the client. Normally, JavaScript code is compiled into HTML files on
the client, with client-side rendering, but server-side rendering compiles JavaScript
into HTML on the server. In order to implement server-side rendering a JavaScript
library called Next.js were used. Next.js is a framework developed by Zeit made for
server-rendering or statically-exporting React Applications[31].
4.1.3 Node.js
Node.js is an open-source and cross-platform environment that executes JavaScript
server-side and is mainly used to create web applications[32]. Node.js is a great
platform for basing a JavaScript web application on because of it’s vast supply of
124. Libraries and Tools
libraries that can be used. Together with Express, a web application framework for
Node.js, a reliable back-end API can be built which also provides a feature that
automatically transforms SQL-files from MySQL database into JSON-object for the
web application.
4.2 Tools
4.2.1 Google Analytics
Some tools were used for measuring how successful the web application was at
its tasks. A tool for measuring user tracking was Google Analytics[33]. Google
Analytics is capable to track actions on the page as well as measuring where the
visitor came from before visiting the page. This project used tracking for measuring
how many visitors that went to download Forza application. This was done with
a simple event tracker when clicking on a link to App Store/Google Play or for
Desktop users; Forza’s homepage. An event tracker fires an event when the visitor,
for example, presses a link. The request is then sent to a category, label and a value
(optional). With that data, it becomes easier to see where visitors click and to find
faults in the design. The data makes it possible to map out deviations and check
where the average visitor clicks first and so forth.
4.2.2 MySQL
Since a stable and efficient database is preferable for any web application, several
alternatives were discussed in an early stage of the project. At the beginning of the
development the data received from Forza was a SQL dump. A SQL dump con-
tains all the data from the whole database in form of a list of SQL statements. The
database system chosen was finally MySQL since it is one of the most used relational
database systems, both at Forza and globally. For more detailed information about
MySQL, see Appendix A.2.
The main reason why the database has a critical role in both the development
of the web application and SEO, is beacuse server-side rendering depends a lot on
it. A stable and efficient database ensures the possibility for the search engine to
index and crawl the pages, which grants the pages a higher ranking result. By con-
taining all necessary data, the database helps to solve the problem of generating
new pages as well as erasing and adjusting old pages when new data is provided
by Forza Football. Later on, having access to Forza Football’s API together with
the database eliminates the demand of waiting for new data before performing any
adjustment. This establishes an automatic process of fetching new slow-data and
adjusting after changes of the web application.
4.2.3 GraphQL
The query language GraphQL was used in this project. More information about
GraphQL may be found in Appendix A.3. The differences between the data provided
134. Libraries and Tools
with MySQL (slow data) and the data provided with GraphQL (live data) are mainly
that the slow data is used to build the structure of the application, by building
routes that are available for the user to visit. Therefore, this data should contain
the necessary data to make an initial render of the web application, and provide
the data needed that’s used by the meta tags. For example, if a match-page should
render some slow data, it needs basic relevant information about the match, such
as the ID of a match, when the match is bound to start and which teams that are
playing. The slow data doesn’t need to update often since the basic data about
the matches doesn’t change frequently. The live data, however, includes all content
about the current state of the match, for example the match score, live news and
statistics. In the GraphQL-wrapper that’s used in this project, it’s also possible for
the client to subscribe for new live events, which means that the client automatically
gets updated when the GraphQL-wrapper receives new data.
4.2.4 Docker
For many reasons, maintaining a similar development environment might be trou-
blesome and expensive, especially when different types of operative system and hard
wares are in use. The reason is that the above-named differences might cause multi-
ple problems. Therefore, Docker is in use in order to construct a similar and smooth
development environment for all the developers. How Docker works is explained in
Appendix A.4.
4.2.5 Amazon Web Services
Amazon Web Services (AWS) is a part of the online shopping company Amazon
that provides on-demand cloud computing platforms[35]. With over one million
customers, including well-known companies like Spotify, Airbnb and Yelp[36], AWS
contains more than 90 services that should include everything needed to build a
desired IT infrastructure. These services are implemented in server farms placed
around the world that is maintained by Amazon. Amazon is then charging their
customers based on usage and what kind of service that’s being used. Data from the
first quarter of 2018 shows that AWS owns 33% of all cloud hosting in the world[37].
One of the services that were used during the project is called Amazon S3. S3 is an
object storage where it’s possible to store any amount of any data. This is one of
the most popular services that AWS are providing[38] since it’s a service that suits
a wide range of customers, no matter if there are individuals who only want to store
a small website to companies that want to store a large amount of data. During the
project, S3 was mainly used to store SQL-dumps that the web application lately
used for its rebuilds.
To host the project, both the web application and the GraphQL-server, a service
called AWS Elastic Beanstalk was used. AWS Elastic Beanstalk handles automati-
cally how many cloud computing instances that are needed for the application to run
smoothly for every visitor, which is also known as auto-scaling. The cloud computer
144. Libraries and Tools
instances for this project is called AWS EC2.
An important step of the deployment process was to find a simple way of transfer-
ring the Docker containers that were created on the team’s local machines, to AWS
and the EC2 instances. To achieve this bridge, AWS Elastic Container Registry
(ECR) was used. ECR is a service that makes it possible for the local machines to
push their Docker containers to a container registry. ECR then notices that a new
version of the application was pushed, and tries to deploy that version to the AWS
Elastic Beanstalk (described above). If the team happened to push a broken Docker
container that didn’t work out as expected, ECR made it really simple to roll back
to an older version of the application that the team knew was working.
Lastly, a service called Amazon CloudFront is used as a content delivery network
(CDN). A CDN is a network of proxy servers placed in different places around the
world, which delivers the content to the users as fast as possible by using the local
cache of static content. In the project, all images are cached for 30 days which makes
the delivery of these images faster. CloudFront also makes sure that the custom
domain of the application, livescore.forzafootball.com, is pointing correctly to
the Elastic Beanstalk application.
4.2.6 Service Worker
In order to deliver content to the user, regardless of the user network state, a script
called Service Worker was used. A Service Worker is a proxy that is placed between
the web application and the user’s network, making it possible to control network
requests and respond to them in different ways[39]. Therefore, a service worker is
able to provide the user with a cached version of the web application if the user’s
network connection is unavailable. This delivery of cached content is made without
the user’s device being connected to the server that is hosting the application, which
saves a great number of network requests to the server and also increases the user’s
performance.
155
Implementation
This chapter is a somewhat chronological description of the process of implement-
ing the web application. It will not include technical descriptions of any libraries,
frameworks or tools that have been used but rather refer to appropriate section in
the Libraries and Tools chapter whenever needed.
5.1 First Iteration
The following sub-sections describes implementation steps in the first iteration.
5.1.1 Setting up the database
The focus during the first iteration was mostly on building a steady project structure
as well as putting up a database and adjust it to the format of Forza’s data. During
the project, this was done using a MySQL database and the data were provided by
Forza in .sql-format, which made it simple to import the data. With the database
up and running, the next step was to provide an easy way to access it when building
the actual web application. Based on the data in the database it was now possible to
define all available URL-routes. A simple REST-API[40] was created by specifying
some of these routes that presented the data from the database in JSON-format,
which would be the format used when building the front-end of the web applica-
tion. The REST-API was defined using Node.js (see section 4 Libraries). The use
of a REST-API also prevent SQL-queries from being sent directly to the database
which could possibly be a security issue since hackers then could get a dump of the
database content by performing a SQL injection.
5.1.2 Design 1.0
The provided data during the first iteration was limited to a small selection of
matches from a single league, and because of this, designing the page was a chal-
lenge. A major part of the pages was empty, without any data to show (see figure
5.1). The design was based on the research on UX but inspiration was also found in
the mobile application (see figure 5.2). This was because at first the web application
was merely considered an extension of the application. The main components of the
first design were:
165. Implementation
• A sidebar containing relevant matches to choose from.
• A main container showing the content of the selected match, tournament or
player. This component could be divided into three sub-components:
– A ’jumbotron’ at the top of the page, showing the most relevant infor-
mation for the current page.
– A navbar to enable logical grouping of different information
– A container showing information depending on the selected tab in the
navbar.
The choice of having a sidebar displaying matches originated from the design of the
mobile application where the list of matches was considered the ’homepage’ and the
main mean of navigation between matches. Due to the possibilities of the larger for-
mat of a web browser compared to a mobile device, it was decided that the sidebar
should be statically placed on the left side of the page as long as the screen width
was sufficient. This choice was further founded in the theory concerning mental
models and entry points since sidebars are a common mean of global navigation and
by always making it accessible the user wouldn’t get lost. If the web browser would
be scaled down or viewed on a mobile device, the sidebar would be hidden until the
user actively chose to show it again.
The disposition of the main component in relation to the sidebar followed the Center
Stage design pattern. 80% of the screen width was assigned to the former making
it the dominant section of the interface. Its sub-components followed the arrange-
ment of the mobile application and the idea was that the layout would remain the
same even when the content changed in order to minimize cognitive load for the user.
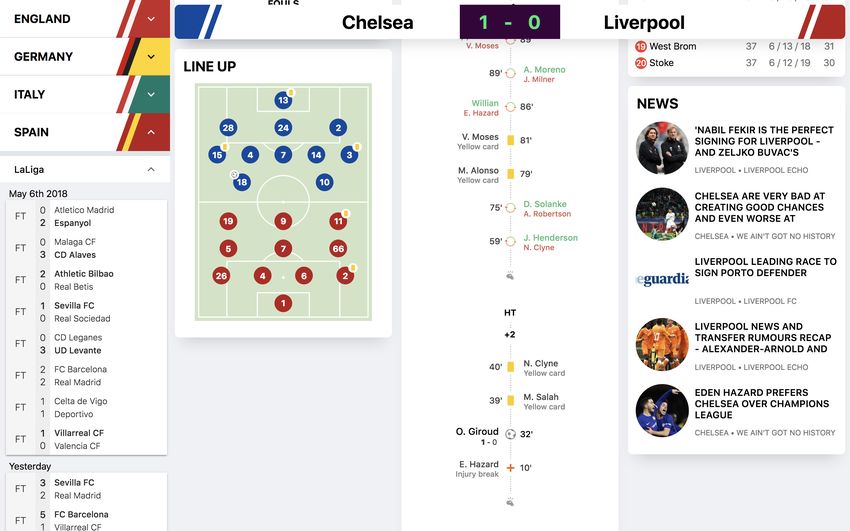
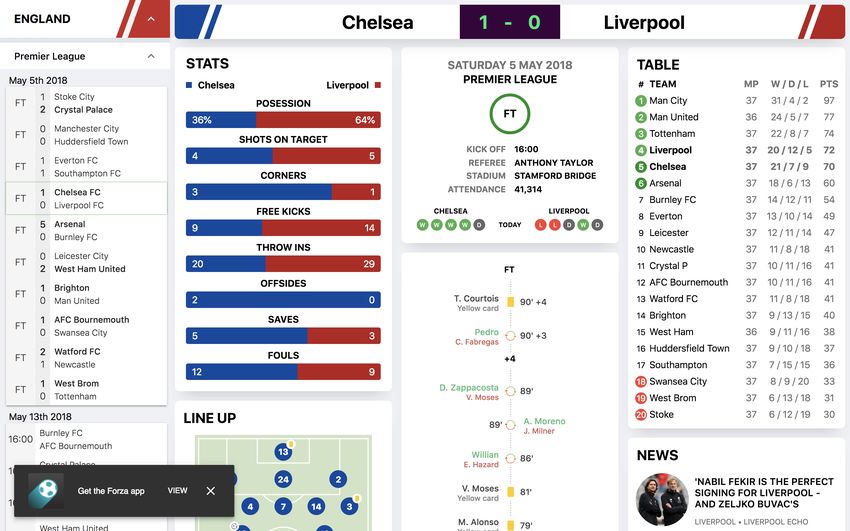
Figure 5.1: The first iteration of the web application
175. Implementation
Figure 5.2: Forza Football’s mobile application
The next step was to implement the design and build the actual web application.
It was decided to use the JavaScript framework React (see section 4 Libraries).
Moreover, one of the goals stated at the beginning of the project was that the web
applications should rank high on search engines as early as possible in order to be
able to measure and compare results at the end of the project. In order to achieve
this, the web application would have to be built with SEO in mind from the start.
This objective became a challenge since all search engines were not able to crawl
data from a web application built with JavaScript based frameworks such as React.
To solve this problem it was decided to use Next.js (see section 4 Libraries), when
approaching this challenge. This made it possible to server-side render the data
straight away using one of the framework’s function, which executes on the server
and returns a populated page to the client.
5.1.3 Snackbar
The most crucial component of the web application was the so called snackbar,
seen at the bottom left of figure 5.1. The snackbar should appear for the user with
a given interval and present the suggestion of downloading the mobile application.
When clicked on in desktop mode, the user would be redirected to Forza Football’s
website, specifically the sub-page highlighting the content of the mobile application.
185. Implementation
On mobile devices, the snackbar would appear at the top of the screen and redirect
the user directly to App Store/Google Play or if the user already has the applica-
tion installed, to the corresponding page within the application. However, it was
important not to spam the user with the snackbar every single session since that
could prove counterproductive due to irritation and thus negatively impact UX and
consequently the SEO. To avoid such scenario the snackbar is only shown once every
session start.
5.1.4 Optimizing SEO
In parallel to implementing the front-end of the web application, crucial changes
were made to the inner logic of it. For the sake of SEO, methods for generating
dynamic meta descriptions, title tags and URL:s were implemented. For example,
for a match page, the meta description would be customized to include the teams
involved, the tournament they play in, the date and phrases stating that the content
also includes stats and news among other content. The URL for every page of the
web application was also customized and given appropriate formatting so it would
be as descriptive and accurate as possible based on its content. Furthermore, using
the given data in the database, a sitemap for every single page that was available
for the user could be created. Since the web application would be brand new this
was crucial since there would not be any external links to it initially and therefore
search engines might overlook some of the available content when crawling the page.
5.1.5 Optimizing performance
By the end of the iteration, it was decided that the web application would use the
system font instead of a custom one. The motivation for this choice was to improve
performance and response times since the site no longer would require downloading
a custom font for its pages.[41] This, in turn, would lead to better SEO since site
performance is another factor search engines take into account when indexing web
pages. Additionally, better response time improves the UX which long-term also
boosts SEO.
5.1.6 Deploying
A crucial part of the project was to set up a simple way of transferring the project
from the team’s local machines to the servers that hosted the project. Since all of
the team members used Docker containers to develop, everyone in the team worked
with the same environment which gave confidence that it should work with the
same result for everyone. The best way to deploy this project would, therefore,
be to transfer the Docker containers to the hosting cloud computers to ensure the
desired result after deploying. However, the Docker containers used during develop-
ment was unnecessarily big in memory size, since they contained a lot of debugging
and development-specific tools that weren’t needed in production.
To solve this issue, two Dockerfiles were written. Both of them were based on Node
9.5 Alpine[42], but in the production-ready Dockerfile only the actually necessary
195. Implementation
packages needed for the container was installed. In the development container, the
desired feature would, for instance, be to auto reload the application when any file
in the project was changed. However, this was not a feature that would be needed in
production and therefore it was never installed in the production-based Dockerfile
to keep the Docker container as slim as possible.
The only thing left after building the docker containers is to ship the production-
built Docker-container to the cloud computers. This was done using the AWS Elas-
tic Container Registry (ECR). AWS ECR simplified the process of letting the team
build the containers on their local machines, and then push them over to a registry
that was hosted by AWS. When this push was completed, ECR automatically han-
dled the new container and deployed it to the cloud computing instances.
5.2 Second Iteration
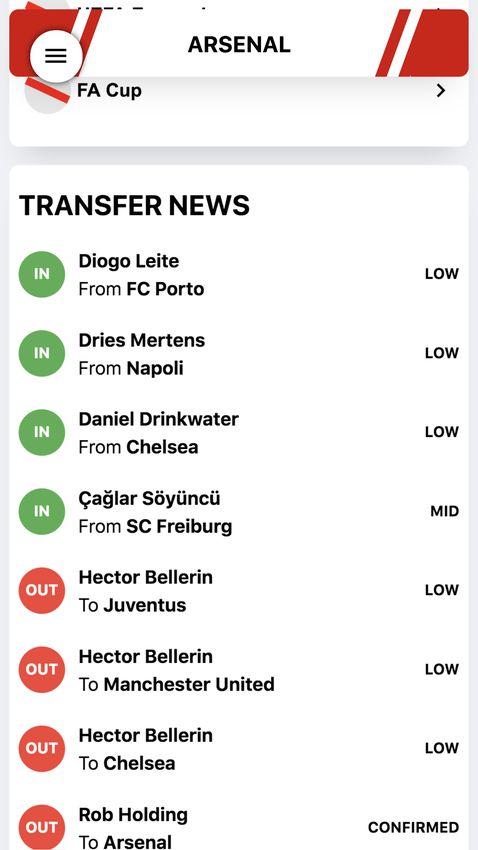
5.2.1 Design 2.0
The purpose of the second iteration was to enrich both the UX and the design as
well as the content. In order to achieve and fulfill the purpose, a brand new design
was implemented (see Figure 5.3). The design had features that would enrich the
content and make the UX a lot more comprehensive and understandable. Along
with the development of the new design, Forza provided more real-time data which
made it possible to provide content that is useful for the users of the web application.
In the new design, it was decided to keep the fundamental layout with a sidebar and
a dominating main component. However, the inner layout of the main component
was changed. Instead of showing specific content depending on the state of a navbar
it was decided to show all of the content at the same time. This put a demand on
a well thought through organization of said content as not to clutter the interface.
This was achieved by implementing a card layout where the available data for an
entity was grouped into separate cards with the same shape and graphical profile.
These cards were put into a grid following the Grid of Equals design pattern with
one exception, namely that the cards were positioned in a predefined way for the
specific entity. For example at a match page, the time and match events were put
in the top middle section since these are the most central aspects of a match. Fur-
thermore, if the data for a card would be unavailable the card would simply not be
rendered on the interface and thus make sure that the content is relevant at any
given time. This was also an advantage from a developer’s perspective since it made
the code more modular. For example, if new content has to be added in the future
one does only have to implement a new card to add in the grid. This choice of
design in the main component also allowed for a more responsive design in terms
of different screen sizes. With a more narrow screen, the cards could be rearranged
into columns of one or two instead of the default three.
The sidebar received a more complex structure with the introduction of additional
205. Implementation
countries and leagues. To keep the sidebar tidy and relevant for each individual user
every country were given an expandable panel containing its different tournaments.
A tournament, in turn, was also given an expandable panel which if clicked would
reveal its corresponding matches in a list. The matches were grouped and sorted by
date and time the same way they are in the mobile application. Every match item
in a list contained the most basic information depending on its status. A game that
had not started yet would show its kickoff time while a live or already ended game
would display the current minute and score. In addition, live matches were given
a more colorful design to make it obvious which matches that were currently being
played.
Because of the access to more real-time data and not having to depend on static
data, as in the first iteration, it was also possible to track even more of the user
behavior and flow. Data such as this is crucial in order to decide whether the UX
and the design are of good quality standard.
Figure 5.3: The second iteration of the web application
5.2.2 Fetching live data
Since the big difference in the preconditions between the first and the second iter-
ation was the access of actual live data, a lot of the time was spent on converting
Forza Football’s REST-API to the way the project required it to be. This was
made using a separate GraphQL-server which was hosted on a separate AWS Elas-
tic Beanstalk-instance than the actual web application. The usage of this structure
made it simple to deploy updates to either the GraphQL-server or the web applica-
tion, without having the other instance affected in any way.
Since GraphQL is strictly typed, it was also necessary to define all types that were
215. Implementation
needed for the project to work. Using these type definitions, it was possible for
GraphQL to check that all the types looked correct, and then create an executable
schema. The only thing that was left to do was to actually specify what kind of data
the different types should return using resolvers. Since the purpose of the GraphQL-
server was to wrap up the already existing REST-API, all resolvers should fetch data
from the REST-API, then convert the data to the desired types, and then return
the result.
5.2.3 Optimizing the GraphQL-wrapper by caching
To reduce the payload for the GraphQL-server used in the project, an important
step for the project was to cache everything that possibly could be cached. Not
only would this method facilitate the hosted servers, it would also result in reduced
response times, which in the end would end up in a more pleasant user experience.
The project used two types of caching, for two different time lengths.
For objects that would be cached long term, the group built its own layer of CPU
caching[43] placed in the middle of the schema and the resolvers, that could control
every request that was made to the server. If the requested data existed in the
cache, the data was immediately returned from the cache. However, if it could not
be found in the cache, the request was instead forwarded to the resolvers. Before
the resolvers return the data, it stores the newly fetched data in the cache with an
expiring time. An example of where this is implemented in the project is found
when requesting team names from the GraphQL-server. Since teams don’t tend to
change names especially often, the server is storing all possible team names that
are included in the project for seven days in its cache, which reduces the number of
requests made to the Forza API massively. The disadvantages of using this method
are that the cache stores in the CPU, which makes the storage limited. Ideally, the
CPU memory should be kept as empty as possible, for maximal server performance.
Objects with a shorter expiring time were cached using a tool called Apollo En-
gine, that comes bundled together with Apollo Server. Apollo Engine is a proxy
that wraps up the GraphQL-server and tracks all the incoming and outgoing traffic
to the server. With this data, Apollo Engine is then capable of tracing and moni-
toring the performance of every query that’s made to the server. It’s also possible
to track errors that the server send when something didn’t go as expected. Apollo
Engine also includes Apollo Cache Control, which makes it really simple to setup
and configure caching for any queries in Apollo Server. This was used to cache data
that was going to be updated frequently. An example of this in the project was the
news, which was cached by Apollo Engine for an hour since it’s not necessary to
update the news for a shorter period than that.
22You can also read