AdPerf: Characterizing the Performance of Third-party Ads
←
→
Page content transcription
If your browser does not render page correctly, please read the page content below

adPerf: Characterizing the Performance of Third-party Ads

BEHNAM POURGHASSEMI, University of California, Irvine, USA
JORDAN BONECUTTER, University of California, Irvine, USA
ZHOU LI, University of California, Irvine, USA
APARNA CHANDRAMOWLISHWARAN, University of California, Irvine, USA
Monetizing websites and web apps through online advertising is widespread in the web ecosystem, creating
a billion-dollar market. This has led to the emergence of a vast network of tertiary ad providers and ad
syndication to facilitate this growing market. Nowadays, the online advertising ecosystem forces publishers
to integrate ads from these third-party domains. On the one hand, this raises several privacy and security
concerns that are actively being studied in recent years. On the other hand, the ability of today’s browsers to
load dynamic web pages with complex animations and Javascript has also transformed online advertising. This 3
can have a significant impact on webpage performance. The latter is a critical metric for optimization since it
ultimately impacts user satisfaction. Unfortunately, there are limited literature studies on understanding the
performance impacts of online advertising which we argue is as important as privacy and security.
 In this paper, we apply an in-depth and first-of-a-kind performance evaluation of web ads. Unlike prior
efforts that rely primarily on adblockers, we perform a fine-grained analysis on the web browser’s page
loading process to demystify the performance cost of web ads. We aim to characterize the cost by every
component of an ad, so the publisher, ad syndicate, and advertiser can improve the ad’s performance with
detailed guidance. For this purpose, we develop a tool, adPerf, for the Chrome browser that classifies page
loading workloads into ad-related and main-content at the granularity of browser activities. Our evaluations
show that online advertising entails more than 15% of browser page loading workload and approximately
88% of that is spent on JavaScript. On smartphones, this additional cost of ads is 7% lower since mobile pages
include fewer and well-optimized ads. We also track the sources and delivery chain of web ads and analyze
performance considering the origin of the ad contents. We observe that 2 of the well-known third-party ad
domains contribute to 35% of the ads performance cost and surprisingly, top news websites implicitly include
unknown third-party ads which in some cases build up to more than 37% of the ads performance cost.

CCS Concepts: • Software and its engineering → Software design engineering; • Information systems
→ Display advertising; • Networks → Network performance analysis.

Additional Key Words and Phrases: Third-party online ads; page load time; fine-grained performance mea-
surement and analysis; Chrome browser

ACM Reference Format:
Behnam Pourghassemi, Jordan Bonecutter, Zhou Li, and Aparna Chandramowlishwaran. 2021. adPerf: Charac-
terizing the Performance of Third-party Ads. Proc. ACM Meas. Anal. Comput. Syst. 5, 1, Article 3 (March 2021),
26 pages. https://doi.org/10.1145/3447381

Authors’ addresses: Behnam Pourghassemi, University of California, Irvine, Irvine, CA, USA, bpourgha@uci.edu; Jordan
Bonecutter, University of California, Irvine, Irvine, CA, USA, jbonecut@uci.edu; Zhou Li, University of California, Irvine,
Irvine, CA, USA, zhoul15@uci.edu; Aparna Chandramowlishwaran, University of California, Irvine, Irvine, CA, USA,
amowli@uci.edu.

Permission to make digital or hard copies of part or all of this work for personal or classroom use is granted without fee
provided that copies are not made or distributed for profit or commercial advantage and that copies bear this notice and
the full citation on the first page. Copyrights for third-party components of this work must be honored. For all other uses,
contact the owner/author(s).
© 2021 Copyright held by the owner/author(s).
2476-1249/2021/3-ART3
https://doi.org/10.1145/3447381

 Proc. ACM Meas. Anal. Comput. Syst., Vol. 5, No. 1, Article 3. Publication date: March 2021.

3:2 Behnam Pourghassemi et al.

 (a) ebay.com in 2002 (b) ebay.com in 2020

Fig. 1. Evolution of ads on the web. (a) Early web ads contain text, image, and hyperlink. (b) Today’s complex
and dynamic web ads (rotating on top of the website) contain JavaScript, animation, multimedia, and iframe.

1 INTRODUCTION
Online advertising (essentially display ads on websites) has proliferated in the last decade to the
extent where it is now an integral part of the web ecosystem with a multi-billion dollar market
[14, 33, 35]. Today, publishers display multiple advertisements (or ads) through pop-ups, banners,
click-throughs, iframes, widgets, etc., to monetize their websites and web apps. The majority of
these ads neither come from the publisher (website) nor a specific domain. They are delivered
through a chain of third-party content providers (such as ad providers, syndication agencies, ad
exchange traders, trackers, and analytics service providers) who are part of a complex ad network
on the server-side [39]. The current ad delivery method forces publishers to embed unknown
third-party content (such as JavaScript or HTML) on their website which could jeopardize user
privacy and security. There have been several studies in recent years to locate the untrusted sources
and malicious ad contents [27, 28, 34, 39, 42, 43]. Accordingly, different blocking and evasion
policies have been devised to guard against such malware and aggressive tracking [28, 41, 57, 58].
While user privacy and security are of paramount importance, it is not the solitary concern of the
worldwide web community. Online advertising also has a direct impact on website performance
(eg., page load time) and in turn user satisfaction. According to Google, 53% of mobile site visitors
leave a page that takes longer than three seconds to load [26].
 Web ads have become more diverse and complex keeping up with the pace of advances in web
design. Figure 1 compares advertising on ebay.com in 2002 and 2020. As we can observe, in the
past, ads only included hypertext and images. However, today’s online ads comprise of JavaScript,
iframe, animation, multimedia, etc. Evaluating and displaying these dynamic ad contents demand
increased computation from the browser and competition for the user’s device resources. Coupling
this observation with recent studies [44, 48, 54] that show that most of the page load time is spent
on computation activities in modern browsers raise three key questions:
 • How much do ads increase the browser’s page loading workload?
 • What type of web documents and browser activities contribute most to this workload?
 • What kind of sources deliver web-ads and how much do they contribute to its performance cost?
 Gaining insight into the above questions and understanding how much ads contribute to the
breakdown of different activities in modern browsers can inform the design of efficient ads and
optimizations targeting those specific activities. Unfortunately, only a handful of studies [30, 36, 38,

Proc. ACM Meas. Anal. Comput. Syst., Vol. 5, No. 1, Article 3. Publication date: March 2021.

adPerf: Characterizing the Performance of Third-party Ads 3:3

50] have been devoted to the performance analysis of ads, yet many such important open questions
remain to be answered.
 Previous studies revolving around the performance analysis of ads lack a comprehensive exami-
nation for at least the following reasons. First, the majority of them concentrate on the network
data traffic overhead, neglecting the performance cost of browser computation activities such
as rendering activities [36, 50]. Second, prior efforts fundamentally share the same approach for
quantifying the performance of ads. They use ad-blockers to block websites’ ad contents and
assess the performance overhead via comparison with vanilla run (no ad-blocking). This approach,
however, is prone to inaccuracy as it does not take into account the intrinsic overhead of the
ad-blocker. Our measurement of over 350 websites shows that Adblock Plus [4]–the most popular
ad-blocker–adds 32% overhead (median) to the page loading even though it reduces the overall
page load time by aggressive content blocking. Furthermore, ad-blockers lead to site breakage and
undesired app functionality, particularly, with the prevalence of anti-ad-blockers [38, 40]. Finally,
the ad-blocker approach suffers from an inability to perform comprehensive and fined-grained
performance analysis. This stems from the way ad-blockers operate where ad-related content is
blocked as early as the initiation of network requests. Thus, subsequent ad-related activities such
as content parsing, descendent resource loading, and rendering remain invisible for inspection.
 In this paper, we investigate the performance overhead of all types of ad-related content by
crawling over 500 websites on different systems (laptop and smartphone). Unlike previous efforts,
we take a novel approach based on in-browser profiling that does not rely on ad-blockers. Our
methodology allows the browser to automatically fetch and evaluate ads’ performance at scale.
It correlates the browser’s computation and network activities to the associated ad contents and
quantifies the added cost of ads. We break down the performance overhead to individual requests
and content types through a resource mapping technique. This procedure contrives a more robust
and detailed performance analysis. Moreover, we demystify and track down ad components on
the publisher and characterize the performance overhead considering the origin of ads and how
they are delivered to the publisher. To the best of our knowledge, this is the first time such an
experiment has been conducted.
 Contributions and Findings. To summarize, this paper makes the following contributions.

 • We employ a different yet more appropriate methodology to characterize the performance
 overhead of ads. Our method avoids using ad-blockers, yielding higher accuracy and capability
 for fine-grained measurements while suppressing site breakages and app failures observed
 in prior studies. We develop a tool, adPerf based on our technique for the Chrome browser
 since it is the most commonly used browser by desktop and mobile users. The key challenge
 we encountered is how to align the performance cost with individual components within
 an ad (e.g., image and JavaScript code), and we address this through a carefully designed
 resource mapper (section 3).
 • Using adPerf, we perform an in-depth and comprehensive evaluation to demystify and locate
 the performance cost of web ads. We crawl and analyze over 500 websites from different
 categories. Our large-scale examination leads to several first-of-a-kind findings that shed
 light on the performance cost of ads, giving website builders and web ad providers a deeper
 understanding to mitigate the performance penalty of ads. For example, our results show
 that on average 15% of browser page loading activities are spent on ad-related content for
 Alexa top 350 news websites (section 6).
 • To perform a detailed source-to-target analysis of web ads, we construct the dependency
 graph for the website’s resources and track the delivery chain involved in third-party ads.
 The results show that googletagservices.com and doubleclick.net, two reputable ad

 Proc. ACM Meas. Anal. Comput. Syst., Vol. 5, No. 1, Article 3. Publication date: March 2021.

3:4 Behnam Pourghassemi et al.

 domains, contribute 35% of the ad resources resulting in the largest performance cost of online
 advertising. Moreover, we characterize the trustworthiness and prevalence of third-party ad
 domains and distinguish the performance overhead of such domains on the web ecosystem.
 Almost half of the highly-visited websites implicitly trust uncommon third-party ad domains
 and our results show that about 37% of ads performance cost is related to untrusted ad
 domains (section 6.3).
 • To assess the impact of the platform on the performance overhead of ads, we compare
 our performance evaluations on a laptop connected to high-speed WiFi with a smartphone
 connected to a cellular network. We observe ads cost 7% less on a smartphone, both in
 rendering and network, as they are comparatively less prevalent and highly optimized in
 mobile pages (section 6.4).
 • adPerf and the detailed measurement results are available at https://gitlab.com/adPerf/adPerf.
 adPerf can be leveraged by web researchers and developers for deeper performance evaluation
 of ads and reducing the overhead of ads. Specifically, we present two compelling use-cases of
 adPerf for the efficient design of ad intervention and to improve the performance of ads in
 section 6.5. Additionally, we compare our takeaways with previous studies in the literature
 (section 7), and discuss similarities and inconsistencies.

2 BACKGROUND
In this section, we first outline the limitations of the current approaches in analyzing the perfor-
mance of ads. Then, we provide an overview of the browser’s internal design and workflow.

2.1 Ad blocking and performance analysis
Ad blocking is a defense mechanism against advertising and tracking that is wildly deployed
by end-users. According to Statistica [19], the global number of clients with connected devices
to ad blockers is steadily increasing, and more than a quarter of Internet users in the US were
blocking ads in 2019 [2]. Popular ad blockers such as AdBlock [3], Adblock Plus [4], uBlock [22],
and Ghostery [13] install as browser add-ons and use filter lists to block web ads and trackers.
While user privacy and security are crucial, even ads that are safe and not tracking users can have
a significant performance impact that has cascading effects on user satisfaction and Internet costs.
Some notable studies [30, 36, 50, 52, 56] lean on ad blockers to measure the performance cost of
web ads. The key distinction between our approach and prior efforts is that we do not rely on ad
blockers and content-blocking for performance analysis of ads for three main reasons:
 Overhead. Multiple studies [36, 38, 53] report ad blockers themselves have significant perfor-
mance overhead due to exhaustive filter-list matching, tracking services of their own, and running
background scripts. Our results also affirm this observation. We analyze AdBlock Plus by creating a
modified version that still performs all of the content filtering operations without actually blocking
any of the content. We calculate the overhead imposed by these filtering operations by measuring
the difference in page load times from the modified version of Adblock Plus to the vanilla instance
of Chrome. Figure 2 shows the overhead of Adblock Plus on 350 webpages in our corpus (see
section 5). According to the figure, for half of the websites, Adblock Plus adds more than 32%
overhead to the page loading due to excessive and CPU-intensive filter rule matching and add-on
background activities. Although it may ultimately reduce page loading workload and network cost
by aggressive content blocking, it’s an inaccurate tool for studying the performance impact of ads.
 Functionality. As ad blockers become a threat to the "free" web business model, many websites
prevent displaying their content to the visitors that use ad blockers. In this case, the publisher
includes a script such as IAB ad block detection script [1] that monitors the visibility of ads to DEAL
(Detect, Explain, Ask, Limit) with ad blockers [45]. Typically, when the publisher detects a hidden

Proc. ACM Meas. Anal. Comput. Syst., Vol. 5, No. 1, Article 3. Publication date: March 2021.

adPerf: Characterizing the Performance of Third-party Ads 3:5

 CDF of % Overhead for AdBlockers
 1.0

 0.9

 0.8
 Fraction of Websites

 0.7

 0.6

 0.5

 0.4

 0.3

 0.2

 0.1
 With Modified Adblocker
 0.0
 0 20 40 60 80 100 120 140 160 180 200 220
 % Overhead for Page Load Time

Fig. 2. CDF distribution of AdblockPlus overhead on Fig. 3. Snapshot of www.forbes.com. This website pre-
the page loading of 350 webpages. vents loading contents if visitors attempt to block ads.

or removed ad, it immediately stops loading the website by displaying a popup that asks the visitor
to turn off the ad-blocker. Figure 3 shows a snapshot of the content-blocking of www.forbes.com
when ad blocker is on. As reported, a large portion of the web, 6.7% of Alexa top 5000 [47] and
16.3% of the top 1000 popular live streaming sites [51] use this anti-adblocking system.
 Besides, content-blocking can also lead to site breakage and other undesired app functionality [40].
This breakage can range from a dysfunctionality in part of the website (e.g., not displaying login
popup) to the breakdown of the entire website layout. For instance, figure 4 shows a snapshot
of www.store.vmware.com when Mozilla’s ad and tracking protection is turned on. Furthermore,
a large number of websites employ ad blocking circumvention to evade from ad blocking. For
instance, www.thoughtcatalog.com and www.cnet.com obfuscate advertising URLs when they
detect that the ad blocker is on. As a result, the resources are translated to the local servers and
eventually displayed on the page. In all of the above cases, performance analysis of ads through ad
blocking is infeasible which limits its scope.

 (a) Before content blocking (b) After content blocking

 Fig. 4. Snapshots of www.store.vmware.com. The layout of the page is broken due to content blocking.

 Fine-grained analysis. Ad blockers block content as early as the initiation of network requests,
which results in two drawbacks. First, it prevents fine-grained performance analysis at the browser
level because activities such as content parsing and rendering related to the blocked ad become
invisible for analysis. Hence, the current body of work focuses on the network data traffic overhead,

 Proc. ACM Meas. Anal. Comput. Syst., Vol. 5, No. 1, Article 3. Publication date: March 2021.

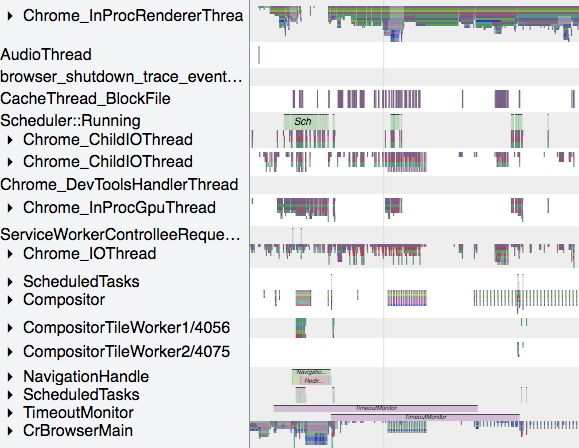
3:6 Behnam Pourghassemi et al.

neglecting the in-browser computation overhead of ads. Second, because the content is blocked at
the network request, resources that are further requested by the blocked document during page
loading become invisible for inspection. For example, when an ad exchange1 (e.g., Google AdSense)
script is blocked, the source(s) of the blocked ads is hidden.
 Our approach addresses the above limitations and enables an in-depth performance analysis of
ads without adding significant overhead. As a result, our measured cost is more reliable and reveals
some anomalies with previous studies that we discuss in section 7. Plus, our framework measures
performance cost of ads on every website. This is highly substantial in term of functionality because
we examine only 15% of our test corpus (≈ 50 websites) and discover 10 websites to have one of the
discussed issues with ad-blocker. Ultimately, we do not block any content, this gives us the ability
to correlate the performance cost of ads to the sources (domain analysis) as well as break down the
computation cost at a finer level of granularity (browser activities) which have not been studied
before. We present our first-of-a-kind findings from this fine-grained characterization in Section 6.

2.2 Browser architecture
A key to our performance characterization is measuring the amount of work the browser spends
on loading the primary content of the page and the additional work in loading ads. Differentiating
the two workloads (primary and ad content) requires an understanding of the way browsers load
webpages. Here, we outline the browser’s high-level design and workflow.

 Layout Composite Paint

 DOM Render Layout Layer
 Display
 Tree Tree Tree Tree

 HTML Scripting
 Styling
 Parsing MessageLoop::RunTask MessageLoop::RunTask
 TaskQueueManager::DoWork TaskQueueManager::DoWork
 TaskQueueManager::ProcessTaskFromWorkQueue TaskQueueManager::ProcessTaskFromWorkQue
 ParseHTML ResourceMsg_RequestComplete
 HTML CSS JavaScript HTMLDocumentParser::processTokenizedChunkF WebURLLoaderImpl::Context::OnCompletedR
 HTMLParserScriptRunner::execute ParseAuthorStyleSheet
 LocalWindowProxy::initialize CSSParserImpl::parseStyleSheet
 V8.NewContext parseStyleSheet.tokenize parseSty
 Resource Loader

Fig. 5. High-level architecture of the web browser. The Fig. 6. Snapshot of the browser activities in loading
components include the resource loader (purple), six www.apple.com that are executed on tens of threads.
major computation stages (green), and the intermedi- The zoom area shows the call stack (y-axis) of one
ate trees (yellow) in the page loading pipeline. thread over time (x-axis).

 Modern browsers have different features and user interfaces but they are based on the same
architecture to load webpages. Figure 5 shows the browser’s high-level page loading workflow.
The process begins when the user submits a URL request to the browser interface. The resource
loader initiates HTTP requests and fetches resources (network activities) from the server. Once the
resource is downloaded (incrementally or fully), the six major computation stages (shaded green)
evaluate the resources and render the website. The computation stages are HTML parsing (builds
the Document Object Model or DOM tree), Styling (evaluates stylesheets and adds attributes to
the DOM tree), Scripting (responds to user interactions and dynamic behavior of the page), Layout
(evaluates size and position of DOM elements), Composite (combines graphical layers), and Paint
(maps layers to pixels). Each of these stages is composed of multiple sub-tasks. We will refer to
1A platform for buying and selling of advertising inventory from multiple ad networks through real-time bidding.

Proc. ACM Meas. Anal. Comput. Syst., Vol. 5, No. 1, Article 3. Publication date: March 2021.

adPerf: Characterizing the Performance of Third-party Ads 3:7

these sub-tasks as activities in the rest of this paper. For example, the HTML parsing stage consists
of byte stream decoding and preprocessing, tokenizing, and DOM tree construction activities.
 The browser invokes the computation activities frequently during page loading. Figure 6 illus-
trates a snapshot of activities when loading www.apple.com. As we can observe, there are numerous
and the order in which these activities execute is based on the dependency imposed by the page
content. For instance, if JavaScript modifies an attribute of a DOM element, this forces the browser
to recalculate the style, update layouts, composite layers, and repaint the screen. This is commonly
known as reflow and can have a significant impact on performance. However, if the JavaScript
only modifies the color of a DOM node, the reflow pipeline bypasses layout and if the change does
not modify the graphical layers, the reflow also bypasses compositing. Moreover, browsers exploit
parallelization between independent activities to accelerate page load time as seen in the figure.
Due to the dependency between activities, dynamic parallelization, and stochastic behavior of the
browser in resource downloading and dispatching tasks, the time of each activity is indeterminate.
Therefore, tracking the dependency chain between browser activities and associating them to the
corresponding workload type, i.e., ads or non-ads, are challenging.

3 METHODOLOGY AND adPerf
To distinguish the performance cost of web ads from the primary content (non-ads), we apply
a systematic approach. First, we extract all browser activities that are associated with the page
loading process. Second, we identify which resource (i.e., a web document) explicitly or implicitly
initiates each browser activity. Third, we classify activities into ads and primary content based on
the resource type initiating the activity. Finally, we measure the total execution time spent on each
class of activity as a performance index distinguishing the workload in each class.
 To realize the above methodology, we design and implement a tool, adPerf, for the Chrome
browser. Note that adPerf can be extended to support other browsers since the same technique
applies to all browser architectures. Figure 7 shows the design of adPerf. Below, we describe the
four modules of adPerf – crawler, parser, resource mapper, and graph builder in detail.

3.1 Crawler
The first module in adPerf (top of the figure) is a crawler (Node.js script) that sets up the headless
Chrome and crawls websites. The crawler uses the Chrome remote protocol APIs [8] under the hood
to interact with the browser and streams Chrome traces [21] to a file. Chrome traces are primarily
used for profiling and debugging the Chrome browser and are low-overhead. Tracing macros
cost a few thousand clocks at most [21], and the logging to file happens after the page is loaded.
Chrome traces are capable of recording intermediate browser activities, including page loading
activities in the Blink rendering engine and V8 JavaScript engine with microsecond precision. Each
trace contains information about the associated activity, such as thread id, activity name, function
arguments, etc. Below is an example trace for a Scripting activity:
 { " pid " : 54 ,
 " t i d " : 35 ,
 " ts " : 81407054 ,
 " ph " : " X " ,
 " t t s " : 119412 ,
 " dur " : 8 3 9 ,
 " cat " : " devtools . timeline " ,
 " name " : " E v a l u a t e S c r i p t " ,
 " args " : { " data " : {
 " u r l " : " h t t p s : / /www. g o o g l e − a n a l y t i c s . com / l i n k i d . j s " ,
 " lineNumber " : 1 ,
 " columnNumber " : 1 ,
 " f r a m e " : " EFF 8B9 5C2 " } } }

 Proc. ACM Meas. Anal. Comput. Syst., Vol. 5, No. 1, Article 3. Publication date: March 2021.
3:8 Behnam Pourghassemi et al.

Additionally, the crawler intercepts network requests, i.e., onBeforeRequest event, and extracts
the header and body of every HTTP request. This data is necessary for resource matching.

3.2 Parser
When the website is loaded, the raw Chrome traces are fed to the parser as shown in the figure.
The adPerf parser does two tasks – pruning and data extraction.
 Pruning. The parser goes through the traces and extracts all page loading activities and prunes
the browser-dependent ones (such as browser garbage collection and inter-process communication
activities). We use the same subset of traces that robust tools such as Chrome devtools timeline
[9], Google Lighthouse [17], and COZ+ [48] collect for performance analysis and page loading
workload characterization. The resulting activities are associated with one of the six browser stages
shown in Figure 5. For instance, the parser considers every trace connected to script evaluation,
V8 script compiling, V8 execution, callback functions triggered by browser events (or timeouts)
among others as part of the Scripting stage.
 Data extraction. For each activity, the parser extracts the following data: start time, end time,
relative stage, thread and process ids, and function arguments if they contain resource information.
This data is necessary to construct the call stack and attribute activities to resources.
 crawler
 Zbrowse

 Chrome remote
 protocol API

 Chrome browser time
 resources Composite
 child-parent
 {"pid":54, ts":81407054,"ph":"X",tts":119412,
 "dur":839, "cat":"devtools.timeline", HTML Parsing Event: DOMContentLoaded Timer Fired Paint
 "name":"EvaluateScript", "args": {"data":{ Layers
 information "url":"https://www.abc/lid.js",
 "lineNumber":1, "columnNumber":1,

 Callback
 "frame":"EFF8B95C2"}}}
 {"pid":54, ts":81419234,"ph":"X",tts":1412,
 Evaluate Script Callback Function
 thread call stack

 "dur":537, "cat":”ipc”}}}

 Chrome traces Function
 network Compile
 updateList() getAttribute() makeRequest() getScroll()
 graph parser requests Script
 builder Recalculate
 pruning appendChild() InsertBefore() Layout
 Style
 data extraction
 Schedule Style Recalculation Layout Invalidate

 resource mapper

 classification
 Resource
 construct
 dependency graph
 call stack

 assign resource
 Fig. 8. Call stack timeline for a Chrome thread con-
 filter list & rule matching
 structed by adPerf resource mapper. The resource map-
 non-ad ad related
 per assigns a resource to each activity using the in-
 activities activities formation in the traces (orange activities with solid
 texture) and call stack (orange activities with dotted
Fig. 7. Design of adPerf. The four core modules are texture) for parsing and evaluation activities and tracks
crawler, parser, resource mapper, and graph builder initiator for tree manipulation and rendering activities
that are shown with dark boxes. (purple activities).

3.3 Resource mapper
Once the traces are parsed and categorized, this data and network information extracted by the
crawler are input to the resource mapper. The task of the resource mapper is to assign each activity
to an associated resource. Unfortunately, we observed that a significant number of traces (about
30%) do not contain any resource information. In such cases, the resource mapper has to derive
this relation.

Proc. ACM Meas. Anal. Comput. Syst., Vol. 5, No. 1, Article 3. Publication date: March 2021.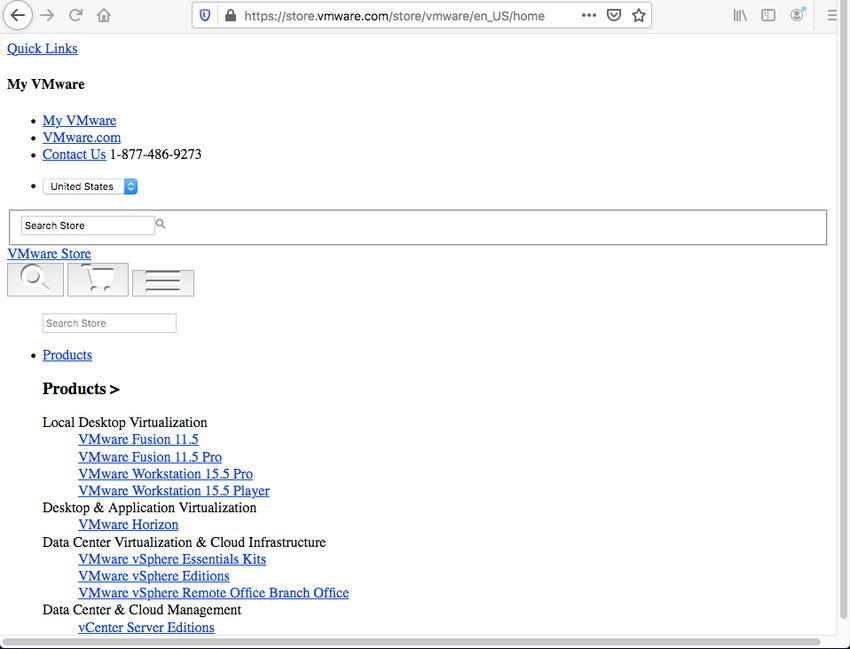
adPerf: Characterizing the Performance of Third-party Ads 3:9

 To address the above challenge, the resource mapper first builds a call stack of activities for
every thread by tracking the start time and end times of activities executed by each thread. Figure
8 shows the call stack timeline for a sample activity for a browser thread where activities are
shown with boxes. After constructing call stacks, the resource mapper classifies activities into two
groups – parsing and evaluation and tree manipulation and rendering. The former contains activities
that explicitly relate to a resource such as HTML parsing, image decoding, stylesheet parsing, and
JavaScript evaluation that directly operate on a document. Activities belonging to this group are
colored orange in the figure. The latter contains activities that implicitly relate to a resource. These
include activities in styling (except stylesheet parsing which belong to the former group), layout,
composite, and paint stages that deal with the browser’s intermediate data structures (trees) and
display. Purple activities in the example belong to this group. Finally, the resource mapper finds
the corresponding resource for each activity group as follows.
 Parsing and evaluation. For the majority of the activities in this group, the resource mapper
extracts the resource file information from function parameters extracted by the parser. Orange
activities with solid texture such as HTML Parsing and Callback Function in Figure 8 are examples
of activities where we can determine the document on which they parse or evaluate from frame id
and resource information in their traces. However, a small number of activities in this group do not
contain any resource information. For activities with unresolved resource files (activities shown
with an orange color and dotted texture in the figure), the resource mapper uses the constructed call
stack and follows their ancestors and associates them with the caller’s resource file. For example,
appendChild JavaScript function is called by updateList and this function along with Compile Script
activity are invoked by Evaluate Script activity that is previously assigned to a JavaScript document.
 Tree manipulation and rendering. For this group, we have to distinguish between the different
resources that implicitly trigger the activities that belong to this group. For styling activities, we
observe that Chrome recalculates styles after the Schedule Style Recalculation event is fired. As seen
from Figure 8, this event is fired in the middle of parsing and evaluation of a resource (typically
a JavaScript document) that attempts to modify the DOM node style. We track the call stack for
this event to the initiated parsing and evaluation activity and associate this styling activity to
the triggered document. Similarly, for layout, Chrome updates the layout tree when the Layout
Invalidate event is fired. In our example, this is fired when the command this._util.elem.innerHTML=e
is executed in the InsertBefore() function. We use a similar procedure as styling to associate layout
activities to the initiating resource from the call stack of the Layout Invalidate event.
 Note that the browser does not always update the style and layout of nodes immediately after
the events are triggered. Depending on the priority of other activities in the task scheduler queue,
the browser might dispatch these activities later. As a result, when a resource triggers one of these
two events (Schedule Style Recalculation or Layout Invalidate), a second resource may fire these
events again before the browser updates the tree. In this case, we consider the first resource as the
initiator since the tree will be traversed and updated even in the absence of the second resource.
Chrome tends to composite and/or paint immediately after styling or layout which leads to repaint.
Therefore, the associated resource for the composite and paint activities simply derives by following
the chain to the last executed styling or layout activity as shown by the red arrows in the figure.
 Once page loading activities are mapped to the corresponding resources, adPerf uses network
data from the crawler to link the resources to the associated network requests (i.e., URLs). Then it
uses a filter list to distinguish between ad resources and non-ad resources. We use EasyList [11], the
primary and most popular filter rules list for advertisements for our experiments. However, users
can also provide their own custom filter rules. adPerf employs adblockparser (an optimized python
package [5]) to match the URLs against filter rules. One might think that since our methodology uses
an identical rule matching procedure to ad blockers, it might incur a similar overhead. However, this

 Proc. ACM Meas. Anal. Comput. Syst., Vol. 5, No. 1, Article 3. Publication date: March 2021.
3:10 Behnam Pourghassemi et al.

is not the case since rule matching in adPerf is passive and does not steal computation cycles from
the page loading process. Finally, adPerf reports the execution time of the page loading activities
categorized by ads and non-ads.

3.4 Graph builder
There exist dependencies between resources on the website. For instance, let’s say a website
downloads a JavaScript file from a third-party domain. In this file, it can further request an image or
an HTML document from another domain, and this chain can go deeper. To evaluate the performance
cost of different sources such as ad domains and to further evaluate their trustworthiness requires
first tracing this resource dependency chain and building a resource dependency graph.
 We extract the dependency between resources of the websites using Zbrowse [25]. Zbrowse uses
Chrome devTools protocol and allows us to instrument, inspect, and debug the Chrome browser. It
also generates the child-parent relation for every network request. We embed Zbrowse in the adPerf
crawler module as shown in Figure 7. This way, we can extract the resources child-parent data at the
same time when we crawl the websites. The graph builder uses Zbrowse’s output and constructs the
dependency graph for resources. In cases where third-party JavaScript gets loaded into a first-party
context and makes an AJAX request, the HTTP referrer appears to be the first-party. We follow
[39] and allow the graph builder to conserve this relation and include the URL of the third-party
from which the JavaScript was loaded. Since one resource can, in turn, request multiple resources,
the constructed graph has the shape of a tree rather than simple chains of dependencies.
 Figure 11 shows this graph for an example website, www.cnn.com. Here, we combine the resources
from the same domain (at each level) into one node for easier visualization. The root node is the
publisher and the remaining nodes are referred to as third-party domains. For differentiation, we
color ad nodes (domains that deliver at least one ad resource) red and non-ad nodes (domains
without any ad resources) blue in this graph. As we can see from the figure, a considerable number
of third-party domains are ad nodes. This is a concerning finding since typically publishers are not
aware of the contents delivered by third-party websites. Generally, publishers trust the first-party
domains (in the first-level of the tree) but those websites might deliver their contents from another
website or chain of websites that are not verified by the publishers. We investigate the prevalence
of such third-party ad domains, their performance cost, and trustworthiness in section 6.

4 VALIDATION OF adPerf
adPerf is a first-of-a-kind performance analyzing tool that measures the fine-grained performance
overhead of web ads at the granularity of the browser’s major stages. In the absence of tools with
similar functionality to serve as a baseline, it is challenging to test and validate adPerf. Chrome
DevTools [9], a set of web developer tools built directly into Google Chrome, provides sufficient
and useful profiling data, including a breakdown of the browser workload into stages. However, the
caveat is that the reported breakdown is for the entire page content, and it does not differentiate
between ads and main content. Therefore, we devise the following experiment to exploit Chrome
DevTools to calculate the performance of ads on a webpage and validate adPerf.
 In our validation experiment, we first measure the total workload of a test page with Chrome
DevTools. Then we instrument the test page by cloning every ad element on the page and re-measure
the total workload. If the cloning is perfect, the added workload will present the performance
overhead of web ads. This experiment validates two main objectives:
 (1) How precisely does adPerf measure the computation workload (irrespective of ads and main
 content) and classify them by the browser stages? This is achieved by comparing adPerf’s
 reported total workload and its breakdown with Chrome DevTools data.

Proc. ACM Meas. Anal. Comput. Syst., Vol. 5, No. 1, Article 3. Publication date: March 2021.
adPerf: Characterizing the Performance of Third-party Ads 3:11

Fig. 9. Snapshot of www.dw.com before cloning ads. Fig. 10. Snapshot of www.dw.com after cloning ads.

 (2) More important, how well does adPerf distinguish the main content workload from the
 advertising workload? This is validated by comparing the performance of the added workload
 (which represents only ads) measured by Chrome Devtools with adPerf’s reported ads
 performance cost.
 Instrumenting real-world websites is comparatively more arduous than synthetic pages due to
the complexity and obfuscation of page sources. However, we adhere to the former for the sake
of proximity to in-the-wild ads and fairness in our validations. Moreover, we duplicate every ad
element (including leaderboards, infeed ads, sticky and animated banners, etc.) and do not limit
ourselves to a specific type of ad for completeness. Without bias, we randomly pick five websites
from our test corpus (see Section 5) and instrument them. Figures 9 and 10 show an example of
this instrumentation on the appearance of a website where we observe that ads are duplicated.
Note that ads are typically delivered from a bidding system (i.e., ad exchange) thus, a duplicated ad
is not necessarily identical to the original ad. However, to minimize the impact of this stochastic
behavior, we load websites multiple times and include cases where two ads (original and cloned)
have at least the same structure and size.
 Table 1 summarizes the results from the validation tests on the accuracy of adPerf in measuring
the page loading workload and fine-grained breakdown by browser stages on the original webpage.
We observe that adPerf measures total page-dependent browser computation within 0.4% to 6.8%
of Chrome DevTools for the five randomly sampled test webpages. Besides, adPerf’s breakdown
is well in line with Chrome DevTools, and all the stage measurements are below a 12% margin of
error, with a median error of 5%. This verifies adPerf’s parser, pruning, call-stack construction, and
activity classification are functioning accurately.
 In Table 2, we present our results from the performance dissection of ads by both adPerf and
Chrome DevTools for the same websites. For each website, adPerf indicates ads performance cost
reported by adPerf on the original page, and Chrome signifies the ads cost estimated by Chrome
DevTools (which is measured by calculating the difference in timings between the original page
and the page with duplicated ads). The results show that adPerf’s total ad costs are within 11%
of Chrome DevTools estimation which confirms that adPerf’s graph builder, call-stack analyzer,
activity tracker, and resource matcher modules are designed correctly, and adPerf successfully

 Proc. ACM Meas. Anal. Comput. Syst., Vol. 5, No. 1, Article 3. Publication date: March 2021.
3:12 Behnam Pourghassemi et al.

Table 1. Comparison of adPerf with Chrome DevTools in measuring the total computation time and breakdown
by browser stages on a MacBook Air laptop.

 Website Total Parsing Scripting Rendering Painting
 Time Error Time Error Time Error Time Error Time Error
 (sec) (%) (sec) (%) (sec) (%) (sec) (%) (sec) (%)
 newindian- adPerf 18.2 1.06 14.9 1.91 0.28
 express.com Chrome 18.6 1.6 1.17 8.9 15.3 2.2 1.79 6.9 0.26 6.5
 buffalonews adPerf 12.2 0.65 9.33 1.91 0.36
 .com Chrome 12.6 2.9 0.58 10.9 9.88 5.5 1.83 4.5 0.33 12
 huffpost.com adPerf 2.13 0.13 1.61 0.30 0.09
 Chrome 2.28 6.8 0.13
adPerf: Characterizing the Performance of Third-party Ads 3:13

5 EXPERIMENTAL SETUP
System. Our system is a MacBook Pro with 2 cores and 8 GB RAM connected to a high-speed WiFi
(400 Mbps). The mobile experiments are conducted on a Nexus 6P (quad-core ARM Cortex-A53
+ quad-core ARM Cortex-A57 processor) connected to the cellular network. To obtain accurate
results on communication overhead, we do not set up any proxy or local server.
Test corpus. Our test corpus consists of two sets of web pages – (a) top 350 websites from Alexa
top 500 news list [6] and (b) top 200 websites from Alexa top 500 list [7]. We will refer to these
two web page datasets as news and general respectively. The two lists have only 17 websites in
common. For each dataset, we crawl the corresponding corpus twice. The first time, we crawl the
home page or landing page of the website. The second time, we randomly click a link on the home
page and crawl the page that it leads to. We exploit Chrome Popeteer [20] to automate link clicking.
We refer to the former as the landing page crawl and the latter as the post-click page crawl.
Experimental repeat. In each crawl over the corpus (total 4 crawls), we load websites multiple
times and take the average to account for fluctuations in page loading.
Evaluation domain. Since the main goal is to characterize the performance cost of ads, we
primarily provide evaluation results for the websites that contain ads. This is nearly 80% of news
websites and 40% of top general websites.

6 RESULTS AND DISCUSSION
In this section, we analyze the performance cost of ads from two viewpoints – at the ad domains
(close to the origin) and deeper in the browser (close to the metal). First, using adPerf, we analyze
the performance cost of ads on the websites broken down by costs incurred by the computation
(i.e., rendering engine) and network (i.e., resource loader). Then, we investigate a level deeper to
understand which computation stages and network resources mainly contribute to the computation
and network ad costs respectively. Finally, we zoom out and analyze the ad domains themselves to
quantify their contribution to the performance cost of web ads.

6.1 Computation cost of ads
For every website, we calculate the fraction of time spent in ad-related activities to the total activities
(ad + non-ad). Figure 12 shows the CDF distribution of this fraction for the 4 different crawls.
 Finding 1. According to the figure, web ads can have a significant impact on the performance of
the website. For example, half of the news websites spend more than 15% of their computing time
on ads. Moreover, 20% of the news websites spend more than 30% of the time on advertising which
can be concerning from the user’s perspective. It also motivates website builders and ad providers
to optimize their advert contents. Compared to the news websites, ads have a lower cost on the
general corpus. The median in this corpus is 5%.
 Finding 2. The figure presents another interesting detail when we compare the landing and
post-click page graphs. Ads have a higher performance cost when loading the landing page versus
the post-click page of news websites by about 25% on average. However, this is not the case for
general websites. Post-click pages of popular general websites have almost similar cost-performant
ads as the landing page. Further, we aggregate the total time spent on ad-activities across all browser
stages and compare that to the time spent on the main content. The average percentage of time
spent on ads versus main content for the news landing page, news post-click, general landing page,
and general post-click datasets is 17, 15, 11, and 10% respectively. The averages are higher than
the median percentages reported earlier because a small number of websites spend 40-50% of the
computation time on ad-activities.

 Proc. ACM Meas. Anal. Comput. Syst., Vol. 5, No. 1, Article 3. Publication date: March 2021.
3:14 Behnam Pourghassemi et al.

 Ads Computation Cost (CDF)
 1.0

 0.9

 0.8

 Fraction of Websites
 0.7

 0.6
 amazon- imrworldwide
 facebook.com usabilla.com onetrust.com 0.5
 adsystem.com .com
 0.4

 0.3
 News (landing)
 0.2
 News (post-click)
 0.1 General (landing)
 facebook.com doubleclick.com tidaltv.com googlesyndica domex.com General (post-click)
 tion.com
 0.0
 0.0 0.1 0.2 0.3 0.4 0.5 0.6 0.7 0.8 0.9 1.0
 Computation Cost Ratio of Ads

Fig. 11. Resource-dependency graph for Fig. 12. Computation cost of ads in two datasets
www.cnn.com. Ad nodes are colored red and namely top general and top news websites. Each do-
non-ad nodes are colored blue. main in the dataset is crawled twice (landing page
 and post-click page).

 Breakdown of ad computation cost. Since we observe that ads can have a significant impact
on website loading, it is worthwhile to explore the cause of this overhead. This can guide website
builders and ad providers to focus their optimization efforts on those activities that are the primary
sources of performance loss. Accordingly, we classify the computation cost of ads by the granularity
of the browser stages (outlined in Section 2). Figure 13 shows the contribution of the six major
stages for the news corpus. For each stage, , we measure the following three metrics. Note that
 is the computation time of stage while ∗ is the total time spent in computation across all
the stages. Similarly, is the computation time spent on ad-activities while ∗ is the total time
spent on all activities. Therefore, ∗∗ is the total time of all computation activities in the browser.
 (1) The fraction of time spent on ad-activities in stage to the total time spent on all activities in
 stage [ / ]. This is shown by the green bars. This intra-stage metric indicates how the
 ∗
 workload of the stage, , is split between ads and the main content.
 (2) The fraction of time spent on ad-activities in stage to the total time spent on ad-activities
 across all stages [ / ∗ ]. This is shown by the blue bars. This inter-stage highlights how a

 particular stage, , is impacted by ads compared to the other browser stages.
 (3) The fraction of time spent on all activities in stage to the total page load computation time
 [ ∗ / ∗∗ ]. This is another inter-stage metric shown by the red bars. However, unlike the above
 metric, it shows the influence of a particular stage, , on the entire page load.
 It is important to correlate both the inter-stage metrics to have a complete analysis. For example,
if a stage has a significant contribution to ads (i.e., second metric) but has very little impact on page
loading (i.e., third metric), then it is unlikely to be a performance optimization target.
 Finding 3. Figure 13 shows that scripting has the highest impact, more than 88%, on the com-
putation cost of ads. It also has a significant impact (73%) on the computation workload of the
entire page. The difference between these two metrics indicates that ads are more scripting heavy
than the main content. This is because ad-content has 21% more dynamic characteristics than the
original page content in our news corpus which increases the time spent in scripting. However,
scripting only spends 25% of its time on ad-related content (i.e., first metric). Therefore, ads are not
the primary bottleneck of the scripting stage but optimizing this stage will considerably improve
the performance of ads as scripting is the major workload of today’s web ads on news sites.

Proc. ACM Meas. Anal. Comput. Syst., Vol. 5, No. 1, Article 3. Publication date: March 2021.
adPerf: Characterizing the Performance of Third-party Ads 3:15

 Contribution of stages in performance cost of ads
 1.0 Ads Network Cost (CDF)
 Stage ad-workload to stage workload
 0.9 Stage ad-workload to total ad-workload 1.0
 Stage workload to total worklaod
 0.8 0.9

 0.7 0.8

 Fraction of Websites
 0.6 0.7
 Ratio

 0.5 0.6

 0.4 0.5

 0.3 0.4

 0.2 0.3
 News (landing)
 0.1 0.2
 News (post-click)
 0.1 General (landing)
 0.0
 General (post-click)
 ng tin
 g ng ut int ite
 yli rip rsi yo Pa os 0.0
 St Pa La mp
 Sc ML Co 0.0 0.1 0.2 0.3 0.4 0.5 0.6 0.7 0.8 0.9 1.0
 HT Network Cost Ratio of Ads

Fig. 13. Contribution of the different browser stages Fig. 14. Network performance cost of ads in two cor-
to the performance cost of ads for the news landing puses: general and news websites. Each corpus con-
corpus. The three bars for each stage correspond to the tains landing and post-click pages.
 / , / ∗ , and / ∗ ).
three ratio metrics ( ∗ ∗ ∗

 Finding 4. Another observation from Figure 13 is that HTML parsing has a minor influence on
page loading, i.e., less than 5% in comparison with scripting but ads have more impact on this stage
(comparing green bars). In other words, optimizing ads HTML code is expected to improve HTML
parsing workload more than optimizing ads JavaScripts for the scripting stage, even though HTML
optimizations can only marginally improve page load time. This underscores the importance of
correlating the intra- and inter-stage metrics to guide optimization efforts. We observe similar
behavior for the general corpus as well.

6.2 Network cost of ads
Besides computation activities, loading ads imposes overhead on the network activities. To measure
the performance cost of ads over the network, for each website, we calculate the ratio of time spent
on fetching ad-related resources to the total time spent on fetching all the requested resources.
Figure 14 shows the CDF of this network cost ratio for the 4 crawls.
 Finding 5. The four distributions follow the same order as in Figure 12 (computation cost of
ads), i.e., news websites incur higher network performance cost than general websites. This is not
surprising since more and/or larger ad resources also require more work in parsing, evaluating, and
rendering. According to the figure, the median of the network-cost ratio is 15% for news websites’
landing page and 3% less on the post-click page. For the general websites, the median is 6% for the
landing page and post-click page respectively.
 Breakdown of ad network cost. To dissect the network costs of ads, we breakdown the network
time consumption by content type (such as HTML, image, and media). For each content type,
Table 3 summarizes statistics about the frequency of resources and network time spent on fetching
those resources for the news corpus for both landing and post-click pages. Given the number of
resources, , and network time spent on the resources, , we define three metrics for each (similar
to computation stages) as follows.
 • Metrics for the number of resources ( ).
 (1) The fraction of the number of resources of content type, to the total number of resources
 of [
 / ] (intra resource-type metric).
 ∗

 Proc. ACM Meas. Anal. Comput. Syst., Vol. 5, No. 1, Article 3. Publication date: March 2021.
3:16 Behnam Pourghassemi et al.

Table 3. Summary of the three metrics each for the number of resources and network time spent on resources
across two types of pages (landing page denoted by L and post-click page denoted by PC) for the news corpus.

 cont. type Stats for the number of resources Stats for the request time of resources
 /
 / ∗
 ∗ / ∗∗ /
 / ∗
 ∗ / ∗∗
 ∗ ∗
 L PC L PC L PC L PC L PC L PC
 Script 0.23 0.22 0.41 0.45 0.40 0.43 0.25 0.24 0.49 0.57 0.33 0.37
 HTML 0.36 0.34 0.09 0.09 0.05 0.06 0.17 0.14 0.04 0.05 0.04 0.05
 Image 0.23 0.22 0.37 0.35 0.37 0.33 0.13 0.12 0.39 0.32 0.50 0.42
 Font 0.13 0.06 0.01 0.01 0.02 0.02 0.06 0.03 0.01
adPerf: Characterizing the Performance of Third-party Ads 3:17

a significant 7% of the network performance cost for the landing page and 9% for post-click pages
(metric 3). The corresponding time spent on ad resources is 5% and 4% respectively (metric 2).

6.3 Breakdown of ad performance by source
The results so far breakdown the performance cost of web ads at the lower level of granularity.
Now, we zoom out and quantify the cost of ads based on their origin, i.e., ad domains. The goal
of this lens is to gain an understanding of the third-party ad domains and their impact on the
performance cost. Accordingly, we build the resource-dependency graph (as described in section 3)
for all news websites in our test corpus. Overall we identify more than 300 distinct ad domains.
 Breakdown of computation performance cost by ad domains. For every ad domain, we first
aggregate the time the rendering engine spends on evaluating the resources served by that domain.
We also measure the total time spent on ads through the crawl (ads computation cost). The ratio
between the above two is an indicator of how each third-party ad domain contributes to the
computation cost of ads. Figure 15(a) shows the contribution of the top 10 ad domains (out of 300)
in decreasing order (from left to right) of their performance impact. The number on top of each bar
is the number of websites in our corpus that are served by that ad domain.

 Contribution of ad domains to performance cost Contribution of ad domains to performance cost
 0.25 0.40
 283
 0.35
 0.20 215
 0.30
 283
 0.15 0.25
 Ratio

 Ratio

 32 0.20
 262
 0.10
 106 0.15
 62 262
 2 92 0.10
 0.05 59 106 68
 155 0.05 48 61 7
 92 59 62
 0.00 0.00
 m

 m
 m

 m
 m

 t

 m

 et

 om

 om

 om

 m
 t

 m

 et

 m

 om

 m

 om

 om
 ne

 ne
 co

 co
 co

 co
 co

 co

 .n

 co
 co

 co

 co
 .n
 .c

 l.c

 .c
 k.

 .c

 .c

 .c
 k.
 dn

 .

 dn

 y.
 s.

 .
 s.

 n.

 d.
 n.

 g.

 s.
 ify
 ed
 ds

 m

 le

 on

 ds
 ic

 ic
 ita

 if
 j
 e

 nx
 io

 te
 io

 in
 2m
 te

 2m
 cl

 og
 l
 te
 er

 er
 ic

 ta

 ta
 t

 ec

 si
 t

 ig

 t

 tis
 ec

 ec
 le

 ea

 ad
 ca
 rv

 ca
 ys
 ev

 fu

 ev
 oa

 go

 oa
 l
 kd
 ub

 ub
 ot

 r

 ot
 se

 cr

 di

 al
 ds

 di

 ve
 bl

 l
 m

 m
 ub
 ac

 pr

 pr
 do

 do

 ib
 yn

 yn
 ag

 u

 -a

 ad
 fe

 do
 tp

 tr

 fe

 do
 s

 on

 s
 t

 le
 le

 le
 sa

 sa
 je

 az
 og
 og

 og
 ad

 ad
 am
 go
 go

 go

 (a) Computation (b) Network

Fig. 15. Contribution of ad domains to the performance cost of web ads. The number on top of each bar is
the number of websites serviced by that particular ad domain.

 Finding 9. googletagservices.com and doubleclick.net have the highest contribution to
the computation of ads on the web. The former is a Google tag management system for managing
JavaScript and HTML tags used for tracking and analytics on websites, and the latter is a popular
ad provider. Together, they deliver about 35% of the total ad resources. Moreover, all the ads are
not delivered by well-known ad domains. In our corpus, 50% of ad domains appear only in the
dependency graph of one website.
 Besides, the number of websites serviced by an ad domain is not an indicator of its perfor-
mance cost. For instance, googlesyndication.com has approximately the same contribution to
the performance cost of ads as createjs.com but it services over 8× more websites than the latter.
This is because createjs.com provides content for interactive ads (flash-like ads using HTML5
canvas) that trigger JavaScript callback functions constantly to sporadically change the content
and re-flow. createJS ads (where usually incorporated by intermediate ad domain) on 32 web-
sites of our corpus heavily use Scripting activities, 7.5% more than Scripting activities belong to
googlesyndication.com on 262 websites.

 Proc. ACM Meas. Anal. Comput. Syst., Vol. 5, No. 1, Article 3. Publication date: March 2021.
3:18 Behnam Pourghassemi et al.

 Breakdown of network cost by ad domains. We follow a similar procedure as above for
estimating the contribution of individual ad domains to the network cost of a page load. For every
ad domain, we first aggregate the time the browser spends on fetching resources by that domain,
Then, we calculate the ratio of the total time spent on fetching ad resources in our crawl to the
above time. Figure 15(b) shows the top 10 ad domains that have the highest contribution to the
network cost of ads in the news corpus.
 Finding 10. About 35% of the network cost of ads on news websites is traced to doubleclick.net
followed by the popular ad syndication googleadsyndication.com with 10% contribution. Google
is the major actor in the ad ecosystem. Domains maintained by Google alone constitute approxi-
mately 51% of the total ad network cost.
 Finding 11. Comparing the computation cost of domains with their network cost shows that
these two performance costs are correlated. As one might expect, fetching more and larger
documents also takes longer to evaluate and display. Interestingly, we also observe domains
that have a high computation cost but insignificant network cost and vice versa. For instance,
googletagservices.com has the highest contribution (19.7%) to the computation cost of ads among
all 300 ad domains. However, it contributes to less than 1% of the network cost (ranked 16 and
not shown in the top 10 domains in Figure 15(b)). Further breakdown of its performance cost with
adPerf reveals two JavaScript documents (osd.js and osd_listener.js) of size less than 76 KB
belonging to this domain referenced by over 200 websites in the news corpus. These two files are
part of Google Ads that track the viewability of the ads to assess the value of an impression to the
publisher and advertiser. To calculate what percentage of an ad appears in a viewable space on
the screen and for how long that portion of the ad remains visible, these JavaScript snippets are
frequently invoked by the webpage and take up valuable CPU cycles.
 Breakdown of performance cost by trustworthiness. When a publisher displays an ad on
their webpage, there is an explicit trust between the publisher and the provider. However, when the
ad provider is part of a syndication, the ad is served through a chain of redirections going through
different ad domains. Our measurement results on the Alexa news and general websites shows that
the mean depth of this chain is 4, revealing ad syndication is prevalent. Most of the ad domains
on the chain are not directly visible to the publisher (except the ones directly embedded by the
publisher). As a result, the publisher cannot verify their intention (e.g., whether used for drive-by
download or phishing). This results in the publisher placing an implicit trust in the ads since the
trustworthiness of these ad domains is unknown. In this paper, we are interested in the correlation
between the performance cost of an ad domain and its trustworthiness.
 To this end, we leveraged two online services, WOT (Web of Trust) [24] and VirusTotal [23], to
model the trustworthiness of an ad domain. WOT is a community-based reputation system that
assigns a score to a domain name based on user complaints and other blacklists. The score ranges
from 0 to 100, and WOT classifies domains based on their scores into 5 trust rating – excellent,
good, unsatisfactory, poor, and very poor [31]. VirusTotal is a portal that proxies the request of a
security check of a domain/URL to its affiliated blacklist services (71 blacklists). When a domain is
submitted to VirusTotal, it reports the blacklists that flag it as red. We count the ratio of blacklists
that do not raise an alarm on the domain (i.e., safe flag) as the VirusTotal score (i.e., 0 means highly
malicious and 1 is completely benign). Both WOT and VirusTotal have been used to determine the
trustworthiness of a domain by previous studies [29, 31, 38, 39].
 One challenge we faced is determining thresholds for trust ratings since it varies widely across
different services that report a trustworthiness score. Therefore, to provide a fair analysis, we
report the contribution of domains to the ad cost for different thresholds. Figure 16 illustrates the
cumulative performance cost of ad domains as a function of trustworthiness assessed by WOT and
VirusTotal. For WOT, we use its default classification (5 classes) [31]. For VirusTotal, we observe

Proc. ACM Meas. Anal. Comput. Syst., Vol. 5, No. 1, Article 3. Publication date: March 2021.
You can also read