Expect the Unexpected - The Disruptive Power of Low-carbon Technology - arbon Tracker - Imperial College London
←
→
Page content transcription
If your browser does not render page correctly, please read the page content below
arbon Tracker
            Initiative

Expect
the Unexpected
The Disruptive Power
of Low-carbon
Technology

                         February 2017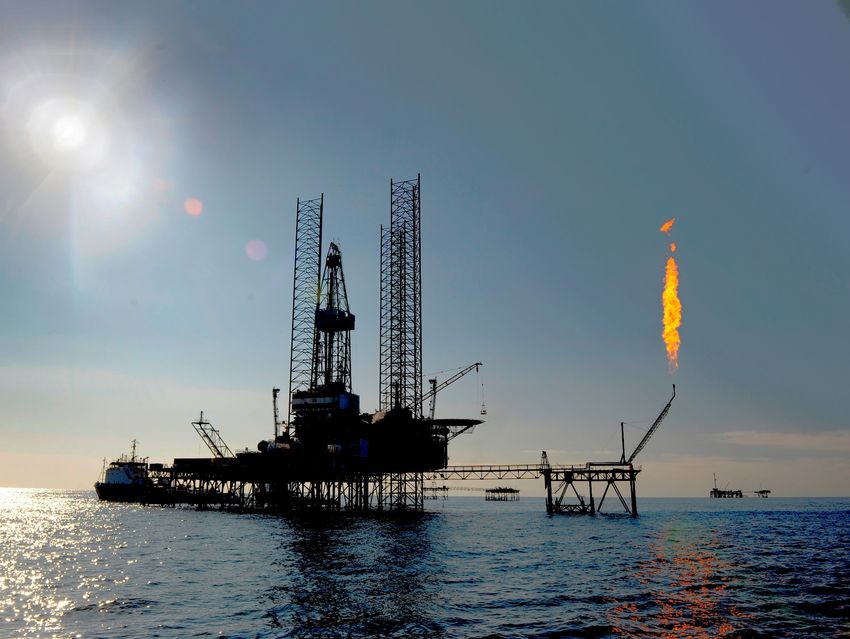
Acknowledgements

About Carbon Tracker

The Carbon Tracker Initiative is a team of financial specialists making climate risk visible in today’s capital markets. Our research to date on unburnable carbon and stranded assets
has started a new debate on how to align the financial system with the energy transition to a low-carbon future.

This report was authored by Luke Sussams, Senior Researcher, and James Leaton, Research Director, of Carbon Tracker.
Modelling was led by Dr. Tamaryn Napp, Research Associate, and Ajay Gambhir, Senior Research Fellow, with support from Dr. Florian Steiner, Research Associate, and Dr. Adam
Hawkes, Head of Energy Modelling, all of the Grantham Institute at Imperial College London. Thanks to the European Climate Foundation (ECF) and ClimateWorks Foundation
for their support.

Thanks to Ajay Gambhir, Dr. Tamaryn Napp, Alyssa Gilbert, Mark Fulton (Energy Transition Advisors), Matt Gray and Andrew Grant (Carbon Tracker) for reviewing.
Designed and typeset by Margherita Gagliardi, Carbon Tracker.

This report has an accompanying online interactive so readers can fully delve into the scenario outputs. This can be found at carbontracker.org/expect-the-unexpected-dashboard

Disclaimer

Carbon Tracker is a non-profit company set up to produce new thinking on climate risk. The organisation is funded by a range of European and American foundations. Carbon
Tracker is not an investment adviser, and makes no representation regarding the advisability of investing in any particular company or investment fund or other vehicle. A decision
to invest in any such investment fund or other entity should not be made in reliance on any of the statements set forth in this publication. While the organisations have obtained
information believed to be reliable, they shall not be liable for any claims or losses of any nature in connection with information contained in this document, including but not
limited to, lost profits or punitive or consequential damages. The information used to compile this report has been collected from a number of sources in the public domain and
from Carbon Tracker licensors. Some of its content may be proprietary and belong to Carbon Tracker or its licensors. The information contained in this research report does
not constitute an offer to sell securities or the solicitation of an offer to buy, or recommendation for investment in, any securities within any jurisdiction. The information is not
intended as financial advice. This research report provides general information only. The information and opinions constitute a judgment as at the date indicated and are subject
to change without notice. The information may therefore not be accurate or current. The information and opinions contained in this report have been compiled or arrived at
from sources believed to be reliable and in good faith, but no representation or warranty, express or implied, is made by Carbon Tracker as to their accuracy, completeness or
correctness and Carbon Tracker does also not warrant that the information is up-to-date.

 2                                                                                                                                 Expect the Unexpected: The Disruptive Power of Low-carbon Technology
Executive Summary

The time for energy                                            Low-carbon technologies                                      The ‘10% threshold’
transformations is now                                         ▶▶ Solar PV (with associated energy storage costs
                                                                  included) could supply 23% of global power                In the past Carbon Tracker has shown that a 10% shift
                                                                  generation in 2040 and 29% by 2050, entirely phasing      in market share can be crippling for incumbents, such
Achieving climate stability will require deep and
                                                                  out coal and leaving natural gas with just a 1% market    as in the value destruction experienced by EU utilities
widespread changes in the global energy sector. Fossil
                                                                  share. ExxonMobil sees all renewables supplying just      and the near collapse of the US coal sector. Scenarios
fuel industry projections, however, continue to show a
                                                                  11% of global power generation by 2040.                   produced in this study indicate that 10% shifts in market
future energy system with few changes to that of today.
                                                                                                                            share from incumbents to solar PV or EVs could occur
This is in spite of examples of disruption in the energy
                                                               ▶▶ EVs account for approximately 35% of the road             within a single decade. This contrasts with many BAU
sector at the hands of the low-carbon transition. This
                                                                  transport market by 2035 – BP put this figure at just     scenarios which do not see these technologies gaining a
scenario analysis was produced in partnership between
                                                                  6% in its 2017 energy outlook. By 2050, EVs account       10% market share, even over several decades. Breaking
Carbon Tracker and the Grantham Institute at Imperial
                                                                  for over two-thirds of the road transport market. This    through these kinds of thresholds is significant because
College London and explores the extent to which ongoing
                                                                  growth trajectory sees EVs displace approximately         they signal the peak in demand for coal or oil; changing
cost reductions could see solar photovoltaics (PV) and
                                                                  two million barrels of oil per day (mbd) in 2025 and      the fundamental market dynamic for these fossil fuels.
electric vehicles (EVs) impact future demand for coal,
                                                                  25mbd in 2050. To put these figures in context, the
oil and gas. The findings of this study should motivate
energy companies and their investors to retire the use of         recent 2014-15 oil price collapse was the result of a
                                                                  two mbd (2%) shift in the supply-demand balance.
                                                                                                                            No more business as usual
business as usual (BAU) scenarios and further integrate
the consideration of downside demand scenarios.
                                                               Fossil fuel demand                                           By definition, BAU scenarios involve no additional
                                                                                                                            climate policy mitigation action beyond the present
Updating model assumptions is                                  ▶▶ Although this study focuses on the decarbonisation        level, or acceleration in the extent to which low-carbon
                                                                                                                            technologies impact energy markets. Given the energy
critical                                                          of the global power and road transport sectors, which
                                                                  today account for only 51% of global CO2 emissions        transition is clearly already underway, and there is no
                                                                  and fossil fuel demand approximately, this scenario       way that BAU can meet the climate targets that many
This study demonstrates the importance of using the               sees:                                                     countries, states and companies have committed to, it is
latest available data and market trends for technology            ▷▷ Coal demand peaking in 2020;                           our contention that it is time to retire the conventional
costs and climate policy in energy modelling. Applying            ▷▷ Oil demand peaking in 2020; and                        approach to use BAU as a starting point in scenario
up-to-date solar PV and EV cost projections, along with           ▷▷ Gas demand growth curtailed.                           analyses. The current state of the low-carbon transition
climate policy effort in line with the Nationally Determined                                                                means it is highly risky to justify any business strategy by
Contributions (NDCs), should now be the starting point         Global warming                                               using a BAU scenario as a reference case. By changing the
for any scenario analysis. This is not a radical disruptive                                                                 starting point, it shifts the focus on to how to achieve the
scenario in terms of its inputs, but a reflection of the       Global average temperature rise is limited to between        Paris COP climate targets, i.e. a 2°C reference scenario,
current state of play. The key findings in this scenario are   2.4°C (50% probability) and 2.7°C (66% probability) by       rather than the gap between BAU and what is already
presented below.                                               2100 in this scenario – far below the BAU trajectory         happening.
                                                               towards 4°C and beyond used by fossil fuel companies.
                                                               If climate policy exceeds the pathway prescribed
                                                               by NDCs, and overall energy demand is lower, cost
                                                               reductions in solar PV and EVs can help limit global
                                                               warming to between 2.1°C (50% probability) and 2.3°C
                                                               (66% probability). Efforts must be made to align with this
                                                               more carbon-constrained trajectory.

www.carbontracker.org                                                                                                                                                                3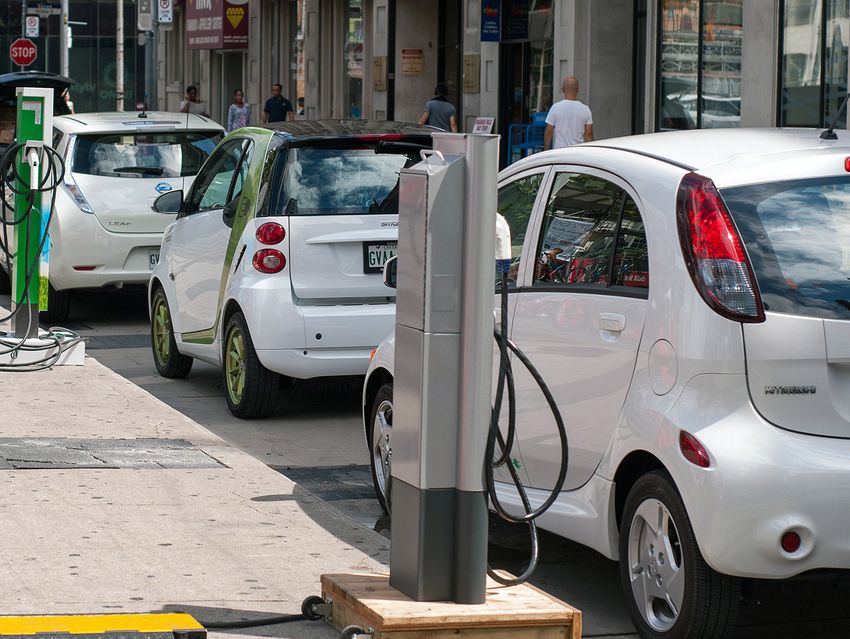
Ensuring transparency of
assumptions                                                                         Policy Makers                           Energy Companies
                                                                                Policymakers are constantly               Companies must move beyond
As noted by the draft guidance from the Financial
                                                                          preparing for the future energy needs          BAU strategies and articulate how
Stability Board (FSB) Taskforce on Climate-related
                                                                                    of their populations.               they are adjusting to the low-carbon
Financial Disclosures (TCFD), it is important to know the
                                                                         Ensuring that the fundamentals of factors   transition and publicly quantify the risks.
assumptions underlying any energy modelling analysis.
                                                                          such as demand and technology costs          They should also communicate where
This is particularly true for the costs of energy supply
                                                                         are up-to-date in the models being used     they see opportunities in the low-carbon
technologies given the binary nature of how integrated
                                                                            to assess policy options is essential     transition and how they could drive the
assessment models (IAMs) tend to select the lowest cost
                                                                              to accurately identify the most                      potential growth
options in their projections of the future energy mix.
                                                                                     efficient solutions                       of technologies such as
Equally important are disclosures of efficiency variables,
                                                                                        for the future.                           solar PV and EVs.
capacity factors and any exogenous constraints applied
by the modellers. This analysis demonstrates how it is
possible to provide this transparency in accordance with
TCFD recommendations (see Appendix) and why it is
                                                                     Energy/Climate
important to do so.
                                                                                                 Recommendations                                       Investors
                                                                       Modellers
Decarbonisation of industry and                                     The scientific community
                                                                                                                                             Shareholders must require
                                                                                                                                              more information on the
buildings is vital                                                has recognised the strengths                                               processes used by energy
                                                                  and limitations of integrated                                          companies to manage transition
                                                                   assessment models to date.                                              risk. Many companies already
This study focuses on the potential impacts from
                                                               It now needs to develop the next                                             conduct some form of lower
growth of solar PV and EVs. It does not address specific
                                                              generation of energy/climate models                                         demand/price scenario analysis;
measures for other carbon-intensive sectors such as
                                                              which can better reflect the dynamics                                    investors must require full disclosure
heavy industry, buildings or other transport sectors (rail,
                                                               of the complex interacting factors                                        of these scenarios and use them
maritime and aviation). This analysis shows, however, that
                                                                      involved in our energy          Financial Regulators               to better align their investments
decarbonisation of power and road transport alone may
                                                                       and climate systems.                                                  with a carbon-constrained
not be enough to achieve international climate targets;                                                 There is an essential role
                                                                                                           for scenario analysis                       future.
so all sectors will need to contribute to future emissions
mitigation.                                                                                         in understanding transition risk.
                                                                                                       Financial regulators should
                                                                                                    issue guidance on the scenarios
                                                                                                  that should be used by companies,
                                                                                                   This should include a 2°C scenario
                                                                                                          to deliver consistent,
                                                                                                        comparable risk metrics
                                                                                                               for investors.

 4                                                                                                                          Expect the Unexpected: The Disruptive Power of Low-carbon Technology
Image via Wikimedia Commons
www.carbontracker.org                           5

Table of Contents

    Executive Summary                                                                                                                   3
1 Introduction                                                                                                                          7
2 Methodology                                                                                                                           8
    How the model works
    Scenario structure
    No baseline, no business-as-usual (BAU), but a new starting point

3 How far can solar PV penetrate global power markets?                                                                                  11
    What impact does solar PV have on the power mix in our scenarios?
    How do other energy industry scenarios compare?
    What does lower-cost solar PV mean for fossil fuel demand in the power sector?

4 What share of road transport could EVs command?                                                                                       20
    When could EVs scale-up globally?
    What could lower-cost EVs mean for oil demand?

5 The impact of solar PV and EVs on total primary demand for coal, oil and gas                                                          26
    When could peak coal, oil and gas demand occur?
    What does the energy industry say about coal, oil and gas demand?

6 What contribution can accelerated solar PV and EV penetration make to achieving a 2°C target?                                         32
    Carbon budgets
    Which other sectors must decarbonise to hit 2°C?
    Other energy transition technologies
    Further development of energy models

7 Conclusions                                                                                                                           39
8 Recommendations                                                                                                                       40
    Appendix                                                                                                                            41
    References                                                                                                                          49

6                                                                                    Expect the Unexpected: The Disruptive Power of Low-carbon Technology
1               Introduction

This report was produced in partnership between Carbon Tracker and the Grantham Institute at Imperial College London. This study analyses the potential for continued cost
reductions in solar photovoltaics (PV) and electric vehicle (EV) technologies to displace demand for currently dominant fossil fuels and mitigate CO2 emissions. In doing so, the
report reviews the validity of continuing to base corporate strategies on ‘business as usual’ scenarios.

Value destruction from low-carbon transformations                                            Focusing on solar PV and EVs
should be avoided
                                                                                             This report models the impact on fossil fuel demand from applying the latest available
Achieving climate stability will require deep and widespread changes in the global           data and market projections for future cost reductions in solar PV and EVs. Global
energy system - the largest single source of CO2 emissions and focus of this report. Such    climate policy effort and energy demand are also varied across this study’s scenarios to
changes are afoot. Solar PV module costs have fallen 99% since 1976i with record global      explore their role in impacting on future fossil fuel demand. Consequently, this study
installations being made for the second consecutive year in 2016.ii Similar downward         reveals the level of CO2 emissions and climate change mitigation that can result from
cost trends exist in other renewable energy technologies. Few predicted these energy         credible, up-to-date modelling assumptions in just a few sectors of the energy system.
transformations, in what proved to be a costly oversight for many. For example, the          In doing so, this analysis also highlights the scope for even greater decarbonisation of
EU’s five largest utilities lost over €100bn in value from 2008 to 2013 largely because      the global energy system if technological innovation in sectors and industries outside
of a failure to predict the penetration of low-carbon technologies resulting from this       the scope of this study results in cutting emissions.
cost deflation (see Carbon Tracker’s EU Utility Death Spiraliii). Companies have since
recognised that they are entering the low-carbon market 10 years too late.

Challenging demand assumptions

In spite of recent examples of low-carbon shifts, current energy industry scenarios                              Current energy industry scenarios still
still suffer from ‘straight-line syndrome’ – an approach where fossil fuel demand                                suffer from ‘straight-line syndrome’ -
continues to grow at an unerring pace. This inevitably leads to outputs that present
harmonious, incremental shifts in energy, while eliminating the possibility of foreseeing                        an approach where fossil fuel demand
step-changes. This approach runs the risk of energy industry participants overlooking                            continues to grow at an unerring
influential changes in supply side inputs, such as technology cost reductions, and
demand side fundamentals, such as efficiency gains. Recent shifts in energy markets                              pace”.
have also shown that the loss of 10% market share for a technology can be enough to
have a significant financial impact, rather than entire sectoral overhauls. (see Carbon
Tracker’s US Coal Crash.)iv Moreover, in the case of value destruction for EU utilities or
the US coal mining sector, these inflection points occurred well within 10 years, not the
long, foreseeable time frames often purported by the fossil fuel industry.

www.carbontracker.org                                                                                                                                                             7
Methodology
        2
How the model works

The scenario outputs of this report have been generated by Imperial College London              Because TIAM-Grantham operates on a least-cost basis, it is possible that the cheapest
using the Grantham Institute’s TIMES Integrated Assessment Model (TIAM-Grantham)                technology in any sector can be deployed without limit until it dominates that sector;
following input and assistance from Carbon Tracker. TIAM-Grantham is a multi-region,            a pattern which in the near-term at least is unlikely to be realistic. As such, technology
least-cost optimising model. The model minimises the total present value cost of the            growth constraints are frequently employed in such models, in order that technology
global energy system (using a 5% discount rate) to meet future energy service demands.          penetration pathways are not unrealistically rapid. In addition, it is important that energy
Details of the macro-level demand assumptions and supply-side technology cost                   storage technologies and/or other electricity system balancing measures are included
assumptions in each scenario are fully described in the Technical Report accompanying           where the penetration of intermittent renewable electricity generation technologies
this study.1                                                                                    becomes significant. Further information on these assumptions made in this study are
                                                                                                available in the relevant sections of this publication and the accompanying Technical
                                                                                                Report.
Forecasting approach

One key element of this study is that it explores future energy system evolution
                                                                                                Scenario structure
pathways without any predetermined temperature outcome. This constitutes a
‘forecast’, whereby the impact on temperature is assessed post-hoc in light of the              The scenarios in this study have been constructed by varying three main factors, as well
policy strength and technology cost assumptions applied to meet the required energy             as updating and recalibrating the TIAM-Grantham model from a 2005 start year, to a
demand level. Models such as TIAM-Grantham are more commonly used in a ‘backcast’               2012 baseline:
sense, to explore the least-cost energy system evolution pathways towards meeting
prescribed climate targets. But such scenarios are numerous and do not form the focus           A.     Technology
here. Rather, this study is focused on exploring the fossil fuel and climate implications       This study is not an exercise in applying wildly optimistic cost reduction trends, but
of the changing economics of key low-carbon technologies.                                       rather an exploration of how plausible advances in solar PV and EVs could impact
                                                                                                on future fossil fuel demand, as well as efforts to reach international climate targets.
Economic calculations and technology constraints                                                These two technologies are the focus of this report because their respective costs: i)
                                                                                                have reduced significantly over recent years, demonstrating potential for disrupting
                                                                                                the incumbent fossil fuel suppliers; and ii) are expected to fall further in the future,
TIAM-Grantham uses extraction costs for supplying fossil fuels and does not factor in
                                                                                                potentially making a significant contribution to decarbonising the global energy system.
taxation or subsidy regimes for energy resources or generation activities. This means
                                                                                                To explore the potential impact of future penetration of solar PV and EVs on fossil fuel
it doesn’t fully replicate real-world economic decisions which account for such factors.
                                                                                                demand, this study compares:
Going forward, the removal of subsidies or tax breaks is desirable to create a level playing
field and to promote the most efficient energy choices in the future. Subsidies are often
                                                                                                ▶▶ Scenarios produced with ‘original’ cost assumptions from the TIAM-Grantham
used to stimulate the uptake of new technologies and are then removed as costs come
                                                                                                   model (these cost estimates were made in 2012 for solar PV and 2014 for EVs);
down with deployment of greater volume. However, a number of established energy
                                                                                                   against
sources, (eg nuclear, oil and gas extraction), continue to receive subsidies or special tax
                                                                                                ▶▶ Scenarios produced with ‘lower cost’ assumptions developed from the latest
treatments, or public financial support for clean-up/decommissioning liabilities, often
                                                                                                   available data and current low-cost market projections.
over the course of several decades.

1       http://www.carbontracker.org/wp-content/uploads/2017/02/CTI_TechnicalReport_FINAL.pdf
    8                                                                                                                                  Expect the Unexpected: The Disruptive Power of Low-carbon Technology
B.      Climate policy                                                                        Together, these assumptions set our baseline ‘medium’ level of energy demand. Higher
As well as focusing on these technological solutions, each scenario in this study features    and lower levels are achieved by varying global economic growth levels to 4.30% and
variations of climate policy effort. This study models four levels of international climate   2.46% respectively over the same time period (levels derived from the highest and
policy effort, as represented through a range of carbon prices applied from 2020              lowest GDP growth rates of the full set of SSPs), while keeping global population levels
onwards, each growing at 5% discount rate per annum (in real terms). This policy effort       the same as SSP2.
is not intended to represent only existing carbon pricing mechanisms such as emissions
trading schemes and carbon taxes, but aims to reflect any policy that could serve to
                                                                                              Factor combinations
constrain CO2 emissions.
                                                                                              Figure 1 summarises the structure of all the scenarios conducted for this study, along
                                                                                              with the prefix used to denote the policy, technology or energy demand assumption
C.    Energy demand
                                                                                              made. These are in brackets in Figure 1. To illustrate, the scenario that assumes: i)
Energy demand levels in the scenarios are centred on the socio-economic projections
                                                                                              policy effort consistent with the NDCs; and ii) lower solar PV cost assumptions, is
made in the Shared Socioeconomic Pathway 2 (SSP2)v scenario with: i) population levels        referred to as ‘NDC_PV’. The scenario with: i) an NDC level of climate policy; ii) lower
of peaking in 2070 at 9.4 billion before falling to 9.0 billion in 2100; and ii) average      solar PV and EV costs; and iii) lower energy demand assumptions, is referred to as
annual economic growth of 3.13% from 2010 to 2050.                                            ‘NDC_PV_EV_Low’, and so on.

Figure 1: The structure of scenario assumptions

www.carbontracker.org                                                                                                                                                               9
No baseline, no business as usual,
but a new starting point
‘Business as usual’ is generally defined as a:
This study demonstrates that the scope for significant penetration of low-carbon
technologies in the future is vast. Consequently, the concept of BAU is becoming
increasingly redundant and a very high-risk corporate strategy. As such, this approach
is not used in this study, meaning scenarios with climate policy consistent with the
baseline case, which assumes that future Cancun pledges are not included in the report (but can be explored through the online
development trends follow those of the past tool accompanying this report if desired2). Instead, the findings of this study are framed
and no changes in policies will take place. around scenario ‘NDC_PV_EV’. While the outcomes in this scenario are not guaranteed,
this pathway is a credible reflection of the low-carbon transition as indicated by current
IPCC (2013).vi
technology trends and policy commitments, and should be used as the new starting
point for any scenario analysis.
A typical approach to climate and energy modelling would use such a BAU scenario to
At present, the energy industry tends to focus on outdated BAU scenarios. In the past,
make comparisons with lower-carbon scenarios. Traditionally, therefore, the ‘Cancun_
Carbon Tracker has reviewed where these BAU scenarios have been used to justify
Orig’ scenario would be used as the baseline in this study because it assumes: i) no
corporate strategies in the face of structural change. For example, see No Rhyme
further climate policy effort beyond the Cancun pledges made back in 2010; ii) no
acceleration in technological advances beyond those original costs projections made in or Reason reviewing the use of EIA scenarios by the US coal mining sectorvii. Using
TIAM-Grantham a number of years ago; and iii) medium energy demand levels. a scenario such as ‘NDC_PV_EV’ should limit the potential for the energy industry
to misread future demand in the power and road transport sectors specifically, and
This kind of BAU approach carries the risk of extrapolating the past into the future. would constitute effective risk management in the face of these sectoral low-carbon
This is no longer a sensible approach when considering the energy/climate nexus. transformations.
First, it does not reflect the energy transition that is already underway, which is seeing
governments and companies act, and rapid changes in low-carbon technology. Second, The ‘NDC_PV_EV’ scenario does not achieve a 2°C outcome (either at 50% or 66%
it ignores the fundamental imperatives of climate science - the energy system will have probability thresholds), so does not reflect even the minimum objective of the
to transition to low-carbon solutions if the world is to deliver on its stated and agreed UNFCCC Paris COP21 agreement, let alone the full range of its ambition to limit
objectives to prevent dangerous levels of climate change. global anthropogenic warming to well below 2°C and pursuing efforts towards 1.5°C.
However, if energy companies use a scenario like ‘NDC_PV_EV’ as a starting point,
there would be less of a gap to bridge to approach these more ambitious climate
targets, and the fossil fuel demand downsides they comprise, compared to baseline
scenarios that are on track for 4°C and over.
2 Available at: www.carbontracker.org/expect-the-unexpected-dashboard
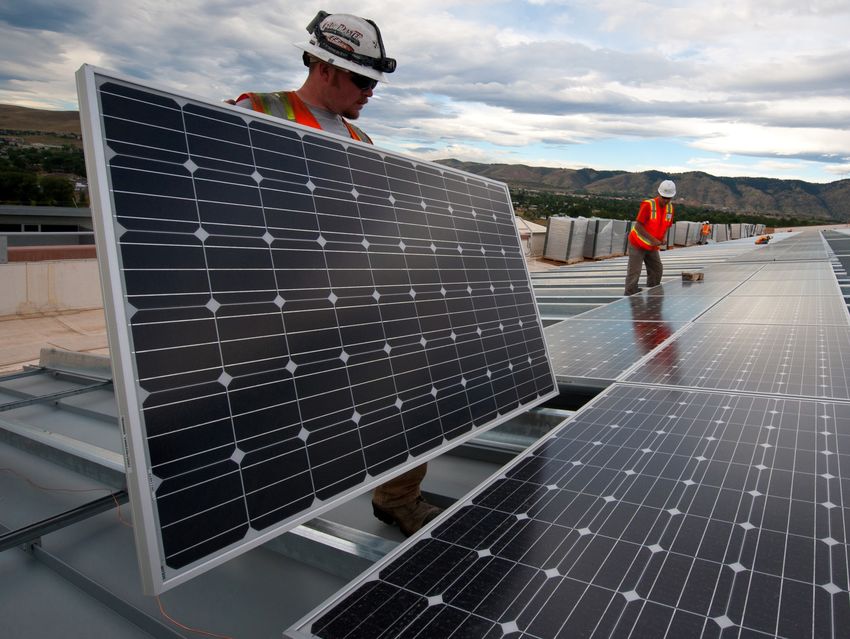
10 Expect the Unexpected: The Disruptive Power of Low-carbon Technology3 How far can solar PV
penetrate global
power markets?
www.carbontracker.org 11
Image via Wikimedia CommonsFigure 2: Original and lower solar PV capital cost assumptions compared against wider literature3 Source: OpenEI data includes Lazard 2009-13, IPCC 2014, EIA AEO 2012, 2013 & 2015, IIASA 2014, US DOE 2011 & 2012, IEA PV 2010 & 2012, US EPA 2013. Additional sources include Agora/Franhofer ISE 2015, IEA WEO 2016, BNEF NEO 2016, Lazard 2014 and 2016 and CTI-Imperial 2016. 3 Conversion of Agora Energiewende data from €2014/kW to US$2014/kW uses exchange rate of US$1.22 to €1. Conversions to US$2016 used rates from the US Department of Labor, available at: http://www.bls.gov/data/ inflation_calculator.htm. 12 Expect the Unexpected: The Disruptive Power of Low-carbon Technology
Recent advances                                                                                Updating projected solar PV cost reductions

The cost of solar PV modules has fallen 99% since 1976 according to Bloomberg New              In light of the faster than expected cost reductions in solar PV to date, a set of ‘lower-
Energy Finance (BNEF).viii Over the last seven years alone, solar PV costs have come           cost’ scenarios (gold) were run in this study. These scenarios see consistent cost deflation
down 85% according to the latest research from Lazard.ix This cost deflation is the            result in residential solar PV costing $643m/GW and utility-scale solar PV price at $390m/
primary driver for an increase in solar PV installations globally. In regions that have seen   GW in 2050. This is in line with current solar PV cost points and in accordance with
higher than average growth, penetration of solar PV has resulted in disproportionately         projections from BNEF’s 2016 New Energy Outlookxiii (red) and Agora Energiewende/
large disruptions as a result of a lack of preparedness. For example, in the EU, major         Franhofer ISExiv (blue) thereafter refer to Figure 2. While these assumptions are at
utilities dismissed the potential of solar PV. RWE said in 2005 that there is ‘little hope     the low-end of the current range of projections, it is worth remembering the degree
that [solar photovoltaic] systems linked to the power grid will ever manage to generate        to which expectations have been exceeded in the solar PV sector in recent years. In
electric power in a truly cost-efficient manner’.x These companies have since recognised       fact, if recent analyses on the next generation of solar PV materials are correct, our
that they missed the boat and are now coming late to renewables, but the damage has            lower-cost assumptions may prove to be conservative. For example, printable PV could
been done. Between 2008 and 2013, renewable power generation, of which solar PV                achieve very low module production costs, which when combined with lowest Agora
was a big part, grew by 8% in total. The five major European utilities were very much          Energiewende/Franhofer ISE estimates for balance of system costs, see total system
misaligned with this shift, costing them €100 billion in value over the period.xi This         costs for utility scale solar of less than $250m/GW by 2050. This is more than 35% less
demonstrates exactly why the extent to which solar PV costs fall further in the future,        than our lower-cost assumption for the same year. This demonstrates how there could
and subsequent penetration, is critical to those in the global energy sector.                  still be further room for greater shifts in the energy sector than we are modelling here.

Updating current solar PV costs

One of the challenges of producing scenarios centred on solar PV is that the model
inputs must remain consistent with such a quickly evolving market. This study’s
scenarios demonstrate this point aptly. For example, the ‘original’ solar PV costs were
set in TIAM-Grantham in 2012. In the four years since, these cost projections have
been made to look somewhat outdated. Figure 2 shows that utility scale capital costs
                                                                                                                   If recent analyses on the next
for solar PV were originally estimated in TIAM-Grantham to be roughly $3721m/GW                                    generation of solar PV materials are
in 2016 (green). Latest Lazard research estimates this figure is approximately $1375m/
GW (purple).xii This is even less than the low-end of estimates made by studies captured       -                   correct, our lower-cost assumptions
in the OpenEI database (pastel) that range from 2009 to 2013 publications. Solar PV                                may prove to be conservative”.
cost reductions have largely been achieved in module costs, but increasingly non-
module costs, such as cabling, inverters and installation, are now contributing to total
system cost reductions. The speed of change in solar PV emphasises the importance of
regularly updating starting cost levels.

www.carbontracker.org                                                                                                                                                                  13
What impact does solar PV have on the power mix in our scenarios? Figure 3: Lower costs shifts the balance towards solar PV from fossil fuel alternatives 14 Expect the Unexpected: The Disruptive Power of Low-carbon Technology
Figure 3 compares the global power mix out to 2050 in scenarios in which original and
lower-cost solar PV assumptions are paired with climate policy that either exceeds
                                                                                              Wind power is a growth market
current NDCs, ie ‘Strong’ policy effort, or under-delivers on the NDCs, ie ‘Weak’ policy.     In addition to potential growth in solar PV, wind power also grows significantly across
The scenarios with NDC level climate policy feature in between these two pathways in          all scenarios to 2050, up to around 12% of the power market. The absolute level of
terms of the balance between fossil fuels and renewable energies.                             power generated by wind does not vary considerably between scenarios because its
                                                                                              growth has been artificially capped in the modelling – full details in the Technical Report.
Even with now outdated solar PV costs, climate policy                                         xviii
                                                                                                    This is because wind power, particularly onshore wind, is already cost-competitive
kills coal                                                                                    with other power sources today in many regions of the world. Therefore, given the
                                                                                              binary nature of least-cost optimising models, wind capacity will always be added as
                                                                                              the least-cost option in the most viable geographies and the power mix would become
The results show that ‘Strong’ climate policy sees demand for coal-fired power generation     very ‘windy’ without being limited. This could be an interesting modelling exercise, but
constrained significantly, regardless of assumed solar PV costs – see scenario ‘Strong_       given our focus on solar PV and its potential growth from further cost reductions, such
Orig’. Under these conditions, coal loses 10% of global market share by 2020 on 2012          a flooding of the power mix by wind would mask our area of interest.
levels, ie the same sized market swing that caused €100bn of value destruction to EU
utilities from 2008-2013xv, and the near collapse of the US coal industry.xvi By 2040, coal
has just 8% of the power market before being entirely phased out in 2050.
                                                                                              Conservative estimates

This dramatic shift does not result in any material uplift in demand for solar PV power       It is worth noting that the TIAM-Grantham model does not factor in subsidy assumptions
however, when assuming original solar PV costs. By 2040, solar PV makes up just 2% of         or preferential policies for renewable power sources explicitly; to an extent subsidies
the global power mix in scenario ‘Strong_Orig’ because natural gas, geothermal and            are factored in to the modelling by the carbon price used as a proxy for general climate
hydropower take up the displaced coal-fired power generation. By 2050, biomass with           policy effort. While subsidies for solar PV are already being phased out in a number of
Carbon Capture and Storage (CCS) has also gained market share due to the carbon               regions as costs fall, this omission in the modelling means in reality more solar PV and
price being used as a proxy for climate policy, thereby reducing gas demand to just 5%        wind power capacity would likely be installed than shown in these scenarios, particularly
of the power mix, down from 19% just 10 years earlier. In these scenarios solar PV only       in the short-term.
grows to 4% market share by 2050. We have already seen a rate of cost reductions to
date in solar PV that render this outcome to be very unlikely.

Updating solar PV costs results in strong growth

Updating solar PV costs with the latest available data and cost reduction projections,
as described in the methodology, results in a huge gain in market share for solar PV at
the expense of fossil fuel alternatives. Figure 3 shows that by 2030, solar PV accounts
for 10% of global power generation when lower costs are coupled with ‘Strong’ climate
policy effort scenario ‘Strong_PV’. By 2050, this share has grown to 29%, which is
almost consistent across ‘Weak’ and NDC consistent policy levels as well. To put this
in perspective, ExxonMobil sees all renewables supplying just 11% of global power
generation by 2040xvii. Meanwhile, coal is phased out of the power mix by 2040 – 10
years earlier than with original solar PV cost assumptions – and natural gas follows
soon afterwards.

www.carbontracker.org                                                                                                                                                                 15
How do other energy industry projections
of solar PV compare?
Figure 4: Installed solar PV capacity projections Figure 5: Projections for solar PV share of power market
Sources: IEA World Energy Outlook 2016,
BNEF New Energy Outlook 2016, and CTI-Imperial analysis 2016.xix
16 Expect the Unexpected: The Disruptive Power of Low-carbon TechnologyEarlier in Figure 3 we showed scenario pathways for solar PV in terms of power generation. Figures 4 and 5 explore what this solar PV generation means in terms of the installed
capacity supplying this power and how this study’s scenarios compare to projections from other institutions.
Outdated BAU scenarios pose risky bet Transparent reporting of capacity factors is important
The capacity charts above reveal a number of trends. They confirm the degree to which The missing link between installed capacity and power generation shown in Figures
the solar market has moved on from the original solar PV costs in TIAM-Grantham set 3-5 is the ‘capacity factor’ assumed for solar PV in each scenario, ie the actual power
in 2012, ie installed solar PV capacity in these original cost scenarios (green) are very output expressed as a percentage of the maximum output possible for that capacity if
conservative compared to the latest scenarios from the IEA and Bloomberg New Energy operating continuously over a period of time. This means a scenario could project vast
Finance. This shows why if fossil fuel incumbents use pathways which extrapolate BAU amounts of solar PV capacity being installed over time, but with little power generated
or use outdated assumptions, they conclude the share of solar PV generation will not from it as a result of a low capacity factor assumption. Our scenarios assume a 15%-
exceed single digit percentages. Figures 4 and 5 also show that installed solar PV 20% capacity factor for solar PV over the projection period. This is consistent with
capacity could go substantially higher in the longer term than other scenarios suggest, capacity factors assumed in the IEA’s 2016 World Energy Outlook that used a range
if solar PV costs fall in line with low-end market projections (gold). By 2040 solar PV of capacity factors between 2015-40 of 11%-24% for large-scale solar and 9%-20% for
accounts for between 40% and 60% of global power capacity and by 2050, the solar buildings, depending on the region.xx It is our contention that modellers must publish
PV share of capacity is over 60% in all lower PV scenarios, which reflects the continuing the capacity factor assumed to allow the bridge between capacity and generation to
roll-out of solar PV in this decade beyond the time period of many existing scenarios. be made by those using the information.
Potential for fossil fuel asset stranding What storage is included to adapt the grid to
widespread penetration of intermittent power?
To grow to 60% of global power capacity by 2050 will require a huge build-out of
solar PV, much of which occurs between 2030 and 2040. Scenario ‘NDC_PV’ sees solar
PV capacity grow by over 5000GW in this 10 year period, for example. Such a rapid Solar power is intermittent in its supply. This poses a challenge in scenarios like ours
deployment of solar PV reflects a shift that could arise when solar PV becomes materially where solar PV could supply up to 30% of global power generation. Consequently, our
cheaper than alternative power options, and utility and consumer preferences change scenarios integrate energy storage capacity to mitigate any intermittency. We assume
accordingly. In such a scenario of significant change, the mass stranding of downstream 0.25GW of storage to support each GW of solar PV and wind generation capacity when
fossil fuel assets is highly likely. After all, it took just an 8% increase in market share for penetration of renewables exceeds 20% market share. This cost is added to the total
renewables for EU utilities to lose €100bn in value from 2008-2013 and a 10% loss of system costs for renewables in the model once a high level of penetration is achieved.
power market share for the US coal industry to almost collapse entirely. There are a range of views on the likely level of storage needed to complement
solar PV generation, depending on other back-up generation options and demand-
side management advances, but our scenarios are realistic and achievable within this
context.
www.carbontracker.org 17What could lower-cost solar PV mean
for fossil fuel demand in the power sector?
Figure 6: Comparing projections for coal’s share of power generation Figure 7: Comparing projections for gas’s share of power generation
Sources: IEA World Energy Outlook 2016,
BNEF New Energy Outlook 2016, and CTI-Imperial analysis 2016.xxi
18 Expect the Unexpected: The Disruptive Power of Low-carbon TechnologyFigures 6 and 7 take a deep-dive on the impact of solar PV costs, combined with an assumed level of climate policy, on fossil fuel demand in our scenarios and compares the
results against other energy industry projections.
Coal in decline
Figure 6 shows that coal-fired power generation is heavily exposed to climate policy The volatility seen in gas generation here could be interpreted to reflect how marginal
effort. Under original solar PV cost assumptions (green), the NDCs are likely to result in natural gas options are. This is already the situation in some markets such as Europe
coal-fired power generation peaking in the 2020s. If governments exceed this level of where the uncertainty over future carbon, commodity and power prices makes it
policy effort in the very near-term, this peak occurs prior to 2020 – see ‘Strong_Orig’. almost impossible for commercial operators to decide to invest in new gas generation.
Lower solar PV costs (gold) accelerate the decline of coal, rather than drive it. For The signals being sent from some governments regarding the phase out of coal create
example, in scenarios assuming NDC consistent climate policy effort, coal’s decline some opportunities for gas as a transition fuel but as the model shows this may only
post-2030 is drastic – see ‘NDC_PV’, while in scenario ‘Strong_PV’ this significant be a temporary respite, as gas is outcompeted by alternatives soon after, resulting in
switch away from coal occurs from 2020 onwards, in a trajectory largely consistent with cripplingly low utilisation rates and asset stranding. Although no carbon budget is in
the IEA’s 450 scenario. place in these scenarios, this would constitute a further problem for those considering
gas as a transition option – if ever-tightening emissions constraints are to be met, then
new gas plants would have a very limited lifetime.
Natural gas uncertainty
The black and white nature of least-cost optimising models means they can flip-flop
The need for scenario analysis
between favoured technologies depending on the cost-competitiveness landscape in
that decade. This happens with natural gas-fired power generation in our scenarios The modelling undertaken shows a clear warning that peak power generation by coal,
– refer to Figure 7. After a small increase in demand to 2020, all our scenarios see and even gas, could occur around 2020. This demonstrates why it is important for fossil
natural gas-fired generation declining to 2030. In scenarios with original solar PV costs, fuel suppliers to test their business plans for resilience against a range of scenarios,
this is due to the widespread take-up of biomass as a power source; in lower cost which consider how far and how fast coal or gas demand could fall in the power sector
scenarios, solar PV picks up some demand. By 2040, scenario ‘NDC_Orig’ has stringent over the next decade.
enough climate policy for coal demand to collapse, but not to overly penalise natural
gas – hence a temporary spike in generation as previously idled plants are brought
back online. In scenarios with lower solar PV costs, natural gas-fired power generation
continues to decline through to 2050 as it is out-competed. Figure 7 is significant
because it demonstrates exactly how bullish industry projections could be for power
generation from natural gas. Even considering the drastic demand fluctuations in some
original cost scenarios, our set of pathways see natural gas-fired power generation
below even BNEF and the IEA’s 450 scenario.
Our set of pathways see natural gas-
fired power generation below even
BNEF and the IEA’s 450 scenario”.
www.carbontracker.org 194
What share
of road transport
could EVs command?
Image via Wikimedia Commons
20 Expect the Unexpected: The Disruptive Power of Low-carbon TechnologyOver recent years, EVs have gained noteworthy market share in a number of regions. The chart shows that the original TIAM-Grantham assumption (green) was for BEV
2015 saw EVs grow beyond one million globally, up from hundreds just 10 years earlier. capital costs to fall steadily to 2050. This is consistent with studies captured by the
In the Netherlands, EVs command 10% market share, while in Norway it is up to 23%. OpenEI database. Our lower-cost scenario (gold), however, takes into account more
xxii
This is largely the result of government incentives, consumer preferences and falling recent developments and cost reductions in the EV market, such as General Motors
costs to date. The capital cost of the battery is the main component affecting overall claiming that its battery costs have fallen to US$145/kWh since October 2015.xxiv In
purchase price of EVs. Estimates vary, but according to 2016 research by the US response, EV capital costs were reduced in 2015 compared to original assumptions –
Department of Energy, battery costs have fallen from $1000/kWh in 2008 to $268/kWh refer to Figure 8. Furthermore, it is assumed in the lower-cost scenarios that through
in 2015; a 73% reduction in seven years.xxiii maintained R&D and strong investment, the capital cost of BEVs, plug-in hybrids
(PHEVs) and hydrogen fuel cell vehicles (FCVs) will reach cost parity with ICEs by 2020.
This new EV capital cost level is in line with the low-end of the range supplied by the
Updating EV cost reduction projections OpenEI database from 2020 onwards.
To analyse the potential growth of EVs, this study compares scenarios applying ‘original’ This cost projection is credible given that most studies believe EVs will be cost-
costs set in TIAM-Grantham in 2014, and ‘lower’ cost assumptions, based on latest competitive with ICEs when battery costs are between $150-300kWhxxv and Tesla
available data and current market trends. Figure 8 displays these two different cost already claims that batteries will cost as little as US$100/kWh by 2020. Furthermore,
projections for battery electric vehicles (BEVs) in the context of wider literature in the Volkswagen asserts that its ID vehicle will be launched in 2020 ‘at a price on a par with
form of the OpenEI database. a comparably powerful and well-equipped Golf’, and the next batch of EVs available
in 2020 will have double or triple the range of the current ones, offering 200-300 miles
Figure 8: Original and lower capital cost assumptions in this study for battery per charge.xxvi There is a growing disparity between the direction being set by the
electric vehicles (BEVs) compared against average costs for Internal Combustion automobile industry and the BAU scenarios being followed by the oil and gas sector.
Engine (ICE) vehicles This presents an interesting dilemma for investors with a portfolio covering both sectors
as to which eventuality they think will come to pass.
Sources: OpenEI sources
include US DOE 2011 & 2013,
US EIA 2011, McKinsey 2010,
TEF 2011, NRC 2010, NAS
2013. Imp-CTI data from
TIAM-Grantham 2016
www.carbontracker.org 21When could EVs scale-up globally?
Figure 9: The share of road transport met by different vehicle technologies under original and lower EV costs, and varying climate policy effort4
Sources: OpenEI sources
include US DOE 2011 & 2013,
US EIA 2011, McKinsey 2010,
TEF 2011, NRC 2010, NAS
2013. Imp-CTI data from
TIAM-Grantham 2016
4 The scenarios conducted with NDC-consistent levels of climate policy feature in between the ‘Weak’ and ‘Strong’ climate policy pathways in terms of the balance between EVs and ICEs. ‘Oil hybrid’ is defined in the model as
an ICE with an electric battery, making it 30% more fuel efficient than conventional ICEs, but it does not have the capacity to plug-in.
22 Expect the Unexpected: The Disruptive Power of Low-carbon TechnologyEV penetration reliant on cost-competitiveness5 Wrong number
Figure 9 shows that penetration of BEVs plus PHEVs is virtually the same whether Technological solutions are notoriously hard to predict. Many have missed the mark in
‘Weak’, NDC or ‘Strong’ climate policy effort is assumed. This represents the fact that the past – for example, McKinsey and Company’s 1980 projection of 900,000 mobile
in our modelling, EVs are cheaper from 2020 onwards and are selected by the least-cost phone subscribers by 2000; the number was in fact 109 million. One certainty with
optimising TIAM-Grantham from then onwards. Any cost penalty incurred by ICEs only scenarios analysis is that most of the scenarios will turn out to be wrong – hence
increases the cost discrepancy to EVs. This modelling approach explores the potential focusing on just BAU is a high risk strategy. That is why it is important to develop a
penetration of EVs when they are the cheapest option available to economically rational range of scenarios that look to keep ahead of the curve rather than continue playing
consumers. It assumes, therefore, that perceived challenges, such as range anxiety, catch-up.
are overcome and the infrastructure required for high EV penetration is installed. The
future demand and use of EVs are not yet known, but if these obstacles are overcome,
then there seems potential for a faster switch to EVs from ICEs than thought by many
Mobility revolution
commentators.
The modelling here does not factor in changes in mobility behaviours, especially
where technologies combine to offer alternative transport solutions. If global cities
EVs are material by 2030 continue to expand and become more densely populated, mobility solutions such
as car pooling and autonomous vehicles could boom. This would lead to increased
Under original TIAM-Grantham cost assumptions set in 2014, EVs are too expensive to deployment of EVs as the economics of mobility improve under this more intense use
threaten ICEs before 2050. Today, in 2017, we have already seen that cost reductions in of vehicles. Furthermore, air pollution concerns are a factor that favours EVs for new
EVs have progressed at such a rate that this is not realistic. Nevertheless, under these mobility services such as car sharing. Much will depend on key growth regions such as
original cost assumptions, ICEs lose market share to 2030 to hydrogen fuels, principally China, which is currently backing EVs strongly and could catalyse global EV growth if it
in the heavy truck and passenger vehicle sub-sectors. becomes the production centre of the world, much like it did for solar PV.
In scenarios applying our lower-cost assumptions, in which EVs achieve cost parity
with conventional internal combustion engine vehicles (ICEs) by 2020, EVs take a
19-21% share of the road transport market over the subsequent ten years. To put
this in perspective, BP’s 2017 energy outlook sees EVs only commanding a 6% (100 There seems potential for a faster
million vehicles) share of the market five years later than this in 2035.xxvii Along with switch to EVs from ICEs than thought
the emergence of hydrogen fuel and more efficient ICEs with an on-board battery (‘oil
hybrids’), lower-cost EVs contribute to ICEs losing market share to 45%/46% by 2030.
by many commentators”.
This is less than half the market share of ICEs in 2012 – a drastic turnaround in less than
20 years.
ICEs and EVs trade places by 2050
BEVs are the preferred alternative to ICEs post-2030 in our lower-cost EV scenarios.
ICEs and PHEVs lose demand and market share as a result. The split between the
types of EV (BEV and PHEV in our classification) varies slightly across the climate policy EVs occupy over half the road
levels, but overall, EVs occupy over half the road transport market in 2040 and ICEs transport market in 2040 and ICEs
just a fifth. By 2050, BEVs have saturated the passenger vehicle fleet, which accounts
for 69% of the road transport market. ICEs now account for just 12%/13% of vehicles, just a fifth. By 2050, BEVs have
almost exclusively due to demand in medium-duty vehicles and commercial trucks. saturated the passenger vehicle fleet”.
These scenarios demonstrate that EVs can trade places with ICEs and go from being a
niche player to monopolising the market in just a few decades.
5 When the term ‘EVs’ is used in this study it refers to both plug-in hybrid vehicles (PHEVs) and battery
electric vehicles (BEVs) cumulatively.
www.carbontracker.org 23What could lower-cost EVs mean for oil demand?
Figure 10: Comparing levels of oil demand displaced by EVs across institutional projections6
Sources: IEA World Energy Outlook 2016, BNEF New Energy Outlook 2016, and CTI-Imperial analysis 2016.xxviii
6 * ‘Current Growth Rate’ is derived from BNEF and assumes EV sales increase by 60% year on year. Data can be found at: https://www.bloomberg.com/features/2016-ev-oil-crisis/. IEA projections shown in Figure 10 assume
linear interpolation between given data points in the 2016 WEO.
24 Expect the Unexpected: The Disruptive Power of Low-carbon TechnologyOil industry behind the curve? Getting on the same page
Figure 10 shows that scenario ‘NDC_EV’, ie the scenario assuming an NDC consistent With there being so many moving parts when referring to EVs and their potential impact
level of climate policy action combined with lower EV costs, sees 16.4 million barrels on future oil demand, it is important all assumptions are disclosed to allow comparisons
of oil per day (mbd) being displaced annually by 2040 due to EV penetration in the such as in Figure 10 to be conducted as accurately as possible. Currently, this is not the
road transport sector. By 2050 this figure is 24.6mbd in ‘NDC_EV’. This level of oil case. Different energy institutions, and the oil and gas companies, often cite different
displacement due to EVs is a little above that from BNEF’s 2016 New Energy Outlook variables, eg projections of the number of EVs; percentage growth rates of EVs; or
(NEO). Both are significantly above the IEA’s 2016 New Policies Scenario (NPS) and the percentage of new car sales being EVs. Often, simply by omitting reference points
even the IEA’s 2°C (450) scenario that shows EVs could displace six mbd of oil demand such as the starting number of EVs or total fleet sizes at relevant dates, it is very hard
by 2040. The fossil fuel industry is equally conservative about the potential for EVs to compare the different projections and scenarios. With EVs attracting ever greater
to displace demand for oil; BP’s 2017 energy outlook sees 1.2mbd being displaced attention as cost parity to ICEs nears, modellers must fully disclose assumptions in a
by switching to EVs by 2035xxix and this is after a significance increase from the 2016 consistent manner to inform interested parties – see the Appendix.
outlook that put this figure at 0.7mbd.xxx
EVs are climate change mitigators
To put these figures in context, the recent 2014-15 oil price collapse was as a result of
a 2% shift in the supply-demand balance, roughly two mbd.xxxi The IEA’s NPS does not
see two mbd of oil being displaced by EVs before 2040. BNEF sees this displacement A typical concern is that growth of EVs might not constitute a path to CO2 emissions
threshold being surpassed by 2028, while ‘NDC_EV’ sees two mbd of oil displaced as mitigation if the power to drive them is from fossil fuels. Our calculations indicate
soon as 2025. Figure 10 also shows the extent to which oil demand would be reduced that for EVs to result in fewer emissions than ICEs today, the power supply charging
if EVs maintain current growth rates year on year. This projection shows both how them must emit less than 720gCO2 per kWh, factoring in any subsequent uplift in
striking recent growth in EVs has been and that scenario ‘NDC_EV’ is plausible even if power demand.7 Countries such as Norway, Canada and Brazil, with large amounts of
the rate of deployment drops off a bit from current levels. hydropower, or France, with significant nuclear power, are already below 200gCO2/
kWh, whilst China is probably at a marginal point, but is set to decarbonise its power
An obvious question is how long the EV market can sustain its current 60% year-on- mix through its 13th Five Year Plan.
year growth rate. It is always difficult to tell exactly what stage of growth a technology
is at and the strength of the forces driving it, but looking back at the adoption of colour It is also likely that countries aiming to decarbonise are typically tackling both the power
TV, and then High Definition TV, provides a couple of examples of where a ‘better’ and transport sectors. Going forward the synergy between EVs as storage options and
product that provides a similar service has quickly monopolised a market. renewable power could further drive the simultaneous roll out of the two. By 2020 the
emissions mitigation threshold will increase to 800gCO2/kWh due to increasing EV
efficiency. By 2050, it will be 960gCO2/kWh, all the while the global power sector is
What do these calculations assume? expected to continue decarbonising. As such, scenarios like ‘NDC_EV’ that see over a
billion EVs on the road by 2050, mitigate 3.3GtCO2 annually by this date compared to
There are a number of variables that determine the level of oil demand displaced by an all ICE fleet.
EVs. Of course, the number of EVs on the road is a key determinant - our ‘NDC_EV’
scenario sees 1.1 billion EVs in the global vehicle fleet by 2040, compared to 150
million in the IEA NPS. Equally significant is the assumption of how much these EVs
are used. This is a big unknown. One might assume that new vehicles are used more,
or perhaps that EVs are used more in cities than rural areas where air quality concerns
are higher. Equally significant is the assumed lifetime for each vehicle type – this study
assumes a 12.5 year lifetime for passenger vehicles. All together this determines the
level of total EV demand, which is divided by the assumed efficiency of the equivalent
ICE vehicle type it is replacing, to give the oil demand displaced.
7 This is largely consistent with the view of the IEA that put this threshold at 700gCO2/kWh. See page 14,
EV Outlook 2016 - https://www.iea.org/publications/freepublications/publication/Global_EV_Outlook_2016.pdf
www.carbontracker.org 25You can also read


