Grid-interactive Efficient Buildings Technical Report Series - Overview of Research Challenges and Gaps - NREL
←
→
Page content transcription
If your browser does not render page correctly, please read the page content below
Grid-interactive Efficient Buildings
Technical Report Series
Overview of Research Challenges and Gaps

December 2019

(This page intentionally left blank)
GRID-INTERACTIVE EFFICIENT BUILDINGS TECHNICAL REPORT SERIES: Overview of Research Challenges and Gaps

Disclaimer
This report was prepared as an account of work sponsored by an agency of the United States Government.
Neither the United States Government, nor any agency thereof, nor any of their employees, nor any of their
contractors, subcontractors, or their employees, makes any warranty, express or implied, or assumes any legal
liability or responsibility for the accuracy, completeness, or usefulness of any information, apparatus, product,
or process disclosed, or represents that its use would not infringe privately owned rights. Reference herein to
any specific commercial product, process, or service by trade name, trademark, manufacturer, or otherwise,
does not necessarily constitute or imply its endorsement, recommendation, or favoring by the United States
Government or any agency, contractor, or subcontractor thereof. The views and opinions of authors expressed
herein do not necessarily state or reflect those of the United States Government or any agency thereof.

                                                        iii
GRID-INTERACTIVE EFFICIENT BUILDINGS TECHNICAL REPORT SERIES: Overview of Research Challenges and Gaps

Authors
The authors of this report are:

                 Monica Neukomm, U.S. Department of Energy (DOE)

                 Valerie Nubbe, Navigant Consulting, Inc.
                 Robert Fares, former American Association for the Advancement of Science (AAAS) fellow
                 at DOE

Acknowledgments
The authors would like to acknowledge the valuable guidance and input provided during the preparation of this
report. The authors are also grateful to the following list of contributors. Their feedback, guidance, and review
proved invaluable in preparing this report.
        Contributors:
                 David Nemtzow, DOE
                 Karma Sawyer, DOE
                 Amir Roth, DOE
                 Michael Specian, former AAAS fellow at DOE
                 Marina Sofos, DOE
                 Nelson James, Oak Ridge Institute for Science and Education (ORISE) fellow at DOE
                 Sarah Zaleski, DOE
                 Adam Hirsch, Torque Interactive Media (previously at the National Renewable Energy
                 Laboratory [NREL])
                 Janet Reyna, NREL
                 Jared Langevin, Lawrence Berkeley National Laboratory
                 Chioke Harris, NREL
                 Matt Guernsey, Navigant Consulting, Inc.
                 Rebecca Ciraulo, Navigant Consulting, Inc.
                 Warren Wang, Navigant Consulting, Inc.
                 Joshua Butzbaugh, Pacific Northwest National Laboratory
                 John Mayernik, NREL

                                                       iv
GRID-INTERACTIVE EFFICIENT BUILDINGS TECHNICAL REPORT SERIES: Overview of Research Challenges and Gaps

List of Acronyms and Abbreviations
 AC         alternating current

 ACEEE      American Council for an Energy-Efficient Economy

 BTO        Building Technologies Office

 CAISO      California Independent System Operator

 CHP        combined heat and power

 DC         direct current

 DER        distributed energy resource

 DOE        U.S. Department of Energy

 ERCOT      Electric Reliability Council of Texas

 GEB        grid-interactive efficient building

 GW         gigawatt

 GWh        gigawatt hour

 HVAC       heating, ventilation, and air conditioning (also heating, ventilating, and air
            conditioning)

 ISO        independent system operator

 ISO-NE     New England Independent System Operator

 kW         kilowatt

 LED        light-emitting diode

 MEL        miscellaneous electric load

 MISO       Midcontinent Independent System Operator

 MW         megawatt

 MWh        megawatt hour

 NYISO      New York Independent System Operator

 PLMA       Peak Load Management Alliance

 PV         photovoltaic

 R&D        research and development

 RTO        regional transmission organization

                                                         v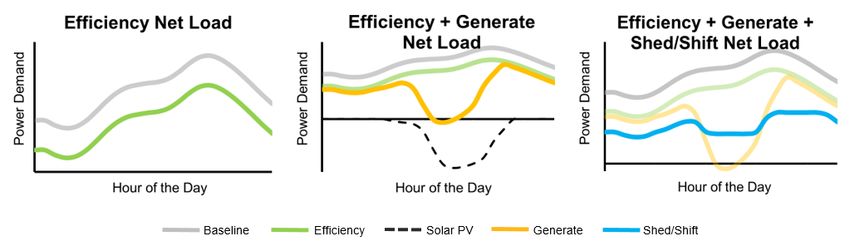
GRID-INTERACTIVE EFFICIENT BUILDINGS TECHNICAL REPORT SERIES: Overview of Research Challenges and Gaps

 SEPA       Smart Electric Power Alliance

 SPP        Southwest Power Pool

 T&D        transmission and distribution

 TAS        thermally anisotropic systems

 TOU        time-of-use

                                                      vi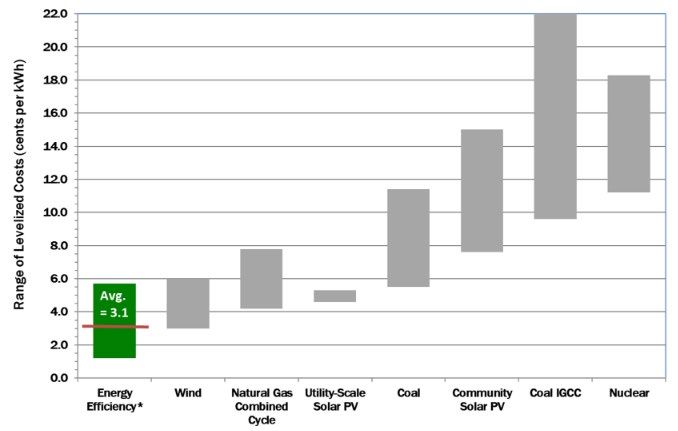
GRID-INTERACTIVE EFFICIENT BUILDINGS TECHNICAL REPORT SERIES: Overview of Research Challenges and Gaps

Glossary
These definitions are for the purposes of the Grid-interactive Efficient Buildings Technical Report Series.
They may be defined differently or more generally in other contexts.

 Grid services                Services that support the generation, transmission, and distribution of
                              electricity and provide value through avoided electricity system costs
                              (generation and/or delivery costs); this report focuses on grid services
                              that can be provided by grid-interactive efficient buildings.

 Distributed energy           A resource sited close to customers that can provide all or some of their
 resource (DER)               immediate power needs and/or can be used by the utility system to either
                              reduce demand or provide supply to satisfy the energy, capacity, or
                              ancillary service needs of the grid.

 Load profile                 A building's load profile describes when—time of day or hour of the
                              year—the building is consuming energy (typically used to refer to
                              electricity consumption but can also describe on-site fuel use);
                              load shape and load curve are often used interchangeably, but all refer to
                              the timing of energy use.

 Energy efficiency            Ongoing reduction in energy use to provide the same or improved level
                              of function.

 Demand flexibility           Capability of DERs to adjust a building’s load profile across different
                              timescales; energy flexibility and load flexibility are often used
                              interchangeably with demand flexibility.

 Demand response              Change in the rate of electricity consumption in response to price signals
                              or specific requests of a grid operator.

 Demand-side                  The modification of energy demand by customers through strategies,
 management                   including energy efficiency, demand response, distributed generation,
                              energy storage, electric vehicles, and/or time-of-use pricing structures.

 Grid-interactive efficient   An energy-efficient building that uses smart technologies and on-site
 building (GEB)               DERs to provide demand flexibility while co-optimizing for energy cost,
                              grid services, and occupant needs and preferences, in a continuous and
                              integrated way.

 Smart technologies for       Advanced controls, sensors, models, and analytics used to manage DERs.
 energy management            GEBs are characterized by their use of these technologies.

                                                      vii
GRID-INTERACTIVE EFFICIENT BUILDINGS TECHNICAL REPORT SERIES: Overview of Research Challenges and Gaps
Table of Contents
1 Background ................................................................................................................................................... 1
1.1 Strategy and Vision ........................................................................................................................ 1
2 Building Demand-Side Management and Associated Grid Services ........................................................3
2.1 Building Demand Flexibility .......................................................................................................... 3
2.2 Grid Services .................................................................................................................................. 6
2.3 Grid Services Potential ................................................................................................................... 9
3 Grid-interactive Efficient Buildings ......................................................................................................... 13
3.1 Characteristics of a Grid-interactive Efficient Building ............................................................... 13
3.2 Key Technologies ......................................................................................................................... 14
3.3 GEB Operational Strategies.......................................................................................................... 17
3.4 Knowledge Gaps and Future Research Opportunities .................................................................. 19
4 References .................................................................................................................................................. 21
Appendix ........................................................................................................................................................... 26
A.1 Grid Services ................................................................................................................................. 26
A.2 Key GEB Technologies ................................................................................................................. 29
A.2.1 Heating, Ventilation, and Air Conditioning (HVAC) ................................................................ 29
A.2.2 Windows and Envelope ............................................................................................................. 30
A.2.3 Water Heating ............................................................................................................................ 31
A.2.4 Refrigeration, Appliances, and Miscellaneous Electric Loads................................................... 31
A.2.5 Electronics.................................................................................................................................. 31
A.2.6 Lighting ...................................................................................................................................... 32
A.2.7 Cross-Cutting Technologies ....................................................................................................... 32
A.2.8 Natural Gas Technologies .......................................................................................................... 33
viiiGRID-INTERACTIVE EFFICIENT BUILDINGS TECHNICAL REPORT SERIES: Overview of Research Challenges and Gaps
List of Figures
Figure 1. Example grid-interactive efficient commercial building ..................................................................2
Figure 2. Building flexibility load curves .......................................................................................................... 4
Figure 3. GEB load curves .................................................................................................................................. 5
Figure 4. Levelized cost of energy resources .................................................................................................... 6
Figure 5. Demand response classifications ........................................................................................................ 8
Figure 6. Demand response evolution................................................................................................................ 8
Figure 7. Characteristics of GEBs ................................................................................................................... 13
Figure 8. Total and peak period 2018 electricity consumption by end use and building type .................... 16
Figure 9. Energy sharing in a high-efficiency district.................................................................................... 18
List of Tables
Table 1. Potential Grid Services Provided by Demand-Side Management in Buildings ............................ 10
Table 2. Mapping Demand-Side Management Strategies to Grid Services ................................................. 12
Table 3. Summary of GEB Technical Report Findings ................................................................................. 16
Table 4. Grid Services Avoided Cost, Buildings Market Size, and Example Building Technologies ....... 27
ixGRID-INTERACTIVE EFFICIENT BUILDINGS TECHNICAL REPORT SERIES: Overview of Research Challenges and Gaps
1 Background
To help inform the building research community and advance the U.S. Department of Energy (DOE) Building
Technologies Office’s (BTO’s) 1 research and development (R&D) portfolio, BTO has published a series of
technical reports that evaluate the opportunities for grid-interactive efficient buildings (GEBs). This overview
report provides background on core concepts of GEBs 2 and serves as an introduction to these technical reports.
In addition to this report, four other reports covering major relevant building technology areas were published
in 2019 as part of the GEB Technical Report Series:
• Overview of Research Challenges and Gaps (this report)
• Heating, Ventilation, and Air Conditioning (HVAC); Water Heating; Appliances; and Refrigeration 3
• Lighting and Electronics4
• Windows and Opaque Envelope 5
• Whole-Building Controls, Sensors, Modeling, and Analytics 6
These reports evaluate state-of-the-art and emerging building technologies that have significant potential to
provide grid services. The reports also identify major research challenges and gaps facing the technologies as
well as opportunities for technology-specific R&D. The GEB Technical Report Series will help inform and
guide BTO’s portfolio and serve as a foundational resource for the larger building research community. On-
site behind-the-meter generation, battery storage, and electric vehicles are also an important part of the
distributed energy resource (DER) optimization strategy for buildings. In general, the component technology
reports do not focus on distributed generation or battery storage, but the Whole-Building Controls, Sensors,
Modeling, and Analytics report discusses how a building can optimize across all DERs.
This report addresses core concepts related to how flexible building loads can be integrated and controlled to
benefit consumers, the electric grid, and society more broadly. The scope of the GEB Technical Report Series
is intentionally focused on technological capabilities and the potential of residential and commercial buildings
to enable and deliver grid services. The GEB Technical Report Series does not address the following topics
that are important in practice, but are considered out of scope: utility programs and policies, business models
and value streams, potential future grid services/resource mixes, technology adoption and market constraints,
product measurement and verification, commissioning, and implementation and scaling challenges. However,
BTO recognizes that many of these topics represent significant barriers that will be addressed in future work
and research to fully realize the potential of GEBs.
1.1 Strategy and Vision
BTO’s mission supports the R&D, validation, and integration of affordable, energy efficiency technologies,
techniques, tools, and services for U.S. buildings (existing and new, residential and commercial). In support of
this mission, BTO is developing a GEB strategy that aims to optimize energy use across DERs to advance the
role buildings can play in energy system operations and planning. The GEB strategy supports broader goals,
including greater affordability, resilience, sustainability, and reliability, recognizing that:
1 For more information, see: https://www.energy.gov/eere/buildings/building-technologies-office.
2 For more information, see: https://www.energy.gov/eere/buildings/grid-interactive-efficient-buildings.
3 Available online here: https://www.nrel.gov/docs/fy20osti/75473.pdf.
4 Available online here: https://www.nrel.gov/docs/fy20osti/75475.pdf.
5
Available online here: https://www.nrel.gov/docs/fy20osti/75387.pdf.
6
Available online here: https://www.nrel.gov/docs/fy20osti/75478.pdf.
1GRID-INTERACTIVE EFFICIENT BUILDINGS TECHNICAL REPORT SERIES: Overview of Research Challenges and Gaps
• Building end uses can be dynamically managed to help meet grid needs and minimize electricity system
costs, while meeting occupants’ comfort and productivity requirements;
• Technologies such as rooftop photovoltaics (PV), battery and thermal energy storage, combined heat and
power (CHP), and other DERs can be co-optimized with buildings to provide greater value, reliability,
and resiliency to utility customers and the overall electricity system; and
• The value of energy efficiency, demand response, and other services provided by behind-the-meter
DERs can vary by location, hour, season, and year.
A key part of this strategy will include utilizing smart technologies (sensors, actuators, controllers, etc.) for
building energy management. This is a core area of technological investment for BTO. Integrating state-of-the-
art sensors and controls throughout the commercial building stock has the potential to save as much as an
estimated 29% of site energy consumption through high-performance sequencing of operations, optimizing
settings based on occupancy patterns, and detecting and diagnosing inadequate equipment operation or
installation problems (Fernandez et al. 2017). Furthermore, state-of-the-art sensors and controls can curtail or
temporarily manage 10%–20% of commercial building peak load (Kiliccote et al. 2016; Piette et al. 2007).
Accordingly, these strategies are available and necessary for implementing flexible, grid-interactive strategies
to optimize building loads within productivity or comfort requirements.
BTO’s GEB vision involves the integration and continuous optimization of DERs for the benefit of the
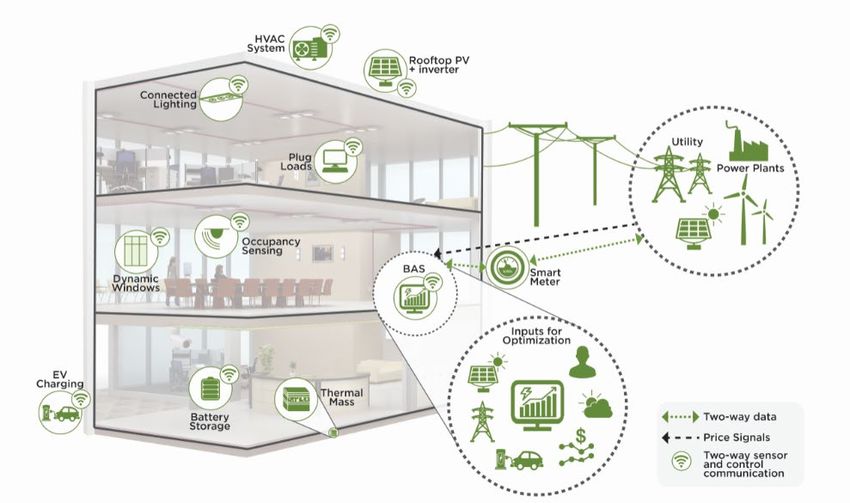
buildings’ owners, occupants, and the electric grid. As shown in Figure 1, the example GEB utilizes analytics
supported by sensors and controls to optimize energy use for occupant patterns and preferences, utility price
signals, weather forecasts, and available on-site generation and storage. In the building depicted in Figure 1, a
suite of advanced building technologies—including the HVAC system, connected lighting, dynamic windows,
occupancy sensing, thermal mass, and distributed generation and battery storage—are optimized to meet
occupant and grid needs. In many buildings, smaller sets of existing technologies could be integrated and
controlled.
© Navigant Consulting
Figure 1. Example grid-interactive efficient commercial building
The building automation system utilizes analytics supported by sensors and controls to optimize energy use for occupant
patterns and preferences, utility price signals, weather forecasts, and available on-site generation and storage.
2GRID-INTERACTIVE EFFICIENT BUILDINGS TECHNICAL REPORT SERIES: Overview of Research Challenges and Gaps
2 Building Demand-Side Management and Associated
Grid Services
2.1 Building Demand Flexibility
Demand flexibility is the capability of DERs to adjust a building’s load profile across different
timescales; energy flexibility and load flexibility are often used interchangeably with demand flexibility.
Growing peak electricity demand, transmission and distribution (T&D) infrastructure constraints, and an
increasing share of variable renewable electricity generation are stressing the electrical grid (U.S. Energy
Information Administration 2019a; Nadel 2017). Flexible electricity loads can be used to reduce grid stress,
creating a more resilient and reliable grid, while simultaneously lowering costs for consumers.
Operating an electricity grid is tantamount to balancing supply and demand for different timescales under the
constraints of limited supply resources and T&D capacity. Demand must be met through matching services
provided by supply-side entities: integrated utilities, grid operators, generators, and/or distributed generation
resources. Demand-side entities such as buildings and electric vehicles may also contribute to balancing supply
and demand, and in this regard, demand-side contributions can be just as viable as supply-side counterparts.
For instance, avoided energy use through energy efficiency is often the least-cost system resource. Beyond
using less total energy, an energy-efficient building benefits the grid by reducing capacity constraints by
lowering energy demand during peak periods.
Buildings offer a unique opportunity for cost-effective demand-side management, because they are the nation’s
primary users of electricity: 75% of all U.S. electricity is consumed within buildings, 7 and perhaps more
importantly, building energy use drives a comparable share of peak power demand. The electricity demand
from buildings results from a variety of electrical loads that are operated to serve the needs of occupants.
However, many of these loads are flexible to some degree; with proper communications and controls, loads
can be managed to draw electricity at specific times and at different levels, while still meeting occupant
productivity and comfort requirements. On-site DERs such as rooftop PV, electric vehicle charging, and
batteries can be co-optimized with building loads to expand demand-side management options. Passive
technologies (envelope, windows, daylighting) increase the efficacy of these strategies. The increased
flexibility can benefit the grid while providing value to owners through reduced utility bills and increased
resilience, among other benefits.
Electric grid needs vary significantly by location, time of day, day of week, and season. Accordingly, a
building may need to manage its electricity load in different ways during these times by reducing load through
year-round energy efficiency, shifting load to different times of the day, and/or increasing load to store for later
use.
This report considers demand-side management strategies that can be implemented in buildings to manage
load:
1. Efficiency: the ongoing reduction in energy use while providing the same or improved level of
building function. 8
7
Buildings consumed 74.6% of electricity in 2018 according to the U.S. Energy Information Administration (2019b).
8
This would have the greatest impact for the grid during high-cost periods and minimize utilization of costly generation resources.
3GRID-INTERACTIVE EFFICIENT BUILDINGS TECHNICAL REPORT SERIES: Overview of Research Challenges and Gaps
2. Load Shed: the ability to reduce electricity use for a short time period and typically on short notice.
Shedding is typically dispatched during peak demand periods and during emergencies.
3. Load Shift: the ability to change the timing of electricity use. In some situations, a shift may lead to
changing the amount of electricity that is consumed. Load shift in the GEB Technical Report Series
focuses on intentional, planned shifting for reasons such as minimizing demand during peak periods,
taking advantage of the cheapest electricity prices, or reducing the need for renewable curtailment. For
some technologies, there are times when a load shed can lead to some level of load shifting.
4. Modulate: the ability to balance power supply/demand or reactive power draw/supply autonomously
(within seconds to subseconds) in response to a signal from the grid operator during the dispatch period.
5. Generate: the ability to generate electricity for on-site consumption and even dispatch electricity to
the grid in response to a signal from the grid. Batteries are often included in this discussion, as they
improve the process of dispatching such generated power.
Figure 2 shows the changes in building load profiles as a result of the first four demand-side management
strategies.
Figure 2. Building flexibility load curves
In these graphs, the gray curve represents an example baseline residential building load and the colored curves (green,
blue, purple, and orange) show the resulting building load. The baseline represents a residential aggregate annual daily
load curve. This baseline curve was generated using the Scout 9 time-sensitive efficiency valuation framework, which
attributes annual baseline energy use estimates from the U.S. Energy Information Administration Annual Energy Outlook 10
across all hours of the year using energy load shapes from the Electric Power Research Institute. 11 All resulting building
load curves (green, blue, purple, and orange) were estimated for illustrative purposes.
The focus of the GEB technical reports is primarily load shed, load shift, and modulating load (referred to
throughout the series as demand flexibility), which are typically enabled by the controls and analytics found in
a GEB.
9 For more information, see: https://scout-bto.readthedocs.io/en/latest/index.html.
10
For more information, see: https://www.eia.gov/outlooks/aeo/.
11
For more information, see: http://loadshape.epri.com/enduse.
4GRID-INTERACTIVE EFFICIENT BUILDINGS TECHNICAL REPORT SERIES: Overview of Research Challenges and Gaps
Figure 3 depicts the daily average load profiles for a building employing various forms of energy efficiency and
demand flexibility. Energy efficiency and distributed generation (in this case, rooftop PV) achieve reductions in
overall energy use. However, the building load peaks coincide with utility peaks. Demand flexibility (shedding or
shifting) is needed to flatten and reduce the building net load profile to provide the greatest support to the grid.
Figure 3. GEB load curves
In these graphs, the gray curve represents an example baseline residential building load curve generated using the Scout
time-sensitive efficiency valuation framework, as in Figure 2. All resulting building load curves (green, yellow, and blue)
were estimated for illustrative purposes and are meant to show the additive effects of efficiency, solar PV, and flexibility in
a single building.
Building owners or occupants that use demand-side management strategies may do so for a variety of
motivations, including compensation through lower utility bills, lower rates, or negotiated payments. In
addition, building operating costs may be reduced by avoiding utility demand charges or time-of-use (TOU)
peaks, which may or may not align with the real-time grid needs. Furthermore, owners or occupants may be
motivated by environmental or other nonfinancial considerations. These strategies also have the potential to
provide grid services that benefit the grid across the three major dispatchable categories: energy, capacity, and
ancillary services. Some of these grid services provide benefits to the grid by avoiding or deferring T&D
upgrades and associated capital expenditures, which can prevent utility customer rate increases. There are
numerous benefits that both the utility system and society can realize from utilizing demand-side management
strategies, including:
• Increased system reliability and resilience
• Increased DER integration
• Improved power quality and reduced customer outages
• Increased owner/occupant satisfaction, flexibility, and choice
• Reduced generation capacity, energy, and ancillary service costs
• Reduced utility operation and maintenance costs
• Reduced T&D costs and losses
• Reduced environmental impacts, including carbon dioxide emissions
• Reduced environmental compliance costs and greater economic development benefits (Woolf et al.
2019).
5GRID-INTERACTIVE EFFICIENT BUILDINGS TECHNICAL REPORT SERIES: Overview of Research Challenges and Gaps
2.2 Grid Services
Grid services refer to services that support the generation, transmission, and distribution of electricity
and provide value through avoided electricity system costs (generation and/or delivery costs).
Buildings can provide a number of grid services across energy, capacity, and ancillary markets when proper
incentives are available. Utility programs and retail/wholesale markets are structured and operated differently
across the nation, with varying requirements, incentives, and compensation. Typically, the potential value of a
DER can be estimated using the cost of avoiding the acquisition of the next least expensive alternative resource
that provides comparable services; that way, building owners/occupants can be compensated accordingly for
engaging in demand-side management strategies. 12 Energy efficiency and demand response are the most
mature and established demand-side resources that provide grid services today (Potter et al. 2018) and are
described in more detail throughout this report. According to the American Council for an Energy-Efficient
Economy (ACEEE), energy efficiency has become the nation’s third largest electricity resource after coal and
natural gas, and efficiency-related savings are estimated to be about 58 quads, which is equivalent to more than
half of today’s energy consumption (Molina et al. 2016). Utility energy efficiency programs remain the lowest-
cost energy resource at an average of 3.1 cents per kilowatt-hour, which is estimated to be between one-fifth
and one-half the cost of some other options (see Figure 4) (Molina and Relf 2018). Supported by the decisions
and policies of state regulators of investor-owned utilities (and their counterparts for publicly owned utilities),
utilities are investing on the order of $6 billion per year in energy efficiency programs today, with increased
investment expected in coming years (Goldman et al. 2018).
Figure 4. Levelized cost of energy resources
Figure from ACEEE (Molina and Relf 2018)
In addition to overall energy savings, energy efficiency plays an important role in supporting grid reliability by
decreasing peak demand and easing strain on the T&D system. As far back as 2001, a study for DOE noted
that peak-demand reductions from energy efficiency measures could enhance electricity system reliability in
12
Some markets use an auction process, which allows all resources to participate to ensure the lowest possible cost.
6GRID-INTERACTIVE EFFICIENT BUILDINGS TECHNICAL REPORT SERIES: Overview of Research Challenges and Gaps
areas experiencing generation shortages or T&D constraints (Osborn and Kawann 2001). By reducing load,
energy efficiency increases the system’s capability to serve demand reliably both on the supply side (by
offsetting otherwise needed generation and thereby boosting the system’s reserve margin) as well as on the
T&D side (by increasing capacity in both the low- and high-voltage systems) (Relf, York, and Kushler 2018).
Several utilities have even started using geographically targeted energy efficiency improvements as a so-called
“non-wires alternative” to defer expensive T&D upgrades in congested areas (Neme and Sedano 2012). In
addition, some regional transmission organizations (RTOs) and independent system operators (ISOs) allow
energy efficiency to bid into capacity markets alongside other resources.
The value of the demand reduction achieved by customer energy efficiency programs is a function of the
amount, timing, and location of the savings, as well as the utility system’s physical and operational
characteristics, such as the timing of peak demand (summer or winter and time of day), load factor, and reserve
margin (Relf, York, and Kushler 2018). Energy efficiency improvements that reduce load during times of
electric system peaks are more valuable from a grid perspective than those that occur during off-peak periods
(Mims Frick, Eckman, and Goldman 2017). Some energy efficiency improvements are load following,
yielding high electricity savings during daily and seasonal system peaks. For example, high-efficiency air
conditioning uses less energy and reduces peak demand in summer peaking areas compared to inefficient air
conditioning (Relf, York, and Kushler 2018).
An important and easily overlooked peak capacity benefit of energy efficiency is the reduction in marginal
T&D line losses it can deliver. Most analysts who consider line losses at all use the system-average line losses,
not the marginal line losses that are avoided when energy efficiency measures are installed. During peak load,
marginal losses can be up to 2–3 times the average loss, because resistive losses scale nonlinearly with the load
(Lazar and Baldwin 2011). Because a utility’s generating reserve requirements have to cover these marginal
losses, on-peak energy efficiency can produce twice as much ratepayer value as the average value of the
energy savings alone, once the generation, transmission, and distribution capacity, line loss, and reserves
benefits are accounted for (Lazar and Baldwin 2011). Additional benefits include reduced fuel usage,
improved air quality, and lower consumer bills.
In contrast to energy efficiency, which emphasizes lower annual energy use, demand response emphasizes the
timing of energy use to focus on peak demand, sometimes with the consequence of increases in overall energy
use. Building owners benefit from demand response by avoiding high peak charges or receiving incentive
payments, whereas the grid benefits from increased reliability, avoided operating costs, and deferred or
avoided capital upgrade costs. Demand response is the main form of demand flexibility already utilized in both
residential and commercial buildings.
Figure 5 shows the two classifications of demand response, dispatchable and nondispatchable, which depend
on who has the authorization to modify the building’s controls (Smart Electric Power Alliance [SEPA] 2017).
Dispatchable demand response relies on communication and control technologies that respond directly to
signals from the grid operator, utility, or a third-party aggregator. Nondispatchable demand response activates
at the discretion of the building owner in response to price signals. Currently, predetermined TOU electricity
prices and demand charges are common forms of nondispatchable demand response, but dynamic real-time
pricing is a future opportunity.
7GRID-INTERACTIVE EFFICIENT BUILDINGS TECHNICAL REPORT SERIES: Overview of Research Challenges and Gaps
Figure 5. Demand response classifications
Adapted from Smart Grid (Prindle and Koszalka 2012)
The Peak Load Management Alliance and the Smart Electric Power Alliance summarize the evolution of
dispatchable demand response as DR 1.0, DR 2.0, and DR 3.0, as shown Figure 6 (SEPA 2017; Peak Load
Management Alliance [PLMA] 2017).
Figure 6. Demand response evolution
Modified from SEPA (2017)
8GRID-INTERACTIVE EFFICIENT BUILDINGS TECHNICAL REPORT SERIES: Overview of Research Challenges and Gaps
DR 1.0 describes original demand response initiatives, in which utilities communicate to customers through a
pager or telephone message to manually change energy consumption during periods of high wholesale power
prices, limited generation capacity, or constrained delivery capacity (SEPA 2017). DR 1.0 techniques began in
the 1990s and early 2000s with interruptible tariffs for large commercial and industrial customers (SEPA 2017;
PLMA 2017). DR 1.0 also included direct load control water heaters and air conditioners for load shedding at
times of grid stress.
DR 2.0 describes bilateral utility communications, including two-way switches and programmable
communicating thermostats. Starting in the early 2000s, increasing use of automation and two-way
communications improved the precision of demand response dispatch and allowed timely and accurate
measurement and verification (SEPA 2017; PLMA 2017). DR 2.0 allows for increased participation in
wholesale electricity markets and grid operations through ancillary services. DR 2.0 also may be used to shift
load to off-peak times when renewable resources are abundant (SEPA 2017).
DR 3.0 describes demand response as a component of DERs. DR 3.0 initiatives, including technologies such as
smart thermostats, energy storage, and PV, can provide services including renewable energy integration and
distribution congestion management. In DR 3.0, demand response transitions from an ad hoc service
dispatched by utilities and grid operators to more of an autonomous and holistic function orchestrated by
building automation systems and other connected devices in response to dynamic electricity prices and/or other
grid signals. BTO’s GEB vision involves a similar focus as DR 3.0, in which shedding, shifting, and
modulation are optimized and integrated by an energy management system.
2.3 Grid Services Potential
Buildings can provide significant benefits to the grid through a combination of actions that reduce or adjust
electricity consumption to avoid electricity system costs. Grid services that can provide economic value can be
characterized as services that:
• Reduce generation costs by offsetting generation capacity investments, avoiding power plant fuel
costs, avoiding operation and maintenance costs, or providing ancillary services such as frequency and
voltage support as well as regulation and contingency reserves at lower cost, and/or
• Reduce delivery costs by offsetting T&D capacity investments, increasing T&D equipment life,
reducing equipment maintenance, or supporting T&D ancillary services such as distribution-level
voltage control at a lower cost.
Table 1 summarizes the potential of buildings to provide grid services and the associated market size (based on
today’s markets and building technologies). The market sizes are based on two factors: the typical wholesale
generation market size (see Appendix A.1, Table 4) and the potential for buildings to provide the service
relative to other supply-side resources. As more renewables are added to the grid, market sizes and services
offered could significantly change (e.g., frequency regulation and ramping services may have a higher demand
and new products may emerge that support renewable curtailment). 13
13 The data used to generate these potential market sizes were derived from available data from ISO/RTOs. Today, ISO/RTO electricity markets serve two-
thirds of electricity consumers in the United States (ISO/RTO Council 2019). The map given in Federal Energy Regulatory Commission (2015) illustrates
the footprint of each ISO/RTO region. ISO/RTO electricity markets are used as proxy for overall market size.
9GRID-INTERACTIVE EFFICIENT BUILDINGS TECHNICAL REPORT SERIES: Overview of Research Challenges and Gaps
Table 1. Potential Grid Services Provided by Demand-Side Management in Buildings
Grid Potential Avoided Potential Market Size 14
Services Cost Addressable by Demand-Side Management in Buildings
Generation Services
Large. The market potential for reducing generation operations is large
Power plant fuel, because it is a service in every RTO/ISO. Reducing generation operations
operation, involves optimizing operation conditions and utilizing lowest-cost generation.
Generation:
maintenance, and For buildings, energy efficiency has the greatest potential to reduce generation
Energy
startup and shutdown operations. Demand response also has moderate potential, though the market
costs size is limited by peak/off-peak price spread and hourly marginal costs, which
vary by RTO/ISO (and some utilities) and change over time.
Large. Deferred generation capacity investment results primarily from peak
demand reduction. The size of the market varies by region based on the
Capital costs for new marginal generation costs and system load profiles. Buildings can play a large
generating facilities role in reducing the peak demand because they are the primary driver of peak
Generation:
and associated fixed electricity demand. Buildings can contribute to this service by both lowering
Capacity
operation and the overall need for generation through energy efficiency as well as providing
maintenance costs short-term load reduction to address system peaks. For buildings, demand
response has the greatest potential to address capacity needs. 15
Ancillary Services
Power plant fuel, Moderate. The market for contingency reserves is significantly smaller than
Contingency operation, those for generation capacity or generation operations, making up less than
maintenance, and 3% of U.S. peak demand (Ela et al. 2011; Denholm et al. 2015). Despite the
Reserves 16 associated opportunity small market, buildings are well positioned to provide contingency reserve
costs products by reducing demand for short periods of time.
Power plant fuel, Small. Each RTO/ISO requires less than 1,000 megawatts (MW) of frequency
operation, regulation—less than 1% of total U.S. generation capacity (Denholm et al.
maintenance, and 2015; Tacka 2016). In addition to the small market, demand-side resources
Frequency must compete against cost-effective distributed supply-side resources that
Regulation opportunity costs 17 provide frequency regulation. In some RTO/ISOs, generators are required to
associated with provide frequency regulation, but rules are changing to allow distributed
providing frequency resources to participate. Multiple technologies (variable frequency drives,
regulation water heaters, batteries, solar inverters) can provide frequency regulation.
Small. Ramping services are an emerging market that is currently not offered
Power plant fuel, in most RTO/ISOs. Ramping services include resources that offset rapid
operation, changes in generation output. It is expected to grow as more variable
Ramping maintenance, and renewable generation is added to the grid. Buildings can provide quick
startup and shutdown response ramping services from technologies that can dispatch/store
costs electricity (batteries) and can be cycled to offset generation shortfalls (HVAC).
Delivery Services
Moderate. Opportunities to defer or avoid the need for investments in T&D
infrastructure are highly location dependent. Further, the resource must be
Non-Wires Capital costs for T&D located electrically downstream from the transmission or distribution
Solutions 18 equipment upgrades equipment to provide this service. Buildings can provide non-wires solutions in
a variety of ways, including energy efficiency, demand response, distributed
generation, voltage support, and energy storage.
Capital costs for Small. Payments available for voltage support (or reactive power
voltage control compensation) from demand-side resources vary significantly depending on
Voltage equipment (e.g., the utility context and the size. Multiple building technologies can provide
Support capacitor banks, limited voltage support, including rooftop solar inverters and battery inverters,
transformers, smart though they must compete against cost-effective supply-side resources,
inverters) including transformers, fixed capacitor banks, and line regulators.
14 See Appendix A.1 for citation and basis for sizing potential markets.
15 See Appendix A.1, Table 4, for further information.
16 Including reserves products with various timescales, including spinning/nonspinning reserves and other reserves products that exist in some regions.
17
E.g., not selling power in order to be ready for up-regulation.
18
Also referred to as deferred T&D upgrades or non-wires alternatives.
10GRID-INTERACTIVE EFFICIENT BUILDINGS TECHNICAL REPORT SERIES: Overview of Research Challenges and Gaps
Grid benefits provided by buildings must be aggregated across a number of buildings to be a meaningful grid
resource. Grid services also require certain duration and response times, load changes, and event frequencies.
In some situations, the building owner/operator may not even be aware how the building’s flexibility is being
aggregated or what grid services are provided. The most important inputs needed for building owners/operators
to make building-level energy management decisions include how the end-use operations need to change, the
duration and amount of change needed, and the compensation for that change.
Table 2 shows how changes in building operations map to the grid services in Table 1.
11GRID-INTERACTIVE EFFICIENT BUILDINGS TECHNICAL REPORT SERIES: Overview of Research Challenges and Gaps
Table 2. Mapping Demand-Side Management Strategies to Grid Services
Response time is defined as the amount of time between receiving a signal from the utility/operator and the building asset
responding to change the load. Duration is the length of time that the load change occurs.
Demand-
Side Description of Building
Grid Services Key Characteristics
Management Change
Strategies
Persistent reduction in load. Typical duration Continuous
Generation: Energy Load change Long-term decrease
Interval data may be needed
Generation: Capacity Response time N/A
Efficiency for measurement and
T&D: Non-Wires
verification purposes. This is
Solutions Event frequency Lifetime of equipment
not a dispatchable service.
Typical duration Up to 1 hr
Load reduction for a short time
Contingency Load change Short-term decrease
to make up for a shortfall in
Reserves Response timeGRID-INTERACTIVE EFFICIENT BUILDINGS TECHNICAL REPORT SERIES: Overview of Research Challenges and Gaps
3 Grid-interactive Efficient Buildings
3.1 Characteristics of a Grid-interactive Efficient Building
A grid-interactive efficient building (GEB) is an energy-efficient building that uses smart technologies and
on-site DERs to provide demand flexibility while co-optimizing for energy cost, grid services, and occupant
needs and preferences, in a continuous and integrated way. The key characteristics and strategies of
GEBs are discussed in this section.
The ability to take an integrated approach to demand-side management requires smart technologies, including
advanced controls, sensors and models, and data analytics, that can meet occupant requirements and respond to
changing grid and weather conditions. Today, behind-the-meter DERs—including energy efficiency, demand
response, distributed generation, electric vehicles, and storage—are typically valued, scheduled, implemented,
and managed separately. BTO’s GEB vision involves the integration and continuous optimization of these
resources for the benefit of the buildings’ owners, occupants, and the grid. BTO recognizes that this is a long-
term vision and that there is continuum—from manual operation of buildings to fully automated energy
management platforms—that allows for continuously improving integration and optimization.
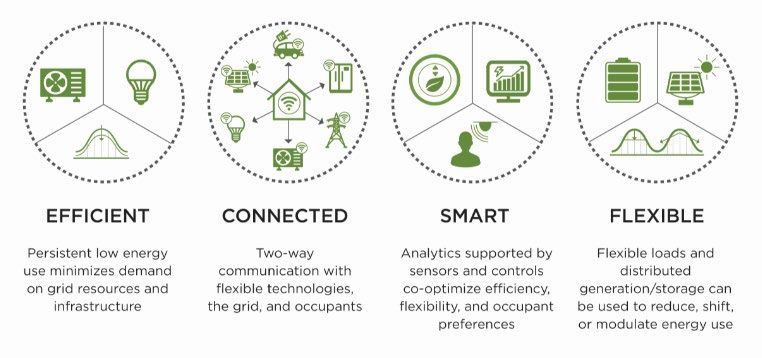
GEBs are generally characterized by four features, as outlined in Figure 7. They are energy efficient—high-
quality walls and windows, high-performance appliances and equipment, and optimized building designs are
used to reduce both net energy consumption and peak demand. Second, they are connected—the ability to send
and receive signals is required to respond to grid needs that are time dependent. They are also smart—analytics
supported by ubiquitous sensing and optimized controls are necessary to manage multiple behind-the-meter
DERs in ways that are beneficial to the grid, building owners, and occupants. Finally, they are flexible—the
building energy loads can be dynamically shaped and optimized through behind-the-meter generation, electric
vehicles, and energy storage.
Figure 7. Characteristics of GEBs
13GRID-INTERACTIVE EFFICIENT BUILDINGS TECHNICAL REPORT SERIES: Overview of Research Challenges and Gaps
These key characteristics are enabled by capabilities at both the individual equipment level and the centralized
system level. First, individual devices, appliances, and equipment within the building can monitor and
communicate their operating conditions and respond to control commands to provide demand flexibility.
Second, the building can better coordinate across loads with the following attributes:
• Equipment and control systems support two-way connectivity and communications with devices,
equipment, and appliances within the building, as well as the grid
• Equipment is designed to monitor, report, and provide flexibility to shed, shift, or modulate load by
responding to control commands
• Control system can monitor, incorporate, predict, and learn from building-level conditions (occupant
needs and preferences) and outdoor conditions (weather and grid needs)
• Control system can coordinate and execute complex control strategies that adapt based on changing
conditions over multiple timescales
• Control system can quantitatively estimate and verify the energy and demand savings of different
strategies and impacts from stochastic building conditions (e.g., occupancy behavior)
• Control system optimization techniques can choose among multiple strategies and balance efficiency
with flexibility and occupancy comfort
• The system is interoperable, having the ability to effectively and securely exchange data and control
signals among connected devices/equipment/appliances and control systems
• The system is resilient to cyberattacks and threats, having the ability to perform the services described
above while maintaining end-to-end data security and protection against unauthorized access.
3.2 Key Technologies
The GEB Technical Report Series evaluates a suite of building technologies based on their potential to provide
grid services through energy efficiency and demand flexibility. Technologies spanning thermal storage and
electrical loads from nine different building systems and components are evaluated: HVAC, water heating,
appliances, refrigeration, miscellaneous electric loads, electronics, lighting, windows, and envelope. In
addition, several cross-cutting technology areas and natural gas technologies are also evaluated. Each report
evaluates technologies within the same technical area (HVAC, water heating, etc.) and classifies them as high,
medium, or low potential. It is important to note that these reports do not identify the highest potential
technologies across all technical areas; this is an opportunity for future analysis. More information on each
technology and the evaluation process is available within each technical report. 19 A summary of findings
across the GEB technical reports is presented in Table 3.
19
See Section 1 for relevant links to each report.
14GRID-INTERACTIVE EFFICIENT BUILDINGS TECHNICAL REPORT SERIES: Overview of Research Challenges and Gaps
Table 3. Summary of GEB Technical Report Findings
Technology Area High Potential Medium Potential Low Potential
• Dynamic Glazing • Photovoltaic Glazing • None
Windows
• Automated Attachments
• Thermally Anisotropic • Moisture Storage and • Building-Integrated
Materials Extraction Photovoltaics
Envelope • Envelope Thermal Storage • Variable Radiative
• Tunable Thermal Technologies
Conductivity Materials
• Advanced Sensors and • Hybrid Daylight Solid- • Solid-State Lighting
Lighting
Controls State Lighting Systems Displays
• Continuous-Operation • Battery-Powered • Electronic Displays
Electronics
Electronics Electronics
• Smart Thermostats • Advanced Controls for • Hybrid Evaporative
• Separate Sensible and HVAC Equipment with Cooling
HVAC Latent Space Conditioning Embedded Thermostats • Dual-Fuel HVAC
• Liquid Desiccant Thermal
Energy Storage
• Water Heaters with Smart, • None • Dual-Fuel Water
Water Heating
Connected Controls Heaters
• MELs: Water Heating 20 • Modulating, Advanced • None
Clothes Dryers
• Advanced Dishwasher
and Clothes Washer
Appliances, Controls
Refrigeration, and • Advanced Refrigerator
Relevant and Freezer Controls
Miscellaneous • Advanced Controls for
Electric Loads Commercial Refrigeration
(MELs) • MELs: Motors 21
• MELs: Water Circulation 22
• MELs: HVAC20
• MELs: Refrigeration20
• Building-Scale CHP • Smart Thermostats • Dual-Fuel HVAC
Natural Gas • Water Heaters with Smart, • Modulating, Advanced • Dual-Fuel Water
Connected Controls Clothes Dryers Heaters
• Building Automation • Modulating Capacity • None
System 23 Vapor Compression21
Cross-Cutting • Embedded Thermal Energy
(applies to more Storage 24
than one technology • Non-Vapor-Compression
area) Materials and Systems21
• DC Technologies20
• Batteries20
20 Examples include dehumidifiers, ceiling fans, furnace fans, and kitchen ventilation.
21 Examples include fans, pumps, small kitchen appliances, and refrigeration.
22 Examples include pool pumps, boiler pumps, condensate drainage pumps, spa/hot tub pumps.
23
These technologies are discussed in the Appendix A.2 in this report, but are not included in the individual technical reports.
24
These technologies are discussed in the HVAC, Water Heating, Appliances, and Refrigeration report.
15GRID-INTERACTIVE EFFICIENT BUILDINGS TECHNICAL REPORT SERIES: Overview of Research Challenges and Gaps
Additional information on each high-potential technology is provided in Appendix A.2. Though technologies
were not compared across technology areas, the relative magnitude of total and peak period electricity use
affected by each technology serves as a proxy for its potential to impact the grid through efficiency and
demand flexibility. Figure 8 shows the breakdown of U.S. residential and commercial building electricity use
in 2018 by major end use, across all hours and daily peak period hours (2–8 p.m.). The figure shows that
cooling is the primary contributor to residential peak (36% of major end uses), while end-use contributions to
peak are more evenly split in the commercial sector.
Figure 8. Total and peak period 2018 electricity consumption of major end uses by building type 25
25 Data are generated using the Scout time-sensitive efficiency valuation framework (Satre-Meloy and Langevin 2019), which attributes annual baseline
energy use estimates from the EIA’s 2019 Annual Energy Outlook across all hours of the year using energy load shapes from ResStock (NREL)
(https://www.nrel.gov/buildings/resstock.html) and the Commercial Prototype Building Models
(https://www.energycodes.gov/development/commercial/prototype_models). Contributions of each end use to total peak period energy use were calculated
with Scout using the energy savings from a measure representing 100% energy use reduction for the entire end use for one hour (e.g., 3–4 p.m.) during the
peak period. The energy savings from each hour for a given end use were then summed across the peak period.
16GRID-INTERACTIVE EFFICIENT BUILDINGS TECHNICAL REPORT SERIES: Overview of Research Challenges and Gaps
3.3 GEB Operational Strategies
In contrast to the other GEB technical reports, the Whole-Building Controls, Sensors, Modeling, and Analytics
report discusses the operational implementation of demand flexibility. The focus of the report is on
communication, control, and sensing infrastructures that can support demand flexibility within a GEB (or set
of GEBs) while considering critical operational aspects, including the impact on occupants and how the impact
is quantified and valued. One key operational consideration is if demand flexibility should be managed at the
device, end-use, or building level, which requires evaluating the impact of performance, complexity, latency,
scalability, and security. Given these considerations, the following conclusions can be drawn:
• HVAC shedding and shifting is best aggregated at the building level because coordination of multiple
devices, coupled with building thermal mass and mechanisms and processes that couple zones together,
make it likely that building-level approaches will outperform a device-level approach.
• Other end uses providing shedding or shifting can be implemented at either the building level, device level
or end-use level. Different end uses generally have only limited physical interactions with one another and
with HVAC. (Although lighting and electrical appliances produce heat loads, in most cases the load is
small relative to weather and occupancy/ventilation induced loads.) Limited physical interaction indicates
that demand flexibility for different end uses can be implemented independently, without accounting for
physical interactions with other end uses.
• End uses being used for modulation (fast services such as frequency regulation) are best provisioned at the
device level. Given the time response requirements to provide these services, latency constraints point to
the need to minimize the number of communication hops and coordination layers.
If managing for demand flexibility at the building level, which may be needed for optimal HVAC potential, a
GEB should be able to gather data from grid/weather signals as well as daylighting and occupancy sensors,
process them through an intelligent energy management system, and execute a control strategy that optimizes
benefits to occupants and the grid. For example, an energy-efficient building with an insulated, tight envelope
and efficient HVAC system can provide occupant thermal comfort with low energy use. In that same building,
demand response could be provided by changing temperature set points or cycling HVAC systems in response
to external grid signals. However, a GEB goes beyond the traditional capabilities of energy efficiency and
demand response to enable buildings to shed or shift loads through advanced equipment and system controls.
Examples include:
• A building that can take occupancy and occupant preferences into account and can change cooling set
points by varying amounts depending on electricity prices and grid signals
• A building that integrates owner and occupant priorities for thermal comfort and other services and sheds
load in priority order
• A building that can adjust solar heat gain to reduce heating/cooling needs through dynamic windows
with automatic shading
• A building that has significant amount of thermal mass, potentially using phase change materials, to
support precooling/coasting for long periods.
As described in the previous section, the GEB technical reports evaluate technologies based on their capability
to provide efficiency and demand flexibility. However, the reports do not provide detail on technology
interactions/integration and the subsequent impact on efficiency or demand flexibility potential. Integration
strategies between building technologies are an active area of research. For instance, exploring when and how
energy efficiency and demand flexibility are synergistic or in conflict is an important consideration. Another
aspect is better understanding which end uses have strong interactions for shedding and shifting building loads.
17You can also read