BUILDINTEREST DELIVERABLE 3.2 FINANCING PLATFORM REPORT
←
→
Page content transcription
If your browser does not render page correctly, please read the page content below
BuildInterest
                        Deliverable 3.2

      Financing Platform Report
                          The Netherlands

Due date of deliverable: 01/04/2017
Submission date: 27/06/2017
Start date of project: 01/04/2016
Project duration: 24 Months
Contact person responsible for this deliverable: Esther Ruijgvoorn
Organisation name responsible for this deliverable: Duurzaam Gebouwd

 Project co-funded by European Commission within Horizon 2020
                                           Dissemination level
 PU             Public                                                                        x
 PP             Restricted to other programme participants (including the Commission
                Services)
 RE             Restricted to a group specified by the consortium (including the Commission
                Services)
 CO             Confidential, only for members of the consortium (including the Commission
                Services)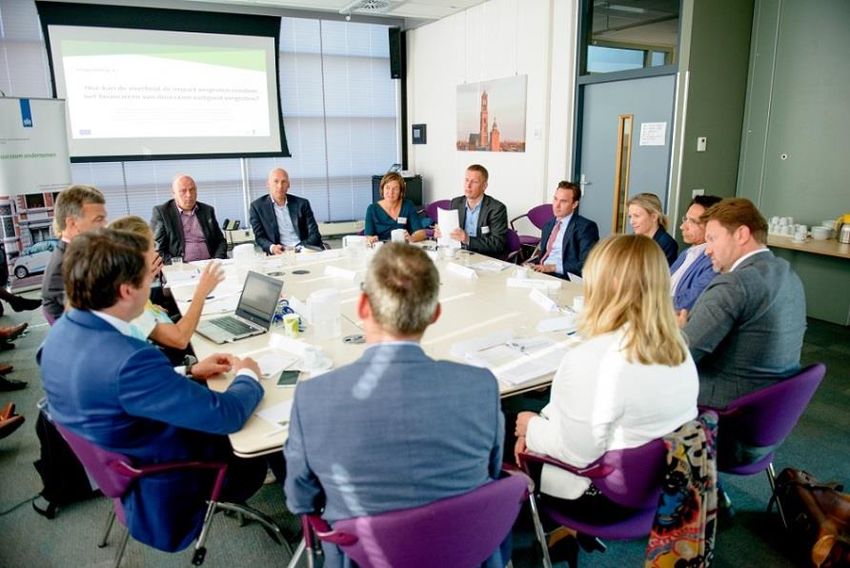
DOCUMENT INFORMATION

Authors

               Name                    Company                      E-mail
          Esther Ruijgvoorn        Duurzaam Gebouwd      ruijgvoorn@greenbuildinvest.nl

Reviewers

            Name                      Company                        E-mail
        Marco Bakker                PNO Consultants    Marco.Bakker@pnoconsultants.com
      Roel van der Veen             PNO Consultants   Roel.vanderveen@pnoconsultants.com

Document Control

   Document              Date                           Change
    version
      V.1             31.03.2017                       First draft
      V.2             06.06.2017                      Second draft
      V.3             27.06.2017                          Final

                                                                                           2
Contents
1.     Introduction ............................................................................................................................................ 5
     1.1       The BuildInterest project ................................................................................................................ 5
     1.2       About this report ............................................................................................................................ 6

Part I – Analysis ...................................................................................................................................7
2.     Market Scoping ....................................................................................................................................... 8
     2.1       Stakeholder Analysis....................................................................................................................... 8
     2.2       Market Analysis .............................................................................................................................. 8
       2.2.1      Building stock in the Netherlands .............................................................................................. 9
       2.2.2      Energy consumption per sector ............................................................................................... 11
       2.2.3      Energy saving goals................................................................................................................... 12
       2.2.4      Impacts for the employment opportunities ............................................................................. 13
3.     Stakeholder Consultation...................................................................................................................... 14
     3.1       Interviews ..................................................................................................................................... 14
     3.2       Roundtables/focus groups............................................................................................................ 15
     3.3       Survey ........................................................................................................................................... 16
4.     Barriers and solutions ........................................................................................................................... 18
     4.1       Barriers ......................................................................................................................................... 18
       4.1.1      Introduction ................................................................................. Error! Bookmark not defined.
       4.1.2      Barriers in literature ................................................................................................................. 18
       4.1.3      Barriers - The Netherlands ....................................................................................................... 22
       4.1.4      Conclusion ................................................................................................................................ 23
     4.2       Solutions ....................................................................................................................................... 24
       4.2.1      Solutions - The Netherlands ..................................................................................................... 24
       4.2.2      Solution Focus .......................................................................................................................... 24
       4.2.3      Selected Solutions .................................................................................................................... 25
       Real Estate valuation – Education valuators on certification schemes ................................................ 26
       Process and document standardisation – Gas-free neighbourhoods................................................... 26
       Availability of examples – Showcasing projects.................................................................................... 27

Part II - Implementation..................................................................................................................... 28
5.     Green BuildInvest Initiative................................................................................................................... 29
6.     Platform strategy .................................................................................................................................. 30
     6.1       Stakeholder involvement.............................................................................................................. 30
     6.2       Platform continuity ....................................................................................................................... 31

                                                                                                                                                                  3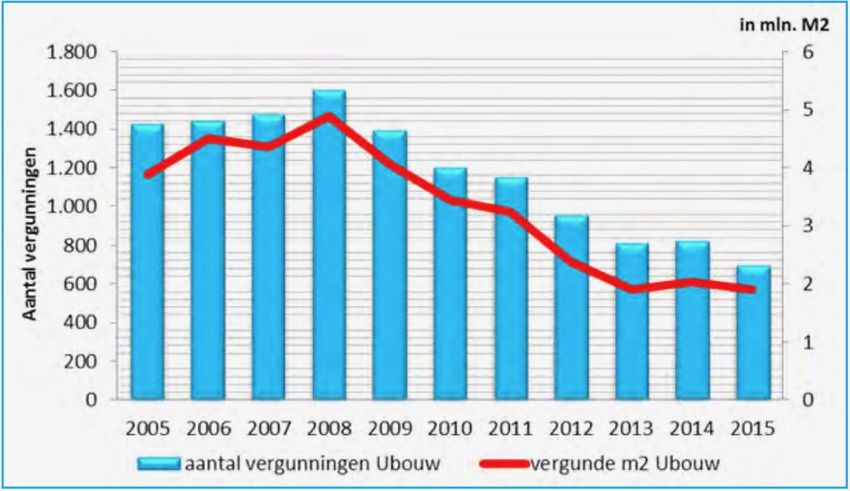
7.      Implementation Plan ............................................................................................................................ 32
     7.1        Implementation plan for selected solutions................................................................................. 32
        Real Estate valuation – Education valuators on certification schemes ................................................ 32
        Process and document standardisation – Gas-free districts ................................................................ 33
        Availability of examples – Showcasing projects.................................................................................... 34
     7.2        Monitoring .................................................................................................................................... 35
References ..................................................................................................................................................... 36

Annex A: PEEF Platform - NL ......................................................................................................................... 37
     A1: Statement of Intent - PEEF.................................................................................................................. 37
     A2: Concept terms of reference PEEF ....................................................................................................... 42
Annex B – Stakeholder consultation ............................................................................................................. 45
     B1: Interview summaries .......................................................................................................................... 45
        B1.1: Interview summaries – The Netherlands ..................................................................................... 45
     B2: Roundtable minutes............................................................................................................................ 47
        B2.1: Roundtable minutes – The Netherlands ...................................................................................... 47
Annex C – Expertmeetings planned .............................................................................................................. 51

                                                                                                                                                                 4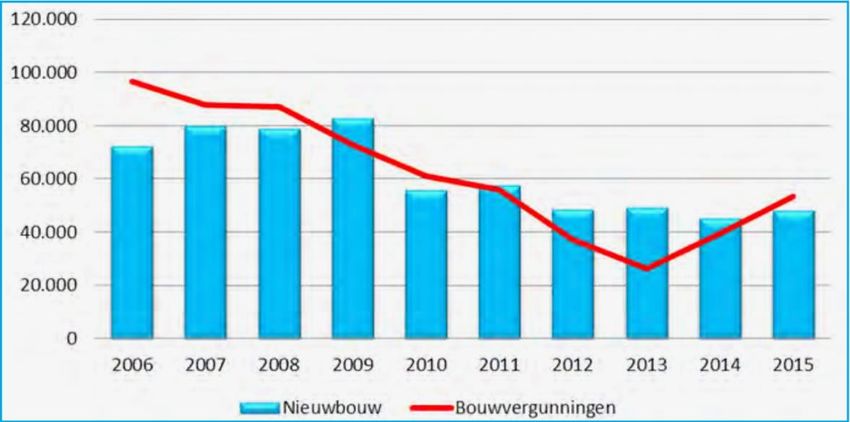
1.         Introduction

1.1        The BuildInterest project
The built environment is the sector with the largest energy consumption in Europe: nearly 40% of final
energy consumption—as well as 36% of all greenhouse gas emissions—is attributable to housing, offices,
shops and other buildings across the public and private sector. For the EU to meet its 2020 climate change
and energy objectives and its 2050 decarbonisation agenda, a major and sustained increase in public and
private investment is needed. To achieve the 20% energy efficiency target by 2020 requires an investment
of €100bn per year, 70% of which needs to be directed to buildings1. However, the EU is currently at
around half that level of investment so considerable progress needs to be made.

Lack of investments in energy measures in the built environment is an important bottleneck for Europe to
reach its 20-20-20 targets. This bottleneck for investment is due to a number of linked, but distinct
barriers. Perhaps most importantly, investors and financiers lack trust in the financial viability of
sustainable energy measures. Although this is certainly not the only barrier, many of the other barriers
are also related to financing the required investments.

The exact nature of these barriers varies from country to country and is highly dependent on local and/or
regional circumstances, including the type of building stock, legislative and regulatory frameworks, the
scale and maturity of the financial sector and sustainable energy market and the overall level of education
and awareness amongst public decision makers.

To bring the different stakeholders closer together, this project has built three national platforms in The
Netherlands, France and Italy. The aim of these platforms is to develop and implement solutions to
increase the attractiveness of investments in sustainable energy and energy efficiency in buildings. For
example with financial tools and instruments, but also with any other tool or measure that is found to be
most effective in overcoming the barriers in financing sustainable buildings, such as template contracts,
valuation methods, financial standardisation tools, as well as any supporting legal or regulatory measures.
All of these instruments are aimed at the creation of an ongoing, structural dialogue between the financial
and building sector, leading to a better mutual understanding and an increased trust of investors in
investments in the building sector.

BuildInterest is cut in roughly two phases: The focus in year 1 is on building the stakeholder platforms and
collecting barriers and solutions. In year 2, BuildInterest will help to implement the most successful and
promising solutions in the market, together with our stakeholders. In year 2 also an impact assessment for
the events, organised on the three national platforms will be carried out. This report marks the end of
phase 1, describes its results, and lays down the strategy for year 2.

The three project partners that run the national platforms in BuildInterest have different backgrounds.
Duurzaam Gebouwd (NL) is a networking and platform organisation within the building sector of the
Netherlands. ASTER (IT) is a consortium of the Emilia-Romagna Regional Government, the six Universities,
the National Research Centres located in the region, the Regional Union of Chambers of Commerce and
the regional Entrepreneurial Associations. Bpifrance (FR) is a public investment bank that assists
companies from seed funding to IPO, from loans to equity.

It is the aim of this project to let each partner use its own strength to maximise impact. This leads to a
different emphasis in the approach of each platform. At the same time we need a structured approach
that enables comparison and comprehensive analysis. It is one of the challenges of this project to strike
the right balance.

1   Financing the energy renovation of buildings with Cohesion Policy funding, EC commissioned report, 2014

                                                                                                              5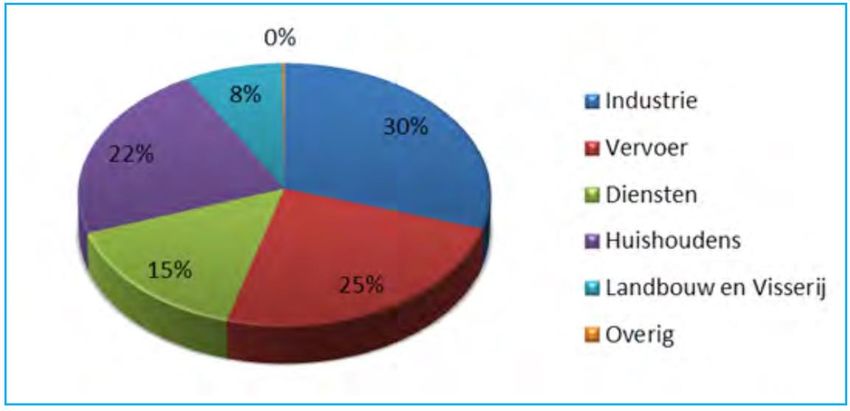
1.2     About this report
This report is one of three identical reports for each of the three financing platforms in the BuildInterest
project (NL, IT and FR). The report presents for the Dutch platform the result of the first year of the
BuildInterest project and lays down the strategy for year 2. It is structured along the lines of the project
itself.

Part I – Analysis
1.       Introduction
2.       Market Scoping
3.       Stakeholder Consultation
4.       Barriers and solutions

Part II - Implementation
5.        Green BuildInvest
6.        Platform strategy
7.        Implementation Plan

Part I of the report corresponds to year 1 of the project and covers the analysis of the market (chapter 2),
stakeholders (chapter 3) and the barriers and solutions (chapter 4) for energy efficiency financing in the
built environment. The selection of solutions to be implemented in year 2 marks the end of chapter 4 and
year 1 of the project.

The launch of the financing platform Green BuildInvest (chapter 5) marks the start of phase and year 2 of
the BuildInterest project. This financing platform facilitates stakeholder dialogue and the implementation
of the solutions that were selected at the end of year 1. The Platform strategy for this is laid down in
chapter 6. Chapter 7 describes the Implementation plan for the selected solutions.

                                                                                                               6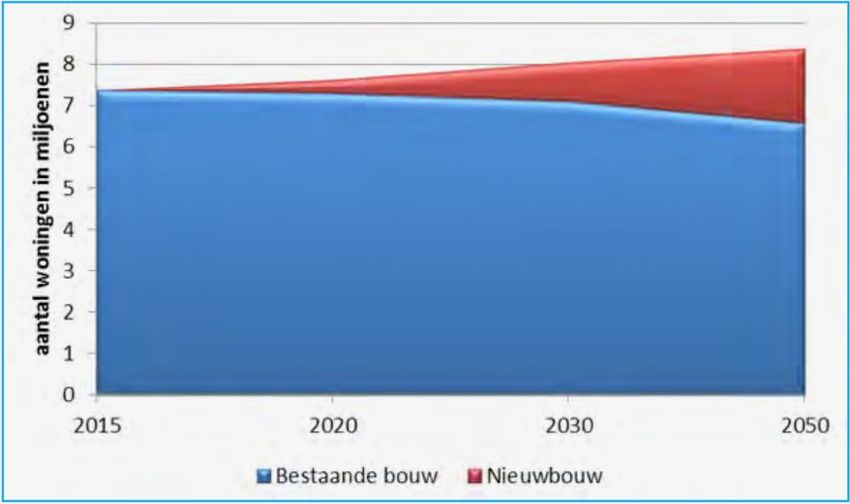
Part I – Analysis

                    7
2.        Market Scoping
A key objective of the project is to facilitate stakeholder dialogue. The project therefore starts with an
analysis of the stakeholders involved in energy efficiency financing in the building sector.
This analysis is followed by an analysis of the market, including an analysis of the building stock, its energy
use and the existing regulations.

2.1       Stakeholder Analysis
The Dutch real estate and financing/investing market is a very network driven community where there is a
wide knowledge about the important stakeholders, the more engaged stakeholders and the
knowledgeable stakeholders. Because of this we decided to make the stakeholder analysis in two steps.
For the first year we decided not to make a very comprehensive stakeholder analysis based on
knowledge, engagement and such, but to look at the different stakeholder groups and get at least 5
stakeholders from every group engaged in the dialogue about barriers and solutions. We chose to do this
to make create a better engagement for the platform by engaging stakeholder who were willing to share
their expertise and knowledge. Because of the network driven market, most sentiments about energy
efficiency / sustainability with the different stakeholders is known and therefore it was quite easy for us
to get a very divers input, both with the more negatively inclined and the more positive inclined toward
this topic.
For the second year we are broadening the stakeholder analysis to use this as an engagement tool for the
platform. Main questions there are:
      -   Are all the relevant parties engaged?
      -   How do we engage the parties that are not too interested in energy efficiency?
      -   Do we have enough exposure to create the necessary impact?
More on this second stakeholder analysis in Part II of this report.
The following stakeholder groups where identified: Banks, Institutional investors, Pension funds,
Governmental bodies (including municipalities), Real Estate developers, Real Estate investors and
Financial Consultants. Within the stakeholder groups both branch organisations as separate companies /
institutes were contacted. For example: within the stakeholder group of the Banks, the separate Dutch
banks were contacted, as well as the Nederlandse Vereniging van Banken (Dutch bank association).
At the end of year one we spoke to everyone of the first proposed stakeholder list, containing 80
stakeholders. From that 80 stakeholders 76 are committed to the project of which 45 are actively
engaged.
We expect that all the committed parties will be engaged in the second year and next to the first 80
stakeholders the market engagement will increase, due to enhanced publicity and the role the platform
intends to play on the Dutch Market. At the writing of this report already 14 new stakeholders are in
contact with the platform about the possibilities for engagement.

2.2       Market Analysis
Every year the Netherlands Enterprise Agency (RVO) conducts a monitor of the energy consumption and
savings in the build environment. The most recent monitor2 is from January 2016. It looks at the building
stock for residential buildings and utility buildings.

2
 Monitor energiebesparing gebouwde omgeving 2015, 2015: Rijksdienst voor Ondernemend Nederland
(Netherlands Enterprise Agency)

                                                                                                              8
2.2.1 Building stock in the Netherlands
Residential
According to the data there are 7.6 mln residential units, which can be divided in homes owned (55,5%),
social housing (31%) and private rental (13,5%). Looking at the new developments in the residential
building stock, the trends show that there was a short drop in new development since 2010, but the
trends for building permits request shows that a boost in new development is to be expected.

Figure 1 New development vs building permit requests

New development in the residential sector is only a small part of the residential building stock. Due to the
higher demands in regards to energy efficiency these are very energy efficient buildings, but even looking
at the current trend, it is expected that in 2010 the new developed, energy efficient, residential units will
only be 20% off the total residential building stock (fig. 2.3b)

Figure 2 Extrapolation of new development and existing stock

The additional growth in the residential sector comes from the growth in total households and a decline in
family size.

                                                                                                            9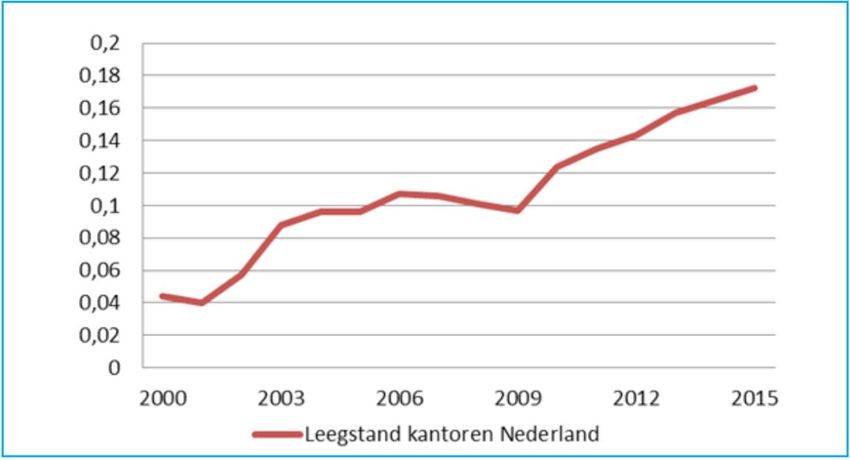
Utility
The total of utility buildings in the Netherlands in 2015 have a surface area of 570 mln m2. Industry (44%)
and offices (15%) take the biggest share, followed by retail (9%) and healthcare (7%). The industry sector
includes logistic centres which usually have a great amount of floor space.

Office
Within the office sector (a total of 72 mln m2 or around 56k buildings) there is a high amount of
unoccupied buildings. In 2015, 17% of the office buildings were unoccupied, 60% of this is structural.

Figure 3 Unoccupied office buildings

Next to the registered unoccupied buildings there is about 15% ‘unregistered’ unoccupancy due to
downsizing during the recent crisis.

Public real estate
Within this sector all the buildings (partly) paid for by public funding is gathered. This means, schools,
daycare facilities, cultural facilities, sport facilities, health and additional public service facilities. This does
not include privately owned facilities or office buildings used by the government. Most of this building are
used for healthcare and schools. In this sector there is also a big amount of unoccupied buildings, mainly
in the healthcare facilities (18%) and sport facilities (16%).

Like the residential sector there has been a decline in the amount of new development in the utility
sector. But unlike the residential sector there is no visible upward trend in the amount of building permit
requests. This is due to the amount of available unoccupied floorspace.

                                                                                                                  10
Figure 4 Trends in new development and building permit request for Utility sector
2.2.2 Energy consumption per sector
In the yearly monitor from RVO (see chapter 2.2.1) the energy consumption per sector is shown based on
the amount of energy billed by the utilities to the user of the building. Based on these data the combined
energy consumption for all the buildings in the Netherlands is around 1.800 PJ. This includes a correction
for non-energetic use, where energy is used as a product.
The service sector and households combined take a share of 38% of the total energy consumption in the
Netherlands. This makes it the biggest energy user of the built environment.
Figure 5 Total energy use in the build environment (industry / transport / service /
households / agriculture & fishery / other)
11Figure 6 energy consumption of households and service
When looking at the energy consumption of both sectors (households and service) there is a steady
decline in the consumption of energy (see figure below). This does include new development.
For residential units the main source of energy is gas (71.7%). This is on a slow decline due to the higher
amount use of renewable energy and is expected to decline further with the transformation from gas to
all-electric which is a big project in the Netherlands at the moment.
In the service sector the main energy sources are gas (48%) and electricity (44%). The electricity is higher
due to the amount of electricity used for ICT, cooling, lighting and product preparation including cooling.
2.2.3 Energy saving goals
Covenants
The climate goals of the EU are the starting point for the Dutch energy savings policy. IN 2008 the energy
savings goals for the different sectors were determined in covenants. Those covenants are combined
within the so called Koepelconvenant in 2012. The main goals are:
In the existing buildings stock every year 300k residential units and other buildings need to make
at least two energy label steps.
New development needs to be nearly zero emission in 2020 (for governmental buildings this is
2018).
In the social housing sector all the residential units need to be at least a B label in 2020, for the
private rental sector 80% should average label C.
The total of energy consumption for buildings for households and the service sector should be
less than 507 PJ in 2020.
European law and Dutch Environmental regulations (wet Milieubeheer)
Next to the named goals there are several important regulations coming from (European) legislation:
In 2008, buildings need to have an energy label when sold, build or rented.
The European Ecodesign directive gives legislation in regard to the energy related products such
as lighting and heating.
The EED gives certain legislation in regard to energy efficiency of governmental buildings, energy
audits for companies and consumer information on smart metering and energy usage.
12 The national environmental regulation (Wet Milieubeheer) commands companies and institutes
to take any energy efficient measures that give a return on investment within 5 years as soon as
there energy consumption equals or is higher than 25.000 M3 gas or 50.000 kWh electricity.
The energy agreement and the build environment.
The Dutch Energieakkoord (Energy agreement) has three main goals:
14% renewable energy in 2020 and 16% renewable energy in 2023
100 PJ additional energy savings in 2020
At least 15.000 additional fulltime jobs
The energy agreement includes all buildings in the Netherlands. Parties who have committed themselves
as a partner to the energy agreement aim at intensifying investments in energy savings and decentral
renewable energy for private use. Eventually an energy neutral build environment is part of the energy
agreement for the year 2050. The ambition for an A label average is put for the year 2030.
2.2.4 Impacts for the employment opportunities
Implementation of energy savings measures have a direct and indirect effect on employment
opportunities. Direct in the form of additional jobs for people in the construction field. Indirectly
additional jobs will be available in the service industry in regard to buildings, like architects and
consultants.
The total amount of jobs in relation to the energy saving measures in 2015 is calculated as 41.400 FTE.
This is mainly in the residential sector where a lot of energy saving measures have been taken the last
couple of years. This is also visible through the boost in amount of households with PV panels and other
renewable energy sources. Just looking at the new trend to go from gas to all electric there is still a high
potential in the residential area in regard to employment opportunities.
In the utility sector there has been a lot of renovations the last couple of years, with a growing demand
for office space, but still a lot of unoccupied buildings there is a prediction for more renovation in the
following years.
133. Stakeholder Consultation
BuildInterest is a bottom-up project, which means that we determine together with our stakeholders
what the focus of the financing platform should be. The methodology used for collecting stakeholder
input is based on the GUIDELINE FOR STAKEHOLDER INVOLVEMENT AND CONSULTATION3 that was
developed for the stakeholder analysis. That document aims to support the BuildInterest partners in their
national stakeholder involvement and consultation processes, in such a way that the results from Italy,
France and The Netherlands will be as much as possible comparable. Comparability of the national
approaches and results is important, because it allows for better cooperation between the national
platforms. It also enables to distinguish between country specific issues and more widely applicable
conclusions and best practices that will be transferable to other countries.
At the same time, the most effective strategy for stakeholder consultation differs per platform depending
on the local situation. Therefore the guideline allows for national flexibility in the stakeholder consultation
process on the one hand while aiming for harmonized and comparable results on the other hand.
The methodology toolkit consists of three main approaches to gather stakeholder input: personal
interviews, roundtable meetings/focus groups and a survey. Naturally, the methods that the BuildInterest
platform partner use to gather information from stakeholders are not limited to these. In principle, each
stakeholder contact is an opportunity to gain input. This could be formally done in one of the ways
described above, but stakeholders may also be reached informally. For instance through e-mail or during
the participation of the BI team to regional and national events (seminars, conference, round table, etc.).
This section will outline the approach of the Dutch platform for the stakeholder consultation.
3.1 Interviews
Based on the stakeholder analysis, appointments were made with the representatives of the
stakeholders. A list was made of the stakeholders and the representatives and contact information was
added based on existing connections or connections made through external sources like LinkedIn. The
first contact was made through e-mail, consisting of an explanation of the Green BuildInvest Initiative
(GBI) and H2020 BUILDINTEREST programme with the addition of a brochure for the first year activities.
After that a meeting was planned between the platform manager (ms. Ruijgvoorn) and the representative
of the stakeholder wherein the interview was conducted.
The interview consisted of a more personal introduction of the project and discussing the way the
stakeholder looks at investing in energy efficient real estate. This was done along the lines of several
questions:
Does the stakeholder take energy efficiency in account when investing in real estate?
o If not? Why not?
What are the main objectives when investing in energy efficient real estate?
o Overall building performance?
o Risk perspective from stakeholder or shareholders?
o Others?
How is the return on investment related to the building performance or how does the
stakeholder relate investment to the quality of the building? (For example energy labelling or
certification)
What are the main barriers for the stakeholder when investing in energy efficient real estate?
(The existing EEFIG rapport4 was used as a guideline to achieve a more outlined list of barriers)
3 Internal methodology guideline, developed by ECN and PNO
4
Energy Efficiency – The first fuel for the EU Economy: How to drive new finance for energy efficient
investment (EEFIG 2015)
14 What does the stakeholder need to decide on a higher investment rate in energy efficient real
estate?
Several summaries of the interviews are added as ANNEX B.
3.2 Roundtables/focus groups
Roundtables are a very useful means of effectively interviewing groups, particularly to test options and
hypotheses. A further advantage of roundtables is that they can create a cooperative atmosphere among
the stakeholders, which is a key objective of the platforms. Roundtables can thus form a useful starting
point for the implementation of solutions in a later stage of the project.
The roundtable in the Netherlands for instance, has already led to a cooperation with a platform with
similar objectives.
There are multiple round tables on the agenda for the project. The first couple of roundtable meetings are
used to establish the complete overview of barriers and work toward the first ideas of possible solutions.
Minutes are made and social media are involved to establish a platform/community feeling5.
September 2016
The first meeting took place in September 2016. The attendants include representatives of the largest
banks of The Netherlands, top legal experts in this field and the national government agency for
entrepreneurs.
The following people attended:
Organisation Name Category
Duurzaam Gebouwd Wietse Walinga Knowledge platform
RVO Selina Roskam Policy
Rebel Energy Eline Kleiwegt Consultancy
ABN Amro Olaf Rutten Finance
Dynamis Taxaties Bert Deen Valuation
ASN Bank Dorine Putman Finance
BBN Arne Balvers Consultancy
Sweco Norbert Bol Consultancy
Eversheds Michel Chatelin Legal
Innax Philip Blaauw Consultancy
RABO bank Leontien de Waal Finance
Green Buildinvest Initiative Esther Ruijgvoorn Horizon 2020
Nederlandse Vereniging van Banken Sharon van Ede Finance
ING Jos Jonkers Finance
November 2016
Aside from the roundtable meeting outlined above, a meeting was organised with Platform Energy
Efficient Financers (PEEF). A new initiative that was started during Springtij (Q3 2016 Terschelling) by the
banks as a follow up to the EEFIG research. They are currently trying to formalise the platform and to
establish a work plan for the following years. After meeting with Dorine Putman from ASN bank, GBI was
introduced to PEEF. We had one meeting on November 3rd and agreed that PEEF should be a part of GBI.
Within in GBI we can achieve the formalisation of the platform as part of GBI. The goals of PEEF are
completely in line with the goals of BUILDINTEREST but they were lacking a work plan. GBI had a solid
5 Pictures can be found at: https://www.flickr.com/photos/144894362@N06/albums/with/72157673444340292
15work plan but was looking for cooperative stakeholders. By merging the platforms, PEEF has a work plan
and project manager and GBI has met its goal towards the total number of stakeholders for its platform.
The main organisation of PEEF is currently run by:
Organisation Name Category
National Investment Agency Wouter Verster Policy
National Investment Agency Dick Hartoog Policy
RVO Eef Spronck Policy
RVO / Green Deal Meike Kerkhoffs Policy
Nederlandse Vereniging van Banken Sharon van Ede Finance
ASN Bank Dorine Putman Finance
GBI Esther Ruijgvoorn Horizon 2020
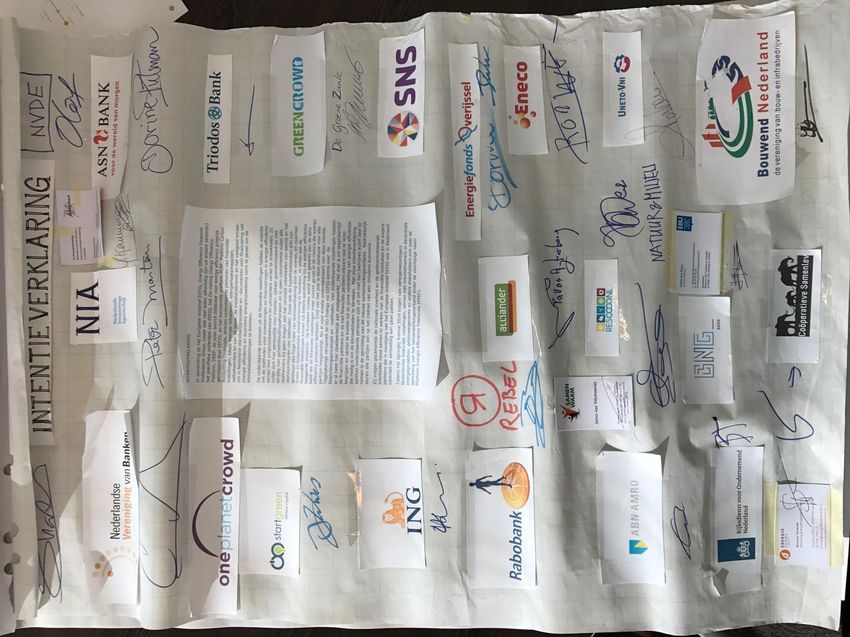
The cooperation was confirmed with an informal signing during the meeting (ANNEX A).
December 2016
Besides the meeting in September and November another roundtable took place in December on the
topic of financing and valuation of energy efficient real estate. Attendees came from the stakeholder pool
connected at that time and were selected on their background.
The following attendees were present:
Organisation Name Category
ING Bank Jos Jonkers Bank
Dynamis Taxateurs Bert Deen Real Estate Valuation
Troostwijk Marcel de Boer Real Estate Valuation
Schuiteman en partners Bram Faber Fiscal consultant
Innax Philip Blaauw Consultancy
Niroc Frank van der Velden Real Estate Developer
GBI Esther Ruijgvoorn Horizon 2020
January 2017
There was another round table planned for January, but not enough stakeholders could find the time to
attend. Because of teaming up with PEEF we agreed to focus on the interviews and the realisation of the
platform in the last months of the first year, therefore focusing on the dialogue and knowledge sharing in
year 2 of the BUILDINTEREST project.
3.3 Survey
At this moment GBI have not conducted any surveys. They are currently working on a standard survey for
newly engaged stakeholders and will send this out the coming weeks. GBI intends to engage their
stakeholders in the following surveys:
• Newly engaged stakeholders – Survey to establish a first glance at opinions and role with regard
to our subject
• Expert meeting – Survey about specific topics to achieve a higher engagement at the meeting. For
year two the meetings are planned and specific surveys will be made together with ECN to create
input for the platform as Well as input for the impact analysis (WP7)
16• General stakeholder engagement – Surveys in regard to specific topics at the moment input is
needed. No general outline for the survey is available at this moment. These surveys will be made
ad-hoc.
174. Barriers and solutions
4.1 Barriers
In this chapter we present the main barriers in financing sustainable investments in the building sector, as
perceived by the financial as well as the building sector.
There are many literature analyses of barriers already so we will build on that work. First of all, this
chapter will therefore summarise the main barriers commonly found in literature, after which the barriers
identified through stakeholder consultation (interviews, roundtables and surveys) will be outlined for
each national platform and the EU.
Our analysis of barriers is instrumental to the BuildInterest strategy of year 2, when we will help to
implement solutions to these barriers in the market.
First of all, this chapter will summarise the main barriers commonly found in literature, after which the
barriers identified through stakeholder consultation (interviews, roundtables and surveys) will be
outlined.
4.1.1 Barriers in literature
This section will discuss the barriers commonly found in literature regarding energy efficiency in buildings.
The aim is to provide a starting point for the national analyses by the platforms and avoid reinventing the
wheel. The following reports were used for this literature analysis:
1. BPIE, 2010, Financing Energy Efficiency (EE) in Buildings. Background Paper. Input to the European Roundtable.
Brussels, 16 November 2010
2. EC, 2012, Consultation Paper – Financial support for Energy efficiency in buildings. European Commission,
Directorate-General for Energy. Brussels, February 2012
3. Rezessy, S., & Bertoldi, P., 2010, Financing energy efficiency: forging the link between financing and project
implementation. Ispra: Joint Research Centre of the European Commission
4. Liu, Feng. 2014. Improving energy efficiency in buildings. Mayoral guidance note; no. 3. Energy efficient cities;
Energy Sector Management Assistance Program (ESMAP); Knowledge series 019/14. Washington, DC; World Bank
5. Energy Efficiency Financial Institutions Group (EEFIG), 2015, Energy Efficiency – the First Fuel for the EU. Economy:
How to Drive New Finance for Energy Efficiency Investment
6. EC, 2015, Financing Energy Efficiency Investments, Tuesday, 10 November 2015, Roman Doubrava, Finance Team
Leader Energy Efficiency Unit DG ENER
7. BigEE, 2012, Energy efficiency policies for buildings Author Dr. Stefan Thomas with contributions from Vera Aydin
Dr. Dagmar Kiyar Ahmad Hafiz Jana Rasch
8. IEA, 2008, Promoting Energy Efficiency Investments: Case Studies in the Residential Sector by International Energy
Agency
9. Rennings, K., Brohmann, B., Nentwich, J., Schleich, J., Traber, T., Wüstenhagen, R., 2013. Sustainable energy
consumption in residential buildings
For purposes of clarity, a distinction has been made between financial/economic barriers; institutional
and administrative barriers; societal barriers; policy barriers; and technological barriers. This
categorisation of barriers is non-exhaustive, and some barriers may be interrelated and/or span multiple
categories (e.g. transaction costs may be both institutional and financial).
Financial/economic
18Access to capital: initial cost 1, 2, 3, 4, 5, 7
The initial cost of a project may prevent investment, either because the building owner does not have
access to capital or has higher-priority items for investment. Energy-efficient measures tend to be more
expensive than their less efficient counterparts. Studies demonstrate that, even when consumers are
assured they are investing in an energy efficient measure, they tend to stick to the least efficient one,
because of the low initial cost.
Risk exposure1, 7
There is a high (real or perceived) risk associated with energy efficiency projects for both consumers and
financiers. To financiers, the ratio of the risk exposure to the return on investment of a project is a
significant indicator for the investment’s validity. Energy efficiency projects often do not meet the
common criteria typically used to factor in risk in the evaluation of a project. Commercial bankers typically
select investments which are safest and grant medium return on investment. On the other hand,
speculators or hedge fund managers are more likely to take on risky investments. Energy-efficient
investments in individual buildings are not large enough to attract speculators and are perceived as too
uncertain for commercial bankers.
On the consumer side, there are high perceived end-user credit risks.
Discount rate1
A discount rate is applied to compare the present and future values of an investment. The current high
discount rate on energy efficiency projects is usually justified on account of the riskiness of the
investments. Depending on one’s standpoint, energy efficient investment can be viewed as extremely
risky or not risky at all. Energy efficiency investment projects are a safer option when considering that
they reduce an individual’s exposure to the volatility of fuel price, which is by far the most important risk
in an energy project. In the meantime, the uncertainty surrounding the appropriate evaluation method
helps to shy away investors from energy efficiency projects. The prevailing traditional view, however, is to
consider energy efficiency projects as risky investments, and as such to apply a high discount rate.
Payback time1, 2, 8
It is common practice for investors to refer to the payback time as an indicative value of their investments
(i.e. the time it will take them to earn back their initial investment). Energy-efficient projects tend to have
a longer payback period than traditional investments; hence they do not rank high on financiers’ agendas.
Referring to payback time as the only reference point for investment validity also prevents proper
consideration being given to the importance of the public good aspect of energy efficiency. Despite its
inappropriateness, reference to the payback time is still common and represents an obstacle to energy
efficiency projects.
Flawed financial models3/ 6Evaluation issues 5
Traditional investments are evaluated on the basis of the risk exposure of the project, the payback time
and the rate of the return on investment. Both investment criteria and the financier’s lack of knowledge
about energy efficiency specificities are obstacles to customer access to capital for energy efficient
projects. In addition, current financing models fail to incorporate all benefits (e.g. health, productivity.
employment) of investments in EE measures.
Short term thinking 3, 9
Short-term thinking is an important barrier in the field of energy efficiency investments (e.g. energy-
efficient heating systems or household appliances), since often life-cycle costs are not considered
procurement (incl. public procurement) decisions.
Reluctance to finance on-balance sheet3
When a loan is reported as a liability (on-balance sheet or financing with recourse), this indicates that the
company stands behind the project or venture and the related debt and the financiers have to recognise
19the company’s assets in case of default. Businesses are often willing to use recourse financing only for
core business activity and not for projects in auxiliary activities, such as energy efficiency.
Asset-based culture in financing3
Customers often prefer to finance projects through project finance (based on the project’s cash flow) in
contrast to on-balance sheet/recourse finance (based on the debtors trustworthiness). However, energy
savings as revenue are foregone by financiers: cash flows from saving energy are not (yet) conventional
revenues in what is still an asset-based culture in financing (see also: evaluation issues).
Low collateral asset value3
In project financing, often, additional collateral is required as securitisation in addition to a project’s cash
flow. Due to the fact that EE equipment is very specific to the site or location they cannot easily be
redeployed without loss of productive value (high assets specificity). The collateral value of EE
investments is low with a high share of total project cost consists of engineering, development and
installation costs.
Institutional & administrative
High transaction costs1, 5
Transaction costs are the costs associated with making an economic exchange. They are not necessarily
financial in nature, but rather describe the time and effort required to get enough information to make a
decision, apply for a loan, and arrange for the work to be done. Transaction costs are experienced by both
consumers and investors. Some causes of increased transaction costs are outlined below.
Large number of decision makers / market fragmentation / multistakeholder issues
Onerous decision-making due to a large number of decision-makers (residential sector); decisions are
taken by a wide range of stakeholders in different professions and organisational levels, with different
approaches, agendas and motivations for EE improvements.
Burdensome procedures3
Burdensome procedures of issuing e.g. permits or construction notifications (e.g. for refurbishment).
Small project size 1, 2, 3, 4 , 8
The relatively small size of energy-efficient projects and their resulting low replicability further reinforce
the increased transaction costs related to energy efficiency projects. As such investors tend to turn to
other projects which are more easily replicable.
Energy prices 1, 2, 3, 4, 5, 7, 8
Poorly designed social protection policies such as subsidies undermine incentives for efficient use of
energy. This distorts the market and prevents consumers and investors from receiving accurate price
signals that reflect the true marginal cost of the energy use. In addition, the price of energy is further
distorted by the lack of exclusion of externalities (IEA). As a result, energy efficiency is a low priority of
both consumers and investors (see also ‘Societal barriers – Behavioral economics’).
Split incentives1, 2, 3, 4, 7
Split incentives occur when the decision-maker does not directly receive many of the benefits from a
measure invested in. It applies to both residential and commercial buildings and means that the benefit of
energy savings does not go to the person making the investment. In fact, the building owner is likely to be
responsible for making energy efficiency investments, while the occupier may receive the benefit of lower
energy bills. Consequently the owner has no direct incentive to invest although landlords may benefit
from higher rents. Furthermore, if the landlord is responsible for energy bills, the tenant has no direct
20incentive to save energy. Thus, as a result of rational behaviour on both the side of the tenant and the
landlord, investing in energy efficiency upgrades is not a natural move for either actor.
Conservative construction sector
The conservative nature of the building sector represents a hurdle to be overcome. The sector is subject
to a strong path-dependent development trajectory whereby old routines are too pervasive to make
substantial changes in techniques.
Disincentives or vested interests in the status quo 1, 3, 8
Some disincentives are present in the building sector that prevent EE initiatives from successfully being
implemented as a consequence of the rational choices of the actors involved. An example is the fact that
engineering fees are often based on the capital costs of a project. Putting effort into designing the most
efficient (e.g. passive) housing thus reduces the engineer’s fees by decreasing the capital costs of the
project.
An example of vested interests is the ambiguous ownership of many energy assets; in case energy
efficiency efforts are increased, local authorities will not receive the monetary benefits of increased
energy production.
Societal
Behavioral economics (personal priorities), 4, 7, 8
Energy efficiency is not usually a major concern for consumers or companies as energy costs are relatively
low compared to the cost of many other factors (e.g. labor; rent). In addition, since energy costs are low,
the benefits of energy savings are easily outweighed by the transaction costs (see also ‘Institutional and
administrative barriers - transaction costs’).
Information failure1,2, 3, 4, 5, 7
On the side of customers there is a lack of awareness on both the costs and benefits of energy saving
(financial and environmental) and about the options available to them to increase EE. This reinforces the
challenge posed by consumer behaviors and habits which are difficult to change. Studies show that it
takes on average more than 10 years to dramatically change consumer tastes. Moreover, typical
penetration rates of new technologies oscillate between three to four years.
On the side of financiers there is a similar lack of awareness. Obtaining qualified advice from financial
experts is not easy for consumers who want to implement energy efficiency. In addition, EE projects are
often niche projects with low visibility to major banks.
Uncertainty associated with energy savings1,3
On average, a set of measures might produce a predictable level of savings, but savings can never be
perfectly predicted for an individual home. The different methods existing for ex-ante evaluation maintain
a certain level of uncertainty, and help create a fear of hidden risks in energy-efficient projects. On the
other hand, systematic ex-post evaluation is still too costly. Accordingly, both investors and customers
with no certainty of the level of energy savings to be achieved, tend to shy away from energy efficiency
investments.
Limited insight in current energy performance of buildings
Energy performance of buildings is typically poorly monitored.
Policy
21Lack of enforcement of building energy codes2, 4, 5
Governments implement building energy codes to ensure that buildings constructed to comply with this
code meet a minimum level of energy efficiency. A lack of enforcement reduces the effectiveness of these
codes.
Unstable policy 2, 5
Too frequent changes in the legal framework and financial support programmes
Lack of administrative capacity to develop EE legislation 2, 4, 5
Often, governments lack the administrative capacity or (technical) skills that are required to successfully
develop and implement EE legislation and policy.
Internal procedures and rules of public budgeting 3, 4
Rules of public budgeting – including the annual budget cycle and multiannual savings cash flow – make it
difficult for public entities to finance energy efficiency investments from savings in energy costs (similar
rules exist in large companies); local authorities may have to finance energy efficiency investments from
their investment budget whereas the resulting savings are credited to the operational budget (EC).
In addition, government internal procedures and lines of responsibility may discourage EE in public
buildings (e.g. budgetary and procurement policies not conducive to contracting EE services).
Technological
Solutions not available yet7
Solutions to energy efficiency may not be available yet.
Uncertainty with regard to performance7
There may be uncertainties whether the new technologies will perform reliably
4.1.2 Barriers - The Netherlands
To achieve a more structured analysis of the barriers we have chosen to use an existing study on Energy
Efficiency investments: ‘Energy Efficiency – The first fuel for the EU economy’ Part 1: Buildings, 2014 by
the Energy Efficiency Financial Institution Group (EEFIG). Chapter 4, page 35, sub A is dedicated to the
most imminent challenges to overcome. We are now benchmarking this challenges to the barriers
discussed at our round table meetings or in our interviews. In regard to this report we were able to
identify a couple of main topics in the Netherlands. They are broadly categorised in three groups of
barriers:
1. Real estate valuation
The full benefits of energy efficient refurbishments of buildings must be captured and well-articulated,
with evidence, and as a priority, to key financial decision makers (public authorities, buildings owners and
managers and for householders. This could be established by using available certification methods
(energy labels / LEED certification etc.) and showing how they relate to each other and defined KPI’s to
establish a common language on the valuation of real estate.
2. Process and document standardisation
Many projects are unable to acquire financing/investments due to incorrect documents or the inability to
achieve the necessary process requirements. It is likely that there would be a higher amount of positive
credit risk assessment if the documents used were the same. This is especially important since the scale of
the credit asked is usually quite small, but still require same amount of paperwork. Standardisation of this
paperwork and the process could help.
223. Availability of examples
There is a need for examples of sustainable projects in regard to funding/investment, but also in the
relation between governmental policy and available building knowledge and supplies.
What can also be observed is a ‘circle of blame’ barrier, in which different actors in the building supply
chain attribute barriers to other groups of actors. Broadly speaking, the financing sector states they have
difficulty acquiring the proper documents and process and project requirements for funding. The
suppliers of EE buildings and equipment have difficulty finding a market for their products, as real estate
developers aren’t interested in their more sustainable (and more expensive) products. Product
developers, on the other hand, do not have the financial means/funding to invest in EE.
4.1.3 Conclusion
After two round tables (September and December) and several meetings with the Platform Energy
Efficient Financials (PEEF) the initially identified barriers as stated above are still seen as the main barriers
for not investing in energy efficient real estate. The main focus lies in the valuation of energy efficient real
estate and showcasing examples (both good and bad) to create a knowledge base and knowledge
Network. The meetings with PEEF highlighted a barrier in the standardisation of the development process
of a full-electric neighbourhood. There is a common consensus in the Netherlands that the use of gas as
the main home heating fuel should be phased out. Several cities in the Netherlands are currently starting
the process to achieve Zero-gas in existing neighbourhoods. This consists of creating a project where
home owners are told their home will not have a connection to the gas-network in the future (mostly a
term of about 10 – 15 years). This means that home owners need to make a transition to an all-electric
home. With the expectation that future electricity will be sustainable sourced, this achieves a big results
towards the zero emission goals set for 2050 in the Netherlands.
234.2 Solutions
This chapter will present an overview of successful or promising solutions that are observed already in the
market, as well as solutions that do not yet exist but should be developed in order to increase the
attractiveness of investments in sustainable buildings.
Note that the term ‘solutions’ should be interpreted in a very broad sense: a solution could be a technical
and financial calculation tool, but the scope also includes financial instruments, innovative contractual
arrangements such as ESCOs, and policy measures.
Reports with solutions are piling up at the EC and national governments, it is not the aim of this project to
add another one. We focus on solutions that we as BuildInterest can help to implement within the second
year of our project (reduced VAT rates for instance are mostly beyond our influence and timeframe and
therefore not our focus).
This chapter provides an overview of solutions that were identified in The Netherlands, followed by a
description of the selection process and a presentation of the selected solutions.
4.2.1 Solutions - The Netherlands
Some solutions were already proposed during the roundtable session that was held. Please find below a
short summary of the proposed solutions. They are presented according to the same categorisation as the
barriers.
1. Real estate evaluation
a) Defining the worth of existing sustainable valuation tools e.g. certification schemes. By defining
the KPI’s in regard to sustainable real estate (for example: Energy Efficiency / Health etc) we can
achieve a baseline within the different existing schemes (energy labels / LEED etc) to show how
they relate to each other and to make a benchmark between different methods possible.
b) The Dutch real estate taxation organisation (NRVT) is looking at a dialogue to establish a
harmonisation within the Dutch taxation professionals about sustainability next to available
valuation methods.
2. Process and document standardisation
a) From PEEF especially came the question to have standard documents. A workgroup will be
established to define the documents and the process. Both will be standardised following an
inventory of existing documents and through the study of a couple of projects to achieve
standards.
b) The Dutch bank organisation (NvB) together with the government will look at the possibility to
make the documents regulatory and policy for all new projects.
3. Availability of examples
a) Through PEEF a couple of cities have asked to showcase their successful sustainable area
approach. They are working together with local financers / builders / owners to achieve a higher
degree of sustainability. By showcasing these examples a ‘roadmap’ could be made to help other
cities achieve the same kind of results.
b) There would also be the opportunity for a more knowledge-based platform to support with
projects / questions.
4.2.2 Solution Focus
Platform focus
Green BuildInvest Initiative (GBI) will focus on the creation of a platform/community where the dialogue
on energy efficient / sustainable real estate can be facilitated. This online platform should show the
24existing projects and initiatives and help connect projects and initiatives to share existing knowledge and
develop new knowledge on specific topics.
With the facilitation of this community there is also the possibility for the GBI to facilitate meetings on
specific topics. These topics are at first based on the barriers found in year 1, but they do not exclude
topics based on discussion on the platform. The main topics for now are:
1. Real estate valuation,
2. Process and document standardisation
3. Availability of examples. Based on the stakeholder dialogue
With the platform/community actively working on creating the examples based on existing projects and
facilitating specific events and meetings, Green BuildInvest Initiative is putting itself forward as the
knowledge platform for stakeholders on the demand and financial side of real estate in regard to energy
efficiency and sustainability.
The platform will work online and offline and focuses aims to:
Online
Showcasing existing successful and less successful examples of financing solutions
Showcasing knowledge on related topics on financing and energy efficiency in buildings
Matchmaking knowledge and projects (kickstarter for knowledge instead of funds)
Sharing available tools to support projects in regard to process and financing (for example project
templates and standard documents to apply for funding)
Showcasing market developments and policy developments
Offline
Organising events on specific topics in relation to barriers and solutions
Facilitating workshops for the standardisation of processes and documents
Offline matchmaking in cooperation with other organisation to create new initiatives and
solutions
Process management for new initiatives to boost results depending on topic (for example
Platform Energy Efficient Financers/PEEF)
Selection process
When identifying knowledge / solutions and events to showcase on the platform the main focus will be:
- How is the funding and process organised?
There should be a definite focus on the financial organisation of a project or initiative to showcase how
the investment is supported, which parties are involved and what return on investment is expected. Data
should be shared openly on the platform or directly available through a contact person of which the direct
contact information will be shown.
4.2.3 Selected Solutions
There are more possible solutions and they will all be showcased and facilitated within the platform, but
to start and create good quality content and to give stakeholders a good perception of our role as a
platform, we decided to dedicate a pro-active focus on one solution per determined barrier (see chapter
4.1.3). We will expand our focus throughout the coming years, but we want to create a good baseline on
the way knowledge is shared and connections are facilitated.
25You can also read