SHA 2021 CARRY-ON BUDGET - Seattle Housing Authority
←
→
Page content transcription
If your browser does not render page correctly, please read the page content below

SHA 2021 CARRY-ON BUDGET
SEATTLE HOUSING AUTHORITY

    2021 CARRY-ON BUDGET

                    Presented to
SEATTLE HOUSING AUTHORITY BOARD OF COMMISSIONERS

                 Paul Purcell, Chair
            Dr. Paula Houston, Vice Chair
                 Robert Crutchfield
                    Twyla Minor
                    Gerald Smiley
                   Deborah Thiele
                    Michael Diaz

                         By
         Andrew J. Lofton, Executive Director
SHA Senior Staff
Kimberly Garrett, Senior Executive Assistant
Anne Fiske Zuniga, Deputy Executive Director
Rod Brandon, Director, Housing Operations
Kerry Coughlin, Director, Communications
Jared Cummer, Director, Housing Finance & Asset Management
James Fearn, General Counsel
Terry Galiney, Director, Development
Alice Kimbowa, Director, Housing Choice Voucher Program
Andria Lazaga, Director, Office of Policy & Strategic Initiatives
Steven McDowell, Chief Information Officer
Marc Nilsen, Director, Human Resources
Lisa Wolters, Director, Intergovernmental Relations
Shelly Yapp, Chief Financial Officer
SHA Budget Staff
Scott Woo, Budget Manager
Budget Analysts
Gashaw Dessie
Wendy Lance
Colin Miller
Nisha Riley
Abbie Romano
Irene Tamaru
Ed Tanaka
Support Staff
Johanna Pritchard
Michael TonSEATTLE HOUSING AUTHORITY 2021 CARRY-ON BUDGET
TABLE OF CONTENTS
SEATTLE HOUSING AUTHORITY CY 2021 CARRY-ON BUDGET.................................................. 1
    INTRODUCTION .............................................................................................................................. 1
    A DIFFERENT BUDGET APPROACH THIS YEAR ....................................................................................... 1
    COVID-19 DECISIONS AND EVENTS TIMELINE ...................................................................................... 3
    OVERVIEW OF THE 2021 SHA CARRY-ON BUDGET .............................................................................. 4

RESPONDING TO THE STRATEGIC PLAN .................................................................................. 8
    STRATEGIC DIRECTIONS ................................................................................................................... 8
    ORGANIZATIONAL CORNERSTONES .................................................................................................... 9

DEPARTMENT BUDGETS ...................................................................................................... 11
    SHA DEPARTMENT BUDGETS COMPARISON OF 2019 – 2021 OPERATIONS ............................................ 11
    EXECUTIVE BUDGET ...................................................................................................................... 13
    OFFICE OF POLICY AND STRATEGIC INITIATIVES BUDGET ....................................................................... 14
    DEVELOPMENT BUDGET ................................................................................................................ 15
    HOUSING FINANCE AND ASSET MANAGEMENT BUDGET ....................................................................... 17
    FINANCE AND ADMINISTRATION BUDGET .......................................................................................... 20
    INFORMATION TECHNOLOGY BUDGET .............................................................................................. 22
    HOUSING OPERATIONS BUDGET ...................................................................................................... 24
    HUMAN RESOURCES BUDGET ......................................................................................................... 33
    HOUSING CHOICE VOUCHER PROGRAM BUDGET ................................................................................ 34

CAPITAL IMPROVEMENT PROGRAM SUMMARY .................................................................. 37
    CHOICE NEIGHBORHOODS IMPLEMENTATION: YESLER REDEVELOPMENT ................................................ 38
    OTHER REDEVELOPMENT ACTIVITIES ................................................................................................ 40
    OPPORTUNITY INVESTMENTS .......................................................................................................... 41
    NEW ACQUISITION, DEVELOPMENT, AND PLANNING ........................................................................... 42
    CAPITAL FUND ASSET PRESERVATION PROGRAM ................................................................................ 43
    2021 CAPITAL ACTIVITIES .............................................................................................................. 45

GRANT PROGRAMS ............................................................................................................. 53

LIMITED PARTNERSHIP OPERATIONS ................................................................................... 55
TABLE OF FIGURES FIGURE 1: 2021 OPERATING AND CAPITAL SOURCES ................................................................................................................6 FIGURE 2: 2021 OPERATING AND CAPITAL PROGRAM USES .......................................................................................................7 TABLE 1: OVERVIEW OF 2021 SHA BUDGET ...........................................................................................................................5 TABLE 2: OVERVIEW OF 2021 SHA FTES ...............................................................................................................................5 TABLE 3: 2021 DEPARTMENT BUDGETS ...............................................................................................................................11 TABLE 4: 2021 DEPARTMENT FTES .....................................................................................................................................12 TABLE 5: EXECUTIVE DEPARTMENT BUDGET AND FTES ............................................................................................................13 TABLE 6: OPSI BUDGET AND FTES ......................................................................................................................................14 TABLE 7: DEVELOPMENT DEPARTMENT BUDGET AND FTES ......................................................................................................15 TABLE 8: HOUSING FINANCE & ASSET MANAGEMENT BUDGET AND FTES...................................................................................17 TABLE 9: AM COMMERCIAL FACILITIES BUDGET .....................................................................................................................18 TABLE 10: 190 QUEEN ANNE CENTRAL OFFICE BUDGET..........................................................................................................19 TABLE 11: FINANCE AND ADMINISTRATION BUDGET AND FTES .................................................................................................20 TABLE 12: INFORMATION TECHNOLOGY BUDGET AND FTES .....................................................................................................22 TABLE 13: HOUSING OPERATIONS BUDGET AND FTES.............................................................................................................24 TABLE 14: HOUSING OPERATIONS CENTRAL ADMIN BUDGET AND FTES .....................................................................................25 TABLE 15: LOW INCOME PUBLIC HOUSING BUDGET AND FTES .................................................................................................26 TABLE 16: SEATTLE SENIOR HOUSING PROGRAM BUDGET AND FTES .........................................................................................27 TABLE 17: YESLER TERRACE BUDGET AND FTES .....................................................................................................................27 TABLE 18: SPECIAL PORTFOLIO BUDGET AND FTES .................................................................................................................28 TABLE 19: IMPACT PROPERTY MANAGEMENT BUDGET AND FTES .............................................................................................29 TABLE 20: IMPACT PROPERTY SERVICES BUDGET AND FTES......................................................................................................30 TABLE 21: COMMUNITY SERVICES BUDGET AND FTES .............................................................................................................31 TABLE 22: JOBLINK BUDGET AND FTES ................................................................................................................................32 TABLE 23: HUMAN RESOURCES BUDGET AND FTES ................................................................................................................33 TABLE 24: HOUSING CHOICE VOUCHER PROGRAM BUDGET AND FTES .......................................................................................34 TABLE 25: OPPORTUNITY INVESTMENTS ...............................................................................................................................42 TABLE 26: SHA 2021 CAPITAL PROJECTS—MTW GRANT-FUNDED ACTIVITIES...........................................................................45 TABLE 27: SHA 2021 CAPITAL PROJECTS—OTHER FUNDS FOR ASSET PRESERVATION ..................................................................48 TABLE 28: GRANT PROGRAM FUNDING ................................................................................................................................53 TABLE 29: LIMITED PARTNERSHIPS -- OPERATIONS BUDGETS ....................................................................................................56
SEATTLE HOUSING AUTHORITY CY 2021 CARRY-ON BUDGET
INTRODUCTION
The Calendar Year (CY) 2021 Carry-On Budget contains all of Seattle Housing Authority’s Operating and
Capital Budget sources and uses, including federal as well as local housing programs and enterprise
activities for CY 2021. The Budget was prepared under the provisions and authorizations contained in
the Authority’s contractual agreement with the U.S. Department of Housing and Urban Development
(HUD) and the Moving to Work (MTW) Program, which has been extended through 2028. The MTW
program provides two critical sources of flexibility:
• In furtherance of the three MTW statutory objectives—to streamline operations for
efficiency and cost effectiveness; to enhance housing choice; and to promote self-
sufficiency—MTW provides a process to waive federal regulations pursuant to Section 8 and
9 of the 1937 Housing Act, thus enabling the agency to undertake demonstrations and
innovations that would not otherwise be available.
• It allows the Housing Authority to treat federal resources under Sections 8 and 9 of the 1937
Housing Act—the public housing operating subsidy and capital grant, and housing choice
vouchers—as a single fund, the “MTW Block Grant”, with flexibility to use funds across
federal and local housing programs serving low-income people.”
The Housing Authority uses these tools to maximum strategic advantage to realize the purposes and the
promise of the MTW demonstration and to most effectively serve low-income people in the Seattle
community.
A DIFFERENT BUDGET APPROACH THIS YEAR
SHA’s annual budget process traditionally begins in March of the current year for the ensuing year’s
budget. This year, the work of the Budget Office to prepare for the yearly Cabinet Budget Planning
Retreat was turned on its head as cases of the COVID-19 virus spread nationwide and public health
officials and the Centers for Disease Control (CDC) issued warning and advice about the global pandemic
actions for individuals to protect themselves.
At the same time, in mid-March, the Governor began to announce the closure of schools, bars and
restaurants, and entertainment and recreational facilities, leading ultimately to the Governor’s March
23, 2020 order to “Stay Home, Stay Healthy”, which went into effect April 4, 2020. With exceptions only
for essential businesses, activities, and workers, the Governor’s order required all citizens to stay at
home; banned all gatherings for social, spiritual, and recreational activities; and closed all businesses
that were not designated as essential.
SHA was designated as an essential service under the Governor’s Stay Home order. All SHA
departments, leaders, and staff turned their energies to planning, coordinating, and implementing how
work and operations would need to change to respond to COVID-19’s challenges and uncertainties—for
our residents, voucher participants, and our employees.
For the Budget Office, this meant that the budget process as we knew it would need to change, and
change radically, since its most intensive period for all of the departments runs from mid-to-late March
through June, followed by hearings on their submittals with the Budget Office in July. The Budget Office
reasoned that there simply would not be capacity in the spring and summer in the departments to
follow the normal budget process and timeline, given the scope and intensity of COVID-19 related
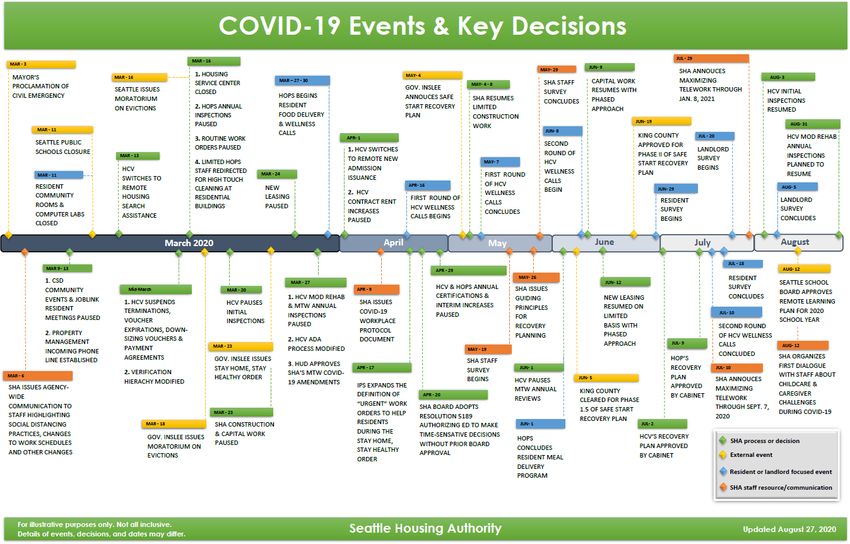
responsibilities. Included at the end of this section is a timeline of SHA’s COVID-19 Decisions and Events
1(Exhibit 1) to illustrate many of the key activities that required the time and attention of staff
throughout SHA from March 2020 through August 2020.
In late March, the Cabinet endorsed the Budget Office recommendation that the 2021 budgeting
process proceed in two stages:
Preparation and adoption of a 2021 SHA Carry-On Budget with no or minimal participation by
SHA Departments; and,
Creation of a process for the latter part of 2020 that would engage departments in defining
priority changes to the Carry-On Budget to create the 2021 SHA “Adjusted” Budget for adoption
at the end of the year or the beginning of 1st quarter 2021.
This document represents the culmination of the first stage of SHA’s 2021 budgeting process – the 2021
Carry-On Budget. The Budget Office adapted the federal government’s “Continuing Resolution”
procedure, whereby the authorized expenditure levels for the current year are simply carried forward as
the basis for the next year’s budget and subsequently replaced by an updated or adjusted budget for the
new year. The Budget Office then tailored the concept as made sense for each of SHA’s five major
budgets – the Operating Budget; Capital Budget; Information Technology (IT) Capital Budget;
Development Budget; and the Tax Credit Properties’ Budgets. In all cases, the aim was to keep the
process as simple and non-disruptive of department staff time as possible. The results in the Carry-On
Budget can be characterized as follows:
Department Operating Expense budgets were rolled over from 2020 to 2021, so all expense
accounts are the same as they were for 2020.
With few exceptions, all FTE’s authorized in the 2020 Revised Budget for departments were
maintained in 2021.
Operating Budget Revenues for 2021 reflect current assumptions and forecasts for major
revenue sources.
The Capital Budget for 2021 largely represents the carry-over of 2020 projects that were delayed
as a consequence of COVID-19 impacts, plus the top tier of 2021 projects that were identified as
the starting platform for 2021.
The IT Capital Budget for 2021 was focused on the continuation, from 2020, of the conversion of
Housing Choice Voucher tenant information from Elite to the Yardi system and infrastructure
hardware replacement projects scheduled for 2021.
The 2021 Development Budget reflects the nature of these projects as one-time, multi-year
projects and displays the overall sources and uses of the mixed financings, stage of each project,
and the estimated project expenditures for 2021.
The Tax Credit Properties’ Budgets were prepared in the same fashion as the SHA Operating
Budget with updated revenues and 2020 expense rolled over to 2021.
The Operating Budgets for both SHA and the Tax Credit properties in the 2021 Carry-On Budget do not
reflect changes in work plans and priorities for next year. Those will be formulated in SHA’s ongoing
planning for recovery from the COVID-19 pandemic and changes that will be made in SHA’s operations
going forward, and in work the Cabinet and departments will undertake in planning programmatic and
administrative priorities for the 2021 SHA Adjusted Budget, consistent with SHA’s Strategic Plan. The
Budget Office will also update forecasts of key revenues and expenditure accounts at that time and
expect to propose the 2021 SHA Adjusted Budget to the Board of Commissioners for their action late in
the 4th quarter of 2020.
2COVID-19 DECISIONS AND EVENTS TIMELINE
3OVERVIEW OF THE 2021 SHA CARRY-ON BUDGET
The 2021 Seattle Housing Authority (SHA) Carry-On Budget has total expenditures of $405.7 million,
with the Program Operations and Administrative Budget at $104.4 million; Housing Assistance Payments
(HAP) at $137.4 million; grants at $1.3 million; the Capital Budget at $21.3 million; Opportunity
Investments at $15.1 million; and the Redevelopment Budget at $126.1 million. The total 2021 Carry-On
Budget is greater than the total 2020 Adopted Budget by $79.6 million or 24.4 percent; the
Development budget accounts for $65.9 million or 82.7 percent of the overall budget increase.
The total Operating Budget of the 2021 SHA Carry-On Budget— includes program operations and
administration of all SHA departments, Housing Assistance Payments (HAPs), and grant support—is
$243.1 million, which represents 60 percent of the total Budget, and reflects an increase of 5.5 percent
over 2020. As discussed in the previous section - A Different Approach to the Budget this Year -we
prepared the 2021 Carry-On Budget for Operating Expenses as comparable to a federal budget
Continuing Resolution. As such, you will see that most expenditures have been held constant with levels
approved for 2020. We do expect in the last quarter of the year to recommend changes to the Carry-
On Budget to incorporate both technical adjustments to selected expenditures and programmatic and
fiscal changes that will be adopted as the 2021 Adjusted Budget.
The total Carry-On Capital Program - Asset Preservation, Non-Routine Expense, Opportunity
Investments, and Redevelopment Expenditures—is $162.6 million or 40 percent of the total budget and
reflects an increase of 70.0 percent over 2020. The largest share of the Capital Program in 2021 is
Redevelopment Expenditures at $126.1 million, more than double the 2020 development budget, due to
the number of major development projects that will be occurring at the same time.
The Asset Preservation element of the Capital Program, with Non-Routine capital expenditures, is
proposed at $21.3 million, which is 5.3 percent more than 2020. The highest priorities in the Asset
Preservation program in 2021 include: rehabilitation at Jefferson Terrace; roof replacement and repairs
at various properties; fire prevention with replacement of fire panels; and exterior repair and
replacement projects. The 5.3 percent increase in the Asset Preservation and Non-Routine budgets is
due principally to increases in bond funded projects, mostly in Special Portfolio properties.
Opportunity Investment projects total $15.1 million in 2021, the same level as 2020. Opportunity
Investments began in 2019 because of the incremental funding increase in the 2018 – 2019
Congressional Bipartisan Budget Act. There are a number of candidates that could be funded through
the 2021 Opportunity Investments, including additional gap financing for the Jefferson Terrace
Rehabilitation project and pipeline activities for future preservation; development projects such as
Jackson Park Village, Blue Topaz, Holly Court and Red Brick; and COVID Recovery IT projects. While
preparing the 2021 Adjusted Budget we will assess the options and cost estimates of Opportunity
Investments. Because our funds are flexible across capital and operating uses, we will weigh the
Operating Budget with the Capital Program needs, capacities, and priorities in coming to final
recommended changes for the 2021 Adjusted Budget. Accordingly, the funding level may change for the
Opportunity Investment, as an element of the Capital Program.
The Redevelopment Budget for 2021 totals $126.1 million, an increase of $65.9 million or 109.2 percent
over 2020. Yesler construction activities continue in 2021 as construction at Hinoki will be in full swing
and Sawara will begin construction after a mixed finance close at mid-year. The final SHA Yesler building
will be in design and predevelopment throughout 2021. In 2021, two other major projects will be
underway: redevelopment of the Lam Bow Apartments and the rehabilitation of Jefferson Terrace.
These two projects represent a combined increase of $12.4 million in projected expenditures in 2021.
4CY 2020 CY 2021 Percent
Revised Budget Carry-On Budget Change
Program Operations and Admin. Expenses $ 104,503,000 $ 104,388,000 (0.1)%
Housing Assistance Payments (HAP) 124,015,000 137,417,000 10.8 %
Grant-Funded Expenses 1,947,000 1,337,600 (31.3)%
Subtotal: Operating Budget $230,465,000 $243,142,600 5.5 %
Capital Asset & Non-Routine Expenses 20,210,000 21,310,000 5.4 %
Opportunity Investments 15,100,000 15,100,000 0.0 %
Redevelopment 60,290,000 126,142,000 109.2 %
Subtotal: Capital Program 95,600,000 162,552,000 70.0 %
Total Expenses $326,065,000 $405,694,600 24.4 %
Table 1: Overview of 2021 SHA Budget
Total proposed SHA staffing in the 2021 Carry-On Budget for both the Operations and Capital Programs
Budgets is 610.1 Full-Time Equivalent positions or FTEs, a negligible change from 2020. Please see the
Department Budget section of this document for more detail on FTE changes.
Carry-On Change 2020
Program Element FTE’s CY 2020 FTE’s CY 2021 to 2021
Housing Operations 376.1 378.1 2.0
Housing Finance and Asset Management 39.3 40.3 1.0
Housing Choice Voucher Program 69.0 67.0 (2.0)
Administrative Departments 1 125.6 124.7 (0.9)
Total 609.9 610.1 0.2
Table 2: Overview of 2021 SHA FTEs
1
“Administrative Departments” are Human Resources, Finance and Administration, Information Technology, Development,
Executive, and the Office of Policy and Strategic Initiatives (OPSI).
5Sources of Funds
The chart below provides a breakdown of SHA’s main funding sources. Non-MTW capital and
redevelopment sources total $238.3 million, or 45 percent of total sources, making it the largest single
source of SHA funds. The HUD MTW Block Grant totals $208.4 million, or 40% of total sources, while
non-MTW operating subsidy and service grants create $20.7 million, or 4% of total sources. Rental
income generates $37.7 million (7%) of sources, while all other income for 2021 is $18.6 million, (4%).
Compared to the total uses that appear in the section that follows, sources exceed uses by $117.8
million in 2021 and will be used for budgeted multi-year finance redevelopment costs.
Figure 1: 2021 Operating and Capital Sources
2021 OPERATING AND CAPITAL SOURCES
$523.7 MILLION [CATEGORY NAME]
[PERCENTAGE]
Other Income &
Investment Income
[CATEGORY NAME] 4%
[PERCENTAGE]
[CATEGORY NAME]
[PERCENTAGE]
Capital Sources
45%
6Uses of Funds
The chart below displays SHA uses of funds by major category. Housing Assistance Payments are SHA’s
largest program expenditure at $137.4 million, or 34% percent of total uses. Capital, redevelopment
projects, and Opportunity Investments total $162.5 million or 40% percent. Program Operations and
Administrative budget for Low Income Public Housing, the Seattle Senior Housing Program, Local
Housing, and other operating and service grant programs totals $105.7 million, or 26% percent of uses.
Figure 2: 2021 Operating and Capital Program Uses
2021 OPERATING AND CAPITAL PROGRAM USES
$405.7 MILLION
Program Operations
and Administrative
Redevelopment Expenses
31% 26%
Opportunity
Investments
4%
Capital & Non- [CATEGORY
Routine Expenses NAME]Grant Housing Assistance
5% Funded Expenses Payments (HAPS)
[PERCENTAGE] 34%
7RESPONDING TO THE STRATEGIC PLAN
In 2016, SHA adopted its current Strategic Plan that defines SHA’s Strategic Directions and key
Organizational Cornerstones. The plan affirms SHA’s mission and values, maintains core commitments,
and maps the agency’s course to make a positive difference in the lives of families and individuals with
low income, neighborhoods where SHA participants live, and the larger Seattle community. The plan
outlines three Strategic Directions and seven Organizational Cornerstones on which the Housing
Authority will maintain its focus to prioritize activities, investments, and strategies that best equip SHA
to advance its mission and values:
Our Mission—Every day, we work to enhance the Seattle community by creating and sustaining
decent, safe, and affordable living environments that foster stability and increase self-sufficiency
for people with low incomes.
Our Values—As stewards of the public trust, we pursue our mission and responsibilities in a spirit
of service, teamwork, and respect. We embrace the values of excellence, collaboration,
innovation, and appreciation.
STRATEGIC DIRECTIONS
SHA’s Strategic Directions are “big picture” outcomes that are expected to be the focus of the agency.
Key objectives are measurable actions that guide policies and investment in pursuit of Strategic
Directions.
Expand Housing Opportunities
SHA serves more people by cultivating additional resources and employing strategies that have the
biggest impact on increasing Seattle’s affordable housing choices. Key objectives related to this strategic
direction are:
• Create more affordable housing by prioritizing strategies and leveraging resources to enable
increased rental assistance and housing units for more people in need of affordable housing.
• Advance affordable housing policy through championing public policies that will increase the
viability, availability, and accessibility of affordable housing for people with low incomes.
• Diversify housing choice by expanding available housing choices, demonstrating alternative
housing models, and preserving and increasing access to neighborhoods throughout Seattle that
would otherwise be out of reach for people with low incomes.
Promote Quality Communities
SHA invests in safe, quality, affordable housing; connects participants to communities, resources, and
services designed to meet their needs; and provides safe, inviting, and accessible communities. Key
objectives related to this strategic direction are:
• Preserving and promoting high quality housing by providing safe, accessible, sustainable, and
attractive living environments that contribute to the quality of Seattle neighborhoods through
preservation and redevelopment of SHA’s housing stock.
8• Connecting people to opportunity by investing in communities through partnerships so that
neighborhoods where participants live support access to opportunities such as good jobs, parks,
transit, arts, high-performing schools, and healthy living.
• Strengthening community and service by facilitating effective and supportive relationships and
respectful interactions among participants, staff, partner organizations, and neighbors so that
people feel valued, proud, and connected to the community they live in.
Improve Quality of Life
SHA collaborates with communities to use housing as a platform to improve quality of life by enhancing
health, supporting education and skill development, and other services to help people reach their full
potential. Key objectives related to this strategic direction are:
• Enhancing senior and disabled living by connecting senior and disabled participants to the
services they need and facilitate access to other housing choices along a continuum of care as
appropriate.
• Economically empowering people by assisting participants in benefiting from education and
employment to increase their economic security, skills, income, assets, and financial well-being.
• Supporting youth achievement by promoting access to high-quality learning opportunities for
young children, youth, and young adults that increase educational performance, college and
career readiness, and encourage lifelong well-being.
ORGANIZATIONAL CORNERSTONES
SHA’s Organizational Cornerstones reflect SHA’s values in action. These qualities help form the
foundation of how SHA advances its mission and pursues its Strategic Directions. SHA’s culture is driven
by a commitment to excellence that continually strengthens these cornerstones. The seven
Organizational Cornerstones are listed and defined below.
Engaging Service and Respectful Relationships: SHA is committed to providing consistently high-quality
service and respectful interactions. SHA honors and assists participants and communities through
service and engagement that recognize their unique needs and strengths.
Staff Excellence: SHA is committed to recruiting, retaining, and developing people whose skills and
dedication allow them to perform consistently at the top of their field. SHA trains and invests in a well-
equipped workforce to support the agency’s day-to-day operation in pursuit of its mission.
Partnership and Coordinated Action: SHA engages in partnerships and leverages resources to extend
services and housing beyond core housing programs. SHA aligns partners, programs, and service delivery
to broaden and accelerate progress on strategic directions.
Financial Stability and Operational Efficiency: SHA manages its resources to maximize the impact and
cost-effectiveness of its operations as well as the value and longevity of its assets. SHA focuses on
strengthening its financial condition, streamlining service-delivery, and being good stewards of the
public trust to best serve people now and into the future.
Race and Social Justice Initiative (RSJI): SHA is committed to delivering services in a culturally
competent way, free of racism and prejudice; to minimizing the impacts of poverty; and to advancing
and supporting social justice. SHA strives to eliminate individual, institutional, and systemic racism in its
policies and practices.
9Environmental Stewardship: SHA incorporates environmental stewardship into daily practices and long-
term decision-making to allow for more cost-effective investments; inventive approaches to complex
sustainability challenges; healthier working and living environments for staff and participants; and
broader impact within the community.
Innovation: SHA actively pursues creative, innovative, and impactful solutions to expand organizational
capacity, improve service, and meet participant and community needs. SHA continually uses high-quality
information and effective analyses to plan and evaluate its actions.
10DEPARTMENT BUDGETS
The table below shows total operating expenditures for departments as well as projected housing
assistance payments. The CY 2021 operating expenditures (excluding service grants) of $270.0 million
represent an overall increase of 5.1 percent from 2020. Direct Operating expenses, before backing out
internal service fees, are flat; and Housing Assistance Payments (HAPs) are expected to increase 10.8
percent over the 2020 level. Most departments will have the same or very nearly the same budget in
2021 as they did in 2020. Notable changes in 2021 budget as compared to 2020 are explained in the
department sections following this table.
SHA DEPARTMENT BUDGETS COMPARISON OF 2019 – 2021 OPERATIONS
CY 2019 CY 2020 CY 2021 CY 2020
2
Actual Revised Carry-On to CY 2021
Departments and/or Divisions Expenditures (000) (000) (000) % Change
Executive $3,220 $3,533 $3,533 0.0 %
Policy and Strategic Initiatives 1,131 1,791 1,756 (2.0)%
Development 1,485 1,778 1,757 (1.1)%
Housing Finance and Asset Management
Asset Management (AM) 1,245 1,130 1,130 0.0 %
AM Commercial Facilities 792 760 836 10.0 %
190 Queen Anne 2,023 1,985 1,985 0.0 %
Finance and Administrative 14,310 16,918 16,918 0.0 %
Information Technology 5,018 5,517 5,517 0.0 %
Housing Operations
Housing Operations Admin, Admissions &
3,788 4,037 4,105 1.7 %
Inspections
LIPH No. So., Scattered Sites, homeWorks &
25,892 28,550 28,468 (0.3) %
LIPH Admin
Yesler, Baldwin, Ritz, and EOC 1,315 830 648 (21.9)%
Seattle Senior Housing Program 6,302 6,528 6,528 0.0 %
Special Portfolio 5,210 6,940 6,954 0.2 %
Impact Property Services Operations 16,222 16,352 16,352 0.0 %
Impact Property Services Facilities 326 356 356 0.0 %
Solid Waste and Fleet 3,993 4,141 4,141 0.0 %
Community Services 4,287 5,528 5,528 0.0 %
JobLink 1,937 2,301 2,301 0.0 %
IPM, NH II & III, RV I, HPN, Parks & Campus of
9,609 8,781 8,781 0.0 %
Learners
Human Resources 2,356 3,074 3,137 2.0 %
Housing Choice Vouchers 11,083 11,979 11,887 (0.8)%
DIRECT OPERATING $121,544 $132,808 $132,618 (0.1)%
Plus Housing Assistance Payments $114,786 $124,015 $137,417 10.8 %
Less Internal Agency Fees (26,581) (28,304) (28,235) (0.2)%
TOTAL OPERATIONS $209,749 $228,519 $241,800 5.8%
Table 3: 2021 Department Budgets
As noted previously, the Carry-On full-time equivalent staff positions (FTEs) for 2021 is 610.1, a 0.2 FTE
increase from 2020. The comparison of FTEs in 2020 and 2021 by Department is presented in the table
below. The change in the righthand column represents position additions, reductions, and/or transfers
2
To provide a better comparison from 2020 to 2021, CY 2020 Revised is the 2020 Adopted Budget plus Northgate Apartments.
11from one Department to another. Please see Department write-ups that follow for more specific
information on staffing changes.
2020 2021
Full-time Equivalent Positions Adopted Carry-On Change
Executive 17.9 17.9 -
Policy and Strategic Initiatives 11.0 10.0 (1.0)
Asset Management 19.8 19.8 -
Asset Management Commercial 2.0 3.0 1.0
Construction 17.5 17.5 -
Development 14.3 13.7 (0.6)
Finance and Administration 46.9 46.9 -
Housing Operations 376.1 378.1 2.0
Human Resources 12.0 12.8 0.8
Information Technology 23.5 23.5 -
Housing Choice Vouchers 69.0 67.0 (2.0)
TOTAL 609.9 610.1 0.2
Table 4: 2021 Department FTEs
12EXECUTIVE BUDGET
2019 2020 2021
Executive Department Expenditures Actual Adopted Carry-On % Change
Admin Salaries & Temp Help $2,747,100 $2,805,300 $2,805,300 0.0 %
General and Administrative Expense 383,500 454,700 454,700 0.0 %
Tenant Services 1,600 2,300 2,300 0.0 %
Maintenance & Contracts 88,400 270,800 270,800 0.0 %
Utilities - - -
TOTAL OPERATING $3,220,600 $3,533,100 $3,533,100 0.0 %
Less Internal Agency Fees (151,700) (184,600) (184,600) 0.0 %
Salaries & Benefits in Grants, Capital, - - -
and Limited Partnerships
TOTAL $3,068,900 $3,348,500 $3,348,500 0.0 %
Table 5: Executive Department Budget and FTEs
2020 2021
Full-time Equivalent Positions Approved Carry-On
Total FTEs 17.9 17.9
Department Purpose and Function
The Executive Department provides overall leadership and direction for Seattle Housing Authority under
the guidance of the Board of Commissioners. The office of the Executive Director oversees the
operations of the Authority; provides support to the SHA Board of Commissioners to ensure their work
represents shared priorities; maintains SHA’s intergovernmental, community, and business relations;
and provides state and national leadership on behalf of low-income housing through advocacy
organizations. The department also includes the Deputy Executive Director; the Intergovernmental
Relations Director; the Office of the General Counsel—SHA’s legal representatives and advisors; the
Communications Office which oversees SHA’s public affairs, media relations, internal and external
communications; and the Office of Policy and Strategic Initiatives whose budget and work plan
highlights are shown separately in the department section following this one. The Department provides
communications, legal advice, and counsel to the Executive Director and to colleagues in other
departments as needed.
13OFFICE OF POLICY AND STRATEGIC INITIATIVES BUDGET
Policy and Strategic Initiatives 2019 2020 2021
Expenditures Actual Adopted Carry-On % Change
Admin Salaries & Temp Help $987,400 $1,377,700 $1,343,000 (2.5)%
General and Administrative Expense 132,400 198,900 198,900 0.0 %
Tenant Services 900 24,000 24,000 0.0 %
Maintenance & Contracts 10,100 190,000 190,000 0.0 %
Utilities - - -
TOTAL OPERATING $1,130,800 $1,790,600 $1,755,900 (1.9)%
Less Internal Agency Fees (103,800) (99,000) (99,000) 0.0 %
Salaries & Benefits in Grants, Capital, 201,800 109,200 - (100.0)%
and Limited Partnerships
TOTAL $3,119,100 $1,800,800 $1,656,900 (8.0)%
Table 6: OPSI Budget and FTEs
2020 2021
Full-time Equivalent Positions Approved Carry-On
Total FTEs 11.0 10.0
The 2021 Carry-On operating budget for the Office of Policy and Strategic Initiatives (OPSI) was slightly
reduced to reflect the planned expiration at year end 2020 of a CMTO grant supported position.
Department Purpose and Function
OPSI supports SHA’s mission by developing collaborative solutions, empowering strategic decision-
making, and testing and evaluating strategies. Since the team’s inception in 2015, OPSI has played a key
role in:
Developing collaborative solutions by partnering with a range of stakeholders including staff,
residents/participants, and community stakeholders to identify challenges, opportunities, and
solutions to issues impacting our mission.
Empowering strategic decision-making by ensuring that SHA’s strategic plan is a living guide for
decisions and bringing best and promising practices and research to inform decision-making.
Testing and evaluating strategies by serving as the evaluator for a variety of SHA policies and
programs and establishing key metrics, success measures, and leading indicators.
Meeting the regulatory needs of HUD and supporting SHA’s role as a leader within the national
MTW program.
14DEVELOPMENT BUDGET
Development Department 2019 2020 2021
Expenditures Actual Adopted Carry-On % Change
Admin Salaries & Temp Help $1,324,800 $1,580,300 $1,559,900 (1.3)%
General and Administrative Expense 137,900 169,400 169,400 0.0 %
Tenant Services - - - -
Maintenance & Contracts 21,300 20,100 20,100 0.0 %
Utilities 500 8,000 8,000 0.0 %
TOTAL OPERATING $1,484,500 $1,777,800 $1,757,400 (1.1)%
Less Internal Agency Fees (109,900) (133,000) (133,000) 0.0 %
Salaries & Benefits in Grants, Capital,
590,400 451,600 401,300 (11.1)%
and Limited Partnerships
TOTAL $1,965,000 $2,096,400 $2,025,700 (3.4)%
Table 7: Development Department Budget and FTEs
2020 2021
Full-time Equivalent Positions Approved Carry-On
Total FTEs 14.3 13.7
Total operating expenditures for Development Department of this Carry-On Budget will decrease by 1.3
percent in CY 2021 and when both operating and capital sources are considered, the overall decrease is
3.4 percent due to planned position elimination and the completion of The Kresge Foundation grant.
The 0.6 FTE Development Department decrease includes 0.3 FTE for a Senior Development Program
Manager position due to retirement and 0.3 FTE for the Coordinator III position managing The Kresge
Foundation grant program to be completed in January 2021.
Department Purpose and Function
The Development Department reports to the Deputy Executive Director. The Development Department
is responsible for redevelopment that includes:
Planning new affordable housing and redevelopment;
Managing community processes surrounding development visions;
Implementing development projects;
Overseeing the sale of land to private developers and the subsequent development of market-
rate or workforce housing;
Managing and supporting neighborhood associations until property owners in the communities
assume management and financial responsibility; and
Participating in local and regional planning meetings that may involve potential new low-income
and affordable housing development opportunities.
15Development
Development is accountable for advancing the Strategic Plan goal of increasing SHA’s low-income, work
force, and affordable housing. It serves the Seattle Housing Authority’s Mission by developing safe and
affordable housing in thriving communities. The Department also seeks to increase the number of
affordable housing units, both rental units and home ownership, through a variety of programs and
partnerships. For example, revitalizing the 78-year-old low-income housing in the Yesler community
with new vibrant mixed in communities connected to nearby neighborhoods and providing a variety of
rental and home ownership housing choices, plus community facilities and other amenities. Another
important responsibility of the Development staff is marketing properties successfully to private
developers for homeownership opportunities, including affordable ownership opportunities.
Looking toward the future to identify new housing development opportunities primarily to serve people
earning less than 80 percent of Area Median Income (AMI) is another responsibility of the Development
department. In this role, the Department evaluates opportunities for future developments with both
public and private partners, looking especially for opportunities that have minimal financial risk to SHA
and hold good promise for desirable affordable housing.
16HOUSING FINANCE AND ASSET MANAGEMENT BUDGET
Housing Finance & Asset Management 2019 2020 2021
Department Expenditures Actual Adopted Carry-On % Change
Admin Salaries & Temp Help $1,104,100 $934,700 $934,700 0.0 %
General and Administrative Expense 112,800 164,200 164,200 0.0 %
Tenant Services - - -
Maintenance & Contracts 28,600 30,800 30,800 0.0 %
Utilities - - -
TOTAL OPERATING $1,245,500 $1,129,700 $1,129,700 0.0 %
Less Internal Agency Fees (84,000) (68,000) (68,000) 0.0 %
Salaries & Benefits in Grants, Capital, 1,161,400 1,061,700 1,061,700 0.0 %
and Limited Partnerships
TOTAL $2,322,900 $2,123,400 $2,123,400 0.0 %
Table 8: Housing Finance & Asset Management Budget and FTEs
2020 2021
Full-time Equivalent positions Approved Carry-On
Asset Management FTEs 19.8 19.8
Construction Operations FTEs 17.5 17.5
Total Asset Management &
37.3 37.3
Construction Ops FTEs
Department Purpose and Function
The Department of Housing Finance and Asset Management (“Department”) focuses on the
preservation of the agency’s real estate assets and maximizing the use of these assets to further the
mission of the agency to create and sustain decent, safe, and affordable housing that fosters stability
and self-sufficiency for people with low incomes. Working in partnership with other agency
departments, the Department assists in the financing of new and existing housing; develops and
implements the agency’s capital program to ensure the physical and financial viability of its assets; and
provides support and assistance to the Housing Operations department in their management of agency
assets that furthers the agency’s financial and social goals. In addition, the Department works with
various investors and financial partners to make strategic recommendations regarding the assets,
financial stability, resident services, and other factors impacting the agency’s real estate portfolio and
residents.
The Department leads the Asset Management Team, an inter-agency committee that partners with the
Housing Operations, Finance and Administration, Housing Choice Voucher (HCV), the Office of Policy and
Strategic Initiatives (OPSI), and Development departments, and serves as a focal point for discussions of
issues and decision-making related to the agency’s assets.
17Housing Finance and Asset Management
The Department’s three main areas of strategic focus are:
Promoting quality communities through the preservation the agency’s real estate assets by
making strategic improvements to the capital program that focus on increased efficiency in the
implementation and management of capital projects that address the capital needs of the
agency’s assets;
Increasing overall Department efficiency through the development of procedures and planning
efforts that focus on the assessment and evaluation of current business practices; and
Expanding housing opportunities by developing a strategy to serve more people through
acquisition of new real estate assets and the redevelopment of existing real estate assets in
partnership with the Development and Housing Operations departments.
Asset Management Commercial Facilities
Asset Management Commercial 2019 2020 2021
Facilities Actual Adopted Carry-On % Change
Admin Salaries & Temp Help $253,500 $239,900 $316,900 32.1 %
General and Administrative Expense 109,700 98,500 98,500 0.0 %
Tenant Services - - -
Maintenance & Contracts 295,200 272,200 272,200 0.0 %
Utilities 133,300 148,800 148,800 0.0 %
TOTAL OPERATING $791,700 $759,400 $836,400 10.1 %
Less Internal Agency Fees (161,600) (179,200) (179,200) 0.0 %
Salaries & Benefits in Grants, Capital, - - -
and Limited Partnerships
TOTAL $630,100 $580,200 $657,200 13.3 %
Table 9: AM Commercial Facilities Budget
2020 2021
Full-time Equivalent Positions Approved Carry-On
Total Asset Management
2.0 3.0
Commercial FTEs
The 2021 Carry-On operating budget for Asset Management Commercial Facilities was increased to
reflect a 2020 mid-year addition of a 1.0 FTE position that will replace a condo association contract for
external management that had been budgeted within Housing Operations.
Asset Management Commercial Facilities manages thirteen commercial properties across several
portfolios. Commercial tenants include service providers and commercial businesses; some SHA
departments are tenants as well. Seven properties are associated with HOPE VI communities; HOPE VI
management offices and service providers are lessees at some of these properties.
The Asset Management’s program goal is to keep all commercial spaces leased and occupied at levels
that allow SHA to cover expenses, debt requirements for the buildings, and build capital reserves.
18Housing Finance and Asset Management
190 Queen Anne Central Office
190 Queen Anne Central Office 2019 2020 2021
Expenditures Actual Adopted Carry-On % Change
TOTAL OPERATING $2,023,206 $1,984,563 $1,984,563 0.0 %
Table 10: 190 Queen Anne Central Office Budget
The Central Office, located in the lower Queen Anne neighborhood, houses SHA’s executive,
administrative, voucher assistance, and many property management services staffs. The Housing
Finance and Asset Management staff manages and administrates the offices at 190 Queen Anne. SHA
has been at this address since 2012.
19FINANCE AND ADMINISTRATION BUDGET
Finance and Administrative Services 2019 2020 2021
Department Expenditures Actual Revised Carry-On % Change
Admin Salaries & Temp Help $5,012,600 $5,444,100 $5,444,100 0.0 %
General and Administrative Expense 9,157,900 11,240,500 11,240,500 0.0 %
Tenant Services 3,500 - -
Maintenance & Contracts 135,900 233,500 233,500 0.0 %
Utilities - - -
TOTAL OPERATING $14,309,900 $16,918,200 $16,918,200 0.0 %
Less Internal Agency Fees (810,500) (517,300) (517,300) 0.0 %
Salaries & Benefits in Grants, Capital, 93,900 211,900 211,900 0.0 %
and Limited Partnerships
TOTAL $13,593,300 $16,612,700 $16,612,700 0.0 %
Table 11: Finance and Administration Budget and FTEs
2020 2021
Full-time Equivalent Positions Approved Carry-On
Total FTEs 46.9 46.9
The 2021 Carry-On Budget for Finance and Administration (F&A) is the same as the 2020 Revised
Budget. F&A’s budget includes debt service payments and insurance premium coverages for the newly
acquired properties. Northgate Apartments was added to SHA’s portfolio in late 2019, and the 2020
Adopted Budget did not include Northgate. The 2020 Revised Budget shown above includes the revision
made to add Northgate Apartments.
Department Purpose and Function
The Finance and Administration Department has six operating groups: Accounting and Treasury
Management, Budgeting and Financial Analysis, Purchasing and Contract Administration, Business
Services, Risk Management, and Information Technology, whose budget and work plan highlights are
shown separately in the department section following this one.
The department oversees the financial stewardship of SHA. To this end, the department includes
responsibilities for:
Financial Management: Financial policies; accounting and reporting systems; banking relations;
investments; treasury functions; overall debt management; internal controls, and annual
financial statements and compliance with financial reporting requirements from investors,
trustees, funders, lenders, and city, state, and federal agencies. Accounts receivable; accounts
payable; payroll, and general ledger responsibilities for all funds and the agency as a whole.
Financial Accountability: Annual audit reviews by the State Auditor, SHA’s independent auditor,
and auditor(s) for the tax credit limited partnerships, as well as periodic audits by federal and
state agencies; monitoring and corrective actions as required to ensure SHA conformance with
bond and contractual financial performance obligations and compliance with state and federal
regulations.
20Finance and Administration
Budgeting: Management of SHA’s budget processes and preparation of recommended annual
and multi-year operating and capital budgets; reviewing Congressional funding proposals and
monitoring economic trend analyses; monitoring and reporting performance of actual revenues
and expenditures and program accomplishments against approved budgets and program goals;
proposing budget revisions and/or corrective actions to maintain the integrity of the annual
budget; and overseeing adherence by the authority and HUD to financial and funding provisions
of the MTW Agreement.
Risk Management: Obtaining insurance coverages for SHA and affiliates; auditing and reviewing
insurance policies; processing and handling claims; recommending risk management and
incident/accident reduction actions; and reviewing contracts, leases and other agreements to
ensure SHA risks are appropriately addressed and controlled.
Procurement and Contracting: Purchasing and contract administration for goods, services and
construction contracts; administration of Section 3, Davis-Bacon, and social equity programs;
development and administration of SHA procurement policies and procedures to ensure fair and
competitive procurement practices and compliance with federal, state, and local laws and
regulations; and continuous process improvement to ensure procurement practices support
SHA’s business interest in timely and efficient contracting.
Information Technology: Providing efficient and creative technology solutions to business
problems; supporting the application and operating system software in use at SHA and the
computers, telephones and other ancillary equipment used by agency staff; ensuring a stable,
reliable and secure computer infrastructure and software to support SHA’s computing needs;
maintaining, upgrading and supporting existing software systems; consolidating duplicative or
redundant systems; addressing the highest priority needs of the agency for new software
development or introduction of new applications; and providing training resources and
expertise to support the computer literacy and competence of SHA staff; and performs the
records storage function for the agency. (See separate budget section on Information
Technology for 2020 work plan highlights.)
Business Support Services: Operation of the agency’s central reception desk; travel policy and
petty cash administration for SHA as a whole; administrative support to the accounting and
budgeting groups; supply ordering and budget management; and CFO executive support.
The fundamental charges of Finance and Administration are:
To strengthen the agency’s financial position and ability to respond to shifting financial
conditions and needs; and
To ensure that SHA’s assets and operations are managed in an efficient and cost-effective
manner.
These core objectives will guide the priorities for the Department in 2021, as it looks to make changes in
its operations, policies, and programs in order to meet the challenges of a new federal fiscal and political
reality where public funding for low-income housing development, operations, and maintenance is likely
to become severely constrained over the decade.
21INFORMATION TECHNOLOGY BUDGET
Information Technology Department 2019 2020 2021
Expenditures Actual Adopted Carry-On % Change
Admin Salaries & Temp Help $3,069,300 $3,241,000 $3,241,000 0.0 %
General and Administrative Expense 1,657,900 1,909,800 1,909,800 0.0 %
Tenant Services - - -
Maintenance & Contracts 290,500 366,100) 366,100 0.0 %
Utilities - - -
TOTAL OPERATING $5,017,700 $5,516,900 $5,516,900 0.0 %
Less Internal Agency Fees (3,500) - -
Salaries & Benefits in Grants, Capital,
- - -
and Limited Partnerships
TOTAL $5,014,200 $5,516,900 $5,516,900 0.0 %
Table 12: Information Technology Budget and FTEs
2020 2021
Full-time Equivalent Positions Approved Carry-On
Total FTEs 23.5 23.5
In 2021, the Information Technology Department will continue to split administrative costs between the
Central Services Operating Center and MTW funding.
SHA continues to invest in technological upgrades to improve process efficiency and promote cost
savings, setting aside a portion of its MTW Block Grant each year to do so. IT Capital Projects in 2021
total $570,000, an 18.5 percent increase from 2020, but a level that more nearly reflects the annual
funding we have been providing for IT capital over the last 5-10 years. This money will be spent on
infrastructure upgrades and the Elite to Yardi conversion project. The IT Department also expects to
spend the first half of 2021 working on a number of IT projects related to SHA’s COVID-19 recovery plan;
the 2020-2021 IT COVID Recovery Plan will included in the 2021 Adjusted Budget.
Department Purpose and Function
The IT division supports SHA’s mission by providing efficient and creative technological solutions to
business problems. The division supports the application and operating system software in use at SHA
and the computers, telephones, and other ancillary equipment used by agency staff. IT runs scheduled
computer jobs to produce pay advices, invoices, vendor checks, and other documents and also oversees
records storage functions for the agency. The division consists of two operating groups, Infrastructure or
Network Systems and Applications Development.
Agency staff rely on IT to perform their jobs effectively and efficiently; to meet legal and regulatory
requirements; to provide a consistent, secure operating environment with uninterrupted access; to
ensure SHA data is secure and individual privacy protected; to provide financial and property
management records; and to communicate with the public, applicants for housing, residents, landlords,
vendors, contractors, as well as each other. Automated systems reduce paper storage costs and reduce
the need for manual data entry, asset tracking, and other administrative work.
22Information Technology
Working with the guidance of the IT Steering Committee, which is composed of senior business
department representatives, Information Technology is dedicated to ensuring stable, reliable, and
secure infrastructure and software to support SHA’s computing needs. IT will work to maintain, upgrade,
and support existing software systems; consolidate in a cost-effective manner duplicative or redundant
systems; address the highest priority needs of the agency for new software development or new
applications; and provide training resources and expertise to support the computer literacy and
competence of SHA staff.
23You can also read