BUDGET GUIDELINES 2021 BUDGET COUNTY OF MONROE MICHIGAN - Monroe County, Michigan
←
→
Page content transcription
If your browser does not render page correctly, please read the page content below

BUDGET GUIDELINES

                                                              2021 BUDGET

                                                         COUNTY OF MONROE
                                                             MICHIGAN

                                     PREPARED FOR THE

                   MONROE COUNTY BOARD OF COMMISSIONERS

                                 J. HENRY LIEVENS, CHAIRMAN
                                JERRY A. OLEY, VICE-CHAIRMAN

                          Transmitted to Board of Commissioners June 5, 2020

DOCUMENT PREPARED BY:
MICHAEL BOSANAC, ADMINISTRATOR/CHIEF FINANCIAL OFFICER
SUE MAIER, DIRECTOR OF FISCAL SERVICES
TABLE OF CONTENTS
1.    PURPOSES OF BUDGET GUIDELINES                                          1
2.    OBJECT STATEMENT                                                       2
3.    ANNUAL BUDGET WITH 2ND YEAR PROJECTION                                 3
4.    OVERVIEW OF THE 2021 COUNTY BUDGET                                     4
      A.   Budget Outcomes/Notes on County Finances                          7
      B.   Financial Management Measures                                     9
      C.   Budget Positives                                                 10
      D.   Budget Summary                                                   15

5.    REVENUES                                                              18
      A.   Equalized Valuation & Property Taxes                             18
      B.   Sources of County Property Tax Revenue                           18
      C.   Inmate Dormitory Revenue-Special Revenue Fund                    21
      D.   Court Equity Fund                                                24
      E.   Court Case Filings/Trends & Data                                 25
      F.   Friend of the Court-Special Revenue Fund                         26
      G.   Fund Balance & Budget Stabilization Fund                         27
      H.   State Revenue Sharing                                            29
      I.   Interest Earnings/Cash Management                                29
      J.   Delinquent Tax Revolving Fund                                    30
      K.   Other Revenues & History of General Fund Revenues/Expenditures   31

6.    EXPENDITURES                                                          32
      A.   Retiree Health Care                                              32
      B.   Employee Health Care                                             36
      C.   Retirement                                                       39
      D.   Employee Wages                                                   41
      E.   General Fund Transfers-Out                                       42
      F.   Operating Expenses                                               43
      G.   Debt Schedule                                                    43
      H.   Capital Outlay                                                   44
      I.   Capital Improvement Projects                                     44
      J.   Enterprise Wide Computer Capital Outlay & Network Maintenance    44

7.    BUDGET GOALS                                                          45
8.    BUDGET POLICY GUIDELINES                                              46
9.    DEPARTMENTAL GOALS & OBJECTIVES                                       47
10.   BUDGET COMPLIANCE                                                     48
11.   BASIS OF ACCOUNTING                                                   48
12.   PRIOR YEAR BALANCES                                                   48
13.   CONTINGENCIES                                                         48
14.   PROGRAMS FUNDED BY OUTSIDE FUNDING SOURCES                            48
15.   INDIRECT COST CONCEPT                                                 49
16.   FEES                                                                  49
17.   FINANCIAL INDICATORS-PER CAPITA DATA CHARTS                           49
18.   2021 PRELIMINARY BUDGET OUTLINE                                       54
1. PURPOSES OF 2021 BUDGET GUIDELINES
These guidelines are prepared to facilitate the preparation of, and to establish the parameters for revenue
and expenditure estimates for the 2021 budget. They outline the general direction for the preliminary and
recommended budgets. This document also serves to assist the County in complying with PA 2, the
Uniform Budgeting and Accounting Act by supplying requisite information on County finances to
policymakers prior to adopting the budget. It is one of several key reports presented on County financial
management.
Budgeting guidelines are defined as the Board of Commissioner’s principle budget policies to be reflected
in the annual appropriation process. In order to present these guidelines, it is necessary to review the
financial position of the organization and projections of the finances for the next budget year and beyond.
Below is an outline of financial information on the core operations selected for analysis. In summary, the
organization has remained in a state of financial stability and slightly improving from when this document
was drafted last year preparing the 2020 budget. Small incremental positive trends can be found in selected
areas of the budget and related financial position. While continued use of reserves has been required to
cover budget shortfalls over the past 10 years, these amounts have generally been trending lower and more
stable over time notwithstanding year-to-year variances. The 2020 budget projected a surplus when
adopted November 5, 2019. Since that time, one major budget amendment totaling $1.2 million of reduced
revenue has been made. As the budget is monitored throughout the current year, other measures may be
required.
As this document and the information contained herein were developed, the corona virus pandemic was
occurring throughout the county, state, nation and globe. Unprecedented actions and measures were being
taken to slow and mitigate the spread of the virus. The assumptions used in this document to develop a
preliminary 2021 budget outline will certainly stand to be modified and corrected over time as more
operational and economic impacts are known from the effects of this pandemic.
Financial review includes the following core areas of fiscal management of the County:
Current revenues and preliminary estimates of revenues for the upcoming budget year.
Economic forecast of the taxable value of real property is of primary focus and
consideration used in conjunction with the final Boards of Review and tax settlement
figures.
Evaluating past budget year operating surpluses or deficits and understanding the primary
factors that led to the financial outcome are provided. This encompasses all funds, including
major special revenue funds, the General Fund and cost centers within the General Fund.
Inflation trends and local economic conditions that impact supplies and contracted services.
Prospects for new taxes and fees, changes in current tax and fee rates along with collection
rates and best estimates for MTT adjustments. This includes what we know at this time for
the tax appeal settlement with DTE on the Monroe Power Plant and our best estimate of
results from the tax appeal of the Fermi II nuclear power plant.
Multiple categories of revenues and expenditures reviewed in trend analysis to demonstrate
the financial impact, changes over time and projections going forward.
Page 1
Major non-recurring expenditures that fall due in the current budget year.
Major non-recurring revenue that will be realized or end during the budget year including
reserve funds.
Demands for public and internal support services from the organization and resources
available to provide these services. This includes demands for new employee positions
above any replacements or back filled positions.
External constraints on revenue, demands on the County due to external authorities, new
obligations, regulations and compliance. Of concern always will be the pending legislation
to extend court courts and fees in the absence of a new funding model and sunset of the
existing cost and fee schedules. These concerns spring from Michigan Supreme Court’s
decision in Cameron vs. Washtenaw County. While the decision kept the status quo, that is
untenable going into the future. The sunset provision from the Cunningham case in which
courts had imposed costs for which there was no authority; that authority is only through
statute and the legislature allowed costs to continue but this authority ends in 2020 and
clarity is needed as we project revenues into the 2021 budget.
Continued state funding for implementation of the requirements of indigent defense counsel
services for standards 1-4 and funding for the additional standards to be introduced and
implemented. From what was originally enacted in PA 93 of 2013 and the state responsible
for the cost of implementing the new standards, the County has implemented fully the first
set of standards with no negative financial impact to the General Fund.
The objective of this analysis focused on the above items is to define the financial parameters for the 2021
budget. All offices and departments should expect to see the financial position of the County and our
forecast reflected in budget policy recommendations from this office to the Board of Commissioners for
action on the 2021 budget. This will ultimately be incorporated into preliminary and recommended budgets
and is consistent with past practices related to budget development.
2. OBJECT STATEMENT
These guidelines are intended to present a framework with supporting data for preparation of the budget.
The preliminary outline for the 2021 budget reflects the supporting figures and assumptions contained
throughout this document, other ongoing budget management reports and are all subject to updated
information and figures throughout the budget development phase.
All State funded programs must continually be monitored to insure that changes do not take place that can
negatively impact the County’s current year operating budget and leave the County to cover obligations
intended for the State. This is due to the State budget starting October 1 while the County budget is
calendar year. Changes at the start of the State budget can impact the County budget during the 4 th quarter.
The Board of Commissioners will rely on those department’s receiving state funding to confirm the
accuracy of projected funding for 2021 and those department managers shall be prepared to modify budgets
should funding levels change even after the County budget is adopted. As a political sub-division, county
government is subject to the annual appropriation process of the Michigan legislature and therefore, any
strategies the state uses to lower transfer-out expenditures to local units. With the COVID-19 response and
other state budget changes, the impact to the County budget has to be understood.
Page 2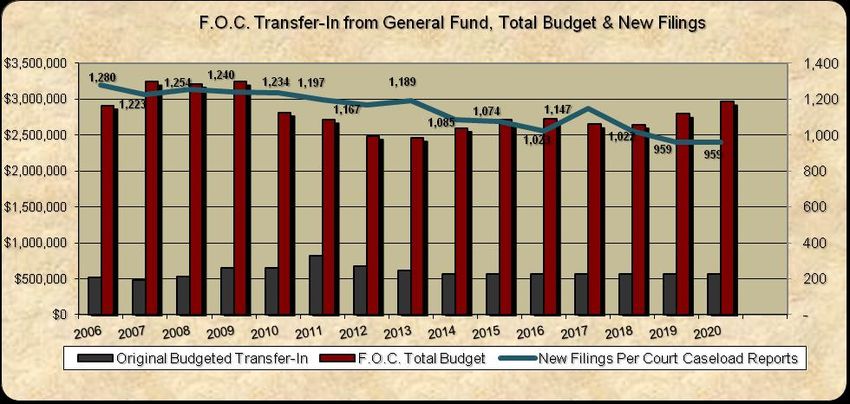
Additional areas of concern relative to State funding that could affect the County’s budget and
corresponding level of services to the community include the following:
Impact from Public Acts 397 through 408 covering personal property taxes. In 2016, the
Michigan legislature provided the replacement funding intended to make local units whole from the
loss of revenue from manufacturer’s personal property tax. In the 2018 budget, we stayed with our
conservative budget assumptions for this revenue and the actual amount was much lower than in
prior years at $647,072 but still exceeded the revenue estimate. Accordingly, we have kept the
projections we had in prior budgets for this revenue source going forward. The four (4) years of
budget vs. actual for PPT:
2016 Budget $275,000 Actual $814,210
2017 Budget $275,000 Actual $1,452,564
2018 Budget $300,000 Actual $647,072
2019 Budget $450,000 Actual $1,005,007
2020 Budget $375,000 Actual TBD
Separately, funding reimbursement is provided to the Commission on Aging, Fairview Home and
the Museum’s budget. These amounts are reporting in those special revenue funds.
Changes in childcare funding, reimbursement rates, cost allocation plan amounts and associated
additional program administrative rules and requirements. We continue to measure the impact from
the new rules, requirements and interpretations of eligible costs highlighting the challenge of this
partnership with the state, courts and counties. We continue to monitor this cost sharing outcome
and impact to the County.
Solid Waste programs and changes to the fund balance in the Solid Waste fund from shrinking
revenues and continued demand for services will result in a reduction in the fund balance. Overseas
sourcing for demand of recycled products has dropped and impacted the overall costs and services
provided.
Any changes in Maintenance of Effort terms in the funding formulas that would not be
beneficial to the funding unit and allow the state to leverage County efficiencies and cost controls
with unequal benefit under the funding formulas.
Continued debate on criminal justice reforms that could impact housing of juveniles and a lack
of adequate cost sharing from the state for any new mandated services.
Possible implementation of the Michigan Joint Task Force on Jail and Pretrial Incarceration
Report Recommendations and impact to the County from the new procedures/rules.
County revenue sharing is expected to be negatively impacted. Information on the amount of
impact is not clear at this time. Our estimate for the budget is a reduction of 40% until we see the
state’s FY21 budget.
3. ANNUAL BUDGET WITH 2nd YEAR PROJECTION
The Board of Commissioners will consider financial commitments beyond the upcoming budget and weigh
longer-term impacts from any budget or policy commitment. This process will require all departments to
submit estimates of revenues and expenditures for a two-year budgeting cycle for the fiscal years ending
Page 3
2021 and 2022. This will take a more deliberate scan of risks of revenues and value of planned expenses.
Finance staff will use these projections to update the long-term budget forecast. These projections will not
require a detailed evaluation of every line item, but will consider major revenues and expenditures to
provide an assessment of what trends are forming. The trends will be used to establish a basis to
proactively adjust operations to balance against resources prior to the ensuing budget cycles. These
estimates are modified on an annual basis to adjust amounts for unanticipated events. There is high value in
projecting the future obligations and resources and is worth the effort. The County will continue to adopt a
single annual year budget in compliance with the Uniform Budgeting and Accounting Act and projections
for the second year as required by Public Act 200 of 2012 and as we have done since 2001.

4. OVERVIEW OF THE 2021 COUNTY BUDGET

County finances have strengthened over time going back from 2014 and forward to today. There continues
an easing of the most difficult decisions involved in formulating a balanced budget while using reserves to
invest in a limited amount of capital expenditures. Associated with this has been the governing board’s
ability to adopt a budget much sooner than had been possible in prior time periods. Supplemental revenue
came from reserve funds to fund the current year’s planned expenditures and balance the budget. Elected
officials and managers have operated within budgets and consistently under spent appropriations to help
deliver operating surplus in each of the last 10 years. As a result, reserves have been strengthened to some
of the strongest levels in the past 30 years and are illustrated later in this document.

Notwithstanding these developments, budgets continue to be about choices, and about the best use of
limited resources within the organization. Questions center on how best to deliver the full service menu of
public services to our community. In order to meet the goals of the governing board and present a balanced
budget, we continue to employ a formula to short funding the full annual actuarially determined
contribution to retiree health care. The Board has accepted this approach as reasonable to meet current year
public service needs and fund long-term obligations.

The County has continued making progress in getting closer to a structurally balanced budget to help with
the next economic downturn. This was done through many changes, budgeting techniques and financial
management practices to assist the County with future budgets. These practices will be continue as other
financial challenges remain. Some of the challenges are routine as part of the budget process and others
change or develop with new levels of importance. At a summary view, these challenges include: 1) more
requests for funding than what is available from current year resources; 2) conflict over the prioritization
and allocation of limited resources; 3) efforts at cost containment to match forecasts of future sustained
revenue growth; 4) employee total compensation and growth commensurate with what the employer can
fund over the long-term; 5) capital investments in technology, facilities and fleet; and 5) continuing to meet
funding obligations of pension and post-employment benefit program expenditures.

Local governments, including the County, must meet a broad number of objectives, but none are more
impactful than maintaining a stable financial position. This results from the fact that any organization will
be severely constrained in its ability to function in a planned purposeful direction if its finances are not well
managed, maintained and strong. While capital investments, good management and service delivery are
critical issues in daily operations, these are all secondary to the financial standing of any organization, and
its ability to deliver services and chart a stable course forward. Financial position involves adequate margin
in current year budgets, trends of delivering operating surplus rather than operating deficits and
maintaining sufficient reserve funds from which rating agencies base in part the County’s financial credit
rating. Much more can be accomplished when financial strength and stability is certain as this allows the
organization to plan and focus efforts on outcomes rather than managing under financial strain either from
                                                                                                           Page 4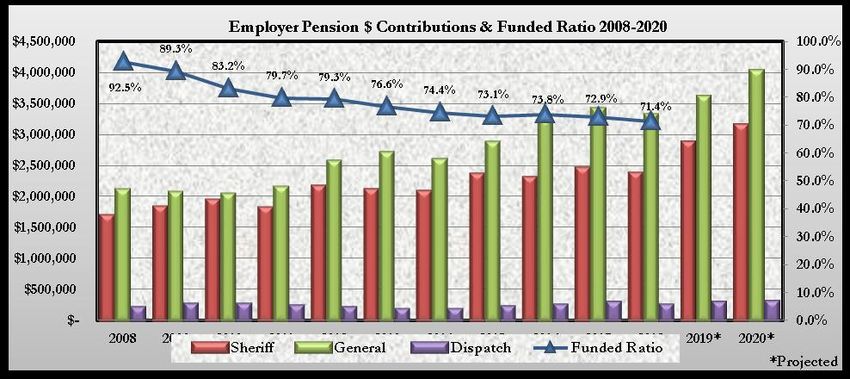
factors within or outside leadership’s control. Fortunately, the County is out of the financial crisis it was in
from 2009-2014, but looking forward, growth will remain limited due to a number of revenue limits in
place from prior legislative action.
Ongoing Initiatives:
Over the last several years, the Board has embarked on efforts to make purposeful and strategic
investments to position the organization for the next decade and beyond. Initiatives that drive new ways of
delivering outcomes through important upgrades to mission critical systems will move the organization
internally to enhance public services to our community. Some of these major initiatives include:
1) A new shared law enforcement records management system for all county police agencies along
with new computer aided dispatching and jail records management.
2) Leading efforts in geographic information systems bringing local units of government into this
shared platform.
3) Finishing the complete overhaul of the County information systems hardware and software
infrastructure to position the county to lead on the above initiatives while building a secure data
network.
4) A wage and total compensation analysis covering the workforce to determine both external
competitiveness and internal equity. This will be supplemented with options for voluntary incentive
programs for both retention and recruiting of the talent needed in our workforce to deliver public
service demands in our community.
5) Continuing to implement features within a new payroll and human resources operating system
providing a streamlined and integrated approach for efforts in managing our most important asset;
human capital.
6) Fiscal discipline that produced a financial statement free of debt allowing the General Fund to
redeploy resources to the above initiatives.
At the time of drafting this document, we describe the County’s finances as stable and improving. Standard
& Poor’s upgraded the County’s credit rating to AA in 2014 and in 2017 Moody’s moved the County to its
own rating equal to AA. Both upgrades reflect our own internal view of the County’s financial position and
the improved outlook. A key component of the improvement in the County’s financial position has been
cost control measures that have been developed and remain in place. What remains as primary concerns are
the unfunded accrued liabilities of the pension and retiree health care trusts. However, amortization funding
plans have been implemented to pay down the unfunded liabilities of the trusts over not more than 25 and
20 years for the RHC and pension trusts respectively.
The County has taken the steps required to be eligible to continue receiving State revenue sharing and to
qualify for the County Incentive Program (CIP) grants. This includes being able to demonstrate several
performance standards or be subject to reduced amounts of State revenue sharing.
Standard Compliance Date County Action
Transparency or dashboard comparative December 1, 2019 Compliant
data on operations and finances
Debt Service Report-All Funds December 1, 2019 Compliant
Projected Budget Report December 1, 2019 Compliant
See www.co.monroe.mi.us front page for dashboard
In 2015, the County realized an increase in property tax revenues for the first time since 2007-2008. This
compares to the period from 2008 through 2015, when cumulative year over year losses in property tax
Page 5
revenue was $3.42 million. In 2020, budgeted property tax revenue is $1,672,861 more than actual
collections in 2018 (after net for MTT adjustments). We project continued positive growth in property tax
revenues resulting from increased values and coupled with new development. However, growth will be
very minor. Contributing to the moderate growth limits will be Headlee amendment rollbacks should the
growth from uncapping and developments outpace inflation. The County continues its dependence on local
property tax revenue as the primary source of revenue (64% of General Fund).

While sufficient revenue growth is necessary to fund the delivery of public services, we reinforce the need
for a continued effort to achieve higher levels of efficiency and associated cost savings while providing a
broad menu of public services from a full service County government. The County’s efforts have been
successful in leveraging technology investments, consolidating and restructuring internal services and
lowering costs. Over the past several years, the Board has approved reorganizations to restructure
departmental staffing, consolidate operations and improve internal efficiencies. These have all been
pursued while the General Fund Budget has been reduced by $7.9 million or 16.5% from 2008 through the
2019 budget. As the 2020 budget was prepared, a summary of 10 key actions/initiatives the organization
had taken resulted in over $8 million in cumulative savings. These strategies have provided a financial
footing to the organization.

The County has made significant progress in balancing its operating costs to be closer in line with available
revenues. We point to the multi-year budget trend to demonstrate this. While these spending plans were not
structurally balanced, they were improved over the budgets of 2009-2014. What structural imbalances
remained came from: i). the County covering the budget shortfall using reserve funds and, ii). short funding
retiree health care. The 2019 and 2020 budgets were developed with small projected surpluses but
recognizing less than full funding of the ADC to RHC.

i. Use of Reserve Funds:

                                           2013                   2014               2015              2016             2017         2018        2019         2020
  Source/Use of Reserve Funds            Budget                  Budget             Budget            Budget           Budget       Budget   Budget       Budget
  Budget Stabilization               $     873,343           $ 129,901          $ 152,429         $           -    $       -    $      -     $      -     $      -
  Contingency Account Shortfall      $     348,646           $           -      $           -     $           -    $       -    $      -     $      -     $      -

  Fund Balance                       $            -          $           -      $ 369,000         $ 488,670        $ 618,731    $ 451,985    $      -     $      -
  Total Use of Reserve Funds         $ 1,221,989             $ 129,901          $ 521,429         $ 488,670        $ 618,731    $ 451,985    $      -     $      -

ii. Short Funding Retiree Health Care Annual Determined Contribution:
    Due to budget imbalances, the County has consistently underfunded the actuarial determined
    contributions (ADC) for retiree health care (RHC) benefits over the past nine (9) budgets in aggregate
    $18.9 million and by year as shown below:

      Budget
      Year               2012       2013              2014               2015           2016            2017             2018        2019         2020
      ADC
      Shortage     $1,999,234     $1,999,420      $2,008,724        $3,184,973       $1,388,219       $1,673,273   $2,387,756   $2,277,129   $2,049,319

    These budget measures were by design as the choice was made to fund critical public service programs
    and employee positions. In each of these years, and projected in the current year the County was able to
    fund all current RHC claims and invest funds into the RHC trust even though the recommended ADC
    was not funded. This was possible due to lower claims costs and cost control measures previously
    implemented. However, GASB Standard 75 requires the resulting liability to be recorded on the
    County’s balance sheet. This is of course a significant liability at $72.9 million.
                                                                                                                                                          Page 6
While the County has intentionally short-funded the RHC ADC, the shortfall is viewed to be
manageable over the long-term. This is due in large part to the County’s prior actions to design and
install new health care plans, closing the RHC plan benefits to new hires, increasing employee
contributions and retiree’s health care mirroring to current plan designs/cost sharing. We are starting to
see the impact of these changes in the valuations and the actuary noted the County is trending long-
term toward a level funded status meaning annual contributions are expected to be relatively stable
going forward.

A. Budget Outcomes/Notes On County Finances

The following sections provide a summary of past budget results in major areas of the budget along
with some relevant notes of our assessment regarding current and long-term financial challenges. In
addition, included are summaries about Board strategies developed and implemented to address
financial planning in the County and our planned appropriations for the 2020 Recommended Budget.

   1. General Fund-Operating Results
   Prior year actual results over the past thirteen (13) years are as follows:

               Year           General Fund Operating Surplus/(Deficit)
               2006                  $134,059
               2007                  ($528,397)
               2008                  ($3,412,980)
               2009                  ($1,979,822)
               2010                  $1,991,171
               2011                  $1,887,966
               2012                  $146,879
               2013                  $507,171
               2014                  $360,275
               2015                  $269,821
               2016                  $894,080
               2017                  $772,422
               2018                  $2,687,511
               2019                  $2,763,631* (Preliminary Subject to Audit)
   The last ten (10) consecutive years have delivered positive operating results vs. operating deficits
   from 2007-2009. The most recent 5 year period produced average operating surpluses of
   $1,477,493 per year. The 2019 results are very good and produced a5.64 % margin. This compares
   to 2018’s result of a 5.7% margin.

   A few notes regarding history of County budgets, trends in major budget categories and overall
   financial management of the County follow:

   2. Retiree Health Care
   Overall, the County is funding the obligation fairly consistently and in a manner that is
   strengthening the plan’s financial position. In the current year, funding is at 78.7% of the ADC and
   when County Agency funding is included, the rate is 80% after adding employer and employee
   contributions. The overall contribution was increased by $896,575 to keep pace with the increased
   ADC and close the funding gap that was developing. We expect the 2021 budget amount to be

                                                                                                    Page 7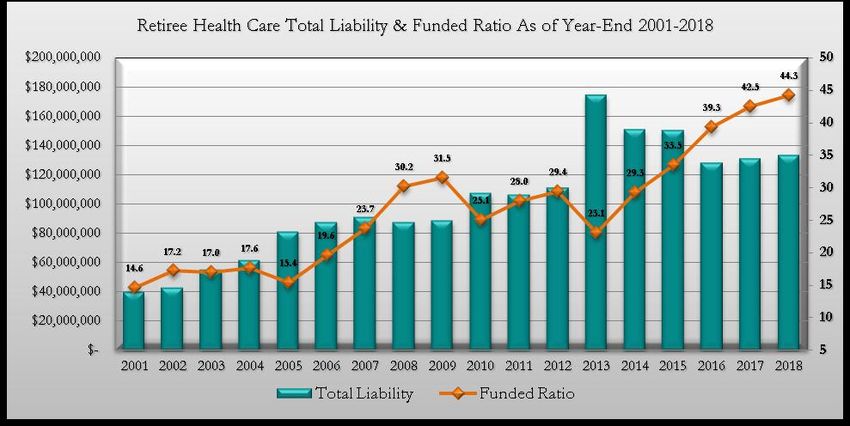
approximately $414,571 higher than 2019. Other than one time in 2010, there has not been a
withdrawal from the RHC Trust and we can point to steady positive progress in the financial
position of the RHC Trust fund due to disciplined cost control and consistent funding of the
obligation. A final positive note, investment returns for the fund in 2019 was 19.95% vs. the
actuarial discount rate of 5.5%.

3. Pension
The Employee’s Retirement System funded ratio has fallen from 100% from the 12/31/2005
valuation to a low of 71.4% at 12/31/2018. The trust fund’s overall financial trend has not shown
any change toward a positive trajectory. The unfunded actuarially accrued liability (UAAL) (all
employers) now stands at $83.9 million; an increase of $6.8 million over the prior year and follows
the preceding year’s increase of $5.3 million. Employers are paying down the UAAL with a 25 year
amortization schedule with 2021 being the 6th year of the schedule. The preliminary projected
increase in pension is $570,990. Like the RHC trust, pension investment returns in 2019 were very
good at 17.47% vs. the actuarial discount rate of 7.0%. Additionally, the County made a
supplemental contribution of $500,000 in June to help pay down the UAAL.

Considering only the County’s obligations, at 12/31/2018 the UAAL was $64.22 million or 76.5%
of the total; this amount is up from $60.83 million the prior year.

4. Capital Outlay
A history of the funding allocated to the Capital Improvement Program since 2008 is outlined
below:
                 Budgeted               Budgeted   Supplemental
  Year            Amount    Year         Amount      Funding
 2008        $         -    2016    $    200,000
 2009        $         -    2017    $    200,000   $   650,000
 2010        $         -    2018    $    190,000
 2011        $         -    2019    $    250,000   $   829,454
 2012        $         -    2020    $    350,000   $        -
 2013        $         -    2021*   $    300,000   $        -
 2014        $         -    2022*   $    320,000   $        -
 2015        $ 175,000      2023*   $    350,000   $        -
*Projected
The Board allocated supplemental funding from reserves in 2019 to fund the law enforcement
records management project (RMS, CAD & JRM). Additionally, funds from a combination of
reserves and the contingency account were appropriated to purchase portable pumps. The total of
these items is $1,492,118. Over 3 years, $500,301 of these appropriations will be repaid by local
units for the RMS. Non supplemental funding has been appropriated in the current year.

While minimal amounts of capital outlay have been included in the budget over the past several
years, these amounts have been supplemented both from additional appropriations and from the
property foreclosure fund. The foreclosure fund will be limited in capacity going forward as
foreclosures are falling and there is uncertainty until statewide lawsuits alleging the
unconstitutionality of the holding of foreclosure proceeds. Accordingly, we need to shift the
funding obligation to current revenues of the budgets.

For CIP expenditures, the 2021 budget will use the same amount from the foreclosure fund
($80,000) as the current year, and the balance from current revenues to fund the appropriation at
                                                                                             Page 8
$300,000. This amount is $50,000 less, but will maintain the capacity within the budget to cover the
baseline CIP expenditures in future years.
In addition capital outlay expenditures will include fleet patrol vehicles in the Sheriff’s Office at
$325,000, or $50,000 less than current. As more officers are added, supporting operational and
capital expenses need to keep pace. Our objective has been to establish fiscal discipline to fund
capital expenditures as a baseline operational cost as level an amount as possible. The allocation of
the funding can be targeted for particular needs, however, the expenditure amounts will be needed
as a sustaining budgeted amount annually. It is important to recognize that capital expenses are a
constant expenditure and maintaining these budgeted amounts is an important part of a viable and
steady budget model going forward.
B. Financial Management Measures
1. Most employee groups received a 1% base wage increase in 2019 and 2020 along with a $1,000
lump sum payment each year. For the 2021 budget, groups with agreements in place are scheduled
to receive a 1.5% base wage adjustment and a $500 lump sum payment. These compensation
adjustments are within the County’s financial capacity and ensure a level of sustainability. Total
employee compensation across the workforce has been relatively flat over a period of years as
shown with some increasing amounts more recently. This correlates with the financial position of
the County, its revenue growth and balancing many other obligations. Organization-wide employee
total compensation is also being managed within our resources through the tier 2 compensation
program design. Priorities for new revenues have been allocated to support the addition of public
safety staffing and fund increasing obligations for pension and RHC. In the strategy of adding road
patrol officers, since January 1, 2013 the County has added 10 new Sheriff Deputies in addition to
other staff.
2. Our 5-7 year forecast for employee health care costs has been updated due to the Corona virus
pandemic. We closely monitor the quarterly claims data for any change in our forecast and project a
6% increase next year and the 4% over the long-term. A rate increase of 6% translates into total
employer cost increases of approximately $225,867 in 2021.
Page 93. Use of reserves, one-time funding sources and other budgeting techniques continue trending
positive in successive budgets. The major exceptions remain in how we are balancing all
expenditures for public services with a reasonable funding model for the RHC ADC. The pension
ADC is funded at 100% each year. What follows is a year by year summary of how budgets were
balanced in the prior five (5) years, along with a chart depicting the same but over 15 years showing
an improving trend:
2016 Budget: Budgeted $488,670 from Fund Balance and the RHC ADC was underfunded
by $1.38 million.
2017 Budget: $1.67 million of RHC was underfunded; $618,731 used from Fund Balance
and used $80,000 from Foreclosure Fund.
2018 Budget: $2.38 million of RHC was underfunded, $451,985 used from Fund Balance
and $80,000 from Foreclosure Fund.
2019 Budget: $2.41 million of RHC was underfunded and $80,000 used from Foreclosure
Fund.
2020 Budget: $2.05 million of RHC was underfunded and $80,000 used from Foreclosure
Fund.
The chart below shows the pattern of shortfall budgeting and balancing from reserves:
(1) Excludes shortfunding amount to RHC
4. The 2020 contingency account is funded at $786,925 with another $37,000 restricted. To date,
$341,015 has been transferred out of the contingency account as part of a budget amendment. Of
the 2020 contingency account, we designated $194,552 as budget surplus, $250,000 as a one-time
funding source needed for possible adjustments from the wage and total compensation analysis. As
of this date, the remaining amount of $195,910 is unrestricted. In 2021, $350,000 will be budgeted
for contingency and an additional amount to be determined for CBA contingency. This reduces
budgeted expenditures by $436,925.
C. Budget Positives
Prior year budgeting and associated cost containment efforts by the Board, department leaders and
employees have helped and will continue to help contain cost escalation in the budget. There have been
many successes in this area. Some of the financial impacts, outcomes and further consideration of
Board policies and appropriations are highlighted as follows:
Page 101. In 2021, Property tax revenues will continue to increase for the 7th consecutive year. We
project this after netting the DTE reductions in the current year and revising our expected property
tax revenues at $30,402,000. This includes an amount for MTT adjustments. With an expected gain
of 1.57% in 2021, we estimate a net increase of $369,751. That is lower than prior year estimates of
3.1% gains due to the pandemic impact. We have also revised the out-year rates move at annual
increases of 1.52% for 2022 and 2023.
2. Retiree Health Care benefit program is more financially sound. Some of the factors include:
1) lower expected claims based on actual claims and; 2) lower future cost increases based again on
the County’s actual claims results. The expected funding level in 2021 will follow the prior year’s
effort to fund 70%-80% of the contribution budget amount. Below is a chart and table showing the
(8) year summary of RHC revenues less total claims paid and expenses:
8 Yr.
Category 2012 2013 2014 2015 2016 2017 2018 2019 8 Yr. Total Average
Revenues $7,292,713 $6,665,147 $6,948,203 $7,816,345 $7,440,986 $6,998,433 $7,176,681 $7,481,727 $57,820,235 $7,227,529
Expenses $5,178,250 $5,233,610 $5,889,859 $5,297,109 $5,182,362 $4,638,142 $5,478,479 $5,573,084 $42,470,895 $5,308,862
Net
Working
Capital $2,114,463 $1,431,537 $1,058,344 $2,519,236 $2,258,624 $2,360,291 $1,698,202 $1,908,643 $15,349,340 $1,918,668
Expenses include claims, investment management fees and cost associated with RHC.
A few key observations about the 8-year results above and focusing on how the trends compare with
the most current year results:
2019 expenses are above the average and the 2nd highest amount in the 8 year time period.
2019 working capital is slightly below the average and the 5th highest.
2019 revenues are above the average and 2nd highest. This strengthens the ability to pay claims
while also providing sufficient margin to transfer cash into the trust for further investments to
prefund the ultimate benefit paid.
3. Retiree Health Care funding contributions from eligible employees has provided some
financial support to this benefit program. As employees who have this benefit continue to retire, the
County will see lower overall employee contributions. However, the ADC must continue to be
Page 11funded, so the difference will come from increased employer contributions. In the last three (3)
years, employee contributions have been as follows:
2017 $406,339
2018 $384,471
2019 $361,405 Actual vs. Budgeted $388,336
2020 $368,564
In 2021, we project employee contributions to be approximately $350,411.
The following chart tracks the number of eligible retirees and beneficiaries of retiree health care
benefits vs. the number of active employees who are eligible. Eligible employees contribute 3% of
their base wages to pre-fund a portion of the cost of their future benefit. Of the 689 eligible
beneficiaries (increase of 22 from prior year), 401 receive County supplemental benefits, meaning
they are primary on Medicare coverage. The plan covers eligible spouses. The other 288 are fully
covered under the County’s benefit plan for retiree health care.
4. New methods to improve efficiencies, deliver services, and focus on core priorities continue to
be identified by most of our managers and employees. The departments’ organizational structures
have been flattened from reorganizations that saved money, quickened decision making and added
staff hours. All of these efforts aid communication, information sharing and enhance teamwork. As
noted previously, we directed more resources into investments in technology and relied on these to
meet basic service needs during the pandemic. Additional investments that have been made in
equipment and facilities provide better support for employee efforts to enhance the delivery of
public services to our community.
5. Numbers of Liability claims have spiked vs. long-term average counts. The overall cost impact
is minimal from the number lawsuits filed by in pro per claimants related to a law enforcement
action against an alleged prescription drug dispensing abuse case. Further, in late 2019 the federal
judge dismissed all of the lawsuits and was followed by each plaintiff filing an appeal. When those
claims are removed, we remain below our 30 year average of active litigation files. The County has
benefited from reduced pricing from property and liability rates/discounts through the County’s
group self-insurance program. Also, membership provided risk avoidance grants and net assets
distributed back to the program’s internal service funds. Operating an internal service fund, we
adjust the illustrated rates to cover claims, IBNR and case reserves against working capital. Since
2006, the annual contribution is the lowest amount over the period of time saving $197,556
annually. This is a very good outcome over this period of time with our SIR limit moved higher by
$50,000 and our coverage limit unchanged at $15 million per occurrence.
Page 126. Operating expenses related to most energy and utility costs are expected to trend within
historical budget amounts, but towards the lower end of the cost range. Michigan legislation
provides electric choice programs with 10% of the available base load to choice customers of which
the County has been a choice customer for over 11 years with aggregate savings of $832,000. A six
(6) year summary of the County’s budget vs. actual total utility spend is shown on the following
page:
Year Budget Actual Savings over Budget
2014 $1,081,625 $1,047,345 $34,280
2015 $1,042,443 $923,424 $119,019
2016 $958,565 $896,294 $62,271
2017 $1,025,841 $912,685 $113,156
2018 $986,064 $979,337 $6,727
2019 $991,435 $949,026 $42,409
Totals $6,085,973 $5,708,111 $377,862
Average Margin of Budget vs. Actual -$62,977 savings over budget
The above illustrates savings from energy programs and purchases of energy supplies. Over this 6-
year period we have been able to achieve baseline budget savings of $90,190 from amounts
budgeted over this same time period. These savings have been reallocated throughout the budget
and recurring each year. We are also budgeting much closer to actual thereby removing budget
margin.
7. Full time staffing of County employee positions were reduced by 23% from 2008 to today with
a net reduction of 105 employees. Since the lowest employee count in 2011, staffing levels have
grown by 9.5% to the numbers in the 2020 budget. With our long-term forecast, we continue to
project this chart to remain relatively flat for the next 5 years except for public safety efforts where
since 2013 ten (10) additional Sheriff Deputy positions have been added.
8. The County continues to benefit from employee engagement in safety practices. The number
of worker’s compensation claims and expenditures continue to trend low over historical figures.
Over a time, the County’s claims remain lower than the comparable benchmark of other public
Page 13organizations. Summaries of semi-annual work site inspections highlight and demonstrate the
collective efforts of leaders and employees toward workplace safety. Most recently, total claims
were the 2nd lowest for the year only lower in 2016 over the past 10 years. Over the past 5 years,
claims paid were the 2nd lowest in the most recent year.
9. Property tax revenues had continued to increase as we built the forecast for 2020 and
projected to grow in 2021 at a rate of 3.1%. However, 2021 tax revenues have been adjusted lower
as a result of expectations of economic decline from the pandemic. We have also recognized the
DTE Monroe Power plant tentative settlement that provides for an eight (8) year phased reduction
in plant value. In the 2020 budget, since notice of the tentative settlement, we recognized the loss of
plant values as portions are in both the City of Monroe and Frenchtown Township. This totaled
$351,000 in less property tax revenue. Additionally, the Republic Waste site in Erie Township
required an adjustment downward of $245,000 over 2019 valuations. These two (2) sites result in
$596,000 less tax revenue and 1.9% of all property tax revenue. As a revenue source comprising
approximately 64% of the General Fund budget, growth in property values is essential as a revenue
source to help build public service capabilities. Also, while MTT settlements have fallen, we will
continue to make adjustments in future budgets within the baseline property tax revenues
specifically for the DTE coal and nuclear power plant’s valuations. This is to provide for both
refunds and lower annual receipts.
10. Key economic and financial indicators including the unemployment rate, tax delinquencies,
home sales along with higher sale prices, etc., have all continued to show positive signs of
improving economic conditions over a 4-5 year period. Below are some specific notes from local
economic activity:
Single family residential housing starts: County-wide the total value of new single
family housing starts moved over the past 4 years as follows:
2019 $67.7 million
2018 $62.1 million
2017 $67.1 million
2016 $56.0 million
All Building Activity: The value of all new construction in the County is reported over
the past several years as follows:
2019 $113.4 million
2018 $74.8 million
2017 $135.6 million
2016 $78.1 million
Unemployment in 2019: Reached a high of 4.4% in July and a low of 2.9% in October
and November. Overall, 2019 had an annual adjusted rate of 3.8%. These compare to a state
rate of 4.1% and national rate of 3.7%. However, the Michigan April 2020 unemployment
rate was 23% with 1 million workers filing for unemployment claims. With the April 24,
Executive Order allow some businesses to reopen, we look for the rate to fall going further
into the year.
Equity markets: Market returns in 2019 were extremely good and helped the market
values of both defined benefit trusts. The RHC returned 19.95% and the pension trust
Page 1417.47%. So far in 2020, the pandemic has crushed market returns with the first quarter
performance approximately -16%.
11. The County’s credit rating remains unchanged and strong following Moody’s Investors
Service rating agency upgrading the County’s credit rating for outstanding debt on certain long-
term bonds in February 2017. Moody’s now rates the County at Aa2 and is equal to Standard &
Poor’s AA rating. In May 2019, Standard and Poor’s published its most recent rating analysis to
the County’s credit rating of AA with a long-term outlook of stable. The analysis of the County’s
finances included adequate budget performance with expected break-even or better general fund
operations and strong management conditions with good financial policies and practices.
12. Actual expenditures have consistently been under spent as compared to appropriations over
the last nine (9) budgets. Preliminary results for 2019 continue this trend playing a major role in the
General Fund surplus. The rates of expenditure are as follows:
Year Expenditure Rate Year Expenditure Rate
2019 97.42% 2014 95.27%
2018 95.73% 2013 97.42%
2017 97.42% 2012 96.37%
2016 97.37% 2011 96.22%
2015 96.04%
This trend is reflective of good financial management by all those involved along with effective
cost controls. As we develop the budget, we continue to adjust various line items to be in line with
operating needs of the departments. It is important to emphasize, we have removed margin between
budgeted and actual expenditures making it more difficult to remain within line item appropriations.
Some of the new baseline expenditure savings going forward will be from employee turnover,
although that is slowing. In 2018, we began to capture cost savings when legacy employees on Tier
1 total compensation plans were replaced with Tier 2 employees. Significant percentages of these
savings are redirected to legacy benefit programs to be able to support the financial obligations for
pension and OPEB, specifically the ADC’s.
D. Budget Summary:
Our preliminary projection is that the County remains unable to develop a structurally balanced budget
when we include full amount of the RHC ADC. However, we see positives in the budget due to a
culture of fiscal discipline within the organization. Revenue limitations over time and the slow growth
of revenues since the great recession have required our continued focus on cost control. The
organization has to continue relying on fiscal restraint as a core strategy coupled with strategic
investments in economic development efforts. With the long list of obligations, program funding needs
and basic operational expenses, we do not forecast a scenario where current revenues will meet planned
expenditures with full funding RHC ADC. The ADC shortfall of $2 million is not forecasted to be
made up and we recognize that as not a funding priority given the expenditure trends and results in the
benefit program financials. We have leveraged lower costs and expenses while striving to provide a
level of staffing necessary to meet our menu of public services to the community.
We again note our focus on cost control to be the primary strategy for maintaining financial stability
especially as the pandemic has slowed economic activity and other longer term impacts are expected.
We will need to continue to fill in some underfunded baseline expenditures in areas of the organization
where investments continue to be needed. We will continue to maintain conservative assumptions with
Page 15property tax revenues to err on the side of ensuring sufficient resources to meet budgeted expenditures.
Even with projected increases of property taxes, the 7 year forecast for the budget will not show budget
levels meeting the amount the County had in 2008 until 2024; 16 years later. However, the budgets also
show growing uses of fund balance and substantial reduction in unassigned fund balance to be able
balance budgets in future years. The rate of the use of fund balance and resulting decline in the amount
available is unknown at this time. Much will depend on how much of the County’s reserves will be
needed in 2020 to fill current year revenue reductions and/or cover increased expenditures that have
been needed to adjust to the new practices in operations during the pandemic. That creates the
underlying baseline budget structure and how long reserves may be appropriated used to cover budget
shortfalls.
*Amounts are projected based on 2nd Year Budget Forecast (2021) and summary income statement (2022-2026)
Page 16Below is a condensed summary of a 7-year income statement of the County based on updated
assumptions for expenditures and revenues:
GENERAL FUND
2020 2021 2022 2023 2024 2025 2026
BUDGET FORECAST FORECAST FORECAST FORECAST FORECAST FORECAST
Charges for Service $5,372,175 $ 4,864,175 $ 4,997,344 $ 4,991,488 $ 5,052,624 $ 5,203,013 $ 5,197,721
Fines & Forfeits $ 24,500 $ 16,500 $ 16,808 $ 17,123 $ 17,444 $ 17,773 $ 18,109
Interest $ 295,000 $ 225,000 $ 225,000 $ 225,000 $ 225,000 $ 225,000 $ 225,000
Intergovernmental Revenues $5,752,852 $ 4,537,299 $ 5,038,610 $ 5,263,737 $ 5,336,039 $ 5,193,623 $ 5,118,623
Licenses & Permits $ 255,800 $ 251,800 $ 252,207 $ 252,623 $ 253,048 $ 253,483 $ 253,927
Local Unit Contributions $2,947,752 $ 2,931,095 $ 3,072,145 $ 3,200,014 $ 3,356,054 $ 3,503,499 $ 3,658,921
Other Revenue $ 2,004,640 $ 1,994,609 $ 2,031,925 $ 2,069,630 $ 2,109,641 $ 2,150,597 $ 2,191,918
Taxes (1) $30,491,143 $ 30,884,762 $ 31,301,838 $ 31,926,255 $ 32,487,159 $ 33,136,802 $ 33,799,438
Transfer In $ 373,733 $ 379,244 $ 306,642 $ 315,260 $ 324,386 $ 334,017 $ 343,736
Budgeted Use of fund balance $ - $ - $ - $ - $ - $ - $ -
Grand Total General Fund Revenues $47,517,595 $ 46,084,484 $ 47,242,519 $ 48,261,129 $ 49,161,396 $ 50,017,807 $ 50,807,393
General Fund Expenditure Category 2020 2021 2022 2023 2024 2025 2026
Full Time Wages $15,297,342 $ 15,531,875 $ 15,930,914 $ 16,444,303 $ 16,944,595 $ 17,395,758 $ 17,849,165
Other Pay $ 1,725,132 $ 1,727,071 $ 1,725,551 $ 1,691,310 $ 1,723,622 $ 1,755,932 $ 1,788,875
Fringes $13,962,663 $ 14,763,213 $ 15,625,102 $ 16,568,101 $ 17,572,146 $ 18,608,173 $ 19,707,297
Supplies $ 1,508,581 $ 1,252,752 $ 1,308,872 $ 1,343,987 $ 1,641,489 $ 1,662,218 $ 1,683,436
Services/Other charges $ 3,699,019 $ 3,765,265 $ 3,819,893 $ 3,894,022 $ 3,970,221 $ 4,048,556 $ 4,129,096
Utilities/Maintenance $ 1,387,645 $ 1,385,596 $ 1,414,554 $ 1,446,016 $ 1,478,199 $ 1,511,119 $ 1,544,794
Capital Outlay $ 808,000 $ 472,500 $ 446,500 $ 496,500 $ 446,500 $ 461,500 $ 461,500
Contingency $ 823,925 $ 387,000 $ 415,000 $ 415,000 $ 415,000 $ 415,000 $ 415,000
Other Agencies $ 1,301,572 $ 1,303,313 $ 1,332,852 $ 1,347,490 $ 1,357,231 $ 1,362,076 $ 1,367,028
Transfer Out $ 7,003,716 $ 7,268,392 $ 7,789,188 $ 8,129,138 $ 8,452,139 $ 8,814,928 $ 9,113,160
Grand General Fund Total Expenditures $47,517,595 $ 47,856,977 $ 49,808,425 $ 51,775,868 $ 54,001,142 $ 56,035,260 $ 58,059,352
General Fund Operating Surplus/(Loss) $ - $(1,772,493) $(2,565,906) $(3,514,739) $ (4,839,746) $ (6,017,453) $ (7,251,958)
Beginning Fund Balance $15,202,726 $15,202,726 $13,430,233 $10,864,327 $ 7,349,588 $ 2,509,842 $ (3,507,611)
Ending Fund Balance $15,202,726 $13,430,233 $10,864,327 $ 7,349,588 $ 2,509,842 $ (3,507,611) $(10,759,569)
Unreserved Fund Balance $14,363,017 $12,590,524 $10,024,618 $ 6,509,879 $ 1,670,133 $ (4,347,320) $(11,599,278)
Unreserved Fund Balance as % of 30.23% 26.31% 20.13% 12.57% 3.09% -7.76% -19.98%
Expenditures
(1)Tax Revenues include $350,000 reduction allowance for DTE, 2021-2026
GENERAL FUND AS REPORTED IN CAFR* GASB 54
Non-spendable $ 1,395,516 $ 1,395,516 $ 1,395,516 $ 1,395,516 $1,395,516 $ - $ -
Restricted $ - $ - $ - $ - $ - $ - $ -
Committed $ 973,767 $ 973,767 $ 973,767 $ 973,767 $ 973,767 $ - $ -
Assigned $ 2,647,344 $ 2,647,344 $ 2,647,344 $ 2,647,344 $ 2,647,344 $ - $ -
Unassigned $14,363,017* 12,590,524 $10,024,618 $ 6,509,879 $ 1,670,133 $ 669,307 $(6,582,651)
Total General Fund as reported in CAFR* $19,379,644 $17,607,151 $15,041,245 $11,526,506 $ 6,686,760 $ 669,307 $ (6,582,651)
Includes 2019 preliminary results.
Page 17As work continues on the 2021 budget, a snapshot of key County financial data is provided below with
major revenue and expenditure categories on the pages that follow:
Key Indicator Financial Measure
General Fund current year budget: $47,517,595
2018 over 2019 budget increase 3.42% vs. inflation 2.3%
Full time GF employees: 462
Taxable value (2019): $6,311,157,529
Assessed Value (2019): $7,463,596,352
General Fund Debt obligation as of 1/1/2020: $0
Unfunded liability-Pension Fund @12/31/2018 $83,930,031
Funded Ratio 71.4%
County Employer Portion $64,224,437
County Agency Portion $6,309,704
Pension Trust Market Value Year-end 2019 $213,573,279
Unfunded liability-RHC @12/31/2018 @ 5.5% $74,212,661
Funded Ratio @ 5.5% 44.3%
RHC Trust Market Value Year-end 2018 $74,652,772
County Allocated Market Value $67,784,717
Unassigned Fund Balance @12/31/2019 $14,363,017* (30.22 % of 2020 GF Budget)
(Figure incorporates funds designated in 2019 as supplemental appropriations)
Budget Stabilization Fund @12/31/2019 $2,430,587* (5.11% of 2020 GF Budget)
Credit Rating-Standard & Poor’s Rating Services AA Stable
Moody’s Investor Services Aa2
*Preliminary Subject to Audit
5. REVENUES
A. Equalized Valuation & Property Taxes
Property tax revenues consistently make up approximately 64% of the General Fund’s revenues.
Following adoption of the 2020 budget, we recognized lower property tax revenues from originally
budgeted. This is due to the DTE Monroe Power plant and Republic Waste agreements of taxable
value; the corresponding decrease to the General Fund is $596,000 less than budgeted. We do not yet
have a resolution for the nuclear power plant. In the prior two (2) budgets, we reserved $795,000 and
$900,000 respectively to account for expected property tax revenue losses for both plants. We will be
including additional reserves in ensuing budgets to fully absorb and recognize the loss of the DTE
Monroe Power plant revenue over the 8-year agreement and a contingency for the nuclear plant until
resolved.
Page 18The tracking of Taxable value illustrates a trend of increasing values in the chart that follows. The
unknowns of future personal property losses, new construction gains, MTT appeals (DTE) and future
inflation rates still makes it difficult to project at what rate future taxable value will be in the out years.
However, with the 2021 budget we are projecting an increase of 1.57% and an increase of 1.52% in
2022 for Taxable value. These are revised downward from the prior year budgets based on updated
estimates from Equalization. We incorporate these estimates in the 2021 budget and forecast models.
B. Sources Of County Property Tax Revenue
The County’s top ten (10) taxpayers and their 2019 Taxable Values are outlined below:
TAXPAYER PRODUCT/SERVICE 2019 TAXABLE VALUE
DTE Energy Power Plant/Utility $1,090,863,140
International Trans. Corp. Utility Transmission $ 65,429,373
Republic Services, Inc. Waste Treatment $ 55,318,070
Good Will Co. (Meijer) Retail/Warehouse $ 27,449,258
Consumers Power Utility $ 27,215,376
La-Z-Boy Inc. Furniture $ 23,660,269
Michigan Gas Utility $ 16,114,540
Gerdau MacSteel Steel Processing $ 16,575,290
Global Engine Asset Automotive Plant $ 14,700,848
TGC Dundee Retail $ 10,822,930
TOTAL $1,348,551,435
Total 2019 Equivalent Taxable Value $5,902,841,816
Total Top 10 Taxpayers as a % of 2019 Total Taxable Value 22.85%
Compares to 20.65% in 2018 TV
2019 Taxable Value Breakdown
Page 19Taxable Value Percentage
Class
330,324,189 5.23%
Agricultural
673,586,087 10.67%
Commercial
1,100,050,780 17.43%
Industrial
3,708,405,685 58.76%
Residential
4,526,075 0.07%
Developmental
494,264,713 7.83%
Personal
6,311,157,529 100.00%
Total
2008-2022 Actual and Estimated Property Tax Revenues
YEAR
EST/Actual Property Tax Revenue % Change $ Change
$461,084
2008 $29,580,781 1.58%
2009 $28,522,671 -5.14% ($1,548,640)
2010 $27,267,793 -4.76% ($1,364,207)
2011 $26,778,208 -1.80% ($489,585)
2012 $26,304,143 -1.77% ($474,065)
2013 $26,219,236 -0.32% ($84,907)
Page 202014* $26,158,335 -0.23% ($60,901)
2015 $26,839,265 2.60% $680,930
2016 $26,969,035 0.48% $129,770
2017 $27,532,954 2.09% $563,919
2018 $28,383,616 3.11% $1,131,579
$29,520,450
2019** Budgeted $28,725,450 Net 4.82% $1,372,272
$30,277,165
2020** Budgeted $30,033,000 Net 1.40% $418,903
$30,752,751
2021 Budgeted $30,402,751 Net 1.57% $475,351
$31,220,193
2022 Budgeted $30,870,193 Net 1.52% $467,442
*Tax Revenues reflect payout of Consumers Energy MTT and revised receipt totals
**2019-2020 Tax revenues are estimates based on assumptions
Years 2019-2022 Reflect Budgeted amounts to reserve for DTE MTT Litigation/Adjustment/Refunds; shown as Net amount
In the 2020 budget, original tax revenue estimates were budgeted at $30,933,000 with $900,000 of this
amount reserved for the MTT and DTE appeals. The net amount of property tax revenues used to offset
planned expenditures was $30,033,000. The above table revises the tax revenue to $30,277,165 and this
now incorporates $351,000 of tax revenue loss due to DTE property in the City of Monroe and
Frenchtown Township based on the tentative settlement. It also includes the Republic Waste landfill in
Erie Township based on the parties’ stipulation order reducing tax revenues by $245,000. Both of these
property value reductions ($596,000) are carried forward into the 2021 tax revenue estimates and
beyond.
The estimated 2021 property tax estimate is $30,752,751 and of this amount, $350,000 is reserved to
cover the expected tax appeal resolution for the Fermi plant and other possible MTT settlements. The
amount is being held to make up for future tax revenue losses. This follows prior action and continued
consultation with our auditors to recognize the property tax liability and take prudent action when the
event first occurs to plan for the financial outcome. We have done that with the DTE Monroe Power
plant and additional reserves for other MTT stipulation orders and prevented expenditure of funds that
in whole or in part will require refund or revenues would not be realized.
C. Inmate Dormitory Revenue-(Immigration and Customs Enforcement Detainee Housing)
Since opening the Inmate Dormitory, reimbursement from housing federal detainees has been an
important source of revenue to help offset the total cost of operating and maintaining the facility. The
initial pro forma financial modeling to finance operation of the facility included this source of revenue.
The operations of the facility are recorded in special revenue fund. Revenues generated from inmate
housing operations and are a primary source of the fund’s revenue with fund generated revenue shown
below:
2020: 53.9%
2019: 52%
2018: 54.6%
2017: 54.4%
2016: 52%
Page 21You can also read