2021 The Land National Residential Greenfield and Apartment Market Study March 2021 - SF Capital
←
→
Page content transcription
If your browser does not render page correctly, please read the page content below
UDIA State of
    The Land                    2021
    National Residential Greenfield and Apartment Market Study
                                                   March 2021

1
Montego Hills by Villawood Properties

                         “The economic slowdown from the pandemic was an existential
                            threat to our industry. UDIA National quickly mobilised to
                            engage with the Commonwealth Government and Housing
                            Minister Michael Sukkar on solutions to maintain jobs and
                           activity up and down supply chains. HomeBuilder worked to
                          sustain confidence and construction during the downturn - the
                           property industry and new housing construction will remain
                                         central to the ongoing recovery.”
                                          - Simon Basheer, UDIA National President

                                                              2021 STATE OF THE LAND SPONSOR

                                             2021 STATE OF THE LAND RESEARCH PARTNERS
  Front cover images:
  Emerson Edition by Azure
  Essence Clarement by Blackburn
  One Bulimba Riverfront by Velocity
  Property Group
  Le Bain by Cavcorp
  Montego Hills by Villawood Properties
   1
Welcome to 2021 annual State of the Land report
                          The Urban Development Institute of Australia (UDIA) State of the Land
                          report is invaluable as the industry’s most comprehensive overview of
                          new home markets across our capital cities.
                          It is even more important, as we continue to feel the economic
                          disruption caused by the COVID-19 pandemic and begin to chart the
                          path to recovery – both as a nation, and an industry.
                          New home construction delivers jobs, wages, prosperity and activity
        Simon Basheer     up and down supply chains. Our central role in the national economy
                          – with direct and indirect output generating more than $300 billion
        UDIA National     in economic activity, or 7.5 percent of the national economy – was
        President         reinforced over the past year.
                          Our industry has been pivotal to sustaining economic momentum
                          through the downturn and in doing so, provided a pathway into home
                          ownership for tens of thousands of Australians.
                          That is made clear by the data in State of the Land. After a significant
                          slump as the pandemic first arrived, land sales surged – partly due
                          record low interest rates and HomeBuilder stimulus, and partly due to
                          pent up demand stored across our capital cities.
                          In fact, land sales reached record highs by the September 2020 quarter.
                          Monthly land sales hit 5,200 per month – surpassing a prior record of
                          approximately 4,700 per month set in June 2017.
                          We also witnessed a major surge in regional markets, reflecting a shift in
                          the way we lived and worked during the pandemic. The question now is
                          whether this is an embedded structural change.
                          For all the good news, and the prospects of strong activity well into
                          2021, the question remains: do development pipelines, land sales and
                          pricing soften as we resume the road back to normality.
                          As outlined later in this document, UDIA National’s advocacy efforts are
                          firmly aimed at working with governments to boost supply pipelines,
                          break the back of planning and tax barriers, restart overseas migration
                          and ensure a balanced approach to supply and demand.
                          That is the ultimate key to improving affordability and giving more
                          Australians the chance to fulfil home ownership aspirations.
                          Producing these reports takes the time, commitment and collaboration
                          of our partners. Research4 and CoreLogic serve as our research partners
                          and deserve credit for the quality and comprehensive nature of their
                          work. I’d also like to commend the endeavours of the team at UDIA
                          whom manage the project.
                          We hope you find it a valued resource and look forward to continue to
                          work with you on critical issues facing the industry in the year ahead.

                                                                                                       2
Bushmead by Cedar Woods
THE YEAR THAT WAS
    COVID-19 forced transformation, in ways large and small, on everyone in the industry in
    2020. From the way we conducted our daily lives to the way we worked on construction
    sites, in sales centres, and in all of our businesses, everything shifted.
    Across the organisation, from our UDIA National Council to our State CEOs, we
    dramatically switched our focus to one that sustained the industry through the economic
    downturn and positioned housing as central to the nation’s recovery.
    It was clear post the declaration of the pandemic that the residential construction sector
    needed to move quickly to stimulate demand and to generate immediate activity. Our
    industry was at a critical junction where the jobs of hundreds of thousands of people right
    up and down the supply chain were at risk.
    That is why UDIA National developed practical and implementable policy
    recommendations for the Federal Government and released our “Helping Australia
    Bounce Back” and “Plan for Economic Revival” policy documents throughout the year.
    UDIA had a significant influence in the formulation and implementation of the
    HomeBuilder program launched by Government in June and its extension later in the year
    to provide even more support for our industry.
    One thing is clear – we have consistently reinforced, and the results are now clear for
    everyone to see, that housing construction is an indispensable pillar of the nation’s
    economy.
    The stellar success of the HomeBuilder program reaffirms the importance of the housing
    and construction sectors to the nation’s health and prosperity.
    Against an original estimate of 27,000 homes, more than 85,000 applications have been
    received to date – with 80 percent for the construction of new housing. The figures is
    translating to a mammoth surge in jobs, wages and activity across supply chains.
    We know however that housing markets remain sensitive to the pace of recovery and will
    keep working with the Federal Government, the Assistant Treasurer and Housing Minister,
    Michael Sukkar, and his office.
    Our work on HomeBuilder was matched by consistent engagement with the Independent
    Review into the Environment Protection and Biodiversity Conservation (EPBC). Meetings
    with Environment Minister Sussan Ley, Minister Assisting the Prime Minister Ben Morton,
    and other critical stakeholders meant we’ve been able to give clear voice to the industry’s
    priorities.
    The Government has so far been receptive to our issues and our hope is that they remain
    so as they move into a phase of designing and implementing the reform process.
    UDIA National’s advocacy agenda has been mirrored in our state divisions, from dealing
    with the challenges of lockdowns of varying degrees to cultivating swift policy reforms to
    boost recovery.
    I thank the entire National Council, our superb team of State CEOs and their staff and
    of course our broader membership, who’ve been loyal during a tough year and deeply
    engaged in providing insights and resources to bolster our work.

    Simon Basheer, UDIA National President

3
WEST by Commercial & General

                                          CONTENTS
                               National Residential Market Overview    7
                               South East Queensland                  25
                               Sydney                                 35
                               Melbourne                              45
                               Adelaide                               55
                               Perth                                  65
                               ACT                                    75

                                                                           4
UDIA State of the Land 2021
Greenfield Summary
NEW RELEASES (2020) Annual Change
NATIONAL ANNUAL LOT SALES TRADING MONTHS OF STOCK (as at Q4 2020)
SEQ 12,430 43%
2020
SEQ 1.2
SYD 8,280 52% SYD 0.6
2019 53,760 MEL 2.1
MEL 17,400 45%
28,770
ADE 2.3
3,340
2018
ADL 30%
PER 3.4
PER 10,870 56% 39,430 ACT 1.5
ACT 2,490 57%
COMBINED CAPITAL CITIES ANNUAL MEDIAN LOT SIZE (sqm) MEDIAN LOT PRICES (2019 v 2020)
519 505 498 500 493 472 2019
451 $478K
428 428 417 421 420 $459K 2020 $423K
$417K
$330K
$319K
$270K
$261K
$217K
$183K $215K
$179K
2009 2010 2011 2012 2013 2014 2015 2016 2017 2018 2019 2020 SEQ SYD MEL ADE PER ACT
Multi-Unit Summary
NEW UNIT COMPLETIONS (2020) Annual Change
ANNUAL NEW UNIT SALES (NAT) UNITS PIPELINE (as at Q4 2019)
SEQ 9,530 28%
2020
9k 23k 6k
SEQ
SYD 23,390 15%
19,860 58k 67k 35k
SYD
46k 50k 30k
MEL 20,580 MEL
2019
7%
2018
3k 4k 2k
ADL 2,160 38% 20,980 SA
13k 10k 4k
PER 2,830 35%
21,650 WA Early Planning
12k 5k 6k
Approved
ACT Under Construction
ACT 2,030 19%
ANNUAL NATIONAL NEW UNIT COMPLETIONS MEDIAN SALE PRICE OF NEW UNITS (2019 v 2020)
85K
77K $721K 2019
75K 73K $717K
$630K 2020
64K $615K
61K
$491K
51K $481K $489K
$461K $450K
43K $412K $401K
$390K
5 2013 2014 2015 2016 2017 2018 2019 2020 SEQ SYD MEL SA WA ACT
UDIA State of the Land 2021
Capital City Market Performance Dashboard – Annual Change (2019 – 2020)
                             Greater    Greater    Greater    Greater
                     SEQ                                                  ACT
                             Sydney    Melbourne   Adelaide    Perth

                    -23%     -17%        -20%       -24%      -20%        -4%
    Total New
    Dwellings

                     65%      88%        83%        83%       128%        101%
  Greenfield Lot
      Sales

                                                                                      Greenfield Market
                     43%      52%        45%         30%       56%        57%
 Greenfield Lot
   Releases

                     -4%      4%          -3%        2%        -1%        -1%
  Greenfield
Median Lot Price

                    415sqm   372sqm     390sqm     459sqm     375sqm      507qm
 Greenfield
Median Lot Size

                     8%        -2%       -20%        -10%      13%        21%
 Multi-Unit Sales

                                                                                      Multi-Unit | Infill Market
 Volume (New)

                     -28%     -15%        -7%        38%       35%        -19%
    Multi-Unit
   Completions

                     4%        1%         2%          9%        3%         0%
Multi-Unit Median
 Sale Price (New)

                     -8%      -11%        -8%        -10%       -9%        -4%
     Under
  Construction

                                                                                  6
NATIONAL RESIDENTIAL
       MARKET OVERVIEW
       The national development industry experienced a dramatic year that will be etched into the history books
       for many reasons. While the COVID-19 pandemic inflicted severe economic impacts on certain parts of the
       economy, the property market has held up resiliently, to the extent that there have been record levels of
       land lot sales activity across the second half of the year.
       National Greenfield Performance Snapshot
       •   Across Australia the greenfield development sector moved to full capacity in 2020 with a 100%
           upswing in sales in the September and December quarters from the ‘pre-COVID’ trading period.
       •   This produced the highest two quarters of lot sales in Research4’s National Land Survey history since
           2009, with a record 691 residential projects registering lot sales in the September 2020 quarter alone.
       •   The surge in demand for new land underpinned a 7.1 percent increase in the national media lot price
           to $314,660 between June and December.
       •   The national greenfield lot clearance rate was 105% for the December quarter, with sales exceeding
           releases by 5% (taking into account carry-in unsold stock into the quarter). Over the three quarters
           since March 2020, the clearance rate has averaged 102% (inclusive of carry in stock), which has
           resulted in the stock ready for sale drop away by 39%, with current stock levels now equal to only 1.7
           months worth of trading.
       •   UDIA estimates that there were approximately 44,880 completions of detached houses in the nation’s
           greenfield release areas in 2020 which represented 30% annual growth on 2019.
       National Multi-Unit Performance Snapshot
       •   The national new-build multi-unit apartment sector experienced a more subdued 2020 than
           greenfield release areas, with settled sales for new apartments and townhouses down 6% on 2019
           and 50% below the decade average.
       •   Momentum has continued to unwind in the new multi-unit sector with total sales across the
           combined capital cities totalling just 19,860 in 2020, down 70% from peak sales volumes in mid-2015.
       •   Pricing for new apartments grew 2.9% across the combined capital cities to a median sale price of
           $529,000.
       •   Underpinning the weak new multi-unit sales performance has been the on-going retreat of investors,
           however the second half of 2020 saw modestly heightened levels of sales transactions and unit value
           growth stemming from an uptick in consumer sentiment and record low interest rates.

 7
Amberton Beach Coastal Precinct by Stockland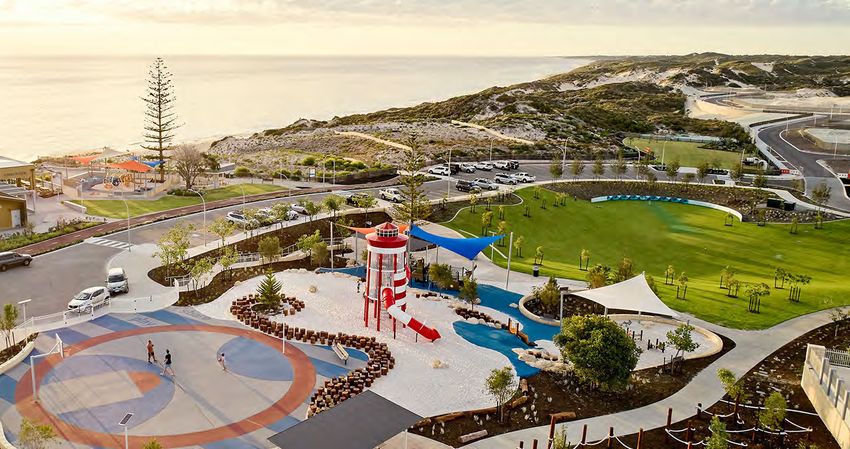
GREENFIELD MARKET ANALYSIS
The National Land Survey (NLS) undertaken by Research4 provides the core market intelligence underpinning
the State of the Land's greenfield market analysis. The following points highlight the key capital city
comparative headline trends for 2020.

Lot Releases
 •   National residential annual lot releases                  •    Sydney also recorded a major uptick in output
     increased by 47% in 2020, with a total of                      up 52% with 8,280 lots released to market
     54,860 lots released across the capital city                   across the year with further production limited
     markets.                                                       by industry capacity and supply availability
                                                                    rather than demand.
 •   Melbourne reasserted its prominent role as
     the nation’s largest greenfield market with a             •    Adelaide's developers released 30% more
     total release to market of 17,400, lots across                 lots in 2020, with a total of 3,400 released to
     the year, up 45% from 2019 and 18% on the                      the market equating to 52% higher than the
     decade average.                                                decade average.
 •   SEQ recorded a 43% uplift in lot releases in              •    The ACT also enjoyed a bumper year with a
     2020 with a total of 12,430 lots released, to                  57% uplift in lot release activity with 2,490
     comfortably retain the mantle of the second                    lots released to market, which represents a
     largest greenfield market in the country. This                 record supply level across the 12-year reporting
     was 41% above the decade average.                              timeframe of the Survey.
 •   The Perth greenfield market roared back to life
     in 2020 with a 56% lift in lot production to total
     10,870 lots which was 27% higher than the
     decade average.

      Annual lots Released
        25,000

        20,000

        15,000

        10,000

         5,000

              0
                    2011        2012   2013     2014    2015       2016    2017     2018     2019    2020

                                 SEQ      SYD          MEL         ADE        PER          ACT

      Source: UDIA; Research4

                                                                                                                       8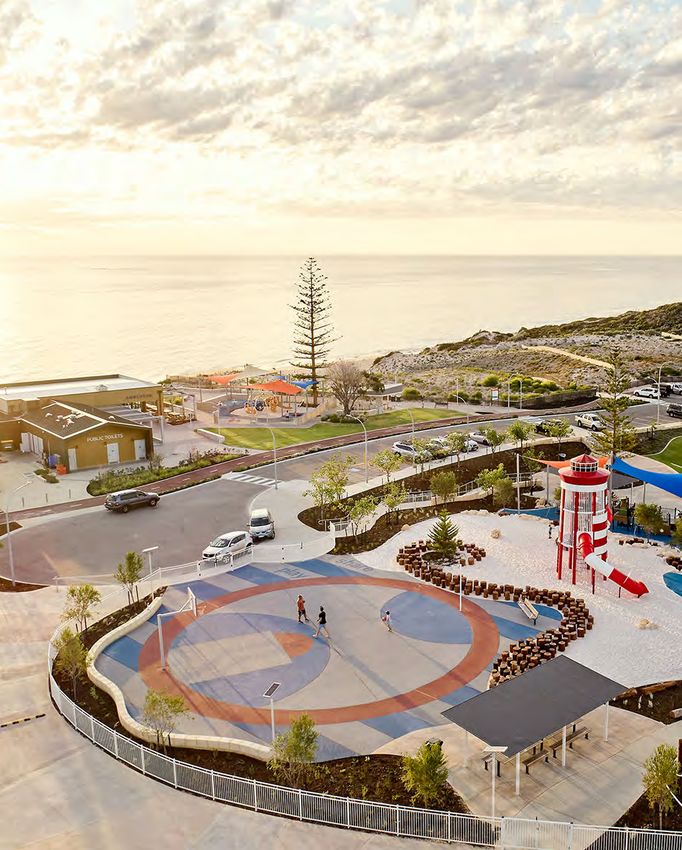
Lot Prices ($)
    While lot production and sales lifted dramatically            • SEQ recorded a 4% annual price decline to
    across the second half of the year, median lot                $260,500. At this median price-point level SEQ
    pricing flat-lined or retracted modestly across many          continues to hold an affordability advantage
    of the nation’s greenfield markets in 2020.                   over the other two major east coast housing
                                                                  markets, being 45% cheaper than Sydney and
        • The most expensive greenfield market,                   18% cheaper than Melbourne.
        Sydney, recorded a 4% increase in median
        pricing in 2020 with a year-end lot price of              • Perth’s median lot pricing retracted a
        $477,750. This median lot pricing increase was            modest 1% to $215,000 (which was the sixth
        largely driven by a spike in December quarter             straight year of price reduction) and the ACT
        pricing to $495,000 a lot.                                also saw median pricing retract by 1% to
                                                                  $416,000.
        • For the second consecutive year Melbourne
        recorded an annual decrease in median lot                 • Adelaide recorded a 2% annual price
        pricing, dropping by 3%, to finish the year at            increase in 2020 to $183,460 and remains
        $319,000.                                                 Australia’s most affordable market by some
                                                                  margin.
         Median Lot Price
           $600,000

           $500,000

           $400,000

           $300,000

           $200,000

           $100,000

                  $0
                           2013      2014     2015       2016      2017       2018      2019       2020

                                   SEQ      SYD       MEL         ADE        PER        ACT

         Source: UDIA; Research4

    Land Price ($/sqm)
    The reduction in lot prices coupled with the minimal rise in lot sizing has delivered further slight decreases
    in the price of land on a per square metre basis across most markets.
    •   Sydney's land price was the only city to record substantive growth with a 6% increase to $1,285 per
        sqm.
    •   Melbourne’s land price declined 2% in 2020 to $819 per sqm.
    •   ACT recorded an 4% reduction in land price to $822 per sqm.
    •   SEQ recorded 1% growth in land pricing to $628 per sqm.
    •   Perth's land price retracted by 1% to $573 per sqm.
    •   Adelaide recorded a no change to the metropolitan land rate which remains at $400 per sqm.

9
NATIONAL RESIDENTIAL
MARKET OVERVIEW
Median Land Price
$1,400
$1,200
$1,000
$800
$600
$400
$200
$0
2013 2014 2015 2016 2017 2018 2019 2020
SEQ SYD MEL ADE PER ACT
Source: UDIA; Research4
Lot Sizes (sqm)
• The trend of declining lot sizes highlighted in previous State of the Land reports has continued in 2020
on the large east coast capitals but held steady for the smaller cities.
• The median lot size for SEQ dropped 5% to 415 sqm, while Sydney’s dropped 2% to 372 sqm, which
now makes Sydney’s median lot size the smallest in Australia for the first time in Survey reporting over
twelve years.
• The largest median lot sizes are still found in the nation’s capital with the ACT recording a 3% increase in
lot sizing to finish 2020 at 507 sqm, the largest the median lot size has been in the nation’s capital since
2015.
Median Lot Size
600
550
500
450
400
350
300
2013 2014 2015 2016 2017 2018 2019 2020
SEQ SYD MEL ADE PER ACT
Source: UDIA; Research4
10NATIONAL RESIDENTIAL
MARKET OVERVIEW
MULTI-UNIT MARKET ANALYSIS
CoreLogic is once again this year’s State of the Land exclusive provider of apartment and multi-unit data and
intelligence.
The term 'multi-unit' in this report refers to the following residential typologies: apartments/flats/units/row/
terrace/townhouse. Other categories of multi-unit development including aged care/retirement and student
housing is excluded from the analysis.
New Multi-Unit Unit Sales Activity New Multi-Unit Pricing
• Multi-unit sales volumes of new supply • Sydney recorded a 0.6% annual growth of new
remained subdued across the capital cities in unit pricing across 2020 to $721,350, which is
2020. 36% more expensive than the combined capital
city new unit average of $529,600.
• Sydney new unit sales transactions for 2020
were down 45% on the decade average to • Melbourne recorded 2.4% annual price growth
9,390 sales and maintains the soft volumes in 2020 to record a new unit median price of
consistently recorded since the September $630,000, which was 13% cheaper than Sydney
quarter 2018. and 19% above the combined capital city
average.
• Melbourne's annual new multi-unit settled
sales annual volumes dropped 20% across the • SEQ new unit prices rose by 1% over the year,
year to 4,780 sales, which is 60% below the recording a median new unit sale price of
decade average yearly sales. $459,975.
• SEQ recorded another soft year in new • Perth’s new units recorded 2.9% pricing growth
apartment transactions with just 1,035 settled across 2020 to finish the year at $401,210,
sales for the year, down 2% on 2019 volumes which still reflects a 16% reduction of median
and down 80% from the decade average. new unit stock pricing achieved in the peak of
2014.
• Perth’s multi-unit sector experienced an uptick
in sales in the September quarter reflecting • ACT unit pricing flat-lined across the year to
broader housing market momentum, to record remain at $490,580, which is now 7% lower
1,940 sales for 2020, 13% growth on 2019 but than the combined capital city average median
still 8% below the decade average. pricing.
• Adelaide’s new multi-unit market recorded • Adelaide's new unit pricing recorded a 9.2%
1,775 sales across 2020, 19% higher than the increase in 2020 to $450,100, which is the
decade average, however down 10% on 2019 highest capital city growth rate achieved across
volumes. the year.
• ACT multi-unit sales remained low at just 360
annual settled sales which is 71% lower than
the decade average.
g An
d Pin
an
ac
Mirv
e by
a r
u
11 s Sq
ard
Leon
StAnnual Median New Multi-Unit Sale Price
$850,000
$750,000
$650,000
$550,000
$450,000
$350,000
$250,000
2010 2011 2012 2013 2014 2015 2016 2017 2018 2019 2020 2021
SEQ SYD MEL SA WA ACT
Source: UDIA; CoreLogic
Annual Median New Multi-Unit Sales Volumes
30,000
25,000
20,000
15,000
10,000
5,000
0
2010 2011 2012 2013 2014 2015 2016 2017 2018 2019 2020 2021
SEQ SYD MEL SA WA ACT
Source: UDIA; CoreLogic
12Construction Activity
• There was a 18% annual contraction in total multi-unit dwelling completions in 2020 across the
combined capital cities, with a total supply yield of 60,520 units. This quantum of new build apartment
and townhouse supply is down 28% on the peak supply achieved in 2017.
• Sydney recorded 40% of the capital city apartment completions in 2020, however annual volumes
dropped 15% to total 23,390 units, which is 26% below the peak supply achieved in 2018.
• Melbourne remained the other focal point for new multi-units with 20,580 completed in 2020,
reflecting 36% of new capital city supply. Annual completions dropped by 7% on 2019, and 30% on the
peak achieved in 2017.
• SEQ registered 9,350 new unit completions in 2020 which was down 28% from 2019 and 40% below the
peak of 2017.
• Perth’s new multi-unit completions plummeted 35% across the year to 2,830 units which the lowest
volume of new units completed since 2013.
• Adelaide’s multi-unit annual completions fell 38% in 2020 to 2,160, with the ACT also producing a
similar new supply quantum of 2,025.
Annual Median New Multi-Unit Completions
35,000
30,000
25,000
20,000
15,000
10,000
5,000
0
2013 2014 2015 2016 2017 2018 2019 2020
SEQ Syd Melb SA WA ACT
Source: UDIA; CoreLogic
13NATIONAL RESIDENTIAL
MARKET OVERVIEW
Multi-Unit Pipeline Analysis
CoreLogic has produced point-in-time estimates of the multi-unit pipeline based on a December 2020 and
December 2019 snapshot of the market leading Cordell Construction database.
Key Findings
• The forward pipeline for new multi-unit supply (comprising units in the ‘Under Construction’, ‘Approved’
and ‘Early Planning’ categories) across the combined capital cities reduced by 6% across the year, with
pipeline contraction recorded in every city except the ACT.
• The large east coast markets experienced the largest reductions of forward pipeline supply, led by
Sydney down 7% and Melbourne down 4%. Sydney and Melbourne are the nation's key apartment
markets (holding 75% of new supply), with further erosion on forward pipeline supply maintaining the
concerning trend identified in last year's State of the Land report.
• The SEQ pipeline contracted by 5% across the year led by a 10% decrease of units in ‘Early Planning’ and
an 8% decrease of units under construction.
• The on-going weakness in the Perth multi-unit sector was reflected in a 17% decrease in pipeline
volume, while the Adelaide pipeline decreased by 12% over the year.
Capital Cities Multi-Unit Pipeline by Status
End of 2019
ACT
End of 2020
End of 2019
PER
End of 2020
End of 2019
ADE
End of 2020
End of 2019
MEL
End of 2020
End of 2019
SYD
End of 2020
End of 2019
BRI
End of 2020
-50,000 0 50,000 100,000 150,000 200,000
Abandoned Deferred Early Planning Approved Under Construction
Source: UDIA; CoreLogic
14NATIONAL RESIDENTIAL
MARKET OVERVIEW
THE ECONOMIC STATE OF PLAY
Five big factors are currently shaping housing markets and will shape their
fortunes for the next few years.
Population
• Population growth is the primary driver of demand for new dwellings in Australia, with net overseas
migration (NOM) accounting for 56% of demand.
• The closure of Australia’s international borders in March has exposed capital city housing markets to a
unique and re-set demand profile for new residential products.
• The Australian Centre for Population released forward population growth scenarios in December 2020
highlighting a potential 96% reduction of population growth under a ‘central forecast scenario’ across
the capital cities over the coming five years, with Sydney (-258,000 fewer people) and Melbourne
(-308,000 fewer people) being the cities expected to be most heavily impacted from COVID-19 from a
growth perspective.
Population Growth Projections by Capital City, FY20-FY25
700,000
600,000
500,000
400,000
300,000
200,000
100,000
-
Sydney Melbourne Brisbane Perth Adelaide ACT Darwin
Additional Pre-Covid Scenario Growth FY20-FY25 Central Scenario Growth FY20-FY25
Source: Centre for Population 2020, Population Statement: Capital city and balance of state (GCCSA) Population
Projections, 2019-20 to 2030-31, the Australian Government, Canberra (December 2020 release)
Housing Finance
• Record low lending rates for home purchasers has been a major supportive factor to on-going
housing demand across 2020. According to CoreLogic research, average dwelling lending rates
have declined 65 basis points for owner-occupiers, and 70 basis points for investors in the year to
November 2020.
• First Home Buyers have been taking advantage of the recent softness in dwelling prices, low
interest rates and government stimulus, and accounted for more than 40% of total new housing
loans across 2020, 10% higher than the long-term average.
15Australian Cash Rate Target Rolling Annual Number of Loan
16%
Commitments by Purchaser Class
14% 350,000
12% 300,000 255K
250,000
10%
200,000
8% 131K
150,000
6% 100,000
4.56% (30yr avg)
121K
4% 50,000
3.70% (20yr avg)
0
2% 2.21% (10yr avg)
2016 2017 2018 2019 2020
0% 0.10%
Investors Owner Occupiers First Home Buyers
Source: UDIA; RBA Source: UDIA; ABS
First home buyers have swelled as a proportion of purchasers, in addition to some
signs of recovery among investors in the latter half of 2020. Both groups will be
crucial to kick-starting the apartment market, which needs to be revived in time to
accommodate the return of immigration expected in 2022.
Employment Unemployment and
• Economic conditions and the state of the Underemployment Rates, Australia
job market are cornerstone drivers to new
14%
housing demand. Underemployment
13%
• After the initial COVID shocks in March and 12%
April, labour markets held up remarkably 11%
well across 2020 with unemployment and 10%
underemployment as at December only 9%
0.3% and 1% above the decade averages. 10y avg 8.2%
8% 8.1%
• The RBA’s February 2021 Economic 7% Unemployment
6.4%
Outlook provided upgraded and improved 6% 10y avg
5.6%
forecasts for GDP and employment growth, 5%
which are both expected to reach their 4%
pre-pandemic levels over the course of
2021, 6-12 months earlier than previously
expected.
Source: UDIA; ABS
Housing stimulus measures such as HomeBuilder were crucial to sustaining Australia’s
economy through 2020 and will remain so well into 2021. UDIA National continues
to work with governments on measures to boost supply to support demand and
employment into 2021 and beyond.
16Housing Affordability
• The National Housing Finance Investment Corporation’s (NHFIC) State of the Nation’s Housing report
articulates the crux of Australia’s housing affordability crisis:
“Over the past 15 years, new housing constructed in cities like Sydney has typically fallen
well short of agreed housing targets, which has helped exacerbate affordability problems,
and reflects the challenges of building enough homes in areas of need.”
• The long-run deterioration of housing affordability in our largest population centres relates to
substantial increases in dwelling values, while wage growth has been relatively benign.
• There are a host of drivers underpinning house price growth including the inability of supply to
adequately match the year-on-year demand profile. Another major factor is the on-going increase of
government taxes and charges on development, which ultimately flows to retail pricing.
Australia remains one of the least affordable housing markets in the world.
Measures to boost affordability by turbocharging supply and reducing costs
induced by planning and tax impositions needs to be a major focus for all levels of
government.
Housing Affordabilty Measures (as of December 2020)
% of
Years of household % of household household
Median income required income required income
Dwelling Dwelling Value for a 20% deposit to service an 80% required to
Value to Income Ratio on a dwelling LVR mortgage rent a home
Brisbane $521,686 6.2 8 24% 25%
Sydney $871,749 9.6 13 37% 29%
Melbourne $682,197 7.7 10 30% 25%
Adelaide $468,544 5.9 8 23% 24%
Perth $471,310 4.9 7 19% 20%
ACT $678,765 7.6 10 30% 30%
Source: UDIA; ABS; CoreLogic
• Housing affordability remains a critical industry and societal issue with Australia having some of the
most unaffordable capital city housing markets in the world, with average household debt also amongst
the highest in OECD countries.
• Housing affordability, as measured by a ratio of median house value to median income value, remained
relatively stable in Sydney (x9.6) and Melbourne (x7.7) in the year to June 2020.
• A modest deterioration of affordability was recorded in Brisbane (up to x6.2), Adelaide (up to x5.9) and
Perth (up to x4.9), while the ACT recorded a significant worsening in affordabilty to x7.6) as established
home values grew strongly across the year outpacing household income growth.
• There are a host of drivers underpinning house price growth, which include the high rates of population
growth coupled with a generally insufficient supply response. Another key factor is the on-going
increase in government taxes and charges on development, which ultimately flow through to retail
pricing and end consumer housing affordability.
17NATIONAL RESIDENTIAL
MARKET OVERVIEW
Capital City Dwelling Price to Income Ratios
9.6 9.6
7.8 7.7 7.6
6.0 6.2 5.9 6.4
5.5
4.7 4.9
Brisbane Sydney Melbourne Adelaide Perth ACT
2019 2020
Source: UDIA; ABS; CoreLogic
Dwelling Demand and Forward Pipeline
• Forward dwelling demand is expected to reduce significantly over this year and next due to the tapering
of fiscal stimulus and the likelihood of on-going restrictions to overseas migration. NHFIC predict new
demand for housing to fall by a total of 286,000 dwellings over the next 5 years relative to the pre-crisis
outlook.
• Driven by the sharp falls in net overseas migration (NOM), demand for new housing will likely fall from
pre-COVID forecast levels of 2021 and 2022 of 176,300 and 186,900 dwellings respectively (nationwide)
to drop 69% to 54,200 in 2021 and 51% to 91,600 in 2022.
• The NHFIC projections then foreshadow demand picking back up to 141,700 dwellings in 2023 on the
back of a strengthening economy and positive NOM, and then move back to close the pre-COVID levels
of around 178,800 dwellings in 2024.
Major imbalances between supply and demand that have bedevilled Australia’s
housing markets for decades remain a real risk. Transparency and accountability
is needed by the Federal Government and States for their performance in running
efficient planning systems to assist in supply delivery.
Demand by Dwelling Type, Australia
140,000
120,000
100,000
80,000
60,000
40,000
20,000
-
2019 2020 2021 2022 2023 2024 2025
Detached Medium Density Apartment
Source: NHFIC
18NATIONAL RESIDENTIAL
MARKET OVERVIEW
Dwelling Pipeline Outlook, Combined Capitals
160,000
140,000
120,000
100,000
80,000
60,000
40,000
20,000
0
2013 2014 2015 2016 2017 2018 2019 2020 2021* 2022* 2023*
Greenfield Housing Completions Multi-Unit Completions Total
Source: UDIA; ABS; CoreLogic; Research4
• UDIA modelling of current & forward pipeline activity[1] indicates that there will be a modest aggregate
lift in combined capital city new residential market supply to be delivered in 2021 to total 100,160
dwellings, which is up 6.7% on the completions achieved in 2020.
• This forecast volume in 2021 from across both greenfield corridors and multi-unit and infill completions
will be 15% below the output achieved in 2019 and 26% below the peak supply delivered in 2017.
• The strong greenfield sales activity rebound in 2020 will help to counter-balance the soft sales achieved
in 2019, with forward completions in 2021 and 2022 expected to be maintain at around 40,000 new
detached homes per year, which is in line with the decade average annual volumes.
• The multi-unit pipeline is at risk of retracting significantly post 2022 with many projects currently under
construction not being replaced due to the significant reduction in market demand both pre-COVID and
escalating through the post-March 2020 period.
• In summary, the current market momentum, helped by HomeBuilder, has helped ensure there remains
a strong level of detached housing construction activity in the pipeline going into 2021.
Australia remains one of the least affordable housing markets in the world.
Measures to boost affordability by turbocharging supply and reducing costs
induced by planning and tax impositions needs to be a major focus for all levels of
government.
[1] This includes annual estimations of detached houses being completed in greenfield release areas, and multi-
unit projects being completed across each of Australia’s major metropolitan regions. There are additional dwelling
completions which are not covered under State of the Land reporting including small scale infill subdivisions and
secondary/knock down rebuild dwellings. As such the combined new market supply estimates are likely lower than
actual realised new supply.
19Capital City New Dwelling Supply Annual Growth Forecasts, 2021 to 2023
• Sydney: the forward dwelling completion outlook continues to weaken, driven by an on-going retraction
of multi-unit supply. Despite robust demand, Sydney’s greenfield sector is hampered by supply
constraints related to rezoning and a paucity of land release corridors.
• Melbourne: will remain the largest new home market in the country over the next three years, however
the continued unwinding of momentum in the multi-unit sector will drag on overall residential product
completion volumes.
• SEQ: The current momentum in the new home market will flow through to near record greenfield
completions in 2021 before moderating in the following two years. Multi-unit completions will continue
to retract to record series lows in 2022 and 2023.
• Perth: The pull forward of demand for detached houses in 2020 will help balance out the low sales
achieved in 2019, and sets up greenfield supply to deliver at around the long term average over the
coming three years. Completions of multi-units will remain subdued over the coming term.
• Adelaide: Greenfield house completions are set to break a series record in 2021 with elevated supply
also forecast for the following two years. Higher than average annual volumes of multi-unit completions
are also expected through to 2023.
• ACT: Record levels of new market supply is expected in 2021 which will also flow into elevated new
residential product volumes completing construction in the following two years. While greenfield
release areas will supply the majority of new homes, the local apartment market pipeline will also
contribute at elevated levels over the coming years to 2023.
If additional government action is taken in rezoning greenfield sites in key markets
we would expect heightened greenfield activity to continue, which is needed given
the weak outlook for the apartment market. The retracting apartment supply
pipeline is a major concern, with the return of overseas migration and overseas
students likely in late 2021/early 2022 set to place considerable demand pressure
on the apartment sector in the near term.
Dwelling Pipeline Outlook by Capital City
35,000
30,000
25,000
20,000
15,000
10,000
5,000
0
2020
2021*
2022*
2023*
2020
2021*
2022*
2023*
2020
2021*
2022*
2023*
2020
2021*
2022*
2023*
2020
2021*
2022*
2023*
2020
2021*
2022*
2023*
SEQ SYD MEL ADE PER ACT
Greenfield Housing Completions Multi-Unit Completions
Source: UDIA; ABS; CoreLogic; Research4
20RESEARCH PARTNER: CORELOGIC
NATIONAL SUMMARY & OUTLOOK 2021
The overall outlook for housing values and transaction activity across the
capital cities is to remain elevated in 2021, though affordability constraints
may start to slow the momentum of growth late in the year. There are also
risks for part of the market as JobSeeker supplements come to an end, and
the number of dwellings under construction remains elevated. The positive
outlook for housing assumes there are no major economic shocks over the
year, and COVID-19 remains well contained across Australia.
Eliza Owen
Head of
Australian • Australian housing values have been resilient through 2020, despite a sharp
Research, economic downturn brought about by the response to the global pandemic.
CoreLogic Over the year to January 2021, Australian housing values increased 3%, taking
the value of the housing market to a new record high.
• Resilience in the Australian housing market has been the result of a combination
of factors. These include accommodative monetary and fiscal policy, various
state and federal government incentives targeted specifically at housing,
and a quicker than expected economic recovery. In internal migration terms,
departures slowed in many parts of the country, which has contributed to low
stock levels, and added to the upward pressure in prices.
• Smaller capital cities and regional markets outperformed over the year,
as Sydney and Melbourne markets saw dampened demand from closed
international borders. Melbourne values and sales volumes have been
particularly affected by extended social distancing restrictions through the
September quarter.
• A major trend of market dynamics over the year was the prominence of owner
occupiers, and a continued rise in first home buyer participation. In 2020, ABS
housing finance data suggests that 75% of housing finance for the purchase
of property, and 23% of finance was lent to first home buyers. However, given
the sensitivity of first home buyer participation to government incentives, it is
expected first home buyer activity may taper as HomeBuilder finishes in March,
and additional stamp duty concessions wind down in NSW later in the year.
• Another apparent trend in 2020 was the general preference for houses over
units. In the year to January, CoreLogic estimates that there were 459,308
properties transacted across Australia, 74% of which were houses. This is
higher than the decade average, where houses made up 70% of dwelling sales
nationally.
• Dwelling approvals data from the ABS shows approvals for the construction of
new houses increased 14% in the 12 months to January, compared with a 9% fall
across units approvals. Regions with larger typical land sizes have also tended to
see higher growth rates over the year to January.
• Detached houses are expected to remain in high demand over units in 2021, and
will likely exhibit higher capital growth increases than units.
2122 Halycon Greens by Halycon
OUR FOCUS FOR THE YEAR AHEAD
     Australia’s response to the pandemic has been                 UDIA National understands health protocols will
     stellar. Compared to international peers, our health          always govern the precise timing and pace for a
     response was the gold standard and along the way,             return to business-as-usual immigration levels.
     we have been able to navigate deep economic
     challenges.                                                   Restart International Migration

     That is not to minimise the impact of COVID-19 on             There is no escaping the fact though that
     either front. Every loss of life is devastating, and          Australia is a nation that depends on net overseas
     there have been real and lasting economic effects.            migration and population growth for so much of
                                                                   its productivity, wealth and economic momentum.
     UDIA National was swift to recognise these risks              The Government’s own analysis supports this. A
     and swung our advocacy endeavours towards                     report published by Treasury and the Department
     stimulating housing and construction as rapidly as            of Home Affairs in 2018 estimated that, over the
     possible.                                                     40 years to 2015, population factors contributed
                                                                   almost 18% of the 1.7% annual average growth in
     Our work to promote the importance of the                     GDP per person.
     industry for economic recovery saw us partner with
     the Commonwealth Government on the design and                 Likewise, research commissioned by UDIA National
     implementation of HomeBuilder was central to our              last year found that net overseas migration
     endeavours.                                                   accounted for more than half of the demand for
                                                                   new housing construction in Australia.
     However, we do recognise there is a long way to go,
     for our nation and the industry. Until the vaccine            Notwithstanding the great work of the Federal
     roll out reaches saturation levels, and international         Government’s in stimulating housing and jobs
     borders (let alone the internal ones) fully reopen,           in the interim, a resurgence in immigration and
     stress will linger.                                           population growth remains a key priority.
     Hence, UDIA National is accelerating its robust               Australia will return from the Pandemic with its
     advocacy work on behalf of our Members in2021.                reputation enhanced. Our management of the
     We have a clear and sharp National Strategy                   health and economic impacts of COVID-19 has
     shaped by our Board, informed by our State                    been a gold-standard among international peers.
     divisions and matched by a commitment to
     research to develop policy on critical issues facing          That is why we are urging the Commonwealth
     our industry.                                                 to parlay that into both resuming an aggressive
                                                                   approach to overseas migration as soon as
     There is however one overriding issue that will               practical, as well as developing and implementing
     weigh heavily on the prospects for our nation and             a strategy that can accelerate the re-integration
     our industry – which is a return of immigration,              of traditional strengths – such as high rates of
     which has been the economic engine which                      international students – with other opportunities
     saw Australia with 28 years (a world record) of               that can be unlocked by our strong international
     unimpeded economic growth up to the COVID                     reputation.
     Pandemic.

                                                                                                        a
                                                                                                   ergi
                                                                                             Billb
                                                                                      s   by
                                                                               ar ina
                                                                              M
                                                                        o int
                                                                      hP
23                                                                wort
                                                               nt
                                                            We
We look forward to working with the Government tables on key issues such as land release
as they seek to design and deliver a holistic plan plans, development assessment timelines,
to boost immigration, net overseas migration and the efficiency (or otherwise) of infrastructure
population growth as soon as health and operation charges and other property taxes.
conditions allow.
These efforts will be duplicated with dedicated
streams of work on core policy issues facing the Reducing red tape
industry. These include: • Tasking National Cabinet with designing and
Housing stimulus establishing the appropriate funding envelope
and system needed to adequately incentivise
• Ensuring the success of HomeBuilder for the state, territory and local governments to
detached housing market is replicated via a support population growth, fix planning
plan to ensure semi-detached and apartment systems and reform the tax base.
markets can switch on supply to meet
demand as it returns. We know the pipeline Stronger cities and regions
of apartment projects is thin, and there is a • Building a durable pipeline of infrastructure
real risk of a disconnect in the market that will needed to service growing cities and regions,
damage affordability. and ensuring governments scrutinise
Streamlined green tape investments to test whether good land use
plans are attached.
• The seamless transition to a new
Environmental Protection and Biodiversity • These ideas are good for the nation, good for
Conservation (EPBC) Act regime, that both the economy and good for housing markets.
provides for reduced green tape and good We look forward to continuing to engage with
environmental outcomes, as well as strong policy makers in the year to come and working
collaboration with the states. The Government with members on the policy and advocacy
has made some initial steps on the path to agenda we seek to advance.
reform following the independent review
conducted in 2020, but we need to ensure the
final approach works for our industry.
Housing supply and affordability
• Turbo-charging the research mandate of the
National Housing Finance and Investment
Corporation (NHFIC) to identify the barriers
to housing supply, and applying greater
accountability and transparency to the
performance of states and territories. This
includes developing and publishing league
24SOUTH EAST
QUEENSLAND
SUMMARY
• SEQ region saw a significant lift in activity in the second half of 2020
with lot sales in greenfield areas up 46% and unit sales up 8%.
• The greenfield development sector was at full capacity servicing the
spike in demand across the September and December quarters, which
reflected significant local pent-up demand unsold stock levels are
currently at record lows with just 1.2 months of trading supply.
• 2020 saw a combined total (greenfield and multi-unit completions)
new market supply of 18,630 dwellings completed across SEQ which
was the lowest level delivered since 2014 and was 36% lower than the
peak supply delivered in 2017.
• Pricing for new residential products retracted across the year with a 4%
decrease in the median lot price to $261,000 and 4% rise in new units
to $480,890
• The outlook for the SEQ new dwelling market is very positive for
the first half 2021, with potential softening in the second half as the
‘pull-forward’ of demand from HomeBuilder is realised and other
government stimulus measures are eased off.
• With the ongoing halt to overseas migration the demand profile will
remain primarily local in character with the strong ongoing drift of
residents from NSW and VIC set to support new residential product
demand across the year.
New Residential Market Supply[1]
30,000
20,000
10,000
0
2013 2014 2015 2016 2017 2018 2019 2020 2021* 2022* 2023*
Greenfield Housing Completions Multi-Unit Completions
*UDIA Estimates
Source: UDIA; CoreLogic; Research4
[1] This figure includes annual estimations of detached houses being completed in greenfield release areas, and multi-unit projects being
completed. There are additional dwelling completions which are not covered under State of the Land reporting including small scale infill
subdivisions and secondary/knock down rebuild dwellings. As such the combined new market supply estimates are likely lower than actual
realised new supply.
One Bulimba
Riverfront by
18 Property
25
Velocity
GroupGREENFIELD MARKET ANALYSIS
Sales and Release Activity
• The SEQ greenfield market experienced a • Industry responded to the significantly
record 13,040 lot sales across 2020, which was increased demand profile by releasing a record
65% higher than 2019 and the highest sales 4,290 lots in the September quarter, but was
volume observed across the 12-year reporting unable to maintain this elevated production
timeframe of the Research4 National Land rate dropping back to 3,135 lots released in the
Survey. December quarter – which was still 5% above
the decade average.
• There was a 53% lift in sales in September
quarter compared to the ‘pre-COVID’ impacted • The inflection in sales and production capacity
March quarter, with an average of 1,320 lot constraints has unsold stock levels currently
sales per month recorded across the combined at record lows with just 1.2 worth of trading
SEQ sub-markets. months supply available at the end of the
December quarter.
Annual Greenfield Activity
5,000 8
Trading Months of Stock at Quarter End
4,500 7
Quarterly Lot Sales/Releases
4,000
6
3,500
5
3,000 Ideal Trading Months of Stock (3 - 5)
2,500 4
2,000 3
1,500
2
1,000
500 1
0 0
2013 2014 2015 2016 2017 2018 2019 2020
Lot Sales Lot Releases Trading Months
Source: UDIA; Research4
Active Estates & Industry Capacity
• The average count of active trading estates • Research4’s modelled capacity for the current
across 2020 was 184, which was up 6% from active land estates is 1,862 lots per month;
2019 with the highest count coming in the inferring that a sustainable level of activity
June quarter with a near record 198 estates would be 931 lots per month (2:1 ratio). With
recording sales. land sales in the December quarter averaging
1,203 lots sales per month there is upward
• The 2020 average volume of active trading pressure on land prices, which was reflected in
estates was up 25% on the decade average and the modest pricing increases in the second two
reflects industry output and participation at quarters of 2020.
record highs.
26Median Lot Pricing
• Despite the elevated levels of sales activity, the • This compares with the long-run average of
median lot price remained stable across SEQ for 53% of the median house price (across 2009-
the 2020 calendar year, finishing at $265,000 2019) indicating that lot pricing is currently at a
in the December quarter. This median lot price ‘fair-value’ benchmark and represents a strong
level represented 52% of the Greater Brisbane retail value proposition.
established median house price of $550,000
• The flat lining of land pricing in SEQ points to
(CoreLogic) as at November 2020.
the supply fundamentals being robust across
most sub-markets, and the lack of industry
anticipation of the scale of the second half of
the year demand uplift.
Median Lot Price, Land Price ($/sqm) and Median Lot Size
$700 600
$600 500
/ Median Land Price ($/SQM)
Median Lot Price ($,000)
$500
Median Lot Size (SQM)
400
$400
300
$300
200
$200
$100 100
$0 0
2013 2014 2015 2016 2017 2018 2019 2020
Median Lot Size (SQM)
Median Lot Price ($,000)
Median Land Price ($/SQM)
Source: UDIA; Research4
e
zur
yA
o nb
27 iti
n Ed
o
ers
EmSOUTH EAST
QUEENSLAND
Median Lot Sizes
• The SEQ median lot size averaged 415 sqm • The market acceptance of smaller lots has
across 2020 which reflected a -5% drop from helped edge-up per square metre land rates
2019, and the ongoing retraction experienced to $628 psm for the year which was up 1.3%
since 2013. from 2019. SEQ’s current land rates are
51% more affordable than Greater Sydney,
• The gradual reduction in median lot sizing and 23% more affordable than Greater
reflects the market seeking to continue to Melbourne.
provide products at price points affordable to
home buyers.
Greenfield Sub-markets
• Most SEQ sub-markets recorded a strong second half lift in activity except the Gold Coast, which is
facing ongoing supply constraints.
• The Logan and Ipswich sub-markets are the major volume markets for SEQ accounting for a combined
amount of 30% of total sales for the 2020 calendar year. These strong sales are underpinned by more
affordable price points to other SEQ sub-markets, with competition set to ramp up over the year ahead
between Logan and Ipswich.
Greenfield Market Performance Summary Table
Average Annual
Annual Net Land Number of Median Lot Size Annual Median Annual Median
Row Labels
Sales Active Estates (SQM) Lot Price Land Price ($/M)
Per Quarter
2009 5,233 84 622 $248K $398
2010 5,554 107 620 $247K $397
2011 4,107 129 616 $246K $400
2012 4,667 147 602 $242K $402
2013 7,655 157 555 $239K $431
2014 10,909 169 509 $245K $481
2015 10,383 144 489 $256K $523
2016 11,773 143 470 $260K $554
2017 12,366 166 448 $264K $588
2018 10,370 193 433 $266K $614
2019 7,916 174 436 $270K $620
2020 13,039 184 415 $261K $628
Source: UDIA; Research4
28SOUTH EAST
QUEENSLAND
MULTI-UNIT|INFILL ANALYSIS
Sales Activity
• Sales of newly built apartments and townhouses for 2020 remained at a depressed level for the third
year running, with the 1,715 settled sales across SEQ, down 77% on the decade average.
• Sales of new units represented just 9% of all unit sales activity across 2020, which is less than a third of
the proportion of new sales activity expected from the long term trend.
• While the overall sales volumes for new units remained low there was a modest improvement in
transaction activity across the second half of the year, with the overall new sales quantum up 8% on
2019.
Multi-Unit Sales, Whole of Market & New Sales (Settled)
$600,000 40,000
35,000
$500,000
30,000
$400,000
25,000
$300,000 20,000
15,000
$200,000
10,000
$100,000
5,000
$0 0
2010 2011 2012 2013 2014 2015 2016 2017 2018 2019 2020 2021
New Unit Sales Established Unit Sales
New Unit Price Established Unit Price
Source: UDIA; CoreLogic
Median Unit Pricing
• The median sale price of new units grew by • The median sale value for all multi-units (new
3% across the year in SEQ to $480,890, which and resales) for SEQ in December 2020 was
reflects a 18% sale price difference to broader $406,700, which 18% lower than the median
established unit market pricing, which is in line unit sale price, which indicates a modest
with the long-term trend. pricing premium is being achieved on current
sales above the underlying property value.
• SEQ’s newly constructed units remain price
competitive with the other east coast capital • The current median sale value of new units
city markets, with the median new sale is currently 17% more affordable than the
price currently 33% more affordable than median value for new houses, which is
Sydney’s units, and 23% more affordable than significantly higher than the long-term average
Melbourne’s median unit price point. of 12% cheaper, which represents a positive
retail proposition for the market – particularly
first home buyers.
29Construction Activity
• There were 9,530 new multi-unit dwellings • There is lower levels of supply of multi-units
completed across SEQ in 2020. This is an being delivered in the inner and middle ring
annual decline of 28% on 2019 completions, areas of Greater Brisbane than evidenced in
and a 46% decline on the historic high achieved the other capital cities.
in 2017.
• Reflecting the above, the top three postcodes
• In 2020 the majority of SEQ’s new apartment for multi-unit completions were 4000, 4006
supply was delivered within a 5km band of the and 4,101 all in the Brisbane inner city. The
Brisbane GPO (35% of all new units), and on next highest were 4209 and 4212, both on the
the Gold Coast and Sunshine Coast (31%). Gold Coast.
Median New Unit Price & Annual Unit Completions
20,000 $490K
18,000 $480K
16,000 $470K
14,000 $460K
$450K
12,000
$440K
10,000
$430K
8,000
$420K
6,000 $410K
4,000 $400K
2,000 $390K
- $380K
2013 2014 2015 2016 2017 2018 2019 2020
Unit Completions New Unit Sales Price
Source: UDIA; CoreLogic
Multi-Unit Active Pipeline Analysis
End of 2019
End of 2020
- 5,000 10,000 15,000 20,000 25,000 30,000 35,000 40,000 45,000
Early Planning Approved Under Construction
Source: UDIA; CoreLogic
30Pipeline Analysis
• CoreLogic has produced point-in-time • This is made up of units in the early planning
estimates of the multi-unit pipeline based on a phase (down 10% from 2019), units which have
December 2019 and December 2020 snapshot received Approvals (down 1% from 2019) and
of the market leading Cordell Construction units under construction (down 8%).
database.
• The continued softening of multi-unit approvals
• This data analysis reveals that there is an recorded across the year, down 64% on 2015
aggregate total of 37,915 units in the SEQ volumes, highlights the forward pressure
active pipeline, which is 5% lower than the building on the multi-unit supply pipeline.
supply recorded in December 2019.
Multi-Unit Completions 2020, by Postcode
Source: UDIA; CoreLogic
Sub-Market Analysis
• The majority of 2020 apartment sales activity • These regions also fared best in terms of
in South East Queensland occurred in the Gold price, with the Gold Coast, Sunshine Coast and
Coast and Brisbane City, with 6,479 and 6,416 Brisbane City remaining stable over the year.
apartment sales respectively.
• Moreton Bay’s median apartment price fell by
• This was followed by the Sunshine Coast with 5%, while median apartment prices in Redland,
2,208 sales and Moreton Bay with 1,115 sales. Scenic Rim, Logan, and Ipswich all fell by an
average of 7%.
31SOUTH EAST
QUEENSLAND
Multi-Unit Market Performance Summary Table
Established
New Unit New Unit Established
Unit Sales Unit Approvals Unit Completions
Sales Sales Price Unit Sales
Price
2010 7,494 $409,091 14,352 $367,592 - -
2011 6,372 $394,605 11,623 $351,807 - -
2012 8,124 $406,249 13,132 $343,091 - -
2013 11,642 $417,424 17,320 $350,229 12,152 7,418
2014 13,799 $432,883 20,067 $364,583 13,703 7,803
2015 13,550 $441,667 23,177 $372,750 23,760 12,744
2016 8,421 $448,510 21,882 $384,739 19,786 15,926
2017 2,889 $458,283 18,144 $392,236 13,254 17,902
2018 1,990 $450,603 16,896 $393,277 12,720 13,702
2019 1,588 $465,543 16,983 $397,056 8,675 13,211
2020 1,715 $480,891 17,706 $406,705 8,526 9,530
Source: UDIA; CoreLogic
RESEARCH PARTNER: CORELOGIC
QUEENSLAND 2021 OUTLOOK
"There are many tailwinds for Queensland dwelling markets, with value increases expected over
2021. The pipeline of unit supply across South East Queensland continues to moderate, internal
regional migration patterns highlight the sunshine state as a top destination for Australians looking
to move, and an increase in mining investment suggests an economic uplift across some regional
areas of the state. In the three months to January, Brisbane dwelling values increased 2.5%, which
is the strongest quarterly growth rate since November 2009, while quarterly growth across the
combined ‘Rest of State’ reached the highest level since 2004, at 4.6%.
A potential headwind for property market performance in Queensland may be tougher economic
conditions for vulnerable households. The end of the JobSeeker supplement in 2021 may have a
dampening effect on markets, particularly rental markets, in regions such as Caboolture, Surfers
Paradise and the Inala-Richlands region, where these areas had among the highest recipients of the
JobSeeker payments in the state in December 2020."
32You can also read