COUNTY CARLOW HOUSING STRATEGY - 2015-2021 Carlow County Council
←
→
Page content transcription
If your browser does not render page correctly, please read the page content below
COUNTY CARLOW
HOUSING STRATEGY
   2015-2021

  Carlow County Council

         July 2015
Document Control Sheet
Prepared by: SB Checked by: TD
Project Title: Carlow Housing Strategy
Project No: 1883
Rev No. Comments Date
0 Draft 25/03/14
1 Rev 23/04/14
2 Rev 01/05/14
3 Rev 27/06/14
4 Final 20/07/15
MacCabe Durney Barnes
20 Fitzwilliam Place, Dublin 2
T:+353 1 6762594 F +353 1 6762310
W: www.mdb.ie
Statement:
This report has been prepared by MacCabe Durney Barnes using due skill, care and diligence and is sufficient as a means of estimating
future requirements under Part V of the Planning and Development Act 2000 (as amended) but the data and conclusions reached should
not be used for other purposes.County Carlow Housing Strategy
TABLE OF CONTENTS
EXECUTIVE SUMMARY ......................................................................................................................................... 1
1 INTRODUCTION AND POLICY BACKGROUND .................................................................................... 3
1.1 BACKGROUND .............................................................................................................................. 3
1.2 STRUCTURE OF THE REPORT ........................................................................................................ 4
1.3 LEGISLATIVE BACKGROUND .......................................................................................................... 5
1.4 POLICY BACKGROUND .................................................................................................................. 5
2 SUPPLY AND INFRASTRUCTURE ......................................................................................................... 8
2.1 INTRODUCTION ............................................................................................................................. 8
2.2 DEVELOPMENT PRESSURE ............................................................................................................ 8
2.3 DEVELOPMENT CAPACITY ........................................................................................................... 10
2.4 SOCIAL AND AFFORDABLE HOUSING SUPPLY IN COUNTY CARLOW................................................ 16
2.5 CONCLUDING FINDINGS .............................................................................................................. 19
3 ANALYSIS OF HOUSING DEMAND...................................................................................................... 20
3.1 HOUSING MARKET AREAS ........................................................................................................... 20
3.2 DEMOGRAPHIC PROFILE OF COUNTY CARLOW ............................................................................. 20
3.3 REVIEW OF POPULATION TRENDS................................................................................................ 21
3.4 POPULATION TARGETS ............................................................................................................... 21
3.5 HOUSEHOLD BY SIZE .................................................................................................................. 23
3.6 NATIONAL ECONOMIC GROWTH ................................................................................................... 23
3.7 ECONOMIC AND DEMOGRAPHIC GROWTH IN CARLOW .................................................................. 24
3.8 CONCLUDING FINDINGS .............................................................................................................. 26
4 AFFORDABILITY MODEL ..................................................................................................................... 27
4.1 INTRODUCTION ........................................................................................................................... 27
4.2 HOUSING MARKET ...................................................................................................................... 27
4.3 HOUSE PRICES ........................................................................................................................... 29
4.4 INCOMES .................................................................................................................................... 32
4.5 INTEREST RATES, MORTGAGES AND NEGATIVE EQUITY ................................................................. 33
4.6 AFFORDABILITY MODEL CONCLUSIONS ........................................................................................ 34
4.7 CONCLUDING POINTS.................................................................................................................. 34
5 SOCIAL HOUSING PROVISION ............................................................................................................ 35
5.1 INTRODUCTION ........................................................................................................................... 35
5.2 THE ASSESSMENT OF HOUSING NEED ......................................................................................... 35
5.3 SPECIALISED HOUSING REQUIREMENTS ...................................................................................... 40
5.4 CONCLUDING FINDINGS .............................................................................................................. 44
iCounty Carlow Housing Strategy
6 SOCIAL HOUSING DELIVERY .............................................................................................................. 46
6.1 OPTIONS OF THE DELIVERY OF SOCIAL HOUSING ......................................................................... 46
6.2 PROVISION OF SOCIAL HOUSING UNDER PART V ........................................................................... 47
6.3 RENTAL ACCOMMODATION SCHEME ............................................................................................ 47
6.4 SOCIAL HOUSING LEASE INITIATIVE ............................................................................................. 48
6.5 BUILD TO LEASE ......................................................................................................................... 48
6.6 CAPITAL ADVANCED LEASING FACILITIES (CALF)......................................................................... 48
6.7 CASUAL VACANCIES ................................................................................................................... 48
6.8 PURCHASE OF NEW AND SECOND HAND DWELLINGS ................................................................... 48
6.9 MULTI-ANNUAL BUILDING PROGRAMMES / CONSTRUCTION OF NEW ACCOMMODATION .................... 48
6.10 MEET THE DEMAND ..................................................................................................................... 49
6.11 CONCLUDING FINDINGS .............................................................................................................. 49
7 PRINCIPLES AND POLICIES ................................................................................................................ 50
7.1 KEY PRINCIPLES ......................................................................................................................... 50
7.2 HOUSING STRATEGY POLICIES .................................................................................................... 50
APPENDIX I - POLICY CONTEXT ....................................................................................................................... 53
LIST OF TABLES
Table 1 – SERPG Population Targets 2010-2022 6
Table 2 – Population Change 2002-2011 10
Table 3 – Planning Permissions in County Carlow 2009-2013 11
Table 4 - Residentially Zoned Lands in Carlow 15
Table 5 – Provision of Social Housing 2008-2013 16
Table 6 – Provision of Affordable Housing 16
Table 7 – Part V Provision of Social and Affordable Housing 2009-2013 17
Table 8 – Social Housing Provided or Funded in County Carlow 17
Table 9 – Social Housing Demand by Unit Size 18
Table 10 – Capital Assistance Scheme (Special Needs) 18
Table 11 – County Carlow Population, 2002, 2006 and 2011 21
Table 12 – Population Targets for Carlow 22
Table 13 – Population Targets for Carlow Housing Strategy 2015-2021 22
Table 14 – Carlow Household Size in 2011 23
Table 15 – ESRI Growth Scenario 24
Table 16 – Estimated Housing Price Distribution for Carlow 2010-2013 31
iiCounty Carlow Housing Strategy
Table 17 – Estimated Distribution of Household Disposable Incomes in County Carlow 2011 32
Table 18 – Household Annual Disposable Income Distribution over the Period of the 32
Strategy
Table 19 – Additional Households per Year in each Income Decile 33
Table 20 – Social Housing Applicants 36
Table 21 – Traveller Accommodation in Carlow 42
Table 22 – Disability Related Accommodation 43
Table 23 – Accommodation for the Homeless in Carlow County 44
Table 24 – Social Housing Investment Programme 46
LIST OF FIGURES
Figure 1 – Social and Private Housing Units Completed between 2008 and November 2013 12
Figure 2 – Commencement Notices 2009-2013 13
Figure 3 – Types of Units Surveyed 14
Figure 4 – Status of Completion 14
Figure 5 – County Carlow, Age Pyramid 20
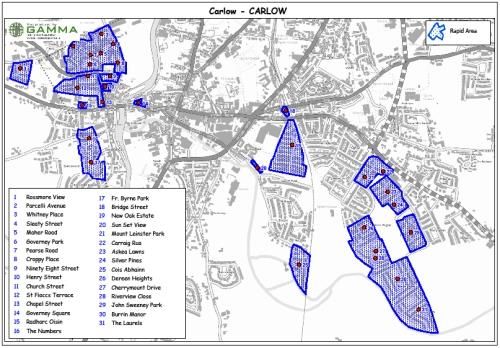
Figure 6 – Carlow Town RAPID areas (in blue) 25
Figure 7 – Average Rent in Carlow 2009-2013 29
Figure 8 – National House Prices 2005-2013 30
Figure 9 – Average House Price Carlow 2010-2013 31
Figure 10 – Breakdown of Households by Category of Need 37
Figure 11 – Length of Time on the Waiting List 37
Figure 12 – Employment Status 38
Figure 13 – Household Incomes 38
Figure 14 – Household Composition 39
Figure 15 – Tenures on the Housing List 40
Figure 16 – The Traveller Population in Carlow Between 1998 and 2012 41
Figure 17 – Traveller Housing in Carlow 42
iiiCounty Carlow Housing Strategy
EXECUTIVE SUMMARY
The Housing Strategy has been prepared in accordance with Part V of the Planning and Development Act,
as amended, and covers the functional area of Carlow County Council for the period 2015-2021. The
Strategy will form part of the Carlow County Development Plan 2015-2021. Once adopted, the Strategy will
replace the 2009 Strategy.
The overarching purpose of the Strategy is to support the proper planning and sustainable development of
Carlow by planning for the housing needs of the existing and planned population in the area in an
appropriate manner. The document presents a framework for the supply of housing to meet the housing
needs arising in the County.
Since the 2009 Strategy, major shifts in both housing policy and the housing market have occurred and
radically transformed the prospects for Carlow. In particular, the dramatic downturn in the economy has
severely impacted the national housing market, prompting the release of the 2011 Housing Policy
Statement by the Department of Environment, Community and Local Government effectively suspending all
affordable housing schemes in the country. The statement also announced the review of Part V with a view
to ensuring that planning gain achieved in residential development would translate into the provision of
social housing.
The Housing Needs Assessment 2013 carried out by the Housing Agency recorded 1,043 households on
the County Carlow housing list and the net need for housing was recorded at 277 households by the County
Council in October 2013.
The key findings for this strategy are:
The South East Regional Planning Guidelines (SERPGs) over-estimated the planned population
for 2011 by 1,543 persons compared to the population as recorded in the Census for that year.
The Review maintains the SERPG target figure of 63,536 persons for 2022 and adjusts the figures
accordingly to a population over the review period of 57,702 in 2015 and 62,688 in 2021.
Based on Council data from 2012, there are currently 287.63ha of residentially zoned and serviced
lands in County Carlow, which can accommodate c.7,191 units or 20,135 persons. (Not all such
land can be expected to be developed).
The average household size in the County is 2.8, which accords with both the 2011 Census and
the SERPGs.
Using the 2.8 average household size, there is a requirement to house an additional population of
4966 in 1773 households by 2021 at an average rate of 295 per annum
There is significant spare zoned and serviced land capacity available in Carlow Town and
Environs.
The average house price in County Carlow (all types of units) is €111,836.
Using A Model Housing Strategy and Step-by-Step Guide, it was estimated that 15% of units
located on land zoned for residential uses (or mixed use including residential use) should be
reserved for social housing. The reserved land policy shall exclude projects seeking to deliver
student accommodation, accommodation for the elderly and special needs housing.
Housing Circular 11/2012 set out the preferred options for delivering Part V obligations, in a
manner that does not impose a financial burden on local authorities as follows:
o Payment of a financial contribution to the Council
1County Carlow Housing Strategy
o Transfer of a reduced number of units or lands in lieu, at no cost to the Council.
Transferred units must be located in areas with a recognized housing need.
o Transfer of a reduced number of units which are specifically adapted for persons with one
or more form of disability and who have specialized housing requirement, at no cost to the
Council.
o A combination of two or more of the above.
The Strategy highlights the number of unfinished estates in Carlow and suggests that some may
be used to cater for the housing needs of the population.
There is a necessity to cater specifically for the housing needs of the Traveller community, the
elderly and people with special needs.
The government announced in May 2013, the allocation of €14.2 million to the Carlow Authorities,
of which €6.2 million was allocated to housing.
Although, the delivery of social housing is challenging due to limited public finances, there are
various methods of meeting social housing requirements, including working closely with the
Voluntary Housing Associations. Their role is increasingly significant and highly valuable in
catering for the needs of the households on the housing list.
Rental Accommodation Scheme has been the principle means of meeting social housing demand.
Carlow County Council will ensure that a mix of house types and sizes within individual
developments and within communities to promote a socially balanced and inclusive society.
It is a requirement of the Planning and Development Act 2000, as amended, that the Housing Strategy is
reviewed every two years or sooner if there is a significant change in the housing market and in the national
spatial planning policy. To facilitate such review and assess if the policies are being achieved, it will be
necessary to monitor this Strategy.
This report has been prepared using due skill, care and diligence and is sufficient as a means of
estimating the future social housing requirements of County Carlow. It is advised that the data and
conclusions contained in this document should not be used for other purposes.
2County Carlow Housing Strategy
1 INTRODUCTION AND POLICY BACKGROUND
1.1 Background
The Housing Strategy has been prepared in accordance with Part V of the Planning and Development Act
2000, as amended, and covers the functional area of Carlow Local Authorities (Carlow County Council and
Carlow Town Council) for the period 2015-2021. The housing strategy will form part of the Carlow County
Development Plan 2015-2021 in accordance with the requirements of the legislation. Carlow Town Council
is due to be abolished under the Local Government Reform Act 2014 in June 2014 and it functions
amalgamated with Carlow County Council.
This strategy was placed on public display as part of the Draft Development Plan and following receipt of
submissions from interested bodies and/or persons was then considered by Carlow County Council for
adoption. Once adopted, it will replace the previous strategy.
The purpose of the strategy is to ensure that
There is adequate provision of housing available suited to the needs of the existing and planned
population of County Carlow at a level that they can afford.
The national housing market was severely impacted by the dramatic downturn in the international and
national economy. The assumptions and the scenarios used for the previous Housing Strategy therefore
require reconsideration. Declining house prices, income variation, and increasing housing lists all
immediately resulting from the recession are factors that must be assessed in formulating the new Housing
Strategy.
Since 2008, a number of changes has occurred and must also be taken into account when preparing the
Housing Strategy, they include:
The 2010 Amendment to the Planning and Development Act 2000 effectively implemented
evidence-based Core Strategies to align Development Plans with the National Spatial Strategy
(NSS) and Regional Planning Guidelines.
The new Local Property Tax (LPT) which came into force on the 1st July 2013.
The difficult access to credit by many aspiring homeowners, in particular first time buyers.
The June 2011 Housing Policy Statement which effectively suspended all affordable housing
schemes.
The impending review of Part V.
The review of The South East Regional Planning Guidelines’ population forecasts for 2022
Unfinished housing estates.
The establishment of the National Asset Management Agency (NAMA) in 2009.
NAMA’s recent cooperation with housing associations to cater for social housing.
The Strategy has been prepared broadly in accordance with the Model Housing Strategy and Step by Step
Guidelines to Part V of the Planning and Development Act (the Step by Step Guidelines) issued by the
Department of Environment, Community and Local Government (DOECLG) . The guidelines were prepared
in 2000 and since then Ireland and County Carlow have gone through radical changes in the financial and
housing markets. The early 2000s saw a phenomenal inflation in both housing demand and price followed
by an abrupt collapse in 2008, which destabilised the housing market and severely impacted the wider
economy. House price inflation and affordability issues for first-time buyers in particular first arose during
the Celtic Tiger period (1993 to 2001) and continued into the period of domestically driven growth (2001-
3County Carlow Housing Strategy
2007). Negative equity and house price deflation has been a major issue in the recession since 2008 and
due regard has been paid to this in drafting the current Strategy.
The current housing market in 2014 shows a slow stabilisation of the housing prices across the State with
the exception of the Dublin Region where constraints on supply has driven up demand and rental levels are
increasing at the same rate as during the boom period albeit from a low base.
The Review of Part V, both in terms of legislation and policy, is at this stage unknown. The Strategy has
therefore been prepared on the basis of the existing legislative and policy framework.
1.2 Structure of the Report
The report is structured in the following manner:
Section 1 sets out the legislative and policy background to the Strategy.
Section 2 contains an analysis of the housing supply and the infrastructure in the County. It identifies the
extent of zoned land that will be required for residential purposes and identifies the current housing needs in
the light of the current economic situation.
Section 3 reviews housing demand, detailing population trends.
Section 4 applies the affordability model which gathers information on house prices, incomes, interest
rates, and establishes the affordability threshold for the period of the Strategy.
Section 5 details the social housing provision by the local authorities and voluntary housing associations
during the 2009-2013 period, as well as the findings from the latest housing needs assessments.
Section 6 considers the various schemes catering for social housing.
Section 7 sets out the housing objectives and policies which will form part of the County Development Plan
2015-2021.
All data used comes from published statistics and information provided by Carlow County Council.
Appendix I relates to relevant policy background and papers.
4County Carlow Housing Strategy
1.3 Legislative Background
Part V of the Planning and Development Act as amended states in section 94 – (1) (a) that:
“Each planning authority shall include in any development plan it makes in accordance with the
section 12 a strategy for the purpose of ensuring that the proper planning and sustainable
development of the area of the development plan provides for the housing of the existing and
future population of the area in the manner set out in the strategy.”
Under Section 94 (3) of the Act, the Housing Strategy shall take account of:
(a) the existing need and the likely future need for housing to which subsection (40(a) applies i.e. social
and affordable housing,
(b) the need to ensure that housing is available for persons who have different levels of income,
(c) the need to ensure that a mixture of house types and sizes is developed to reasonably match the
requirements of the different categories of households, as may be determined by the planning authority,
and including the special requirements of elderly persons and persons with disabilities, and
(d) the need to counteract undue segregation in housing between persons of different social backgrounds.
In the light of the recent instability of the housing market the Housing Policy Statement, published in June
2011, by the DoECLG announced a full review of Part V. The review is still currently being undertaken on
options for Part V. To this date, no decision has been taken with regard to its future provisions and as
stated in the introduction this Strategy has been prepared in accordance with current statutory provisions
and broadly with the Step-by- Step Guide.
The Housing (Miscellaneous Provisions) Act 2009 seeks to improve housing services and their delivery by
giving effect to the programme of social housing reform measures outlined in Delivering Homes, Sustaining
Communities policy document published in February 2007. The Act introduced a new incremental housing
scheme, new powers in relation to anti-social behaviour and the removal of the claw back anomaly.
1.4 Policy Background
The Planning and Development Act 2000 requires that the Housing Strategy to be in line with the
requirements set by the higher level strategies such as the National Spatial Strategy and relevant regional
planning guidelines (RPGs). The amendments introduced to the Planning Act 2010 clarified the relation of
the development plan to the National Spatial Strategy and the RPGs. The development plan must now be
consistent with the population projections and the settlement strategy as set by the relevant RPGs.
1.4.1 National Spatial Strategy
The National Spatial Strategy (NSS) initially set out a 20-year planning framework for the more balanced
social and economic development of the regions of Ireland. A framework of Hubs and Gateway to guide the
growth was put in place. The NSS is now being reviewed.
The NSS states that the critical economic and social mass of the South East Region will be enhanced
through Waterford City- the Gateway City, and supported by the hubs- Kilkenny and Wexford and by the
5County Carlow Housing Strategy
county towns, including Carlow Town, to drive regional growth. The role of the County Town is to support
the achievement of the critical mass and balanced development across the region.
Section 5.3 – Housing
The NSS recognizes the need for good quality accommodation as a fundamental human need, as well as
highlighting four policy priority areas in relation to housing:
1 The need for housing policy to support the implementation of the NSS.
2 Integrating the location of housing with good transport facilities, in particular public transport.
3 Zoning and servicing of lands to ensure a good land supply relative to development needs.
4 Provision of social and affordable housing to meet requirements.
1.4.2 South East Region Regional Planning Guidelines 2010-2022
The policies enumerated in the NSS are carried through to the South East Regional Planning Guidelines
(SERPG), which support the delivery of the NSS and in turn incorporated into the local development plans.
Population targets are set out for each local authority area and for the main settlements in the region Table
1 outlines the forecasts made for County Carlow and Carlow Town.
Table 1: SERPG Population targets 2010-2022
Year 2006 2010 2016 2022
Carlow County 50,349 56,155 59,451 63,536
Carlow Town 20,724 22,126 23,768 25,000
Source: South East Region Regional Planning Guidelines 2010-2022
Section 2.6.1 identifies sub-regional issues for Carlow, which is located in Sub-Area C Carlow North –East
Kilkenny. Those include:
Smaller towns and villages require strengthening.
Urban generated housing requires carefully monitoring and control.
Carlow Town Environs is growing due to the influence of the Greater Dublin Area.
Among their strategic goals, the SERPGs listed Goal B6:
“Ensuring the availability and affordability of housing in cities and villages, supported by clear rural
settlement strategies, to achieve critical mass and a strong competitive urban network.”
6County Carlow Housing Strategy
1.4.3 Other Relevant Plans and Policies
Other policies plan which were reviewed as part of the process are those detailed below.
National Policy
The National Development Plan 2007-2013
The National Recovery Plan 2011-2014
Toward 2016 – Ten-year framework social partnership agreement 2006-2015
National Housing Policy
Sustainable Residential Development in Urban Areas
Quality housing for sustainable communities
Housing needs assessment, Housing Agency 2011
Housing Policy Statement 2011
National Housing Strategy for People with a Disability 2011-2016 Oct 2011
Homeless Strategy National Implementation Plan
Managing and Resolving Unfinished Housing Development Guidance Manual Aug 2011
County Plans
Joint Spatial Plan for the Greater Carlow Graigcullen Urban Area 2012-2018
Carlow County Development Plan 2009-2015
Local Area Plans
Muinebheag/Royal Oak 2010-2016
Borris 2010-2016
Carrickduff -2015
Leighlinbridge 2010-2016
Rathvilly 2010-2016
Tinnahineh 2010-2016
Tullow 2010-2016
The housing policy background is detailed in the County Development Plan. In general, the local area plans
and village plans have adopted housing policies and other policies in relation to residential development
which are in accordance with the County Development Plan, the SERPGs and national housing policy.
Appendix A to this document provides a brief overview of housing policy and residential guidelines
applicable to County Carlow and Carlow Town.
7County Carlow Housing Strategy
2 SUPPLY AND INFRASTRUCTURE
2.1 Introduction
This section of the strategy addresses the factors that influence the housing supply including market
pressures, infrastructure and land development capacity.
The previous Housing Strategy was based on principles in governmental guidelines on residential
development which strongly promoted sustainable development, as well as reducing the demand for travel
and the promotion of higher densities.
The publication of the National Housing Strategy for People with Disability 2011-2016 introduced a
significant change by promoting access by all to housing. It promotes independent living and the provision
of a variety of housing units to cater for the varying needs of people with disabilities.
In drafting this Strategy, similar good planning principles to those used in the previous Strategy were
applied such as
developing in proximity of public transport nodes, and town and village centres,
encouraging mixed use development,
developing brownfield sites,
limiting ribbon development,
promoting environmental protection and safeguarding ecosystems.
2.2 Development Pressure
2.2.1 Location of Development Pressure in County Carlow
Carlow Environs, Tullow Environs and Bagenalstown were the areas that experienced the greatest level of
development pressure in the County during the period of the preparation of the previous strategy. Access to
Dublin has remained a factor in the local property market.
2.2.2 Infrastructure
Transportation
County Carlow has benefited from the completion of the M9 Motorway serving Dublin to Waterford. It is now
well connected to Dublin, Waterford and Kilkenny by road as well as by, rail and national bus networks.
While the national bus network functions well within the county, there is a lack of public transport within
Carlow Town. There is a high car dependency in the town and county.
Sanitary Facilities
8County Carlow Housing Strategy
Waste water facilities and treatment plants will be the main limitation with regard to the potential future
expansion of settlements in Carlow. A number of shortfall and compliance issues have been highlighted by
the local authorities who are currently working on the upgrade of several plants across the county.
Carlow Town has large spare capacity in its sanitary facilities, whereas Tullow has a significant shortfall.
However, proposals for the upgrade of the Tullow plant are currently underway. Plants at Rathvilly and
Hacketstown are also currently being upgraded, which will double their capacity.
2.2.3 Social and Economic
Education
There are two third-level Colleges in Carlow: Carlow Institute of Technology; and St Patrick’s College. In
addition, there are a number of primary and secondary schools.
The latter are located in:
Carlow Town,
Tullow,
Bagenalstown and
Hacketstown.
Health
The health infrastructure is as follows:
Hospitals
Carlow District Hospital
St Dympna’s Psychiatric hospital/Nursing Home
Primary Care and Health Centres
Carlow Town (3)
Bagenalstown
Borris
Clonegal
Hacketstown
Leighlinbridge
Myshall
Rathvilly
Tullow
There are 157 beds between 4 nursing homes.
15 houses for the elderly are being built in Leighlinbridge.
Retail
The retail strategy that forms part of the Joint Spatial Plan indicates that Carlow Town has a traditional retail
core where the vacancy rate aligns with the national average for towns of similar size. More modern retail
parks are located outside the town and elsewhere in the county.
9County Carlow Housing Strategy
2.3 Development Capacity
Capacity for accommodating future population and housing will depend on a range of factors, including:
The quantum of residentially zoned land,
The quantum of other land suitable for development,
Constraints and limits in the provision of water supply and drainage,
Constraints and limits in the provision of other physical and social infrastructure, such as
educational and health structures,
Access and provision of public transport,
Topographical and flood-related constraints; and
Areas of high amenity or nature conservation value.
Based on the above constraints, it has been determined that Bagenalstown should have a higher population
target and housing land allocation than Tullow for the period 2015-2021. This determination is based, in
particular, on the level of vacant housing units in Tullow and the relatively high number of unfinished
housing estates which will provide capacity for Tullow during this period.
2.3.1 County Development Patterns
Carlow Town and Environs form the largest urban settlement in the county. Bagenalstown and Tullow are
the second largest urban settlements and the urban structure is supported by smaller towns and villages
throughout the county. Table 2 below details the population changes that have occurred between 2002 and
2011.
Table 2: Population change 2002-2011
2002 % Change 02-06 2006 % Change 06-11 2011 % Change 02-
11
Carlow County 46014 9.42 50349 8.47 54612 17.08
Carlow Town Total 13218 3.06 13623 0.55 13698 3.52
Environs of Carlow 5269 34.77 7101 20.36 8547 46.16
Tullow 2417 26.11 3048 30.31 3972 51.02
Bagenalstown 2728 0.26 2735 7.86 2950 8.12
Rathvilly 500 59.20 796 10.68 881 47.86
Leighlinbridge 646 4.33 674 22.85 828 27.00
Hacketstown 614 -1.30 606 -0.99 600 -2.31
Ballon 284 109.86 596 14.77 684 67.11
Borris 580 0.34 582 11.00 646 11.34
Bunclody- 251 27.09 319 38.56 442 59.87
Carrickduff
Graiguenamanagh- 269 3.72 279 4.30 291 7.89
Tinnahinch
Tinryland 371 -34.50 243 72.02 418 19.34
Kernanstown 244 -5.74 230 -3.91 221 -10.00
Clonegal 151 9.93 166 9.04 181 18.07
No census data in 2002
Myshall n/a 200 51.00 302 151.00
10County Carlow Housing Strategy
Kildavin n/a 170 14.12 194 114.12
No census data in 02 & 06
Ballinabrannagh n/a n/a 389 n/a
Fennagh n/a n/a 384 n/a
Palatine Burton n/a n/a 351 n/a
Hall
Rathtoe Rathrush n/a n/a 303 n/a
Source: CSO
2.3.2 Residential Planning Permissions in the County
Planning approvals data indicate that planning permission has been granted for the development of 1,051
housing units in County Carlow in the last 4 years (2009-2013). This is a stark contrast with the 2002-2007
period where 9,186 housing units were granted permission. Table 3 below sets out planning permissions
granted in the county between 2009 and 2013
Table 3: Planning Permissions in County Carlow 2009-2013
09-13
% of
2009 2010 2011 2012 2013 (total per
Authority
type)
Carlow County Council
Houses of which: 400 175 158 34 23 790 82.72
Multi unit 273 71 110 0 0 454 47.54
One-off houses 127 104 48 32 23 334 34.97
Apartments 160 0 2 3 0 165 17.28
Sub-total units 560 175 160 37 23 955 100
Carlow Town Council
Houses of which: 82 0 2 0 6 88 91.64
Multi unit 79 0 0 0 2 81 84.38
One-off houses 3 0 2 0 1 6 6.25
Apartments 5 0 0 1 0 6 6.25
Sub-total units 87 0 2 1 6 96 100
Total Carlow County
Houses of which: 482 175 160 34 29 880 83.8%
Multi unit 352 71 110 0 2 535 50.9%
One-off houses 130 104 50 32 24 340 32.4%
Apartments 165 0 2 4 0 171 16.2%
Total Units 647 175 162 38 29 1050 100%
Source: Department of the Environment, Community & Local Government)
11County Carlow Housing Strategy
The figures in Table 3 show a dichotomy in the housing development patterns between the County Council
area and that of the Town Council, with 90.9% of the housing permission located within the County’s
jurisdictional area. There has been a dramatic decrease in the number of units permitted, reducing from 647
in 2009 to a mere 29 in 2013 in the two areas combined.
Overall figures suggest an oversupply of multi-unit development permissions prior to 2009. There has been
no development of apartments in the last number of years and the output has been driven almost
exclusively by one-off houses.
2.3.3 Housing Completion in County Carlow
Housing completion numbers are published by the Department of the Environment on a yearly basis.
Figure1: Social and Private Housing Units Completed between 2008 and November 2013
Source: DECLG
There has been a slight increase in construction activity in 2013 but this only related to private one-off
housing units. Over the 2008-2013 period, the public sector completed 199 units.The number of
commencement notices has also significantly dropped with c. 40 units on average starting every year since
2011.
12County Carlow Housing Strategy
Figure 2: Commencement Notices 2009-2013
Source: DoECLG
2.3.4 Census 2011 Vacancy Rate
The 2011 Census highlighted that 14% of the housing stock in the county was vacant on Census night. This
is 3.4% higher than the Leinster average and 1.7% higher than the 2006 Census figure. However, this rate
is slightly lower than the 14.7% share of vacant units at the national level. Unlike the State and Leinster, the
number of vacant units in Carlow has increased during the intercensal period from 2,475 to 3,272.
2.3.5 Unfinished Housing Estates Survey 2013
The Survey (the third of its kind) is undertaken on a yearly basis to maintain up to date data on unfinished
housing development across the Country. The survey records the characteristics of those estates including
the following:
number of units,
number of completed units,
number of vacant units,
number of units that have not been commenced.
The survey identified a total of 3,171 units split between 53 unfinished estates in County Carlow, results are
shown in Figures 3 and 4 hereafter.
13County Carlow Housing Strategy
Figure 3: Types of Units Surveyed
Source: Housing Agency, 2013
Figure 4: Status of Completion
Source: Housing Agency, 2013
The figures show that 12% of units in the county where either complete and vacant or nearing completion
representing 380 units. It must be noted that 718 units are located in Tullow. Of those, 349 are already
occupied, 66 are complete and vacant and 143 are nearing completion.
14County Carlow Housing Strategy
2.3.6 Existing Zoned Land
The County Development Plan and the local area plans provide the quantum of undeveloped residentially
zoned land for each settlement to which each plan applies. Currently there are 11 areas which are covered
by land use zoning plans. These are:
Carlow County Development Plan 2009-2015
Joint Spatial Plan for the Greater Carlow Graigcullen Urban Area 2012-2018
Bagenalstown/Royal Oak LAP 2010-2016
Borris LAP 2010-2016
Carrickduff LAP 2009-2015
Leighlinbridge LAP 2010-2016
Rathvilly LAP 2010-2016
Tinnahinch LAP 2010-2016
Tullow LAP 2010-2016
Table 4 hereafter summarises the current availability of undeveloped residentially zoned lands in County
Carlow, as detailed in the DoECLG’s survey of 2012.
Table 4: Residentially Zoned Lands in Carlow
Location Overall Residential Land Serviced land availability(ha)
Availability (ha)
Bagenalstown / Royal Oak 104.28 22.39
Borris 26.36 0.0
Carlow Town Environs 57 228.45
Carrickduff 50.0 0.0
Leighlinbridge 25.34 15.12
Rathvilly 44.82 10.03
Tinnahinch 4.76 4.76
Tullow 125.15 6.88
TOTAL COUNTY 437.71 287.63
Source: DoECLG, 2012
Table 4 does not include the Carlow Town Development Plan (forming part of the Carlow Joint Spatial
Strategy), which included a further 9.3ha of zoned lands. The total quantum of serviced zoned land is
287.63ha. Applying an average density of 25 units per hectare, there is a capacity for c.7191 units and
applying an occupancy rate of 2.8 persons per unit there is sufficient zoned and serviced land to
accommodate 20,135. It should be noted that not all zoned and serviced land will necessarily be brought
onto the housing market.
To comply with the Development Plan policies, the Authorities will continue to identify underutilised and
brownfield sites in their jurisdictional areas which are suitable for residential development.
It is also recognised that there is an overall limit to the capacity of lands and the authorities will ensure that
the available infrastructure and resources are used efficiently to optimise the integration of residential use
with transport facilities and other land uses.
15County Carlow Housing Strategy
2.4 Social and Affordable Housing Supply in County Carlow
2.4.1 General
Social housing within the Carlow Town Council and Carlow County Council areas is provided by the
housing authorities and a number of voluntary associations. Voluntary housing associations have played an
essential role over the last few years where affordability has been threatened, where public finances were
constrained and many were left out of the traditional housing market. Some associations cater specifically
for special needs groups. These associations include Carlow Voluntary Housing Association (Tinteán), the
Sue Ryder Foundation, the Cheshire Home Foundation and the Irish Wheelchair Association.
The provision of housing units was split between private and social/affordable as outlined in Table 5.
Table 5: Provision of Private and Social/Affordable housing 2008-2013
2008 2009 2010 2011 2012 2013 Total
Private 542 411 212 176 108 125 1,574
Total Social & 93 12 18 40 8 0 171
Affordable
Total 635 423 230 216 116 125 1,745
Source: DECLG, 2013
Overall, there was a limited supply of social housing units over the 2008-2013 period. This was inevitably
due to the severe economic downturn, Part V social and affordable housing provision would have declined
in proportion to the reduction in private housing in estates and because one-off housing is exempt from Part
V.
2.4.1 Part V Provision
The 2011 Housing Policy Statement indicates that if a household is capable, through its own available
resources, of renting a high quality home in a vibrant community, but lacks the resources to purchase an
equivalent home, then it does not need the assistance of the State (or local authorities). The Statement
effectively suspended all affordable housing schemes. The current status of affordable dwellings for Carlow
Town and County as per October 2013 is detailed in Table 6
Table 6: Status of Affordable Housing
Scheme Sold Leased On Hand
1999 Scheme 33 4 0
Part V County Council 24 17 0
Part V Town Council 14 14 0
Total 71 35 0
Source: Carlow Local Authorities, October 2013
All affordable housing has been lent or sold by the Councils. With the effective suspension of all schemes,
there are currently no legal obligations to cater for affordable housing.
16County Carlow Housing Strategy
This Strategy must take into account the provision made for affordable housing under the previous Extant
Part V agreements including 4 affordable dwellings at Palatine. It is currently unclear whether those will
ever be delivered. If completed, they will likely become social housing.
Between 2009 and 2013, the following Part V social and affordable housing was provided
Table 7: Part V Provision of Social and Affordable Housing 2009-2013
Social Affordable Voluntary Total
Ballinabranna 6 3 0 9
Rathvilly 4 4 0 8
Leighlinbridge 8 3 0 11
Tullow 10 2 6 18
Ballon 4 0 0 4
Carlow 1 1 4 6
Totals 33 13 10 56
Source: Carlow Housing Authorities
2.4.2 Social Housing Stock and Provision
Table 8 details the units that have been provided or are planned.
Table 8: Social Housing Provided or Funded in County Carlow
No. of
Location Need Status
Units
LA Capital Funding
Rural Closutton 1 Closutton General Completed (Q4 2013)
Rural Borris 1 Borris General Under construction (Q2 2014)
House purchase 2 Rathvilly & Borris General Contracts signed (Q4 2013)
Rental Accommodation Scheme
New tenancies 2013 81 General
Leasing
New tenancies 2013 1 General
Voluntary Leasing
Respond 53 Oakley Wood, Tullow Occupied Q2/Q3 2013
Under
Oakley Housing 10 Mill Race, Carlow Q1 2014
negotiation
At planning
Cluid 31 Sleaty St, Carlow 2015
stage
Total 243 units
Source: Carlow Housing Authorities
The combined social housing stock is composed of 1,533 units, with 880 located in the County and 653 in
Carlow Town. Outside the Town, the largest shares of social housing stock are located in Tullow and
Bagenalstown. The affordable stock is made up of 16 units in the County and 14 in Carlow Town. These
affordable dwellings are let as social tenancies on a five-year lease basis with a voluntary housing provider.
17County Carlow Housing Strategy
The social housing stock is more spatially spread, whereas the affordable stock is concentrated around 6
main settlements: Tullow, Carlow, Ballinabrannagh, Leighlinbridge, Rathvilly and Ballon.
There is demand for social housing in smaller settlements based on the preferences expressed in the
Council’s housing list. At present applicants must re-locate to alternative locations due to the lack of
appropriate choice. This phenomenon can impact negatively on local communities. This issue arises in
places such as Tinnahinch, Rathoe and Bilboa.
2.4.3 Multi-Annual Building Programme
Constraints on public finances have placed a significant restriction onto the Multi-Annual Building
Programme. One construction project is currently underway for 6 units located at Bagenalstown. The
County Council recently applied for funding to build 10 units in Borris, 5 in Maryborough Street Carlow, and
a further 7 units in Bagenalstown.
2.4.4 Social Housing List
The waiting list in Carlow County Council currently has 1,161 applicants for social housing, including 902 on
the County Council list and 359 in the Town Council List, of those on the list, there are approximately 75%
are in receipt of rent supplement.
There are predominantly two accommodation types favoured on the housing list: 2-bedroom and 3
bedrooms. The social housing demand is detailed in Table 9.
Table 9: Social Housing Demand by Unit Size
2 bed 2 bed s/a 3 bed 3 bed s/a 4 bed housing Total
units
No. units 761 11 413 4 18 6 1,213
Share % 62.74 0.91 34.05 0.33 1.48 0.49 100
2.4.5 Special Housing Needs
Some voluntary housing associations cater for specific needs of the population, such as housing for the
disabled or the elderly. Table 10 sets out the units under construction or about to start at the time of writing
the Strategy
Table 10: Capital Assistance Scheme (Special Needs)
Housing No. of Location Need Status
Association Units
Leighlinbridge 15 Leighlinbridge Elderly Under Construction
Housing (Q2 2014)
Association
Tintean 6 Blackbog Road, Carlow Special Need
Respond 8 Crosslow, Tulllow Special Need
Tintean 1 Tullow Road, Carlow Special Need
Tintean 5 Ballincarrig, Carlow Special Need Contracts for signing
(Q4 2014)
18County Carlow Housing Strategy
2.4.6 Rental Accommodation Scheme (RAS) and HSE Rent Supplement
Rental Accommodation Scheme is a relatively new initiative set up by the Government in 2009. One of its
main features is that the local authorities can source housing through both the private and voluntary sectors
for those who have a long-term housing need. County Carlow currently has 461 tenancies. The
implementation of the RAS scheme was significantly higher than other neighbouring counties. Most of the
units registered in the scheme are located in and around Carlow Town.
Rent supplement is a short-term financial support to assist with reasonable housing costs for eligible people
living in privately rented accommodation, but who have difficulties affording their own accommodation. It is
increasingly used as a long-term social housing support over the last number of years.
2.4.7 Casual Vacancies
Casual vacancies are the residences returned to the Council for re-letting. There is a small number of these
units in the County. In December 2013, it totalled 14 units, which were awaiting pre-let repairs. Casual
vacancies are a regular occurrence in the county and the town.
2.5 Concluding Findings
The following are the key conclusions:
There is significant capacity for accommodating additional population in zoned and serviced land
in Carlow Town.
The main growth centres in County Carlow are the Carlow Graiguecullen Urban Area, Tullow,
Bagenalstown and Borris.
Based on the number of vacant housing units and quantum of unfinished housing estates, there
will be greater than proportionate allocation of the population target and housing land requirement
to Bagenalstown and lower population target and housing land requirement to Tullow for the period
2015-2021,
Most residential planning permissions granted in 2013 were for one-off housing. It must be strictly
controlled and monitored.
The vacancy rate in Carlow is higher than that of Leinster but lower than the national rate.
There are 3,171 units in 53 unfinished estates including units not constructed or where planning
permission has elapsed. Of those, 1,374 units are completed and occupied. 380 of the units are
completed and vacant or almost completed.
There are 287.63 hectares of undeveloped and serviced lands available for residential
development, or the equivalent of c. 7,191 units when applying a 25 units / hectares density.
1,043 applicants are currently on the waiting list for social housing.
19County Carlow Housing Strategy
3 ANALYSIS OF HOUSING DEMAND
This section details the demographic assumptions with respect to future population, households and
building projections.
3.1 Housing Market Areas
With both the government and the local authorities’ policy on the restriction of one-off housing and the
prevention of ribbon development it is evident that future housing should be predominantly located in the
county’s urban settlements
Based on the policy review carried out in Section 1 and detailed in Appendix 1, County Carlow is composed
of a number of geographical housing markets. These are Carlow Town and Environs as the county town;
Bagenalstown and Tullow, as district towns; and rural parts of the County. Carlow Town is the predominant
market due to its strategic location in proximity of the motorway, the Greater Dublin Area, the Waterford
Gateway as well as its pivotal position in relation to the Midlands. During the boom period Carlow Town and
Tullow were both part of the Dublin commuter belt, being within 100km of the city.
3.2 Demographic Profile of County Carlow
According to the 2011 Census, the population living in County Carlow is 54,612. The County population
pyramid shows a high birth rate as well as a large bulge at household formation stage.
Figure 5: County Carlow – Age pyramid
Source: CSO, 2012
20County Carlow Housing Strategy
The Step-by-Step Guide requires the inclusion of a projection of population and households over the period
of the Strategy.
3.3 Review of Population Trends
At the last census carried out in April 2011, 54,612 people were recorded as being resident in County
Carlow, equivalent to 0.8% of the total national population and 9.1% of the South-East region’s population.
The population has grown by 8.5% between 2006 and 2011. Although, its share in the national and regional
population has diminished, it has experienced a rapid population expansion between 2006 and 2011, in
particular due to the number of housing completion in the County toward the end of the economic boom.
The population in County Carlow in the 2011 Census showed that the projections forecast in the SERPGs
significantly overestimated the population by 1,623 persons for 2011.
Table 11 sets out the population over the last three censuses.
Table 11: County Carlow Population, 2002, 2006 and 2011
2002 2006 2011 Change Change 06-11
02-11
Carlow Town & 18487 20724 23030 24.57 11.13%
Environs
Tullow 2417 3048 3948 63.34 29.53%
Bagenalstown 2728 2532 2950 8.14 16.51%
Carlow County 49014 50349 54312 11.42 8.47%
Source: CSO Census 2002, 2006 and 2011
The population of County Carlow is largely concentrated around the County Town. Tullow presents the
largest intercensal increase with its population increasing by almost a third between 2002 and 2011.
Despite a strong urban framework, rural Carlow contains 45.2% of the population. However, between 2006
and 2011 the population of urban areas in Carlow increased from 52.2% to 54.8%. A dispersed population
requires more infrastructure investment in terms of transport, water, public service delivery and energy, etc.
Bagenalstown and Tullow are described as District Towns in the SERPGs and present expansion
opportunities. These towns, although located in rural areas, have been provided with the necessary
infrastructure to cater for additional population. This Housing Strategy is aligned with the SERPGs which
require a balanced development and focused investment. The aim is to manage the growth of towns and
villages, in addition to sustaining rural communities.
3.4 Population Targets
3.4.1 Population Projections based on the SERPGs
The Planning and Development (Amendment) Act 2010 now requires planning authorities to adopt a core
strategy that is consistent with the RPG targets and settlement hierarchy. Hence, the population allocation
21County Carlow Housing Strategy
for County Carlow and Carlow Town for the period up to 2022 are set by the SERPGs . These are detailed
in Table 12.
Table12: Population Targets for Carlow
2010 2016 2022
County Carlow 56,155 59,451 63,536
County Carlow Remaining share 2010-16 n/a 1,654
Carlow Town 22,126 23,768 25,000
Carlow Town Remaining share 2010-16 n/a 1,642
Source: SERPGs 2010-2022
3.4.2 Rebasing with Census 2011
In light of the evidence offered by the latest population census undertaken in 2011, it is clear that the RPGs
had overestimated population growth for the region up to 2010 which resulted in overestimation for both
County Carlow and Carlow Town. The SERPGs assumed a 26% growth in population between 2006 and
2022..
In order to adhere to the principle of alignment between the Housing Strategy, Core Strategy and the
SERPGs, the Strategy maintains the year 2022 as the target date, but uses the 2011 census as the
baseline from which to establish population targets over the period from 2015 to 2021. Results of Census
2011 have given a population of 54,612 which differs from the RPGs by 1,543.
Table 13 sets out the recalibrated population targets
Table 13: Population Targets for Carlow Housing Strategy 2015-2021
2011 Census 2015 2021 RPG 2022
54,612 57,702 62,668 63,536
Source: Census, SERPG 2010-2022 and MDB calculations
3.4.3 Household Size and Growth
According to the Census, there were 19,436 households in Carlow in 2011. This yields an average
household size of 2.8. In preparing the Joint Spatial Plan for the Greater Carlow Graiguecullen Urban Area,
the Carlow authorities decided to use the average household size defined by the Midlands Regional
Authority of 2.4,. However, having regard to both the SERPGS and the results of the 2011 Census which
shows an average household size at 2.8, it was decided that the present Strategy would use this 2.8
average household size.
Using the 2.8 average household size, there is a requirement to house an additional population of 4966 in
1773 households at an average rate of 295 per annum
22County Carlow Housing Strategy
3.5 Household by Size
The following table provides a summary of each household in the county, Carlow Town and Environs and
Carlow Town based on the data collected by the CSO in 2011. There are a greater number of 1 and 2-
person households in the town than in the county. However, it is important to note that the town & environs
area presents the largest share of 3 persons households. 4-person or more households are more likely to
live in the county.
Table 14: Carlow Household Size in 2011
Carlow County Carlow Town & Environs Carlow Town
Size of
Households % Total Households % Total Households % Total
family
1 person 4,341 22.3% 2,051 23.9% 1,047 26.8%
2 persons 5,412 27.8% 2,572 30.0% 1,593 30.4%
3 persons 3,621 18.6% 1,689 19.7% 992 18.9%
4 persons 3,401 17.5% 1,357 15.8% 750 14.3%
5 persons 1,759 9.0% 608 7.0% 321 6.1%
6 persons 6,55 3.3% 208 2.4% 124 2.3%
7 persons 176 0.9% 59 0.6% 36 0.6%
8 or more 71 0.3% 28 0.3% 16 0.3%
persons
Total 19,436 100% 8,572 100% 5,239 100%
Source: CSO
The varying distribution of households between the county and the town should be reflected in the types of
unit provided on the housing market. In the Strategy period.
3.6 National Economic Growth
The Medium Term Review 2013-2020 (July 2013) prepared by the ESRI sets out three scenarios for the
Irish economy:
The recovery scenario, presenting a reasonable rate of growth and an effective management of
the issues relating to the financial sector. This scenario accounts for an increase of employment,
and rising real personal incomes. This scenario also implies a growth in the requirement for
dwellings to be constructed in the same period.
23County Carlow Housing Strategy
The delayed adjustment presents a scenario where the EU recovers but domestic policy fails to
clear the ongoing problems encountered by the financial sector. Under such a scenario, fiscal
policy will remain strict until 2015 or 2016, which implies a high unemployment rate.
Stagnation scenario envisages a bleaker outcome for the EU economy, which fails to return to
growth in the near future. Unemployment rate would remain similar to current levels all the way to
2020.
Growth scenarios are summarized in the table below.
Table 15: ESRI Growth Scenarios
2013 2014 2015 2016 2017 2018 15-20
Recovery Scenario
GDP % 1.7 3.0 4.0 4.1 4.2 3.7 4.0
GNP % 1.2 0.5 4.3 3.6 4.0 3.4 3.6
Unemployment 14.0 13.4 11.8 10.6 9.5 8.2 5.6
rate %
Delayed Adjustment Scenario
GDP % 1.8 1.9 2.7 1.9 2.7 3.0 3.3
GNP % 1.3 -0.9 3.0 1.1 2.8 3.1 3.2
Unemployment 13.9 13.8 12.9 13.5 13.1 11.9 8.4
rate %
Stagnation Scenario
GDP % 1.7 3.5 1.3 1.1 2.0 0.8 1.4
GNP % 1.2 0.0 1.9 0.6 2.1 0.4 1.1
Unemployment 14.1 13.1 12.5 13.4 12.8 12.5 11.8
Rate %
Source: ERSI Medium Term Review 2013-2020
European and national institutions have forecast that unemployment is set to decrease all the way to 2020.
It is also generally understood that GDP or GNP forecasts are a useful tool for measuring disposable
income. In all scenarios presented by the medium Term Review, GDP and GNP is forecast as growing,
although at varying rate depending on the scenario.
3.7 Economic and Demographic Growth in Carlow
There are local factors which will impact upon economic growth and development in Carlow over the period
of the Strategy. These may not be within control of the County Council and the Town Council and may be
either of regional or national origin. These may include:
Continued increase in rental prices in Dublin
Further foreign direct investment
Potential for further job losses in County Carlow
24You can also read